A Multiplex Flow Cytometric Approach to Define Molecularly Distinct Extracellular Vesicle Subsets

A Multiplex Flow Cytometric Approach to Define Molecularly Distinct Extracellular Vesicle Subsets
Pragati Lodha
1,2,3
Sarah Hofmann
1,2
Shruthi Hemanna
1,2
Emma Reynaud
1,2,3
Alperen Acari
1,2,3
Stefanie Uhlig
4,5
Karen Bieback
2,4,5
Lothar C. Dieterich
1,2,*

Received: 04 November 2025 Revised: 15 December 2025 Accepted: 23 December 2025 Published: 26 December 2025

© 2025 The authors. This is an open access article under the Creative Commons Attribution 4.0 International License (https://creativecommons.org/licenses/by/4.0/).
1. Introduction
Extracellular vesicles (EVs) are cell-derived membranous structures released into the extracellular space that possess well-defined lipid bilayer membranes and contain cargoes of nucleic acids, proteins, and lipids derived from their donor cell [1]. EVs are released by almost every cell type and can be found in various body fluids, including blood, milk, lymph, urine, cerebrospinal fluid, and others. They constitute a heterogeneous group of particles characterized by their origin, size, and distribution of protein markers.
Traditionally, EV subclassification efforts have focused on the origin and biogenesis pathways. In this regard, two primary subsets of EVs are exosomes and ectosomes [2]. Exosomes originate from multivesicular bodies (MVBs) containing intraluminal vesicles (ILVs) and are typically in the range of 50–150 nm in size. Ectosomes, in contrast, directly bud from the cell’s plasma membrane, typically range from 50 nm to a few micrometers, and are further subdivided into microvesicles, apoptotic bodies, and oncosomes. Since it is often experimentally challenging to determine the membrane of origin for different EV populations, another way to classify EVs is based on their size. For example, small EVs (sEVs) have a diameter of up to 200 nm, whereas large EVs (lEVs) have been defined as all EVs above 200 nm. However, neither classification of EVs by size nor by origin accurately reflects their heterogeneity in terms of molecular composition. In addition, other non-membranous particles like exomeres (measuring less than 50 nm, with a peak size at 35 nm) [3] and supermeres have been identified recently [3,4], illustrating the considerable diversity within the subcellular particle landscape. Evidently, diversity in size, biogenesis, and molecular composition makes the study of EV subsets and particles highly complex and technically challenging.
Identifying EV subsets is more than a technical hurdle—it is a biological necessity. Distinct EV populations likely carry different combinations of proteins, nucleic acids, and lipids, which conceivably affect biodistribution and function [4]. In pathological conditions such as cancer, cancer cell-derived EVs have been linked to immune suppression, promotion of angiogenesis and lymphangiogenesis [5,6], and the creation of pre-metastatic niches [7]. Without accurately defining which EV subpopulation(s) are responsible for these effects, our understanding of disease mechanisms and our ability to use EVs as diagnostic markers or therapeutic targets remain limited.
Various techniques have been published to study EV heterogeneity at the single-EV level, including nanoparticle tracking analysis (NTA), fluorescence microscopy, super-resolution microscopy (SRM), and nano-flow cytometry [8]. While these methods have provided valuable insights, they are often limited in their ability to simultaneously assess multiple markers to define molecularly distinct EV subsets comprehensively.
To address this limitation, we optimized a workflow to employ spectral flow cytometry to characterize EV subsets based on the presence or absence of specific molecular markers. This approach offers the flexibility to combine multiple EV surface markers in a single experiment and to unmix signals based on the distinct emission spectra of different fluorophores. In combination with unsupervised analysis, this method is suitable to identify EV subtypes based on surface markers in an unbiased manner.
2. Materials and Methods
2.1. Cell Culture
The murine melanoma cell line B16-F10 (ATCC) and B16-F10 cells expressing palmitoylated GFP [6] were maintained in DMEM (Thermo Fisher Scientific, Waltham, MA, USA) supplemented with 10% fetal bovine serum (FBS, PAN-Biotech, Aidenbach, Germany). The non-tumorigenic melanocyte cell line Melan-A (kindly provided by Prof. Jonathan Sleeman, Medical Faculty Mannheim, Heidelberg University) was cultured in RPMI-1640 medium (Thermo Fisher Scientific) containing 10% FBS and 200 nM phorbol 12-myristate 13-acetate (PMA, Merck KGaA, Darmstadt, Germany) to support their proliferation. Yumm1.7 [9] (kindly provided by Prof. Jonathan Sleeman, Medical Faculty Mannheim, Heidelberg University) and Yummer1.7 cells [10] (kindly provided by Prof. Cornelia Halin, Swiss Federal Institute of Technology (ETH) Zurich) were cultured using DMEM/F12 medium (Thermo Fisher Scientific) supplemented with 10% FBS and 1% non-essential amino acids (Thermo Fisher Scientific). 1 × 10⁷ cells per 15 cm dish were seeded for all cell lines and maintained at 37 °C in a humidified incubator with 5% CO2. Prior to EV collection, cells were washed with PBS and cultured in medium supplemented with 1% EV-depleted FBS (Thermo Fisher Scientific) for 48 h. As a negative control, “dummy” samples (medium without cells) were processed in parallel under identical conditions to account for any EV/particle contamination originating from FBS, medium, or plasticware.
2.2. EV Isolation and Characterization
EVs were isolated from cell culture supernatants following a previously described protocol [11] using a combination of centrifugation and size-exclusion chromatography (SEC). Briefly, conditioned media were first centrifuged at 700× g for 10 min at 4 °C to remove cells and large debris. The cleared supernatant was then concentrated to a final volume of less than 500 µL using 100 kDa molecular weight cut-off centrifugal filters (Merck). Concentrated media were subsequently subjected to SEC using qEVoriginal/70 nm (Izon Science, Christchurch, New Zealand) according to the manufacturer’s instructions to isolate EV-containing fractions. Collected fractions were analyzed for EV concentration and size distribution using nanoparticle tracking analysis (NTA) with a ZetaView instrument (Particle Metrix, Ammersee, Germany). Scatter mode measurements were performed using standard instrument settings (sensitivity—80, shutter—100, frame rate—30 fps). For EVs labeled with MemGlow, fluorescence mode was used (sensitivity—90, shutter—100, frame rate—30 fps). The total protein concentration was determined by bicinchoninic acid (BCA) assay. EV samples were then stored as small aliquots in standard microcentrifuge tubes at −80 °C until further use.
2.3. Flow Cytometry
A Northern Lights flow cytometer (Cytek Biosciences, Fremont, CA, USA) equipped with a small particle detection module was used to detect EVs using the instrument’s Extended Sensitivity Performance (ESP) mode, with forward scatter (FSC) gain set to 190, side scatter gain (SSC) to 5000, and SSC-B gain to 130, enabling efficient EV detection. The SSC threshold was set to 1000. Instrument performance and sensitivity for nanometer-sized particle detection were first verified using Apogee Mix beads (#1527, Apogee Flow Systems, Hertfordshire, UK), which contain a mixture of silica and polystyrene beads ranging in diameter from 80 nm to 1300 nm. EVs were stained with MemGlow-640 (Cytoskeleton Inc., Denver, CO, USA) and fluorescently conjugated antibodies for 15 min using the optimized concentrations determined from the MemGlow and antibody titration experiments (see Section 3) and acquired at a low flow rate. All antibodies and their respective fluorophores chosen for our study are listed in Supplementary Table S1.
2.4. EV Immobilization and Labeling for Microscopy
EVs were immobilized and labeled as previously described [12]. Briefly, 30 µL of EVs with a concentration of 1 × 10⁹ particles/mL were spotted onto a microscope slide and incubated at RT in a humidified chamber for 30 min. Then, EVs were fixed with 4% PFA for 15 min at RT and washed three times with 1× PBS. MemGlow-640 (1:200 in PBS) was added and incubated for 2 h at RT. After washing three times in 1× PBS, a glass cover slide was mounted using Vectashield (Vector Laboratories, Newark, NJ, USA). Slides were imaged using an Axio Imager Z1 (Zeiss, Oberkochen, Germany), and images of MemGlow-stained EVs and unstained controls were equally processed for threshold and intensity adjustment using ImageJ (Version 2.16).
2.5. Data Analysis
Flow cytometry data were analyzed using FlowJo (version 10). Unsupervised clustering of flow cytometry data, including UMAP and heatmap generation, was performed in RStudio (version 2024.04.1+748). Graphs were generated with GraphPad Prism (version 10.6.0). Unless otherwise specified, comparisons among more than two groups were assessed using one-way ANOVA test.
3. Results
3.1. Nanometer Sized Particles Can Be Detected by Flow Cytometry
To assess the distribution of surface protein markers on individual EVs, we aimed to establish a flow cytometry-based approach using a spectral flow cytometer equipped with a small-particle detection module. To first evaluate the capability of the instrument to detect very small particles, ApogeeMix beads were analyzed. Using the instrument settings described here (see Section 2.3), we successfully resolved different bead populations, confirming the instrument’s ability to detect particles within the sEV size range (80–150 nm) (Supplementary Figure S1A). As the refractive index of polystyrene beads differs significantly from that of natural EVs, we next isolated EVs from B16-F10-conditioned medium (CM) using SEC. NTA and BCA confirmed that EVs were enriched in the early SEC fractions, while later fractions were predominantly composed of free proteins, indicating effective separation (Supplementary Figure S1B). For subsequent experiments, EV-rich fractions obtained by SEC were pooled.
We then sought out a fluorogenic probe to specifically label EVs independently of their surface marker expression. MemGlow fluorogenic probes specifically label plasma membranes and form self-quenching aggregates in aqueous solution, thereby reducing false-positive events until they integrate into the lipid bilayer [13], a common problem with other lipophilic membrane dyes. Indeed, using this dye, we successfully labeled EVs derived from B16-F10 cells, which could be detected by both NTA and microscopy (Supplementary Figure S1C,D). Importantly, MemGlow+ events could be detected as well by flow cytometry, whereas free MemGlow at 10 nM concentration in PBS, as well as unlabeled B16-F10 EVs, resulted in negligible background (Figure 1A). To optimize EV membrane labeling, we performed a dye titration. Calculating a signal-to-noise ratio based on the number of MemGlow+ events detected in EV samples vs. PBS, we concluded that a concentration of 10 nM MemGlow was best suited for our purpose (Figure 1B). At higher concentrations, however, MemGlow exhibits a concentration-dependent increase in background fluorescence in solution, likely arising from partially de-quenched dye aggregates, resulting in a reduced signal-to-noise ratio.
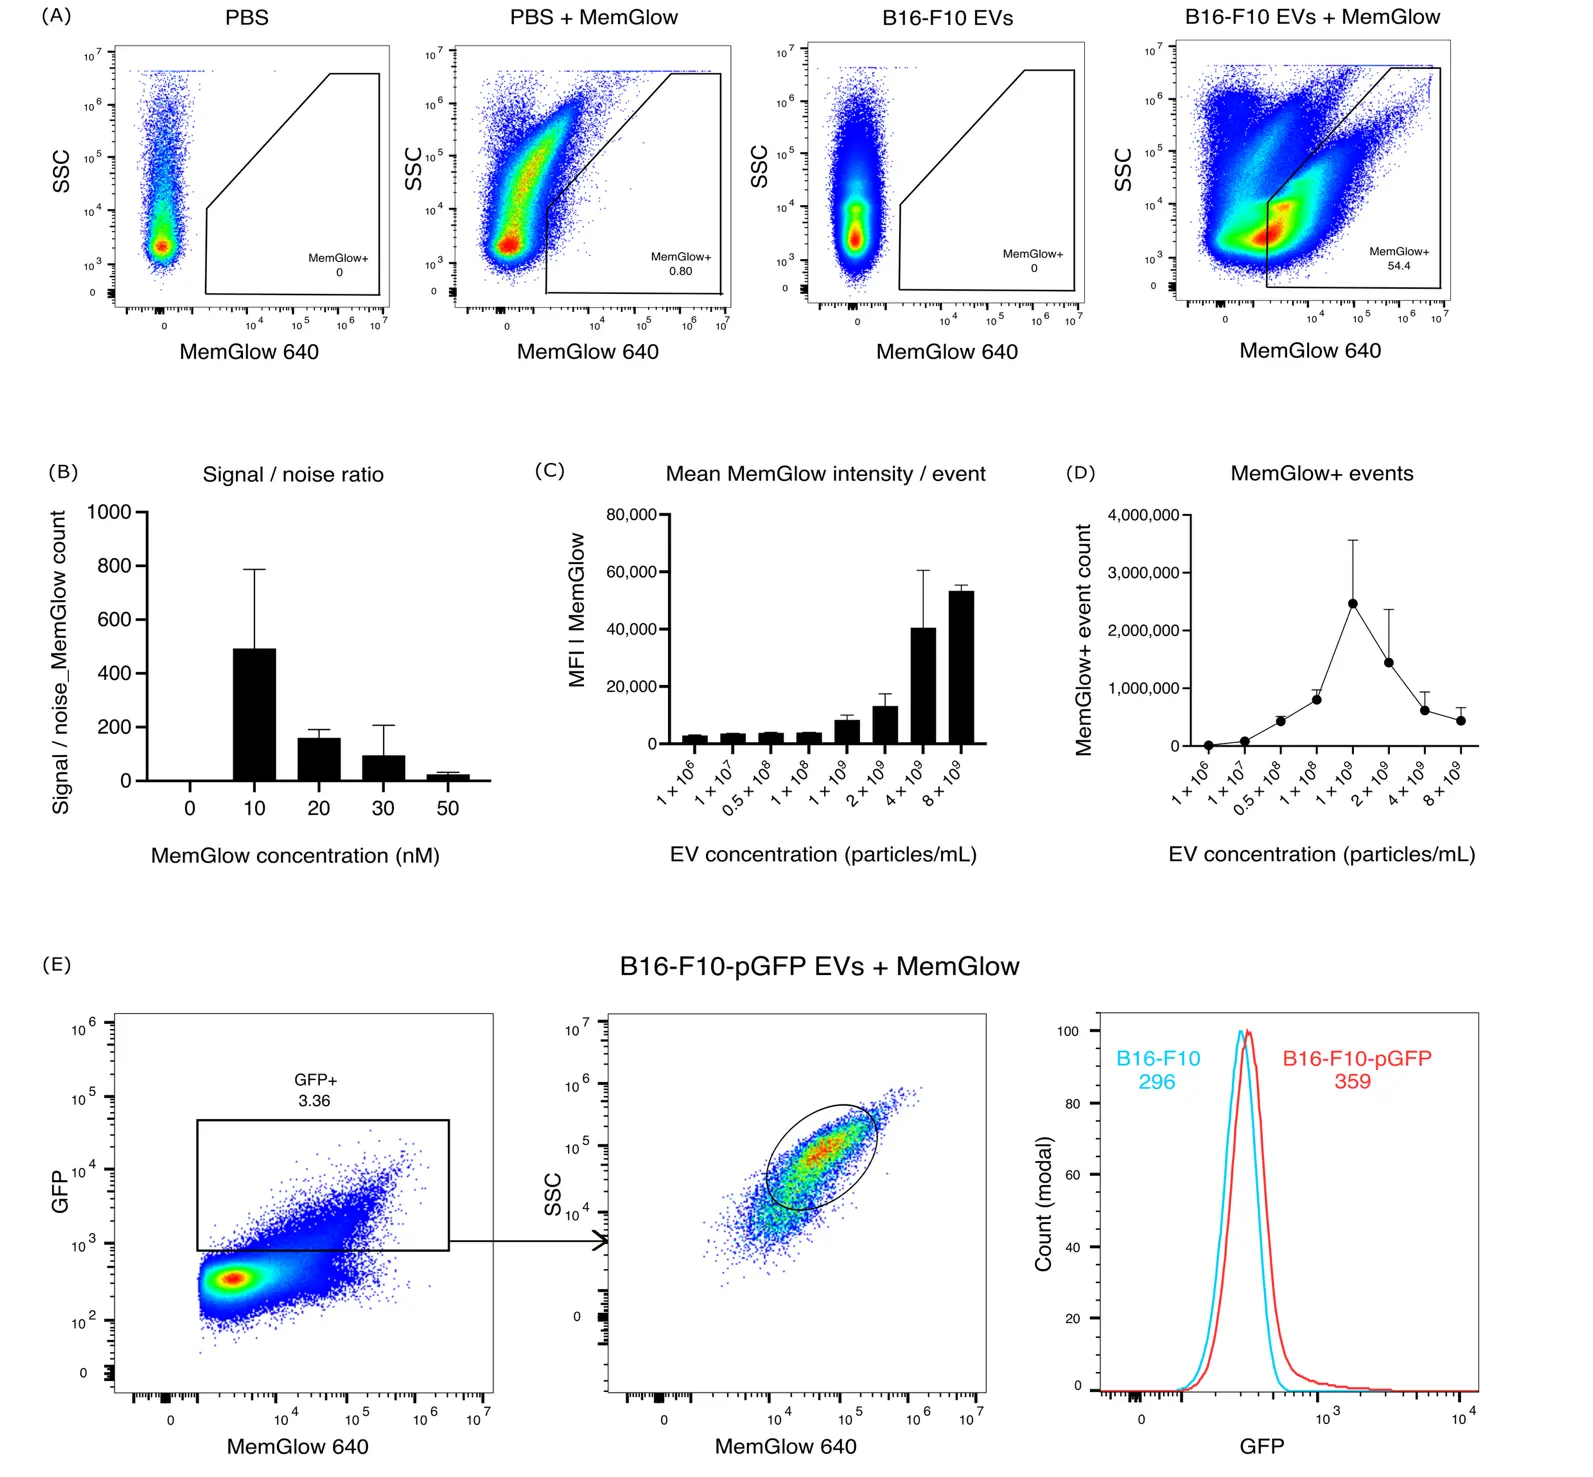
Figure 1. Detection of B16-F10-derived EVs using MemGlow. (A) Representative flow cytometry plots of PBS, PBS + MemGlow, B16-F10 EVs, and B16-F10 EVs + MemGlow. (B) Titration of MemGlow to label B16-F10 EVs (0.5 × 10⁸ particles/mL) compared to MemGlow in PBS. (C,D) Swarming analysis showing the mean fluorescence intensity (MFI) (C) and the number of MemGlow+ events (D) across increasing EV concentrations. (E) Representative flow cytometry plots and histogram of GFP staining of B16-F10 (blue line) and B16-F10-pGFP EVs (red line) with MemGlow labeling. Numbers in the histogram plot indicate MFI values.
Next, we titrated the EV concentration to determine the optimal particle density for flow cytometric detection and to avoid EV “swarming”. At low (1 × 10⁶ particles/mL) to moderate (1 × 10⁹ particles/mL) concentrations, the mean fluorescence intensity (MFI) of MemGlow+ events remained relatively stable, while the rate of detected events gradually increased, probably reflecting detection of single EVs (Figure 1C,D). However, at concentrations beyond ~1 × 10⁹ particles/mL, the rate of MemGlow+ events dropped, and the MemGlow mean intensity/event increased (Figure 1C,D), indicating that multiple EVs might have been detected as aggregates or “swarms” rather than as single events. These observations define an upper concentration limit for accurate EV quantification under our acquisition conditions and highlight the importance of controlling particle density to avoid artifacts. For the remainder of this study, we therefore used EVs at a concentration of 0.5 × 10⁸ particles/mL, well below the “swarming” threshold.
Finally, due to its lipophilic nature, MemGlow will not only label EVs, but also membrane-containing fragments and other lipophilic debris present in our samples. In line with this, we detect multiple MemGlow+ populations, differing by sideward scatter (SSC) and MemGlow positivity (Figure 1A). To determine which of those populations predominantly corresponds to bona fide EVs, we utilized B16-F10 cells expressing palmitoylated, membrane-tethered GFP (pGFP), an endogenous marker incorporated into EVs [14]. Gating for MemGlow+ GFP+ events, we were able to narrow down most of the GFP expression to a subpopulation of MemGlow+ SSCbright events (Figure 1E). In contrast, MemGlow+ SSClo events were GFP-negative, suggesting that they might not represent bona fide EVs. EVs were gated accordingly in all subsequent analyses performed in this study.
3.2. Combined Detection of Antibody- and MemGlow-Staining at the Single EV Level
After determining the optimal MemGlow concentration for EV labeling and the appropriate EV input, we next assessed whether we could also detect EVs labeled with individual antibodies conjugated to a range of fluorophores. To establish the optimal antibody concentration, we selected a panel of antibodies (N = 5) directed against known and suspected surface markers of B16-F10-derived EVs, including common EV markers (CD9, CD63, CD81) but also other surface proteins previously identified in B16-F10 EVs by proteomics [3,6]. We conjugated to a range of commonly used fluorophores. Then, we performed individual antibody titrations and recorded the mean staining intensity of EVs (gating shown in Figure 2A) relative to MemGlow background events. As expected, increasing antibody concentrations resulted in increased mean staining intensities in both background events and EVs, since we could not remove unbound antibodies by washing (Supplementary Figure S2A). We then used those data to calculate signal-to-noise ratio curves for each of the antibodies (Supplementary Figure S2B). Interestingly, very low antibody concentrations were sufficient to obtain optimal staining in some cases (CD9, podoplanin), whereas CD81 staining of EVs profited from higher antibody concentrations. This might be due to differences in antigen abundance and antibody affinity. Based on those data, we selected antibody concentrations for further stainings, aiming to minimize background staining and fluorescence spillover while maximizing the signal detected on bona fide EVs (Supplementary Table S1). Using these antibody concentrations, a clear signal above background was detected for all 5 antibodies (Figure 2B). We then examined the signal intensities of each fluorescently labelled antibody when stained in combination. As shown in Figure 2C, the signal intensity of each antibody was generally similar when stained individually or in combination, except for differences in staining intensity for CD81 and podoplanin. Nonetheless, these data indicate that EVs can be labeled simultaneously with at least 5, and potentially more, fluorophore-coupled antibodies using our workflow.
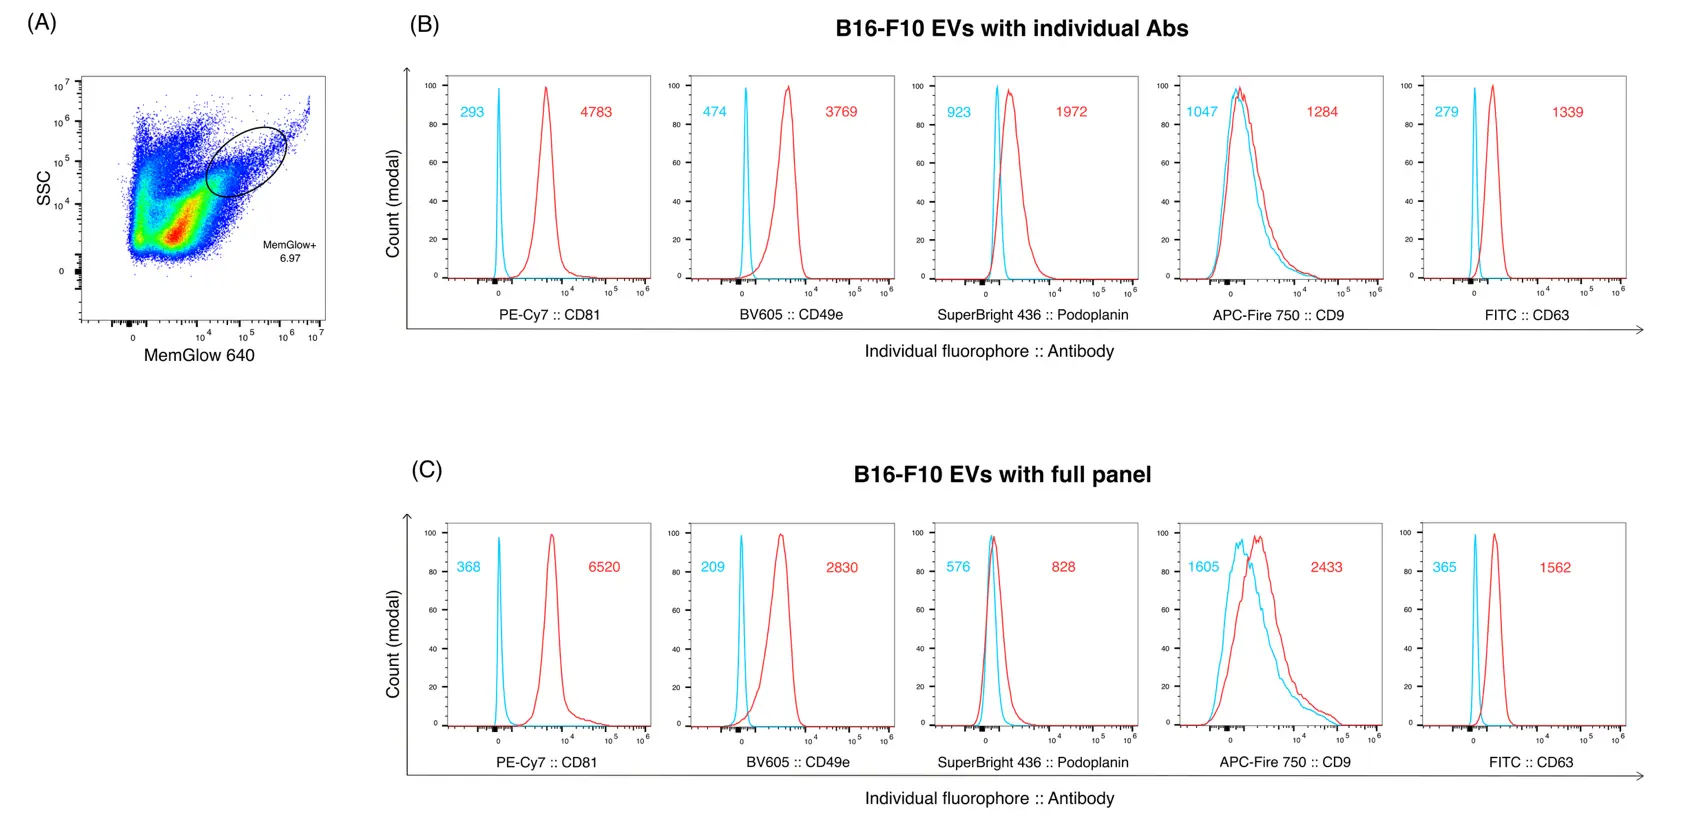
Figure 2. Antibody staining of B16F10-derived, MemGlow-labeled EVs. (A) Representative FACS plot of MemGlow-labeled B16-F10 EVs to illustrate final EV gating (based on Figure 1E). (B) Representative histogram plots of MemGlow+ B16-F10 EVs stained with individual antibodies as indicated. (C) Histogram plots of MemGlow+ B16-F10 EVs stained with the same antibodies in combination. Numbers in the histogram plots indicate MFI values. Red: stained EVs; Blue: unstained control EVs.
3.3. Unsupervised Clustering Analysis of EVs from Melanocytes and Melanoma Cells Using a 5-Plex Antibody Panel Indicates Distinct EV Subsets
To apply our workflow to the detection and identification of individual EV subsets, we next isolated EVs from a panel of melanoma cell lines (B16-F10, Yumm1.7, Yummer1.7) and from non-cancerous melanocytes (Melan-A). Medium controls (“dummy”) subjected to the same incubation and EV isolation steps were used to determine the particle background from FBS, culture surfaces, etc. After isolation, the concentration of each sample was measured using NTA (Figure 3A). In line with our previous results [15], B16-F10 cells released very high EV numbers, compared to the Yumm1.7, Yummer1.7, and Melan-A cell lines (Figure 3A). The background from “dummy” controls, although detectable, was much lower. For EVs derived from cell lines, particle concentrations were adjusted to 0.5 × 10⁸ particles/mL for flow cytometry. For dummy samples, a fixed input volume (120–150 µL) was analyzed instead, since the particle concentration was lower. Next, we stained “dummy” and each of the cell line-derived EVs with MemGlow in combination with the same 5-plex antibody panel as before. Flow cytometry data were acquired and analyzed using FlowJo, with particular attention to optimizing the compensation matrix. Initial gating based on SSC and MemGlow was followed by individual gating for each fluorescence channel to remove outlier events that would disturb subsequent analysis, and the resulting clean-gated populations were exported to R for unsupervised clustering. UMAP projection of flow cytometry data from 3 independent replicates for each cell line and dummy control revealed 5 distinct clusters (Figure 3B), characterized by distinct marker profiles and cell line composition (Figure 3C,D). The largest cluster of these, cluster 1, did not stain strongly for any of the markers in our 5-plex panel, suggesting that the surface presence of the corresponding antigens was too low on cluster 1 EVs.
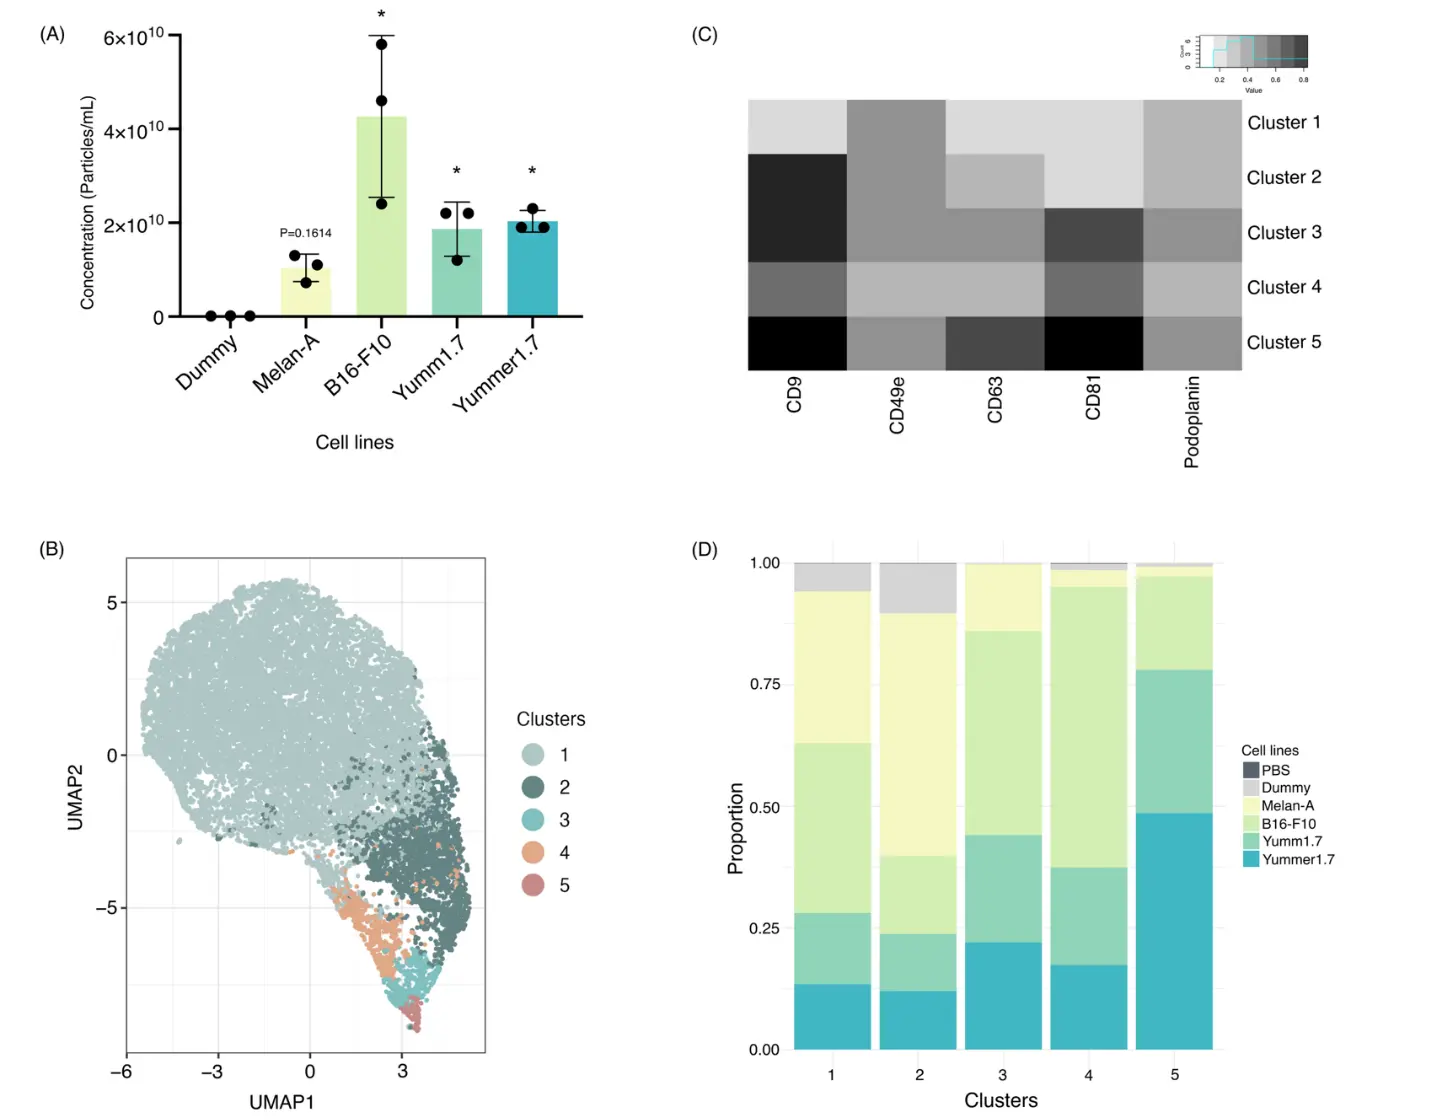
Figure 3. Clustering analysis of MemGlow-labeled EVs from different cell lines. (A) Total particle concentration of “dummy” background controls, Melan-A, and B16-F10, Yumm1.7, and Yummer1.7 EVs detected by NTA (left) (N = 3 biological replicates/condition). Statistical analyses was performed using one-way ANOVA with Benjamini-Hochberg post-test. * p < 0.05 compared to the control group (Dummy). (B) UMAP representation of “dummy” and cell line-derived EVs labeled with MemGlow and stained with the full antibody panel. Proportionally representative numbers of MemGlow+ EVs/sample were included (N = 3 biological replicates/condition). (C) Heatmap showing the expression levels of individual markers across the identified EV clusters. (D) Frequency of EVs from each of the cell lines contributing to the different clusters.
To better differentiate EV subsets that can be discriminated using our antibody panel, we next isolated all clusters except cluster 1 and re-clustered the EVs in an unsupervised manner. Doing so, we obtained six distinct new clusters (Figure 4A) that showed individual staining patterns (Figure 4B,C). Interestingly, these refined clusters were clearly associated with individual donor cell lines (Figure 4D,E). For example, clusters 2 and 3 were predominantly derived from Melan-A melanocytes, while showing some contamination by “dummy” EVs as well; clusters 1 and 5 were predominantly derived from B16-F10 cells; and clusters 4 and 6 were mostly derived from Yumm1.7 and Yummer1.7 cells.
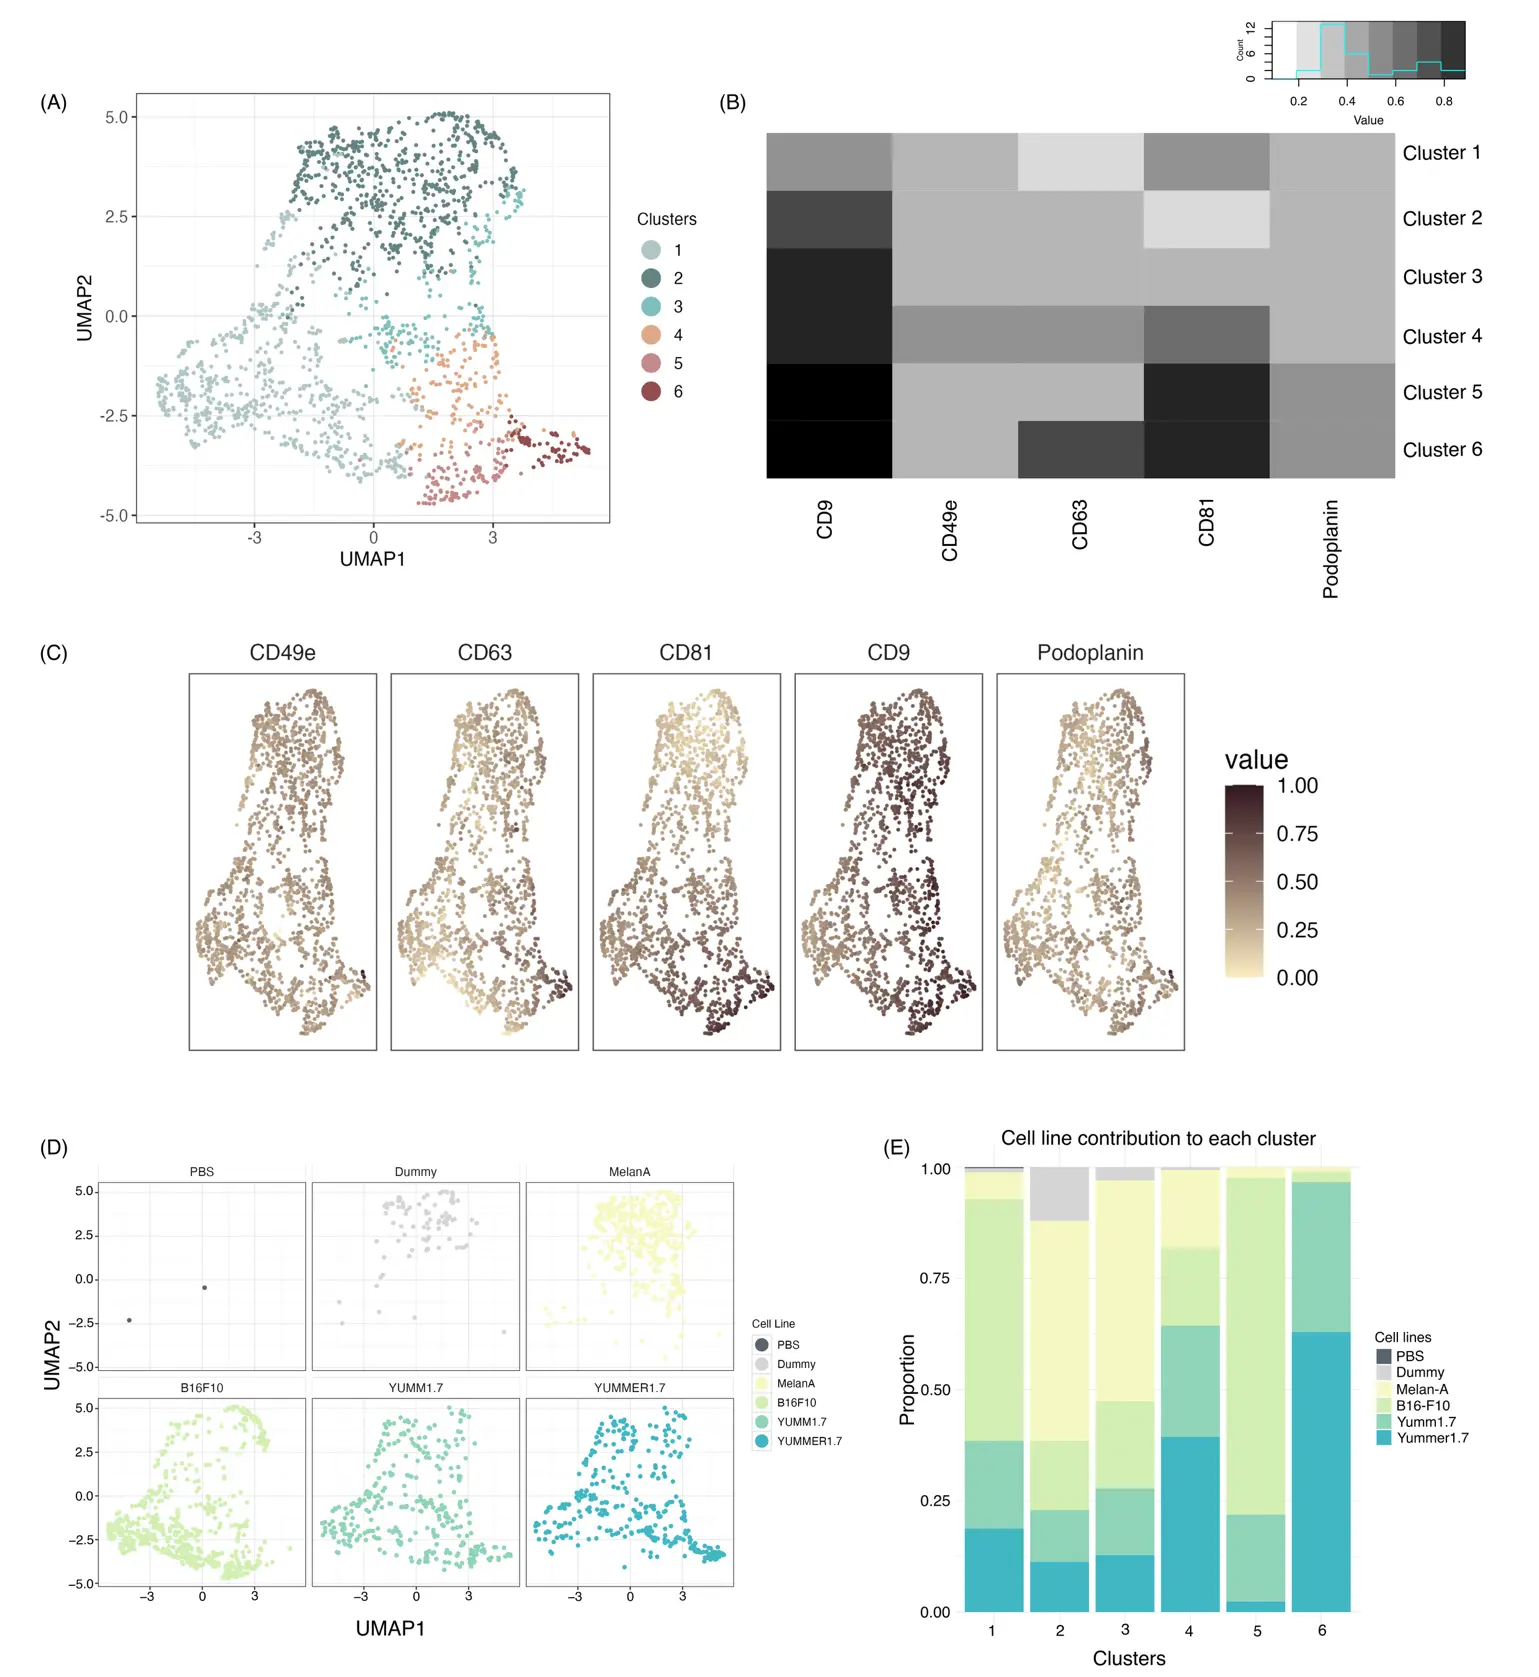
Figure 4. Re-clustering of melanoma- and Melan-A-derived EVs after removing clusters present in background controls. (A) UMAP representation of MemGlow-labeled EVs from melanoma and Melan-A cell lines after removing cluster 1. (B) Heatmap displaying the relative expression of individual markers across the re-clustered EV populations. (C) Projection of each marker onto the cluster map. (D) Projection of each sample onto the cluster map. (E) Composition of each cluster by the individual cell lines.
These data suggest that individual melanocyte and melanoma cell lines secrete distinct EV subtypes, which can be differentiated using a combination of tetraspanins, the integrin CD49e as well as podoplanin (Figure 5). In conclusion, our optimized workflow for single EV labeling and 5-plex surface marker staining yields new opportunities to dissect EV heterogeneity in culture media and potentially other biological fluids, enabling molecular definition and isolation of individual EV subsets.
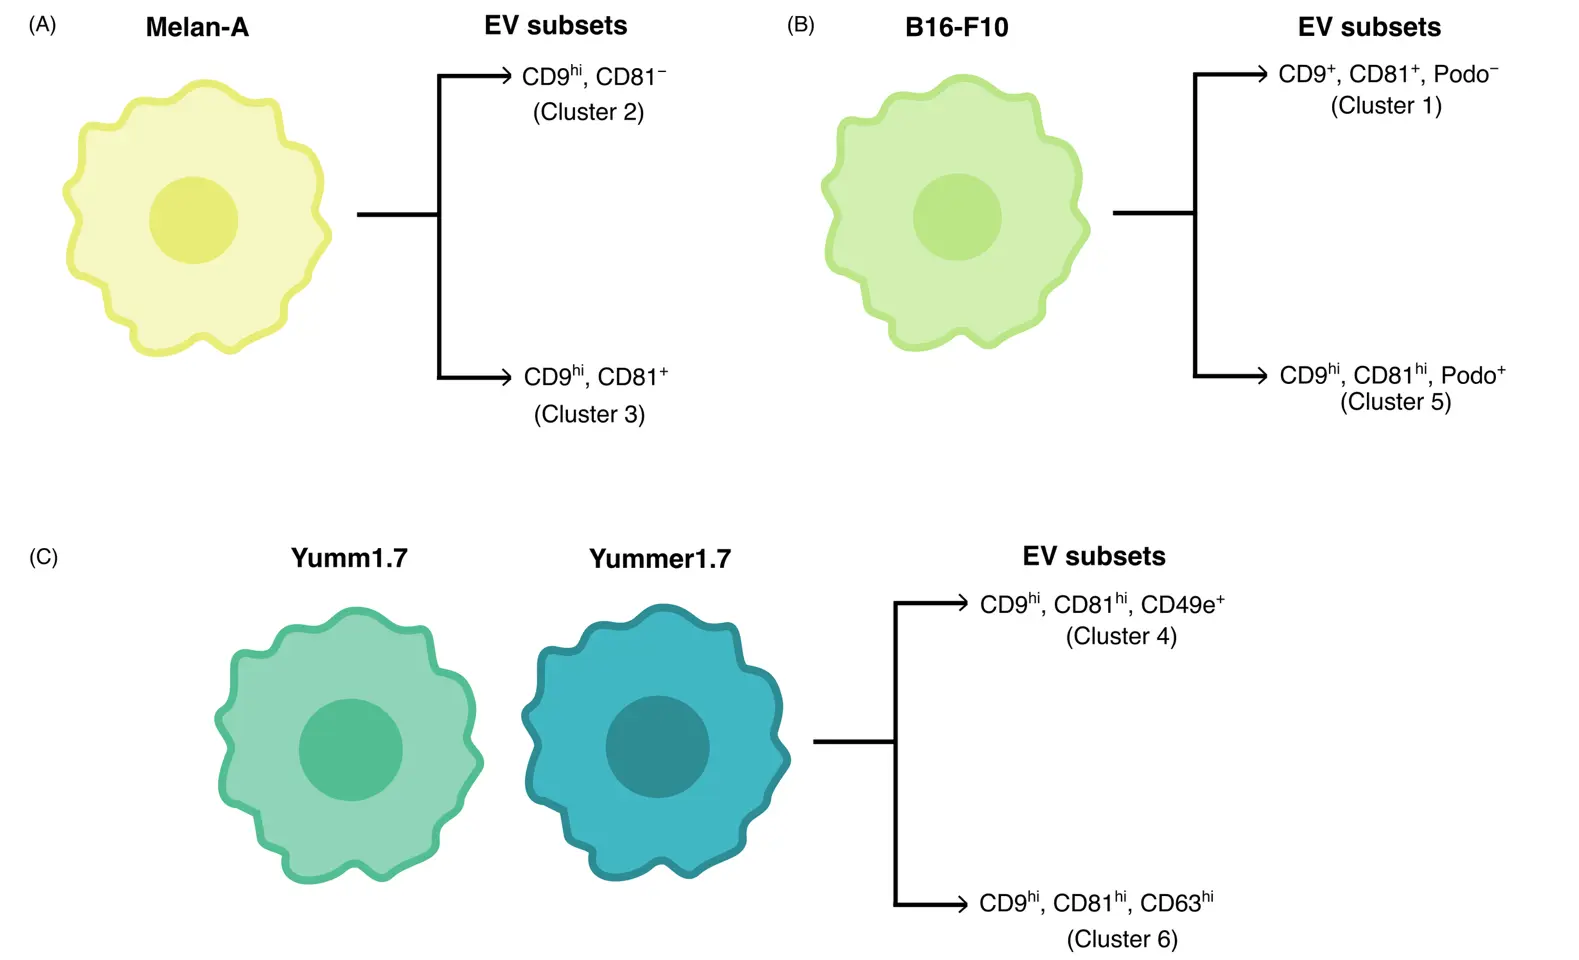
Figure 5. Schematic representation of EV subsets from melanocytes and melanoma cell lines. (A–C) 6 major EV subtypes could be identified using our 5-plex antibody panel, 2 of which were associated with each cell line. Yumm1.7 and Yummer1.7 cells released similar EV subtypes.
4. Discussion
In this study, we demonstrate that spectral flow cytometry can be a powerful tool for profiling EV heterogeneity at the single-EV level, using MemGlow in combination with appropriate gating and simultaneous staining of multiple surface markers. This method might be useful for understanding EV heterogeneity across different biological samples, although the sample preparation step and the choice of EV labelling dye should be reconsidered.
This approach addresses a key limitation of many existing methods, including NTA, fluorescence microscopy, SRM, and nano-flow cytometry, which often lack the flexibility to combine numerous markers in a single assay. On the other hand, flow cytometry-based approaches that absorb EVs onto larger beads lose single-particle resolution. The ability to analyze multiple parameters simultaneously provides a more comprehensive view of EV diversity, an essential basis for understanding their complex biological roles and distinguishing functionally distinct subsets.
One often raised concern is whether it is feasible to label single EVs with multiple antibodies, given that EVs are in the nanometer range, much smaller than cells. However, a simple calculation of the surface area of an EV with 100 nm diameter, in comparison to the “footprint” of an antibody’s antigen binding site, suggests that multiple antibody molecules can bind to EVs simultaneously, provided there are sufficient accessible binding sites. While single-EV flow cytometry has advanced to reliably quantify dual or triple marker combinations [16,17], true multiplexing of more than three fluorophore-conjugated antibodies on individual EVs remains scarcely reported. In this study, we overcome this limitation, demonstrating that a 5-marker combination can be stained simultaneously on single EVs in suspension, enabling high-dimensional UMAP-based phenotyping of EV subsets at the single-vesicle level.
The choice of some of these markers was based on proteomics data of small vs. large B16-F10-derived EVs separated by asymmetric flow field fractionation [3]. Thus, it was likely that at least some of these markers were distributed heterogeneously among B16-F10 EVs. We anticipated that even more complex antibody panels could be used to interrogate a wider range of EV markers. However, careful consideration should be given to the choice of fluorophores, their brightness, and emission overlaps. Minimizing spectral overlap greatly improves signal resolution. Another important consideration in large antibody panels is to avoid bulky fluorophores, as they may hinder efficient labeling.
Applying our workflow to identify molecularly distinct EVs derived from melanoma cells and non-malignant melanocytes, we rigorously compared them to “dummy” isolates from culture media alone. These samples thus represented FBS-, plastic, or dust-derived particles present in our samples. Of note, these background controls yielded EV levels that were generally much lower than those in cell line-conditioned media. The number of events detected in the cell line–derived EVs was at least 5-fold higher than in the “dummy” controls. Importantly, we subjected representative numbers of events for UMAP generation across all sample groups. This approach ensures faithful, proportional representation of particles from each cell line and the controls within the cluster maps.
Our data show that the largest population identified by UMAP (Cluster 1) was essentially negative for the markers included in the 5-plex antibody panel. This cluster may reflect EVs that do not express the chosen markers at all or at levels too low to be detectable using our approach. Expanding the marker panel could improve coverage, while further optimization of fluorophore selection and detector sensitivity could overcome limitations in visualizing low-abundance antigens on single EVs in suspension. Notwithstanding, our findings suggest that, in addition to the commonly used tetraspanins, other markers, such as podoplanin, may define specific subsets of EVs released by melanoma cells and melanocytes.
One potential limitation of our pipeline is that we only considered a subset of all MemGlow+ events based on sideward scatter (SSC) and MemGlow intensity for our phenotypic EV analysis, using a gating strategy instructed by EVs derived from pGFP-expressing B16-F10 cells. This gating strategy is based on the rationale that pGFP is stochastically incorporated into all EVs. While this approach is effective to enrich bona fide EV, it may have biased the selection of events for subsequent analyses toward specific EV subsets with comparably high SSC and MemGlow labeling. The incorporation of additional pan-EV labeling strategies will help to address this potential bias in future studies.
As of now, we have produced and analyzed EVs from three different melanoma cell lines and one non-malignant melanocyte line. In future studies, it will be very interesting to isolate and compare EVs from additional cell lines and more challenging samples such as body fluids. While our current workflow is optimized for EVs derived from cell culture media, its direct application to body fluids such as plasma or serum requires careful consideration. MemGlow is a lipophilic membrane dye and can react with non-vesicular lipid particles (e.g., lipoproteins, chylomicrons) that are abundant in certain biofluids, such as plasma, and overlap in size with EVs [18]. This limitation is probably less pronounced in cell culture–derived EV preparations, where lipoprotein contamination is usually low. Therefore, applying the present workflow to body fluids will require protocol adaptations, such as more stringent EV isolation and purification strategies, and lipoprotein marker staining to ensure accurate gating and data interpretation.
Overall, our method may be broadly applicable for dissecting EV heterogeneity and expanding the repertoire of potential EV markers. This approach may thereby help to refine the characterization of pathological, tumor-derived EVs, potentially leading to the discovery of EV-associated therapeutic targets. Future work will focus on validating these markers using complementary approaches to single-EV analysis.
In conclusion, with careful optimization and appropriate controls, flow cytometry can serve as a powerful and accessible tool for single EV characterization. Unlike highly specialized single-EV platforms, which may require dedicated instrumentation or complex workflows, spectral cytometers are a mainstay and allow rapid adaptation of multicolor antibody panels. The small particle detection module used here has been introduced and is widely available. This opens the possibility for broader adoption of high-dimensional EV phenotyping in both research and clinical settings.
Supplementary Materials
The following supporting information can be found at: https://www.sciepublish.com/article/pii/812, Figure S1: Characterization of B16-F10-derived EVs. (A) FACS plot of Apogee beads indicating the efficacy of the instrument in resolving beads of various sizes starting from 80 nm. (B) Representative nanoparticle tracking analysis (NTA) and bicinchoninic acid (BCA) assay demonstrating EV concentration distribution and protein content across different fractions isolated by SEC. (C) Representative NTA image of PBS vs. B16-F10 EVs labeled with MemGlow, showing particle detection in scatter mode (left) and fluorescence (MemGlow) signal (right). (D) Fluorescence microscopy of PBS with MemGlow as a negative control and B16-F10 EVs labeled with MemGlow; Figure S2: Optimization of antibody staining for B16-F10 EVs. (A) Raw signal intensities measured for individual antibody titration series in combination with MemGlow staining in B16-F10-derived EV samples, gated for MemGlow− events (black) and MemGlow+ EVs (blue). (B) Signal-to-noise ratios calculated as (MFI of MemGlow+ EVs/MFI of MemGlow− events) for each of the antibodies. Table S1: Antibody list. A table listing all the antibodies used for flow cytometry.
Statement of the Use of Generative AI and AI-Assisted Technologies in the Writing Process
During the preparation of this manuscript, the authors used ChatGPT (OpenAI) to assist with debugging and refining R code to improve the clarity, and legibility of the figures. The AI tool did not generate original data or interpretations. All results, analyses, and conclusions were developed and verified by the authors, who take full responsibility for the content of the published article.
Acknowledgments
The authors thank the FlowCore and Live Cell Imaging (LIMA) Core Facilities at the Medical Faculty Mannheim, Heidelberg University, for their support. We and the FlowCore specifically acknowledge the FI-EMS Core Facility Strategic Extension funded by the Federal Ministry of Education and Research (BMBF) and the Ministry of Science, Research and the Arts Baden-Württemberg within the framework of the Excellence Strategy of the Federal and State Governments of Germany for funding the Cytek®Northern LightsTM. The authors also acknowledge the data storage service SDS@hd, supported by the Ministry of Science, Research and the Arts Baden-Württemberg (MWK).
Author Contributions
Conceptualization, L.C.D.; Methodology, P.L., S.U. and K.B.; Formal Analysis, P.L. and E.R.; Investigation, P.L., S.H. (Sarah Hofmann), S.H. (Shruthi Hemanna) and A.A.; Data Curation, P.L.; Writing—Original Draft Preparation, P.L. and L.C.D.; Writing—Review & Editing, P.L., S.H. (Sarah Hofmann), S.H. (Shruthi Hemanna), E.R., A.A., K.B. and L.C.D.; Visualization, P.L. and L.C.D.; Supervision, S.H. (Sarah Hofmann) and L.C.D.; Funding Acquisition, L.C.D.
Ethics Statement
Not applicable.
Informed Consent Statement
Not applicable.
Data Availability Statement
Raw flow cytometry data used in this work will be made accessible to readers upon reasonable request.
Funding
This work was funded by Deutsche Forschungsgemeinschaft (DFG)—project number 492531042 and by the Wilhelm-Sander Stiftung—project number R2024.157.1 (to L.C.D.).
Declaration of Competing Interest
The authors declare that they have no known competing financial interests or personal relationships that could have appeared to influence the work reported in this paper.
References
-
Couch Y, Buzàs EI, Di Vizio D, Gho YS, Harrison P, Hill AF, et al. A brief history of nearly EV-erything—The rise and rise of extracellular vesicles. J. Extracell. Vesicles 2021, 10, e12144. doi:10.1002/jev2.12144. [Google Scholar]
-
Welsh JA, Goberdhan DCI, O’Driscoll L, Buzas EI, Blenkiron C, Bussolati B, et al. Minimal information for studies of extracellular vesicles (MISEV2023): From basic to advanced approaches. J. Extracell. Vesicles 2024, 13, e12404. doi:10.1002/jev2.12404. [Google Scholar]
-
Zhang H, Freitas D, Kim HS, Fabijanic K, Li Z, Chen H, et al. Identification of distinct nanoparticles and subsets of extracellular vesicles by asymmetric flow field-flow fractionation. Nat. Cell Biol. 2018, 20, 332–343. doi:10.1038/s41556-018-0040-4. [Google Scholar]
-
Zhang Q, Jeppesen DK, Higginbotham JN, Graves-Deal R, Trinh VQ, Ramirez MA, et al. Supermeres are functional extracellular nanoparticles replete with disease biomarkers and therapeutic targets. Nat. Cell Biol. 2021, 23, 1240–1254. doi:10.1038/s41556-021-00805-8. [Google Scholar]
-
García-Silva S, Benito-Martín A, Nogués L, Hernández-Barranco A, Mazariegos MS, Santos V, et al. Melanoma-derived small extracellular vesicles induce lymphangiogenesis and metastasis through an NGFR-dependent mechanism. Nat. Cancer 2021, 2, 1387–1405. doi:10.1038/s43018-021-00272-y. [Google Scholar]
-
Leary N, Walser S, He Y, Cousin N, Pereira P, Gallo A, et al. Melanoma-derived extracellular vesicles mediate lymphatic remodelling and impair tumour immunity in draining lymph nodes. J. Extracell. Vesicles 2022, 11, e12197. doi:10.1002/jev2.12197. [Google Scholar]
-
Peinado H, Zhang H, Matei IR, Costa-Silva B, Hoshino A, Rodrigues G, et al. Pre-metastatic niches: Organ-specific homes for metastases. Nat. Rev. Cancer 2017, 17, 302–317. doi:10.1038/nrc.2017.6. [Google Scholar]
-
Carney RP, Mizenko RR, Bozkurt BT, Lowe N, Henson T, Arizzi A, et al. Harnessing extracellular vesicle heterogeneity for diagnostic and therapeutic applications. Nat. Nanotechnol. 2025, 20, 14–25. doi:10.1038/s41565-024-01774-3. [Google Scholar]
-
Meeth K, Wang JX, Micevic G, Damsky W, Bosenberg MW. The YUMM lines: A series of congenic mouse melanoma cell lines with defined genetic alterations. Pigment Cell Melanoma Res. 2016, 29, 590–597. doi:10.1111/pcmr.12498. [Google Scholar]
-
Wang J, Perry CJ, Meeth K, Thakral D, Damsky W, Micevic G, et al. UV-induced somatic mutations elicit a functional T cell response in the YUMMER1.7 mouse melanoma model. Pigment Cell Melanoma Res. 2017, 30, 428–435. doi:10.1111/pcmr.12591. [Google Scholar]
-
Leary N, Walser S, Dieterich LC. Isolation and Fluorescent Labeling of Extracellular Vesicles from Cultured Tumor Cells. Methods Mol. Biol. 2022, 2504, 199–206. doi:10.1007/978-1-0716-2341-1_14. [Google Scholar]
-
Schürz M, Danmayr J, Jaritsch M, Klinglmayr E, Benirschke HM, Matea CT, et al. EVAnalyzer: High content imaging for rigorous characterisation of single extracellular vesicles using standard laboratory equipment and a new open-source ImageJ/Fiji plugin. J. Extracell. Vesicles 2022, 11, e12282. doi:10.1002/jev2.12282. [Google Scholar]
-
Collot M, Ashokkumar P, Anton H, Boutant E, Faklaris O, Galli T, et al. MemBright: A Family of Fluorescent Membrane Probes for Advanced Cellular Imaging and Neuroscience. Cell Chem. Biol. 2019, 26, 600–614.e607. doi:10.1016/j.chembiol.2019.01.009. [Google Scholar]
-
Lai CP, Kim EY, Badr CE, Weissleder R, Mempel TR, Tannous BA, et al. Visualization and tracking of tumour extracellular vesicle delivery and RNA translation using multiplexed reporters. Nat. Commun. 2015, 6, 7029. doi:10.1038/ncomms8029. [Google Scholar]
-
Acari A, Lodha P, Özhan S, Hemanna S, Rieck J, Drotleff B, et al. A deep, quantitative lipid atlas of extracellular vesicles across multiple cell lines. bioRxiv 2025. doi:10.1101/2025.08.22.671852. [Google Scholar]
-
Nevo N, Zhou A, Ansart N, Attali LC, Rubinstein E, Guérin C, et al. Nano-flow cytometry of single extracellular vesicles reveals subpopulation differences across cell types and pharmacological perturbations. bioRxiv 2025. doi:10.1101/2025.07.09.663918. [Google Scholar]
-
Lees R, Tempest R, Law A, Aubert D, Davies OG, Williams S, et al. Single Extracellular Vesicle Transmembrane Protein Characterization by Nano-Flow Cytometry. J. Vis. Exp. 2022, 185, e64020. doi:10.3791/64020. [Google Scholar]
-
Brealey J, Lees R, Tempest R, Law A, Guarnerio S, Maani R, et al. Shining a light on fluorescent EV dyes: Evaluating efficacy, specificity and suitability by nano-flow cytometry. J. Extracell. Biol. 2024, 3, e70006. doi:10.1002/jex2.70006. [Google Scholar]