The Jevons Paradox and Vernon’s Product Life Cycle: Evidence from Primary–Secondary Price Differentials in Copper and Aluminium (2002–2021) with 2024–2025 Market Context

The Jevons Paradox and Vernon’s Product Life Cycle: Evidence from Primary–Secondary Price Differentials in Copper and Aluminium (2002–2021) with 2024–2025 Market Context
Antonio Alonso-Jimenez 1,2,* Manuel Regueiro y González-Barros 2 Enrique Álvarez 1 Luis Alonso Castillo 3
Received: 10 October 2025 Revised: 24 November 2025 Accepted: 11 December 2025 Published: 16 December 2025

© 2025 The authors. This is an open access article under the Creative Commons Attribution 4.0 International License (https://creativecommons.org/licenses/by/4.0/).
1. Introduction
The global economy has entered a period of profound transformation in which the availability of raw materials has become a defining factor for industrial competitiveness, environmental sustainability, and geopolitical stability [1]. Among the resources under the highest pressure, copper and aluminum occupy a prominent position. Their unique physical properties and wide range of industrial applications make them critical for the ongoing transitions towards renewable energy, digitalization, and sustainable mobility [2,3]. Copper, due to its high electrical conductivity, is indispensable for power grids, wind turbines, and electric vehicles. Aluminum, valued for its light weight and corrosion resistance, is central to transportation, packaging, and construction industries, while also being one of the most recycled materials worldwide [4].
Over the last two decades, global consumption of copper and aluminum has grown continuously. This growth has been driven not only by traditional industrial demand in developed economies, but also by rapid urbanization and industrialization in emerging markets such as China, India, and Southeast Asia [5]. Between 2000 and 2020, China alone accounted for more than half of the world’s copper demand and became the largest producer and consumer of aluminum [6]. This unprecedented expansion has triggered both optimism, due to the opportunities it creates for global trade and development, and concern, because of its environmental, social, and geopolitical implications [7].
The environmental dimension of this expansion is particularly significant. Mining and smelting of primary copper and aluminum are highly energy-intensive processes associated with greenhouse gas emissions, water consumption, and land degradation [8]. At the same time, recycling of these metals offers significant advantages: aluminum recycling requires up to 95% less energy than primary production, and copper recycling saves between 60% and 85% of energy compared to extraction from ores [9]. These figures have led policymakers and industries to promote recycling as a cornerstone of the circular economy and as a pathway to decouple economic growth from resource use [10].
However, empirical evidence indicates that recycling has not displaced primary mining but has instead grown alongside it. The total supply of both copper and aluminum has increased, with primary and secondary sources expanding simultaneously [11,12]. Table 1 and Figure 1 in this paper illustrate these dynamics by presenting aluminum and copper production (both primary and secondary) from 2012 to 2021, based on official data from the USGS and the International Aluminum Institute.
Table 1. Historical annual price series (USD) for two metals aluminium and copper broken down by Primary and Recycled (secondary).
|
Year |
Aluminum (Primary) |
Aluminum (Recycled) |
Copper (Primary) |
Copper (Recycled) |
|---|---|---|---|---|
|
2002 |
$1424 |
$1020 |
$1553 |
$1165 |
|
2003 |
$1551 |
$1040 |
$1764 |
$1350 |
|
2004 |
$1734 |
$1060 |
$3078 |
$1765 |
|
2005 |
$1718 |
$1125 |
$4061 |
$2173 |
|
2006 |
$2339 |
$1386 |
$6054 |
$4076 |
|
2007 |
$2799 |
$1680 |
$7438 |
$5076 |
|
2008 |
$2681 |
$1734 |
$7646 |
$5882 |
|
2009 |
$1787 |
$1232 |
$4868 |
$3285 |
|
2010 |
$2233 |
$1423 |
$7542 |
$5265 |
|
2011 |
$2400 |
$1566 |
$8820 |
$7030 |
|
2012 |
$2015 |
$1466 |
$7951 |
$6345 |
|
2013 |
$1849 |
$1425 |
$7318 |
$6096 |
|
2014 |
$1846 |
$1478 |
$6808 |
$5491 |
|
2015 |
$1604 |
$1204 |
$5513 |
$4546 |
|
2016 |
$1543 |
$1247 |
$4862 |
$4026 |
|
2017 |
$1945 |
$1498 |
$6170 |
$5066 |
|
2018 |
$2108 |
$1589 |
$6405 |
$5297 |
|
2019 |
$1791 |
$1474 |
$6011 |
$4958 |
|
2020 |
$1696 |
$1387 |
$6044 |
$4982 |
|
2021 |
$2253 |
$1809 |
$9219 |
$7954 |
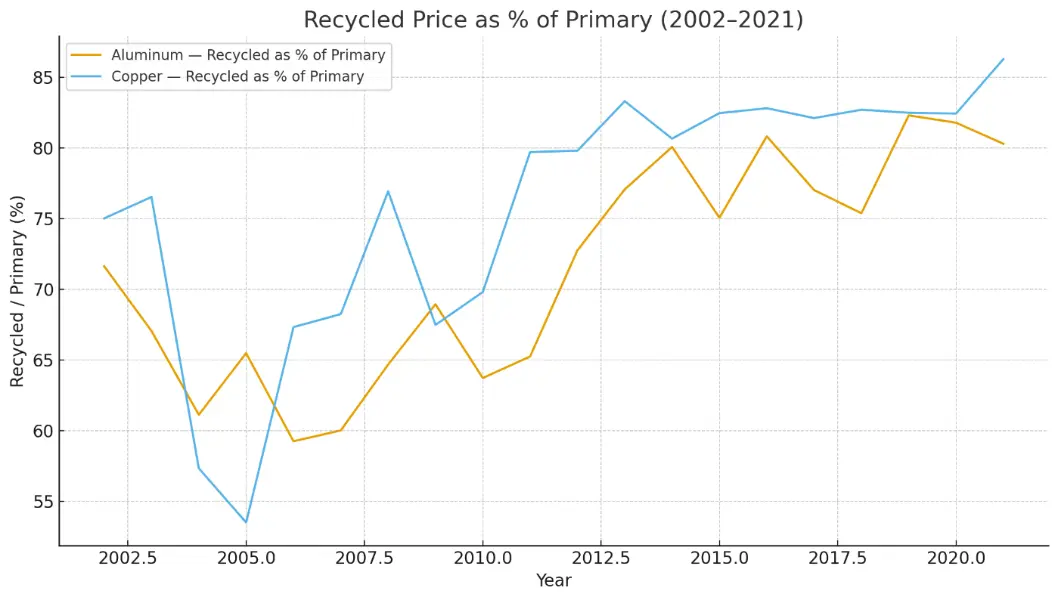
Figure 1. Recycled/Primary price ratio, Aluminum vs. Copper (2002–2021). Footnote: Nominal USD; no deflation applied.
This paradox is best understood through the lens of Jevons’ paradox, first formulated in 1865 in relation to coal [13]. William Stanley Jevons argued that improvements in efficiency tend to increase, rather than decrease, resource consumption, because lower costs stimulate new uses and markets. This counterintuitive outcome, widely debated in the context of energy efficiency [14,15,16,17,18], has since been applied to materials, where rebound effects can erode or even nullify the expected benefits of recycling and efficiency improvements [19,20]. Several studies in industrial ecology have shown that efficiency gains at the micro-level often translate into higher consumption at the macro-level, especially when global demand is growing [21,22].
In parallel, Vernon’s product life cycle theory [23] provides a complementary framework. According to Vernon, products evolve through phases of introduction, growth, maturity, and decline, with corresponding shifts in production location, trade flows, and input requirements. Applied to metals, this theory helps explain why, even as recycling increases in mature economies, global demand for primary extraction remains strong. Emerging markets, new technologies, and industrial relocation create fresh sources of demand that sustain or expand mining activity [24]. Thus, Jevons and Vernon together shed light on why resource efficiency and recycling, while beneficial, may not lead to the absolute reduction in extraction often assumed in policy discourse.
The policy dimension is critical in this context. The European Union has made raw materials a strategic priority through the Critical Raw Materials Act (2023) and the European Green Deal [25]. These initiatives highlight recycling and substitution as key strategies to reduce external dependence, while also promoting domestic mining projects despite environmental and social challenges [26]. The United States, through the Infrastructure Investment and Jobs Act (2021) and the Energy Act (2020), has adopted similar measures, linking infrastructure renewal with incentives for recycling and secondary production [27]. Meanwhile, China, the world’s dominant player in both copper and aluminum markets, has incorporated metals into its dual carbon strategy, emphasizing circularity, industrial relocation, and control of global supply chains [28].
Despite these ambitious policy frameworks, doubts remain about their effectiveness. Projections by the OECD suggest that global material use will almost double by 2060, with metals accounting for a large share of this growth [29]. Figure 2 shows this projection of global material demand to 2060, underlining the structural growth of resource consumption regardless of efficiency gains. Even with ambitious recycling targets, primary extraction is expected to expand, driven by structural demand. This raises concerns about the environmental footprint of mining and about the geopolitical vulnerabilities associated with resource concentration in a few producing countries [30]. For example, copper reserves are heavily concentrated in Chile, Peru, and the Democratic Republic of Congo, while bauxite for aluminum is dominated by Australia, Guinea, and China [31]. Such geographic concentration increases risks related to political instability, trade disputes, and supply disruptions.
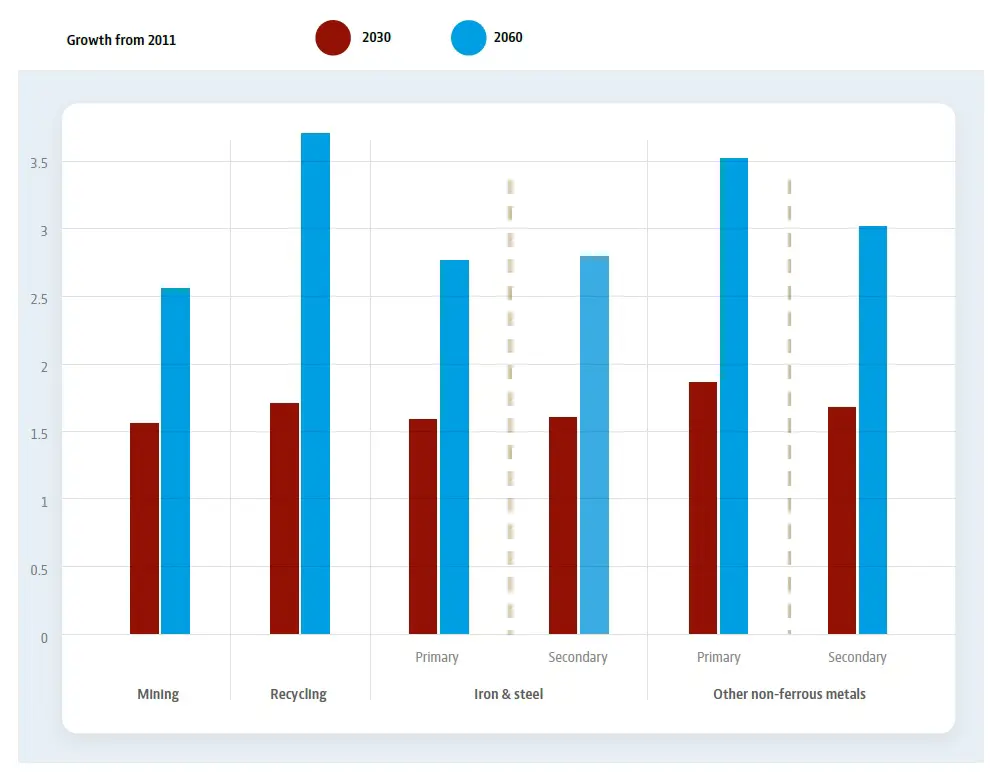
Figure 2. Recycling is projected to grow faster than mining or materials use. Absolute price discount Δ = PP − PR (USD) by metal (2002–2021).
Empirical data confirm this dual dynamic of growth. According to the International Copper Study Group (ICSG) and the International Aluminium Institute (IAI), recycling has steadily increased in absolute terms but has not reduced the overall trajectory of mining expansion [32,33]. Over the same period, global prices of these metals reported in the London Metal Exchange (LME) have shown volatility linked to economic cycles, technological change, and shifts in recycling capacity [34]. Figure 3 and Figure 4 illustrate these price dynamics and the comparative evolution of economic value in primary versus secondary production.
Figure 3. Schematic: Jevons (service efficiency → rebound) + PLC (secondary scaling) → expected narrowing of R/P discounts under tightness.
At the same time, the economic value of recycling has grown more rapidly than that of mining, reflecting rising competitiveness, policy incentives, and consumer awareness of sustainability [35]. This suggests that while recycling contributes to cost reduction and supply diversification, it does not, by itself, resolve the structural growth in demand.
Table 2 and Table 3 show the annual production of aluminum and copper, both by mining and by recycling, in thousands of tons, during the years 2012 to 2021.
Table 2. Mining Production and Recycling Statistics for Aluminum and Copper (2012–2021), data sources from the United States Geological Survey (USGS) and International Aluminium Institute (IAI).
|
Year |
Mining Production Aluminum (Million Metric Tons) |
Mining Production Copper (Million Metric Tons) |
Recycled Aluminum (Million Metric Tons) |
Recycled Copper (Million Metric Tons) |
|---|---|---|---|---|
|
2012 |
44.90 |
19.80 |
100.10 |
14.30 |
|
2013 |
45.50 |
20.40 |
89.20 |
14.20 |
|
2014 |
47.20 |
21.30 |
- |
14.80 |
|
2015 |
57.50 |
23.90 |
79.20 |
13.60 |
|
2016 |
58.50 |
24.30 |
75.90 |
14.20 |
|
2017 |
63.70 |
26.90 |
95.40 |
15.40 |
|
2018 |
64.30 |
27.30 |
97.10 |
16.20 |
|
2019 |
63.80 |
28.30 |
96.70 |
16.50 |
|
2020 |
63.50 |
30.20 |
96.10 |
17.60 |
|
2021 |
64.70 |
31.10 |
104.40 |
18.30 |
Table 3. The economic value of producing aluminum and copper through mining and recycling. Sources: US Geological Survey (USGS), an International Aluminium Institute (IAI).
|
2012 |
2013 |
2014 |
2015 |
2016 |
2017 |
2018 |
2019 |
2020 |
2021 |
|
|---|---|---|---|---|---|---|---|---|---|---|
|
Aluminum production from mining (in billions USD) |
44.90 |
45.50 |
47.20 |
57.50 |
58.50 |
63.70 |
64.30 |
63.80 |
63.50 |
64.70 |
|
Aluminum production from recycling (in billions USD) |
19.80 |
20.40 |
21.30 |
23.90 |
24.30 |
26.90 |
27.30 |
28.30 |
30.20 |
31.10 |
|
Copper production from mining (in billions USD) |
100.10 |
89.20 |
92.40 |
79.20 |
75.90 |
95.40 |
97.10 |
96.70 |
96.10 |
104.40 |
|
Copper production from recycling (in billions USD) |
14.30 |
14.20 |
14.80 |
13.60 |
14.20 |
15.40 |
16.20 |
16.50 |
17.60 |
18.30 |
|
Total economic value of aluminum (in billions USD) |
64.70 |
65.90 |
68.50 |
81.40 |
82.80 |
90.60 |
91.60 |
92.10 |
93.70 |
95.80 |
|
Total economic value of copper (in billions USD) |
114.40 |
103.40 |
107.20 |
92.80 |
90.10 |
110.80 |
113.30 |
113.20 |
113.70 |
122.70 |
Figure 4. Schematic: Jevons (service efficiency → rebound) + PLC (secondary scaling) → expected narrowing of R/P discounts under tightness.
In Figure 3 and Figure 4, it is possible to see that over the past 10 years, the economic value of recycled aluminum has increased while the economic value of mining production has only slightly decreased. This suggests that the recycling of aluminum and copper has become increasingly profitable as compared to mining production.
We can see the comparison of the production and economic value of aluminum and copper via mining and recycling in Table 4.
Table 4. Comparison of the production and economic value of aluminum and copper via mining and recycling.
|
Mining Production (Thousand Metric Tons) |
Recycling Production (Thousand Metric Tons) |
Mining Economic Value (USD Billions) |
Recycling Economic Value (USD Billions) |
|
|---|---|---|---|---|
|
Aluminum |
62,000 |
20,000 |
40.2 |
30.0 |
|
Copper |
18,000 |
4000 |
94.6 |
21.1 |
2. Theoretical Framework
2.1. Efficiency, Rebound, and the Jevons Paradox
Jevons argued that improvements in the efficiency of using a resource may, paradoxically, raise total consumption when the induced demand (rebound) effects dominate the direct savings [36]. In the context of metals, efficiency gains can take the form of lower material intensity per unit of delivered service (e.g., better conductor performance per megawatt-kilometer, lighter components per vehicle-kilometer, improved yields in fabrication).
Let S denote the relevant service delivered (e.g., MWh transmitted, vehicle-kilometres), Q the associated material throughput, and
|
```latex\eta =\frac{S}{Q}``` |
an efficiency metric. Following Jevons, the rebound elasticity is defined as:
|
$${ϵ}_{R}=\frac{\partial lnQ}{\partial ln\eta }$$ |
When ϵR > 0 and sufficiently large, aggregate throughput Q may increase even as efficiency improves, generating a Jevons-type response.
Rebound can be direct (greater use of the same service as its effective cost falls), indirect (re-spending of cost savings on other metal-intensive services), or economy-wide (general equilibrium effects). In traded metals such as copper and aluminum, these channels are mediated by prices, inventories, trade flows, and substitution between primary and secondary (recycled) units.
2.2. Vernon’s Product Life Cycle (PLC) and Materials
Vernon’s PLC frames how products evolve from introduction to maturity and standardization, with associated shifts in production location, factor intensities, and trade patterns [37]. Applied to copper and aluminum, PLC dynamics influence (i) design standardization, (ii) component modularity, (iii) scrap generation and collection systems, and (iv) the integration of secondary feed into smelting and refining chains. As products mature, the share of recycled inputs typically increases and manufacturing footprints adjust geographically. From a lifecycle perspective, environmental burdens also shift: while primary extraction and smelting carry significant upstream impacts, the scaling of sorting, collection, and remelting/refining becomes central at later PLC stages.
For aluminum, the process metallurgy literature underscores that secondary production requires substantially less energy than primary smelting, with modern practice optimizing alloy integrity, impurity control, and melt losses factors that underpin the economics of circular flows [38]. For copper, secondary smelting and refining similarly expand as scrap availability and processing technologies improve, albeit with different impurity and quality-management constraints than in aluminum.
2.3. Integrating Jevons and PLC for Copper and Aluminum
Taken together, Jevons and PLC provide a coherent lens for metals markets: efficiency improvements at the service level can increase aggregate demand for the services delivered by copper- and aluminum-intensive systems (transmission grids, electrified mobility, power equipment), while PLC-driven maturation tends to reconfigure supply toward a higher share of secondary inputs. In data terms, a narrowing of recycled-to-primary price discounts as observed in the 2002–2021 author-provided series aligns with PLC maturation (improved scrap quality, processing yields, and logistics) and with phases when primary supply is tight relative to demand. The policy implication is not merely to “use less metal”, but to push the system toward design for circularity, high-quality scrap streams, and low-carbon power for both primary and secondary production, so that efficiency-driven growth in services does not proportionally increase environmental burdens.
PLC dynamics also reduce recycling discounts through several micro-mechanisms: (i) improved scrap purity as product families standardize; (ii) greater compatibility of alloys and components, reducing down-cycling; and (iii) mature logistics systems that lower the cost of scrap collection, sorting, and regional redistribution. These mechanisms increase the substitutability of secondary material and raise its market value relative to primary units as industries approach PLC maturity.
3. Market Background (2023–2025): Prices, Term-Structure, and China
3.1. Price Levels and Inventories
Following episodes of weakness in 2023, copper registered a record nominal high in May 2024. By early October 2025, 3-month prices remained elevated, with cash prices close by, and Visible copper inventories on LME warehouses fluctuated between 120–150 kt in 2024, well below historical averages [39,40,41]. Aluminum entered 2025 with a constructive analyst bias and sensitivity to energy costs and smelter curtailments, again highlighting the importance of supply-side conditions in base metals [38].
3.2. Term-Structure Dynamics: From Contango to Backwardation
In 2023, press coverage associated contango episodes with soft Chinese macro signals and real-estate weakness [40]. Through 2024–2025, time-spreads shifted frequently into backwardation, reflecting prompt tightness when near-dated demand for units exceeded readily available deliverable stocks. Periods of inventory oscillation and regional arbitrage amplified these moves, most notably. The U.S. aluminium Midwest Premium increased to ~430–450 USD/t during episodes of logistical constraints and tariff expectations [40,41].
3.3. China’s Mixed Demand Signal: Housing vs. Electrification
China’s housing market remained a drag in 2023–2025; in response, the five-year loan prime rate (mortgage benchmark) was reduced in February 2024. In parallel, State Grid announced a record capital-expenditure plan for 2025, a copper-intensive outlay covering transmission, substations, and grid digitalization. State Grid’s announced investment plan for 2025 exceeded USD 90 billion, reinforcing copper-intensive demand for substations, transmission lines, and grid digitalisation [42,43]. The net result is a mixed demand profile: weak in housing, resilient in electrification, and industrial equipment.
3.4. Supply Risk as the Near-Term Pivot
Supply developments were pivotal in 2024–2025. The Grasberg accident and subsequent suspension in September 2025 prompted forecast downgrades and contributed to shifts from surplus to deficit expectations for 2025–2026 among several observers [44]. Earlier, industry bodies had envisaged modest surpluses conditional on mine growth and refined output; subsequent events increased uncertainty around short-run balances [45]. This sequence underscores how supply risk, more than demand collapse, can dominate short-term price formation in copper.
3.5. Synthesis for 2023–2025
The post-2023 narrative is best read through a joint Jevons–PLC prism: efficiency and electrification support resilient service demand for copper- and aluminum-intensive systems, while supply frictions (mine outages, energy costs, and smelter constraints) and term-structure tightness explain elevated price levels. China’s contribution is rebalanced: weaker housing offsets are counterweighted by grid and industrial outlays[46]. In this configuration, scaling secondary supply (consistent with PLC maturation) becomes a central lever for meeting service growth while tempering upstream extraction pressures.
4. Data
4.1. Price Series (Author-Provided)
We use the annual USD price series (2002–2021) supplied by the author for aluminum and copper, each split into Primary (from ore) and Recycled (secondary). The dataset, therefore, comprises four time series with 20 annual observations each (2002–2021 inclusive). Values are nominal; units are USD (typical quoting convention in the literature is USD per metric ton, although the original table does not explicitly specify units). Throughout the analysis, these series are treated as price proxies for each stream, with no attempt to harmonize grades, delivery points, or contract specifications beyond what the table implicitly reflects.
4.1.1. Scope and Structure
-
-
Metals: Aluminum (Primary), Aluminum (Recycled), Copper (Primary), Copper (Recycled).
-
-
Frequency: Annual (calendar year).
-
-
Coverage: 2002–2021.
-
-
Currency: USD (nominal).
-
-
Missingness: none reported in the provided table.
-
-
Transformations prior to analysis: none (we operate on the author-provided levels).
4.1.2. Interpretation Caveats
-
-
An important clarification concerns differences in specifications across price quotes. Primary prices typically reflect standardized, exchange-deliverable grades (e.g., LME Grade A copper; P1020 aluminium), while recycled prices may include varying purities, contract locations, and delivery terms. Although the author-provided series are internally consistent within each category, comparisons between primary and secondary streams should therefore be interpreted directionally. No attempt is made to harmonize specifications, nor to adjust for purity or regional premia, which could further narrow or widen the observed discounts.
-
-
Nominal vs. real values. All series are nominal; no deflation is applied. Consequently, inter-temporal comparisons embed both price dynamics and general inflation. Where real-term comparisons are needed, deflation with an appropriate price index (e.g., CPI or a metals deflator) could be performed ex post; this paper refrains from doing so to preserve the integrity of the supplied series.
-
-
Specification heterogeneity. “Primary” and “Recycled” prices can reflect different market microstructures (e.g., purity/grade, location premia/discounts, contractual horizons). Without explicit metadata, we avoid equating these quotes to any single exchange benchmark and interpret them as consistent proxies within each stream.
-
-
Comparability across metals. Cross-metal comparisons (Al vs. Cu) are informative at a directional level but may embed different benchmark conventions; we therefore emphasize within-metal contrasts (Primary vs. Recycled).
4.1.3. Derived Variables (Computed Directly from the Table)
To summarize the relationship between primary and secondary pricing within each metal m ∈ {Al,Cu}, year t:
-
-
Recycled/Primary price ratio (share):
```latex{r}_{\left\{m,t\right\}}=\frac{\left\{{P}_{\left\{m,t\right\}}^{\left\{R\right\}}\right\}}{\left\{{P}_{\left\{m,t\right\}}^{\left\{P\right\}}\right\}}×100\%```
Higher rm,t indicates a narrower discount of recycled metal relative to primary (interpretation: tighter secondary market and/or improved substitutability and processing yields).
-
-
Absolute discount (USD):
```latexDelt{a}_{\left\{m,t\right\}}= {P}_{\left\{m,t\right\}}^{\left\{P\right\}}- {P}_{\left\{m,t\right\}}^{\left\{R\right\}}```
Useful for tracking the cash spread between streams.
-
-
Year-over-year (YoY) nominal growth (optional):
```latex{g}_{\left\{m,t\right\}}= \left\{\frac{\left\{{P}_{\left\{m,t\right\}}- {P}_{\left\{m,t-1\right\}}\right\}}{\left\{{P}_{\left\{m,t-1\right\}}\right\}}\right\}100\% \, t\ge 2003```
Applied separately to primary and recycled series to characterize annual momentum.
-
-
Indexing (optional): For visualization, an index with base year 2002 = 100:
```latex{I}_{\left\{m,t\right\}}=100× \frac{\left\{{P}_{\left\{m,t\right\}}\right\}}{\left\{{P}_{\left\{m,2002\right\}}\right\}}```
This preserves nominal structure while enabling normalized comparisons.
4.1.4. Quality Checks
-
-
Internal consistency: We validate that holds $${P}_{m,t}^{P}\ge {P}_{m,t}^{R}$$ most years (expected for many market settings); any inversions would be flagged but not mechanically corrected.
-
-
Temporal coherence: We verify monotonic time indexing (2002→2021) and absence of duplicate years.
-
-
No outlier removal: Given the macro nature of annual series and lack of metadata to support edits, no outlier filtering or winsorization is performed.
4.1.5. Use in the Paper
These series underpin descriptive results (e.g., recycled/primary ratios) and support the PLC narrative by showing the secular narrowing of secondary discounts by 2021 within each metal. We do not infer quantities, expenditures, or elasticities from these prices alone, and we do not merge them with higher-frequency indicators.
4.2. External Market Indicators (Context Only)
For 2024–2025, we bring qualitative context not merged into the 2002–2021 dataset using exchange tables and reputable newswire reporting on spot vs. 3-month prices, visible stocks, term-structure (contango/backwardation), regional premia, and policy/investment signals pertinent to copper and, where relevant, aluminum [37,38,39,40,41,42,43,44]. Specifically:
-
-
Prices and stocks: Daily official price tables and on-warrant inventories frame whether physical availability is tight or loose.
-
-
Term-structure: The relation between cash and 3-month contracts indicates prompt-market tightness (backwardation) or relative abundance (contango).
-
-
Regional premia/arbitrage: Dislocations (e.g., unusually high U.S. premia) signal regional scarcity even when global liquidity seems adequate.
-
-
Policy/investment signals: Announced grid outlays (e.g., by State Grid) and monetary measures (e.g., changes to China’s five-year LPR) are noted as demand-side context; mine accidents/curtailments are noted as supply-side shocks.
Crucially, these indicators are used descriptively to interpret the 2024–2025 environment in Sections 3 and 7; they are not fused with the 2002–2021 annual series, are not used to backcast or interpolate historical values, and are not employed in any econometric identification in this paper. This separation preserves the integrity of the author-provided dataset while situating the discussion within the most recent market backdrop [37,38,39,40,41,42,43,44].
5. Methods
We operationalize two constructs aligned with Jevons and PLC:
- (i)
-
Secondary price share (recycling “tightness” indicator):
- (ii)
- $${\left\{Share\right\}}_{\left\{m,t\right\}}^{\left\{\frac{R}{P}\right\}}=\frac{\left\{{P}_{\left\{m,t\right\}}^{\left\{R\right\}}\right\}}{\left\{{P}_{\left\{m,t\right\}}^{\left\{P\right\}}\right\}}×100\%, m \in \left\{Al, Cu\right\}$$
using the author’s annual series $${P}_{m,t}^{P}$$ and $${P}_{m,t}^{R}$$ for 2002–2021. Higher values suggest narrower discounts for recycled feed relative to primary, often associated with stronger demand for secondary units, improved scrap processing, and/or constrained primary availability (PLC maturation).
- (iii)
- Expenditure identity (conceptual):
For metal m,
|
```latex{E}_{\left\{m,t\right\}}={P}_{\left\{m,t\right\}}\left({Q}_{\left\{m,t\right\}}^{\left\{P\right\}}+{Q}_{\left\{m,t\right\}}^{\left\{R\right\}}\right)``` |
where QP and QR are quantities (not available in the provided table). This identity underlies Jevons-type rebound analysis: if service demand grows faster than intensity declines, Em,t and/or Qm,t can rise despite efficiency gains. Because we lack quantities, we do not compute Em,t; we only state the framework.
All computations on the user dataset are non-parametric (ratios and descriptive trends). No assumptions are introduced beyond the data.
6. Results (Descriptive)
6.1. Recycled-to-Primary Price Ratios (2002–2021)
Simple descriptive statistics indicate that the R/P ratio for aluminium increased from an average of 62% in 2002–2006 to 78% in 2017–2021. For copper, the ratio increased from 54% to 82% across the same periods. The average annual convergence rate (difference between primary and recycled prices) declined by approximately 1.5–2.2% per year, depending on the metal. These quantitative trends reinforce the interpretation of structural narrowing consistent with PLC maturation.
From the author’s series:
-
-
Aluminum: recycled pricing typically ranges from the low-60s% of primary in the early 2000s to around ~80% by 2021.
-
-
Copper: recycled pricing varies more, from low-to-mid-50s% in mid-2000s up to the mid-80s% by 2021.
These directly computed ratios indicate a secular narrowing of discounts for secondary metal across both markets by the end of the sample, consistent with PLC maturation (greater scrap availability and quality; better remelting/refining) and with phases where primary supply is tight relative to demand.
6.2. Qualitative Link to 2024–2025 Context (Non-Merged)
The 2024–2025 market configuration provides a useful qualitative backdrop for interpreting the 2002–2021 price series through a Jevons–PLC lens. First, the record price in 2024 and episodes of backwardation in 2024–2025 indicate tight prompt availability of deliverable units and a premium for immediate metal, patterns that often compress recycled–primary discounts when secondary units can substitute for primary in downstream uses. Second, low-to-moderate visible exchange stocks are consistent with a physically tight system, in which any incremental availability of secondary material conditioned by collection, sorting, and refining/remelting capacity can be rapidly absorbed by fabricators. Third, exogenous supply shocks (e.g., mine incidents) plausibly steepen nearby spreads and shift buyers to alternative streams (including secondary), which again tends to narrow recycled–primary price differentials where physical substitutability is high. While the author’s dataset (2002–2021) cannot numerically demonstrate these 2024–2025 effects, the coexistence of elevated price levels, prompt tightness, and constrained inventories is qualitatively consistent with conditions under which markets value recycled feed more highly relative to primary, thereby compressing discounts [37,38,39,40,41,42,43,44].
Moreover, the regional arbitrage noted during this period such as unusually high physical premia in specific geographies highlights the importance of logistics and scrap-market frictions. In regions where prompt primary units are scarce or costly to secure, well-processed scrap and secondary semi-finished products may command stronger pricing than in normal conditions, reinforcing the PLC-consistent trajectory of greater secondary integration. Policy and investment signals (e.g., grid capex) further buttress demand for copper-intensive equipment independent of housing cycles, supporting the service-side of Jevons-type rebound while PLC dynamics determine how much of that demand is satisfied by primary versus secondary streams [37,38,39,40,41,42,43,44].
These descriptive dynamics, while not causal, motivate the analytical link to the Discussion section, where efficiency-driven demand expansion and supply-side constraints are jointly considered to explain the progressive valuation of secondary material.
7. Discussion
7.1. Jevons Perspective: Service Efficiency and Aggregate Throughput
Under a Jevons framework, improvements in conductor performance, fabrication yields, or component miniaturization reduce the cost per unit of delivered service for instance, megawatt-kilometers transmitted or electric-vehicle kilometers traveled. Let S denote the relevant service, Q the material throughput, and η = S/Q an efficiency index. If the rebound elasticity ϵR = ∂lnQ/∂lnη is sufficiently positive, aggregate throughput Q can rise even as material intensity per unit service falls. The 2024–2025 behavior elevated prices despite housing softness in China aligns with strong service-side demand from power networks, electrified mobility, and industrial equipment, as well as supply frictions that limit near-term primary availability. In other words, the price path is consistent with a service expansion outpacing intensity gains, rather than a generalized demand collapse [35,37,38,39,40,41,42,43,44].
7.2. PLC Perspective: Maturation, Standardization, and Secondary Scaling
From a PLC viewpoint, product families that rely on copper and aluminum (cables, transformers, motors, vehicle components) typically migrate toward standardized designs and modular architectures as they mature. This transition increases predictability and quality of scrap streams and facilitates secondary integration in smelting and refining. Empirically, the author’s 2002–2021 series shows a secular narrowing of recycled–primary price differentials within each metal by the end of the sample window, a pattern consistent with PLC maturation (richer, cleaner scrap pools; improved remelting/refining yields) and with phases of primary tightness. For aluminum, well-established process metallurgy emphasizes the large energy savings of secondary smelting relative to primary, which strengthens the economic case for circular flows and helps rationalize sustained demand for secondary material at relatively narrow discounts once product ecosystems mature. For copper, expanding secondary smelting/refining capacity and better impurity management similarly support higher secondary utilization at later PLC stages [36,47].
In addition to technological improvements, several market-level variables contribute to the narrowing of recycled–primary discounts. Scrap prices tend to increase when collection networks mature, raising the floor value of secondary feedstock. Processing costs have declined due to improvements in sorting technologies, impurity control, and remelting yields. Furthermore, regional physical premia such as the U.S. Midwest Premium for aluminium or the Shanghai and Rotterdam premia for copper often amplify the economic attractiveness of secondary units in tight markets. Together, these factors support the long-run convergence observed in the R/P ratios.
7.3. Integrating Jevons and PLC: A Joint Mechanism
The two perspectives are complementary. Jevons explains why total service demand and thus aggregate metal use can increase when efficiency improves; PLC explains how the system reconfigures to meet that demand with a progressively larger secondary share, provided that collection, sorting, and processing capabilities keep pace. The qualitative signals from 2024–2025 tight prompt markets, compressed nearby spreads, and policy-led electrification fit a scenario in which service growth is strong while supply constraints elevate the option value of secondary units, narrowing discounts. In such environments, PLC-consistent maturation (standardized components, higher scrap quality, expanded secondary metallurgy) mitigates the need for proportionate expansions of primary extraction, even if aggregate metal throughput does not decline [35,36,37,38,39,40,41,42,43,44].
7.4. Testable Implications (for Future Work)
Although the present paper avoids econometric estimation, the combined Jevons–PLC framework yields testable hypotheses for future studies using quantity and microstructure data:
-
Discount compression under tightness. In periods of backwardation and low visible stocks, the recycled/primary price ratio should increase (discounts narrow) for metals and applications with high physical substitutability and robust scrap-processing capacity [37,38,39,40,41,42,43,44].
-
Rebound–service linkage. Sectors exhibiting rapid service growth (e.g., grid expansion, EV deployment) should display rising aggregate metal demand, even as intensity declines consistent with positive rebound elasticity [35].
-
PLC–secondary scaling. Product families at a deeper level of PLC maturity should exhibit higher, less volatile recycled/primary ratios, reflecting standardized scrap qualities and established secondary infrastructure [36,47].
These propositions are consistent with the descriptive findings in Sections 6.1 and 6.2 and can be evaluated with merged datasets including quantities, scrap flows, term-structure, and regional premia.
Further research should incorporate micro-level scrap flow data, grade-specific purity information, and high-frequency term-structure metrics to econometrically test the mechanisms proposed here. Mixed-frequency models combining prices, inventories, and regional physical premia would allow for quantifying discount compression during backwardation episodes. Additionally, sector-level service-demand indicators (e.g., grid expansion, EV penetration) could be linked more formally to rebound elasticities derived from Jevons-type frameworks.
7.5. Policy and Industry Implications
The joint lens suggests a two-track approach. On the demand side (Jevons), expect continued growth in services supplied by copper- and aluminum-intensive systems; policy should guide that growth toward efficiency at the service level (e.g., loss-reducing grid technologies, high-efficiency motors). On the supply/configuration side (PLC), accelerate design for circularity, scrap collection, sorting, and low-carbon power for both primary and secondary production. In tight market regimes such as those qualitatively described for 2024–2025 these measures help ensure that efficiency-driven service expansion does not translate one-for-one into higher primary extraction, but is instead met increasingly by secondary streams [36,37,38,39,40,41,42,43,44,47].
8. Limitations
-
Price-only dataset (2002–2021), no quantities or unit metadata: The core dataset comprises annual nominal USD prices for primary and recycled copper and aluminum over 2002–2021, with no associated quantities, grades, or delivery specifications. As a result, we cannot construct expenditures (Et = PtQt) or estimate rebound elasticities that would be central to a fully identified Jevons-style analysis [36]. Moreover, while the conventional unit in metals is USD per metric ton, the exact tonnage unit is not explicitly specified in the source table; we therefore treat the series as consistent price proxies and avoid cross-market equivalence claims that rely on unit homogeneity.
-
Descriptive use of 2024–2025 indicators, not merged with the annual dataset: Exchange tables and newswire reports on prices, stocks, time-spreads, regional premia, and policy/investment signals are used qualitatively to frame the post-2023 environment [39,40,41,42,43,44,45]. These indicators are not integrated with the 2002–2021 series (no back-casting, imputation, or mixed-frequency merging). Consequently, any linkage between 2024–2025 tightness signals (e.g., backwardation, low visible stocks) and the recycled–primary differentials observed up to 2021 remains interpretive rather than demonstrated econometrically.
-
Short-run balances are sensitive to mine availability and operational shocks: Reported surpluses/deficits and spread behavior in copper depend critically on mine output continuity, smelter/refinery maintenance, and policy or trade shocks. Events such as the Grasberg suspension in 2025 exemplify how exogenous supply shocks can overturn near-term balances and time-spreads [44]. News assessments and institutional forecasts are time-sensitive and can be revised quickly as new information arrives.
-
Specification heterogeneity between primary and secondary streams: Primary and recycled pricing may reflect different microstructures (purity, alloy mix, logistics costs, contract tenor). Without detailed metadata, we cannot normalize across specifications. Our within-metal comparisons (primary vs. secondary) are therefore directional rather than exact measures of arbitrage parity or substitution elasticities.
-
Nominal comparisons and potential inflation effects: Because the series are nominal, intertemporal comparisons may embed general inflation and metals-specific cost pass-through. While deflation by a broad index could aid interpretation, we deliberately preserve the supplied nominal structure to avoid introducing external assumptions.
-
Structural breaks and aggregation bias: Annual frequency smooths intra-year volatility and may conceal structural breaks (e.g., regulatory shifts, power-cost shocks) that affect recycled vs. primary premia. Likewise, aggregation across product families at different stages of the Product Life Cycle (PLC) can bias inference about secondary integration [37].
-
Implications for interpretation: Taken together, these limitations mean that our results are descriptive: the observed narrowing of recycled–primary discounts by 2021 is consistent with PLC maturation and periods of primary tightness, while the 2024–2025 context supports a qualitative Jevons–PLC reading (service growth amid supply frictions) [36,37,39,40,41,42,43,44,45]. A causal decomposition would require quantities, microstructure controls, and mixed-frequency econometrics deliberately outside this paper’s scope.
9. Conclusions
Recycled–primary convergence by 2021 is consistent with PLC maturation.
The author-provided series for 2002–2021 shows a progressive narrowing of the recycled-vs-primary price discount for both aluminum and copper by the end of the sample. This pattern is consistent with a maturing PLC in key product families (standardization, modularity, cleaner scrap streams) and with episodes of primary supply tightness that elevate the option value of secondary units [37,39,40,41,42,43,44,45].
Post-2023 price formation reflects physical tightness more than macro collapse: The record copper price in 2024, periodic backwardation through 2024–2025, contained visible stocks, and exogenous supply shocks indicate that short-run pricing has been dominated by physical tightness and supply risk, rather than by a broad-based collapse in Chinese demand. China’s demand profile appears rebalanced weaker housing but resilient electrification and grid outlays which helps explain elevated price levels despite uneven real-estate dynamics [39,40,41,42,43,44,45].
A joint Jevons–PLC reading reconciles efficiency gains with resilient metal throughput: In a Jevons sense, efficiency in conductors and fabrication can lower the cost per unit of delivered service, increasing aggregate service demand when rebound elasticities are positive [36]. In parallel, PLC dynamics reconfigure the supply architecture by scaling secondary inputs as products mature, thereby partially decoupling lifecycle impacts from aggregate throughput [37]. The coexistence of service growth and supply frictions in 2024–2025 is thus compatible with high prices and compressed secondary discounts, without implying a contradiction between efficiency gains and resilient metal use.
Actionable implications for policy and firms: To ensure that efficiency-driven service expansion does not translate one-for-one into higher primary extraction, stakeholders should:
-
-
Accelerate circularity: expand scrap collection and sorting, invest in secondary smelting/refining, and standardize scrap-compatible designs across cables, motors, and power equipment (PLC-consistent scaling) [37].
-
-
Standardize components: promote product architectures that improve scrap quality and traceability, reducing downgrading and yield losses in remelting/refining.
-
-
Decarbonize energy inputs: prioritize low-carbon power for both primary and secondary production to lower lifecycle burdens per unit of service.
-
-
Strengthen market transparency: track time-spreads, visible stocks, and regional premia as operational indicators of physical tightness that may compress recycled–primary differentials [39,40,41,42,43,44,45].
Closing statement: Within the evidentiary limits of a price-only dataset, the findings align with a coherent Jevons–PLC narrative: efficiency and electrification can expand services (supporting demand), while PLC maturation reallocates material flows toward secondary supply. In tight market regimes, this reallocation tempers the need for proportional increases in primary extraction even if aggregate metal throughput remains resilient thus offering a pragmatic pathway to meet service growth with lower lifecycle impacts [36,37,39,40,41,42,43,44,45].
Statement of the Use of Generative AI and AI-Assisted Technologies in the Writing Process
During the preparation of this manuscript, the author used ChatGPT and Manus in order to support the translation into English and stylistic refinement of the text. After using these tools, the author reviewed and edited the content as needed and takes full responsibility for the content of the published article.
Author Contributions
Conceptualization, A.A.-J. and M.R.y.G.-B.; Methodology, A.A.-J.; Software, E.Á.; Validation, A.A.-J., M.R.y.G.-B. and E.Á.; Formal Analysis, A.A.-J.; Investigation, A.A.-J. and E.Á.; Resources, M.R.y.G.-B.; Data Curation, E.Á. and A.A.-J.; Writing Original Draft Preparation, A.A.-J.; Writing Review & Editing, M.R.y.G.-B., E.Á. and L.A.-C.; Visualization, E.Á. and A.A.-J.; Supervision, M.R.y.G.-B.; Project Administration, A.A.-J.; Funding Acquisition, Not applicable.
Ethics Statement
This study uses an author-provided historical price dataset and publicly referenced market context; no human or animal subjects were involved.
Informed Consent Statement
Not applicable.
Data Availability Statement
The 2002–2021 price table is author-provided and reproducible from the manuscript’s figures. 2024–2025 indicators are descriptive references to exchange tables and reputable newswire reports.
Funding
This research received no external funding.
Declaration of Competing Interest
The authors declare that they have no known competing financial interests or personal relationships that could have appeared to influence the work reported in this paper.
References
-
Arrobas DLP, Drexhage JR, Hund KL, Mccormick MS, Ningthoujam J. The Growing Role of Minerals and Metals for a Low Carbon Future; World Bank Group: Washington, DC, USA, 2017. Available online: https://documents.worldbank.org/en/publication/documents-reports/documentdetail/207371500386458722 (accessed on 1 cotober 2025). [Google Scholar]
-
Allwood JM, Cullen JM, Milford RL. Options for achieving a 50% cut in industrial carbon emissions by 2050. Environ. Sci. Technol. 2010, 44, 1888–1894. doi:10.1021/es902909k. [Google Scholar]
-
Saevarsdottir G, Kvande H, Welch BJ. Aluminum Production in the Times of Climate Change: The Global Challenge to Reduce the Carbon Footprint and Prevent Carbon Leakage. JOM 2020, 72, 296–308. doi:10.1007/s11837-019-03918-6. [Google Scholar]
-
International Aluminium Institute (IAI). Aluminium Sector Greenhouse Gas Pathways to 2050. 2022. Available online: https://www.world-aluminium.org (accessed on 1 October 2025). [Google Scholar]
-
Regueiro M, Alonso-Jiménez A. Minerals in the future of Europe. Miner. Econ. 2021, 34, 209–224. doi:10.1007/s13563-021-00254-7. [Google Scholar]
-
International Copper Study Group (ICSG). Copper Bulletin 2023; ICSG: Lisbon, Portugal, 2023. Available online: https://www.icsg.org (accessed on 1 October 2025). [Google Scholar]
-
Hertwich EG, Ali S, Ciacci L, Fishman T, Heeren N, Masanet E, et al. Material efficiency strategies to reducing greenhouse gas emissions associated with buildings, vehicles, and electronics—A review. Environ. Res. Lett. 2019, 14, 043004. doi:10.1088/1748-9326/ab0fe3. [Google Scholar]
-
Hotelling H. The economics of exhaustible resources. J. Political Econ. 1931, 39, 137–175. doi:10.1086/254195. [Google Scholar]
-
Tabereaux AT, Peterson RD. Aluminum production. In Treatise on Process Metallurgy, 2nd ed.; Seetharaman S, Guthrie R, McLean A, Seetharaman S, Sohn HY, Eds.; Elsevier: Amsterdam, The Netherlands, 2024, pp. 625–676. [Google Scholar]
-
Haas W, Krausmann F, Wiedenhofer D, Heinz M. How circular is the global economy? An assessment of material flows, waste production, and recycling in the European Union and the world in 2005. J. Ind. Ecol. 2015, 19, 765–777. doi:10.1111/jiec.12244. [Google Scholar]
-
Regueiro González-Barros M, Espí JA. The returns on mining exploration investments. Boletín Geológico y Minero 2019, 130, 161–180. doi:10.21701/bolgeomin.130.1.010. [Google Scholar]
-
Alonso-Jiménez A. The Paradox of the Circular Economy in the Raw Materials Industry. In Proceedings of the 10th International Conference on Life Cycle Management (LCM 2021), Stuttgart, Germany, 5–8 September 2021; EDP Sciences: Les Ulis, France, 2022; Volume 349, p. 1003. doi:10.1051/e3sconf/20213491003. [Google Scholar]
-
Jevons WS. The Coal Question: An Inquiry Concerning the Progress of the Nation, and the Probable Exhaustion of Our Coal-Mines; Macmillan: London, UK, 1865. [Google Scholar]
-
Khazzoom JD. Economic implications of mandated efficiency in standards for household appliances. Energy J. 1980, 1, 21–40. doi:10.5547/ISSN0195-6574-EJ-Vol1-No4-2. [Google Scholar]
-
Brookes L. The greenhouse effect: The fallacies in the energy efficiency solution. Energy Policy 1990, 18, 199–201. doi:10.1016/0301-4215(90)90145-T. [Google Scholar]
-
Henly J, Ruderman H. Energy saving from the adoption of more efficient appliances: another view. Energy J. 1988, 9, 155–170. [Google Scholar]
-
Saunders HD. The Khazzoom-Brookes postulate and neoclassical growth. Energy J. 1992, 13, 131–148. doi:10.5547/ISSN0195-6574-EJ-Vol13-No4-7. [Google Scholar]
-
Saunders HD. A view from the macro side: Rebound, backfire, and Khazzoom–Brookes. Energy Policy 2000, 28, 439–449. doi:10.1016/S0301-4215(00)00024-0. [Google Scholar]
-
Binswanger M. Technological progress and sustainable development: What about the rebound effect? Ecol. Econ. 2001, 36, 119–132. doi:10.1016/S0921-8009(00)00214-7. [Google Scholar]
-
Hertwich EG. Consumption and the rebound effect: An industrial ecology perspective. J. Ind. Ecol. 2008, 9, 85–98. doi:10.1162/1088198054084635. [Google Scholar]
-
Font Vivanco D, van der Voet E. The rebound effect through industrial ecology’s eyes: A review of LCA-based studies. Int J Life Cycle Assess 2014, 19, 1933–1947. doi:10.1007/s11367-014-0802-6. [Google Scholar]
-
Zink T, Geyer R. Circular economy rebound. J. Ind. Ecol. 2017, 21, 593–602. doi:10.1111/jiec.12545. [Google Scholar]
-
Vernon R. International investment and international trade in the product cycle. Q. J. Econ. 1966, 80, 190–207. doi:10.2307/1880689. [Google Scholar]
-
Alcott B. Jevons’ paradox. Ecol. Econ. 2005, 54, 9–21. doi:10.1016/j.ecolecon.2005.03.020. [Google Scholar]
-
OECD. Global Material Resources Outlook to 2060: Economic Drivers and Environmental Consequences; OECD Publishing: Paris, France, 2019. doi:10.1787/9789264307452-en. [Google Scholar]
-
U.S. Geological Survey (USGS). Mineral Commodity Summaries 2021; U.S. Department of the Interior: Washington, DC, USA, 2021. Available online: https://pubs.usgs.gov/periodicals/mcs2021/mcs2021.pdf (accessed on 1 October 2025). [Google Scholar]
-
Grand View Research. Metal Recycling Market: Size, Share & Trends Analysis Report by Metal Type (Ferrous, Non-Ferrous), by End Use (Automotive, Construction, Shipbuilding, Equipment Manufacturing, Consumer Appliances), by Region, and Segment Forecasts, 2025–2030; Grand View Research: San Francisco, CA, USA, 2021. Available online: https://www.grandviewresearch.com/industry-analysis/metal-recycling-market (accessed on 1 October 2025). [Google Scholar]
-
World Aluminium. Alucycle in World Aluminium. 2020. Available online: https://alucycle.world-aluminium.org/public-access/ (accessed on 6 October 2025). [Google Scholar]
-
Schipper L, Meyers S. Energy Efficiency and Human Activity: Past Trends, Future Prospects; Cambridge University Press: Cambridge, UK, 1992. [Google Scholar]
-
Schipper L, Grubb M. On the rebound? Feedback between energy intensities and energy uses in IEA countries. Energy Policy 2000, 28, 367–388. doi:10.1016/S0301-4215(00)00018-5. [Google Scholar]
-
U.S. Geological Survey. Mineral Commodity Summaries 2025; U.S. Geological Survey: Reston, VA, USA, 2025. doi:10.3133/mcs2025. [Google Scholar]
-
International Copper Study Group (ICSG). The World Copper Factbook 2020. 2020. Available online: https://internationalcopper.org/wp-content/uploads/2021/01/2020_10_13_ICSG_Factbook_2020.pdf (accessed on 5 October 2025). [Google Scholar]
-
International Aluminium Institute (IAI). Global Aluminium Recycling: A Cornerstone of a Sustainable Future. 2020. Available online: https://www.world-aluminium.org (accessed on 6 October 2025). [Google Scholar]
-
London Metal Exchange (LME). Historical Prices for Aluminium and Copper. 2023. Available online: https://www.lme.com (accessed on 6 October 2025). [Google Scholar]
-
OECD. Global Material Resources Outlook to 2060: Policy Scenarios; OECD Publishing: Paris, France, 2022. [Google Scholar]
-
Krautkraemer JA. Nonrenewable resource scarcity. J. Econ. Lit. 1998, 36, 2065–2107. [Google Scholar]
-
Dunning JH. Toward an eclectic theory of international production: Some empirical tests. J. Int. Bus. Stud. 1980, 11, 9–31. doi:10.1057/palgrave.jibs.8490593. [Google Scholar]
-
Dardor D, Flórez-Orrego D, Germanier R, Margni M, Maréchal F. Decarbonizing the aluminium industry: A comprehensive review of pathways and process integration perspectives. Energy Strategy Rev. 2025, 61, 101853. doi:10.1016/j.esr.2025.101853 [Google Scholar]
-
Westmetall. Official LME Prices and Stocks: Copper–Daily Table. Westmetall GmbH. Available online: https://www.westmetall.com/en/markdaten.php (accessed on 5 October 2025). [Google Scholar]
-
Home A. Copper Stocks Surge Offers Little Relief for CME Shorts. Reuters, 2024. Available online: https://www.reuters.com/business/markets/copper-stocks-surge-offers-little-relief-cme-shorts-2024-06-25/ (accessed on 5 October 2025). [Google Scholar]
-
Home A. Copper Squeezed in the United States But China Has Plenty. Reuters, 2024. Available online: https://www.reuters.com/business/markets/copper-squeezed-united-states-china-has-plenty-2024-05-22/ (accessed on 5 October 2025). [Google Scholar]
-
Reuters. China Slashes Mortgage Reference Rates to Revive Property Market. Reuters, 2024. Available online: https://www.reuters.com/markets/asia/china-lowers-mortgage-reference-rate-by-25-basis-points-2024-02-20/ (accessed on 5 October 2025). [Google Scholar]
-
Reuters. China’s State Grid Outlays Record USD 88.7 Billion Investment for 2025. Reuters, 2025. Available online: https://www.reuters.com/business/energy/chinas-state-grid-outlays-record-887-bln-investment-2025-2025-01-15/ (accessed on 5 October 2025). [Google Scholar]
-
Devitt P. Grasberg Mine Accident Tightens Global Copper Supply Estimates. Reuters, 2025. Available online: https://www.reuters.com/world/asia-pacific/grasberg-mine-accident-tightens-global-copper-supply-estimates-2025-09-30/ (accessed on 5 October 2025). [Google Scholar]
-
International Copper Study Group (ICSG). Copper Market Forecast 2025–2026. Press Release, April 2025. Available online: https://icsg.org/download/2025-04-28-icsg-forecast-press-release-pdf (accessed on 4 October 2025) [Google Scholar]
-
Nieves V, Becedas M. La caída en picado del cobre destapa lo que está ocurriendo en China con la economía. elEconomista, May 2023. Available online: https://www.eleconomista.es/mercados-cotizaciones/noticias/12293523/05/23/la-caida-en-picado-del-cobre-destapa-lo-que-esta-ocurriendo-en-china-con-la-economia.html (accessed on 3 October 2025) [Google Scholar]
-
Peterson RD, Tabereaux AT. Aluminum Production. In Treatise on Process Metallurgy: Industrial Processes; Seetharaman S, Ed.; Elsevier: Amsterdam, The Netherlands, 2014; pp. 839–917. [Google Scholar]