Effect of the Temperature within the Building Chamber on the Tensile Strength of TPU and ABS Materials

Effect of the Temperature within the Building Chamber on the Tensile Strength of TPU and ABS Materials
Nguyen Canh Khanh 1 Le Tuan Phuong 1 Le Duc Anh 1 Huynh Nguyen Vinh Phuc 1 Dao Xuan Truong 1 Pham Thi Hong Nga 1,* Nguyen Thanh Tan 1 Nguyen Vinh Tien 2
Received: 29 August 2025 Revised: 10 October 2025 Accepted: 04 November 2025 Published: 17 November 2025

© 2025 The authors. This is an open access article under the Creative Commons Attribution 4.0 International License (https://creativecommons.org/licenses/by/4.0/).
1. Introduction
Fused deposition modeling (FDM), also known as fused filament fabrication (FFF), is the most widely used additive manufacturing technique. FDM was developed in 1989 by Scott Crump, co-founder of Stratasys Inc, Eden Prairie, Minnesota, United States. It was first brought to the market in 1991 by Stratasys Inc. [1] and has since been used extensively across industries such as prosthetics, education, art, and design. FFF uses a thermoplastic material to create 3D products via an extruder that layers the filament until the structure is fully developed. FDM is a cost-effective, flexible, and user-friendly technology that has revolutionized the manufacturing industry. With the FFF technology, printed products can be quickly produced and precisely sized with complex geometries, smooth surface roughness, and high mechanical properties.
The quality of printed products depends not only on the design of the printing product, the material, and the accuracy of the printer, but also on printing process parameters such as printing speed, layer height, nozzle diameter, nozzle temperature, infill density, printing angle, and others. Therefore, many researchers have studied the effects of process parameters on mechanical characteristics and have optimized printing processes for various plastics. Jahar et al. [2] have shown that the best parameter settings for printing PC-ABS material that can achieve better accuracy for printed parts are a layer thickness of 0.127 mm, an air gap of 0.342 mm, a raster angle of 88.918°, a build orientation of 89.122°, a road width of 0.462 mm, and one contour. Another study by Dragos et al. showed that the percentage of filling has a greater influence on the dimensional accuracy of printed PLA parts than does shaft diameter [3]. The print surface roughness is affected by layer thickness [4]. The study found that layer thickness is an optimal process parameter for optimizing TPU fabrication.
Additionally, PEEK-printed samples exhibit better comprehensive mechanical performance, including tensile, flexural, and shear strengths, when printed with a horizontal infill orientation and a 30° raster angle [5]. A layer height of 0.1-0.15 mm provides the best dimensional accuracy and tensile strength for FDM-printed PLA parts [6]. The study showed that, regardless of PLA color, tensile strength decreased with increasing layer thickness. Anubhav et al. [7] found that part orientation directly affects material deposition and layering, thereby enabling cohesive bonding of the deposited material. Horizontally printed parts have better tensile and flexural strength than the vertically printed parts. A study by Adan et al. [8] investigated the effects of infill density, layer count, printing speed, and bed temperature on mechanical properties. The experiment’s results showed that infill density is the most influential parameter. An optimal combination of infill density (75%), 30 layers per part, printing speed (20 mm/s), and bed temperature (100 °C) yielded the best tensile strength for a bi-layered PLA/ABS composite. The zig-zag infill pattern has better tensile and flexural strength than the gyroid infill pattern [9]. This study highlighted the effect of infill patterns in determining the mechanical characteristics of 3D-printed parts. Another study by Karim Elhattab [10] observed that a higher nozzle temperature enhances the tensile strength of PLA-printed parts, with the highest values at 220 °C. The study by other authors [11,12] showed that 45° orientations, 0.3 mm thickness, and normal speed had a significant impact on the tensile strength of the ABS-printed samples. The results of maximum tensile strength for samples with a shell count of 10 have 1.5 times higher values than those containing a shell count of 2. The research results showed that tensile strength, flexural strength, and creep were higher with 10 shells than with 2. Another study by Duong et al. [13] demonstrated the effects of process parameters on mechanical properties. The Taguchi method was applied to determine the effect of printing temperature, infill angle, infill density, and layer thickness on the mechanical properties of TPU samples. The results of the study show that the parameter values that produce the maximum tensile strength are 210 °C nozzle temperature, 45° infill angle, 100% infill density, and a 0.18 mm layer thickness, which provides a better stacking structure than 90°.
Although numerous studies have investigated the process parameters of FDM 3D printing, studies on the effect of chamber temperature on the mechanical properties of printed parts are limited. This study examines the impact of chamber temperature on tensile strength using FDM technology with TPU Filament. The results are analyzed by using the Polynomial Regression method. Then, the printing parameters are optimized to achieve the best possible mechanical properties. Microstructure images of the fracture surface are also considered.
The research by Abraheem et al. [14] demonstrated that ABS printing with the closed printer yielded better surface roughness, whereas the open printer yielded higher tensile strength. The research also found that higher temperatures correspond to lower tensile strength. However, the author only studied one chamber temperature level, using both an open and an enclosed 3D printer. The study by Thumsorn et al. [15] showed that increasing the chamber temperature above 40 °C improved interlayer bonding in PLA-printed products, as evidenced by increased fracture toughness. However, the study considers only hardness, which is insufficient, as high hardness can also reduce the tensile capacity of printed plastic. Therefore, further research is needed on the tensile strength of printed samples at different temperatures. In the study by Yachen et al. [16], ambient temperatures are set at 50 °C, 65 °C, and 80 °C, respectively. The results show that nozzle and ambient temperatures are closely related to mechanical properties. Within the test temperature range, 80 °C yields the maximum tensile strength. Nevertheless, the room temperature was not taken into consideration in this study.
This research project aims to investigate the influence of chamber temperature on the tensile strength of TPU and ABS printed parts produced via FDM. It contributes to providing a feasible solution for the fabrication and production of parts formed using FDM additive manufacturing. The research results can be applied to the manufacturing of tensile components from 3D-printed materials. They can also serve as references for research groups and design engineers when selecting technology parameters that align with product requirements and quality standards.
2. Materials and Methods
TPU is a type of polyurethane plastic belonging to the thermoplastic elastomer family. It is elastic, like rubber, but also strong, like plastic. TPU has many properties, including elasticity, transparency, and resistance to oil, grease, and abrasion. TPU’s flexibility and durability make it suitable for a wide range of applications, including medical devices, sports equipment, robotics, and functional prototypes. ABS material structure: ABS, with the chemical formula (C8H8·C4H6·C3H3N)n, is a common thermoplastic.
The printed sample for the tensile strength test was designed using 3D design software, with dimensions in accordance with ASTM D638 (Type IV), as shown in Figure 1. The pulling speed is 5 mm/min.
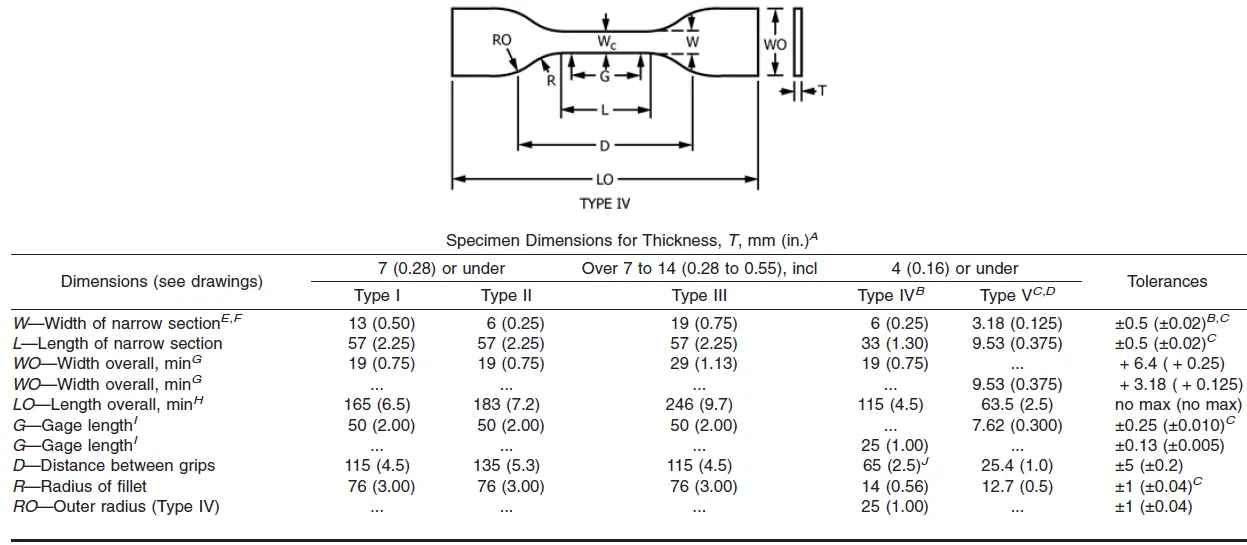
Figure 1. Design of 3D printed sample according to ASTM D638 (unit: mm). A:Thickness, T, shall be 3.2 ± 0.4 mm (0.13 ± 0.02 in.) for all types of molded specimens, and for other Types I and II specimens where possible. If specimens are machined from sheets or plates, thickness, T, shall be the thickness of the sheet or plate provided this does not exceed the range stated for the intended specimen type. For sheets of nominal thickness greater than 14 mm (0.55 in.) the specimens shall be machined to 14 ± 0.4 mm (0.55 ± 0.02 in.) in thickness, for use with the Type III specimen. For sheets of nominal thickness between 14 and 51 mm (0.55 and 2 in.) approximately equal amounts shall be machined from each surface. For thicker sheets both surfaces of the specimen shall be machined, and the location of the specimen with reference to the original thickness of the sheet shall be noted. Tolerances on thickness less than 14 mm (0.55 in.) shall be those standard for the grade of material tested. B: For the Type IV specimen, the internal width of the narrow section of the die shall be 6.00 ± 0.05 mm (0.250 ± 0.002 in.). The dimensions are essentially those of Die C in Test Methods D412. C: The Type V specimen shall be machined or die cut to the dimensions shown, or molded in a mold whose cavity has these dimensions. The dimensions shall be:W = 3.18 ± 0.03 mm (0.125 ± 0.001 in.), L = 9.53 ± 0.08 mm (0.375 ± 0.003 in.), G = 7.62 ± 0.02 mm (0.300 ± 0.001 in.), and R = 12.7 ± 0.08 mm (0.500 ± 0.003 in.). The other tolerances are those in the table. D: Supporting data on the introduction of the L specimen of Test Method D1822 as the Type V specimen are available from ASTM Headquarters. Request RR:D20-1038. E:The tolerances of the width at the center Wc shall be +0.00 mm, −0.10 mm ( +0.000 in., −0.004 in.) compared with width W at other parts of the reduced section. Any reduction in W at the center shall be gradual, equally on each side so that no abrupt changes in dimension result. F: For molded specimens, a draft of not over 0.13 mm (0.005 in.) is allowed for either Type I or II specimens 3.2 mm (0.13 in.) in thickness. See diagram below and this shall be taken into account when calculating width of the specimen. Thus a typical section of a molded Type I specimen, having the maximum allowable draft, could be as follows: G: Overall widths greater than the minimum indicated are used for some materials in order to avoid breaking in the grips. H: Overall lengths greater than the minimum indicated are used for some materials to avoid breaking in the grips or to satisfy special test requirements. I: Test marks or initial extensometer span. J: When self-tightening grips are used, for highly extensible polymers, the distance between grips will depend upon the types of grips used and may not be critical if maintained uniform once chosen.
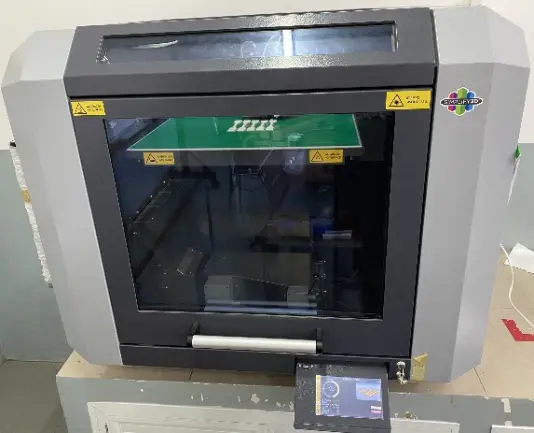
The printed samples were produced with an X500 3D printer (German RepRap company, Feldkirchen, Germany), as shown in Figure 2, and printing parameters were chosen based on previous studies with three different chamber temperatures, as shown in Table 1.
 |
 |
|
(a) |
(b) |
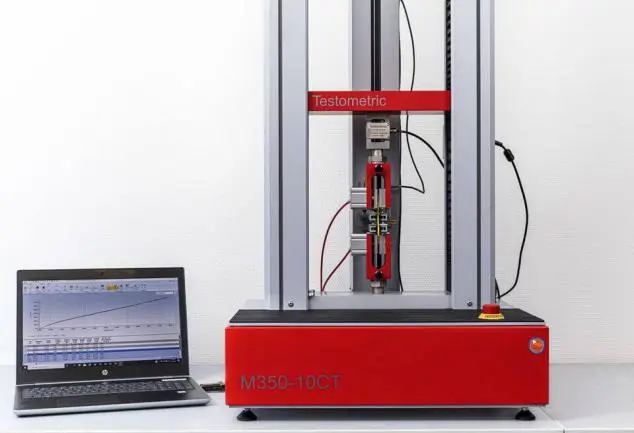
Figure 2. (a) FDM X500 printer for printing samples; (b) M350-10CT testing machine for tensile test.
Table 1. 3D printing parameters of TPU and ABS.
|
Layer Height (mm) |
Infill Percentage (%) |
Nozzle Temperature (°C) |
Bed Temperature (°C) |
Printing Speed (mm/s) |
Outline Shells |
|
|---|---|---|---|---|---|---|
|
TPU |
0.25 |
100 |
230 |
60 |
40 |
3 |
|
ABS |
0.25 |
100 |
240 |
110 |
40 |
3 |
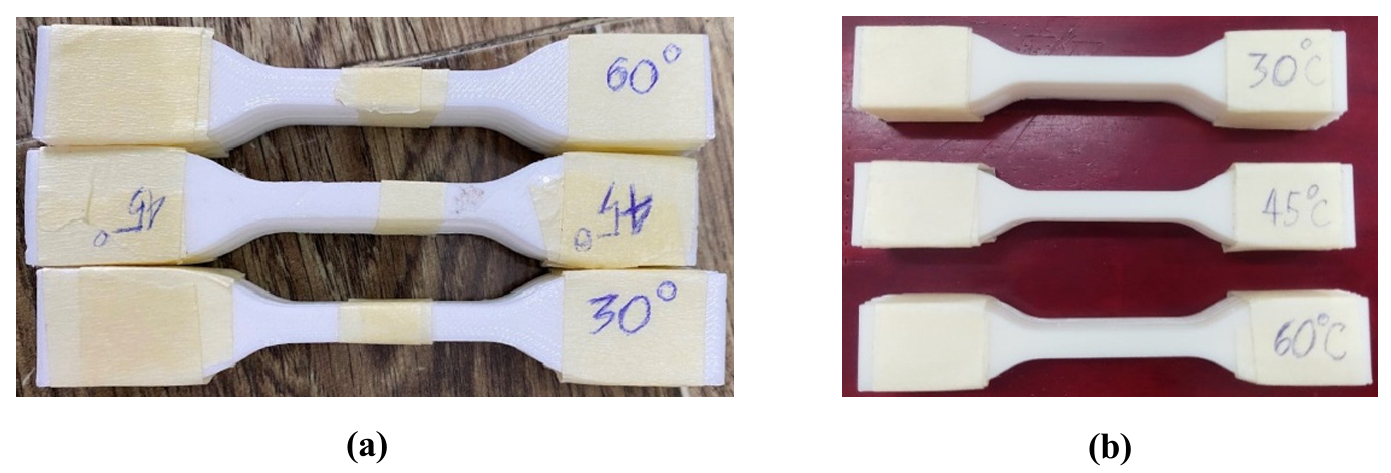
Five samples will be printed at each chamber temperature and tested for tensile strength using the M350-10CT Testing Machine (Figure 2b) to obtain stress values. The M350-10CT tensile tester is manufactured by Testometric Co., Ltd. (The Testometric Company Limited) from Rochdale, Lancashire, in the United Kingdom (England). Figure 3 shows the TPU and ABS samples after FDM printing.
3. Results
3.1. Tensile Strength between ABS and TPU Materials
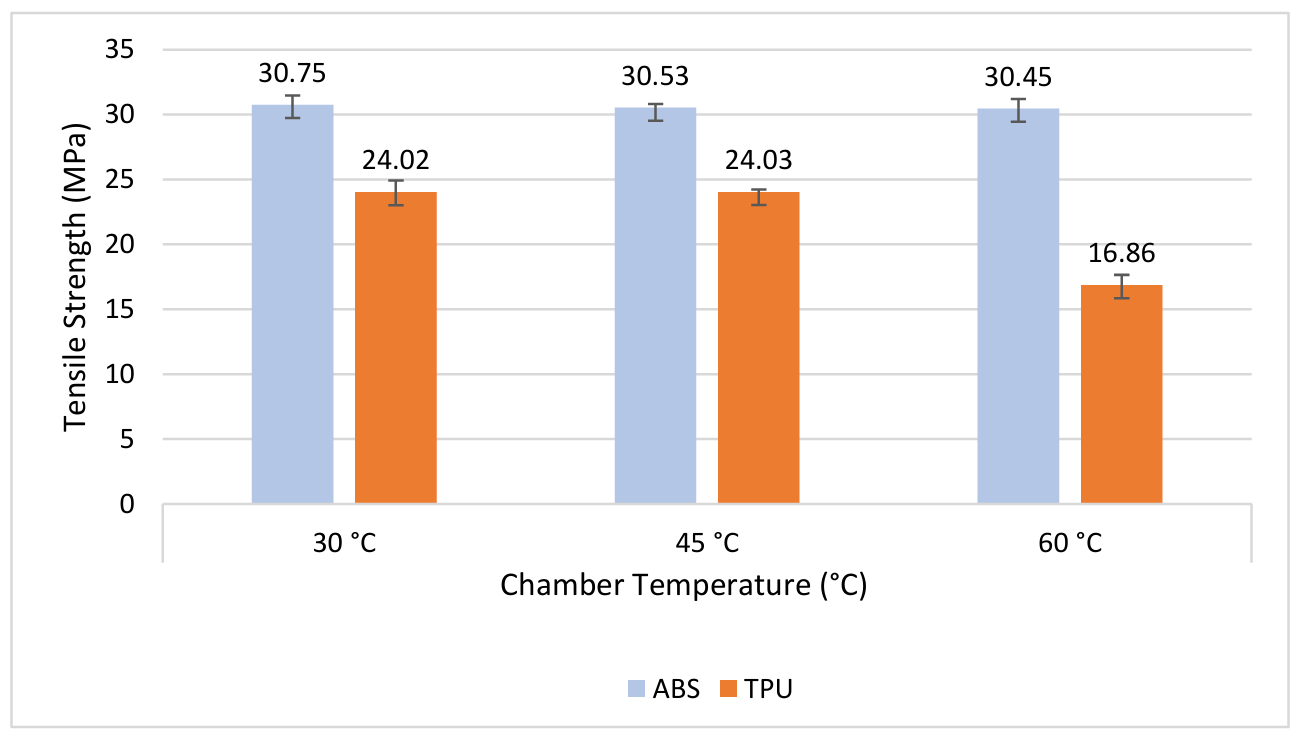
Table 2 and the graph in Figure 4 show that as the chamber temperature increases, the tensile strengths of ABS and TPU decrease. However, the tensile strength of ABS decreases only slightly across the chamber temperature range, while TPU strength increases at 45 °C compared with 30 °C, then drops sharply at 60 °C. The graph also shows that at the same chamber temperature, ABS has higher tensile strength than TPU. At a 30 °C chamber, the tensile strength of ABS is 30.75 MPa, higher than that of TPU (24.02 MPa). At 45 °C, the tensile strength of ABS is 30.53 MPa higher than TPU (20.03 MPa). Moreover, at 60 °C, the tensile strength of TPU is 13.59 MPa lower than that of ABS.
Table 2. Tensile strength of ABS and TPU at different chamber temperatures.
|
Tensile Strength of ABS |
Tensile Strength of TPU |
||||||
|---|---|---|---|---|---|---|---|
|
Sample |
Chamber Temperature |
Sample |
Chamber Temperature |
||||
|
30 °C |
45 °C |
60 °C |
30 °C |
45 °C |
60 °C |
||
|
1 |
30.28 |
30.14 |
31.00 |
1 |
24.01 |
23.75 |
17.55 |
|
2 |
31.07 |
30.38 |
31.08 |
2 |
24.04 |
24.38 |
17.80 |
|
3 |
29.89 |
31.00 |
30.62 |
3 |
23.25 |
24.00 |
15.62 |
|
4 |
31.99 |
30.78 |
30.59 |
4 |
23.13 |
23.98 |
16.33 |
|
5 |
30.51 |
30.34 |
28.98 |
5 |
25.67 |
24.05 |
16.99 |
|
Average |
30.75 |
30.53 |
30.45 |
Average |
24.02 |
24.03 |
16.86 |
|
Standard deviation |
0.82 |
0.35 |
0.85 |
Standard deviation |
1.01 |
0.19 |
0.93 |
According to the study by Nguyen et al. [17], the printing environment temperature strongly influences the mechanical properties of ABS printed samples using FDM technology. Their study results show that, for the ABS-printed sample to have the best mechanical properties, the printing environment temperature should be between 30 °C and 45 °C. On the other hand, the study by Truong et al. [18] demonstrated that chamber temperature significantly influences the mechanical properties of TPU printed by FDM. The flexural strength of TPU decreased as the chamber temperature increased from 30 °C to 60 °C, with the optimal strength at 30 °C. In addition, several other studies have examined the printing environment temperature; however, they primarily focus on PLA and PEEK materials [15,16].
From Table 3 and Figure 5, it can be seen that the elastic modulus of ABS increases with increasing chamber temperature. On the other hand, the elastic modulus of TPU decreases with increasing chamber temperature. Additionally, when comparing the two materials, ABS consistently exhibits a higher elastic modulus than TPU.
Table 3. Elastic modulus of ABS and TPU at different chamber temperatures.
|
Elastic Modulus of ABS |
Elastic Modulus of TPU |
||||||
|---|---|---|---|---|---|---|---|
|
Sample |
Chamber Temperature |
Sample |
Chamber Temperature |
||||
|
30 °C |
45 °C |
60 °C |
30 °C |
45 °C |
60 °C |
||
|
1 |
259.11 |
253.87 |
260.16 |
1 |
106.54 |
104.83 |
83.57 |
|
2 |
257.48 |
262.77 |
270.29 |
2 |
106.54 |
101.67 |
74.12 |
|
3 |
250.21 |
266.45 |
269.08 |
3 |
88.69 |
102.26 |
67.49 |
|
4 |
265.71 |
264.02 |
269.53 |
4 |
104.20 |
106.72 |
69.10 |
|
5 |
259.51 |
269.14 |
264.01 |
5 |
109.40 |
94.99 |
76.15 |
|
Average |
258.40 |
263.25 |
266.61 |
Average |
103.07 |
102.09 |
74.09 |
|
Standard deviation |
5.55 |
5.78 |
4.37 |
Standard deviation |
7.38 |
3.99 |
5.70 |
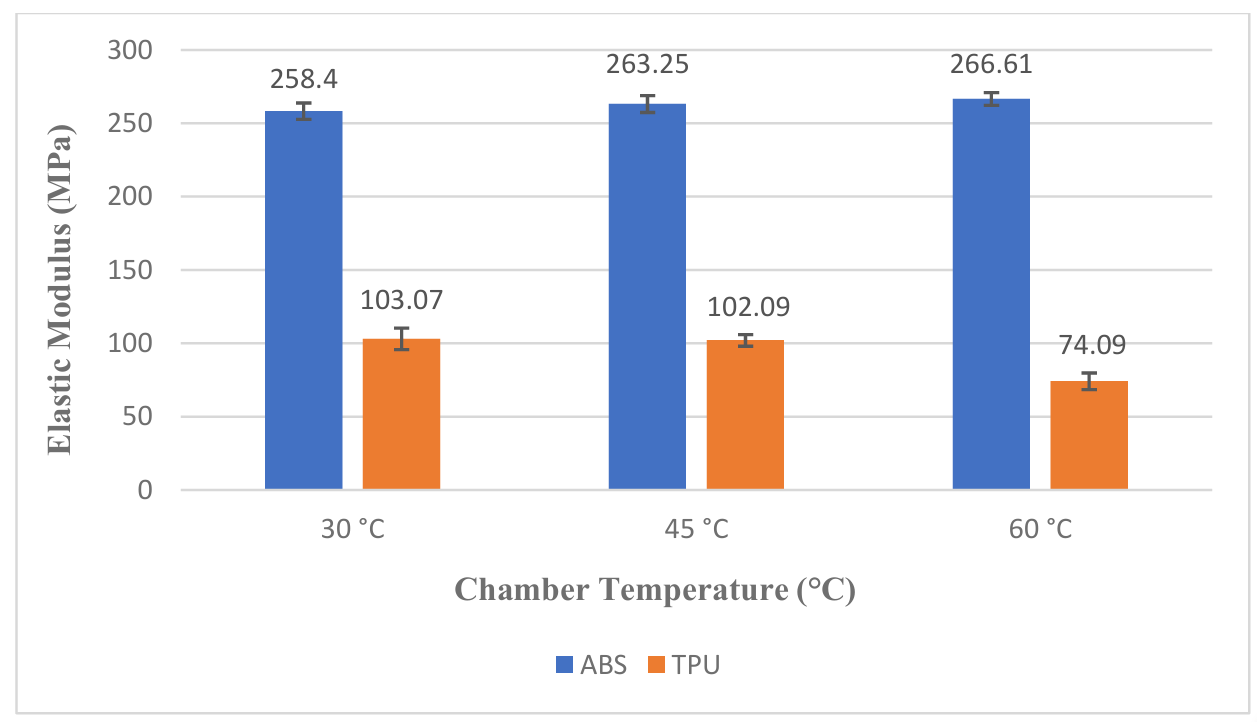
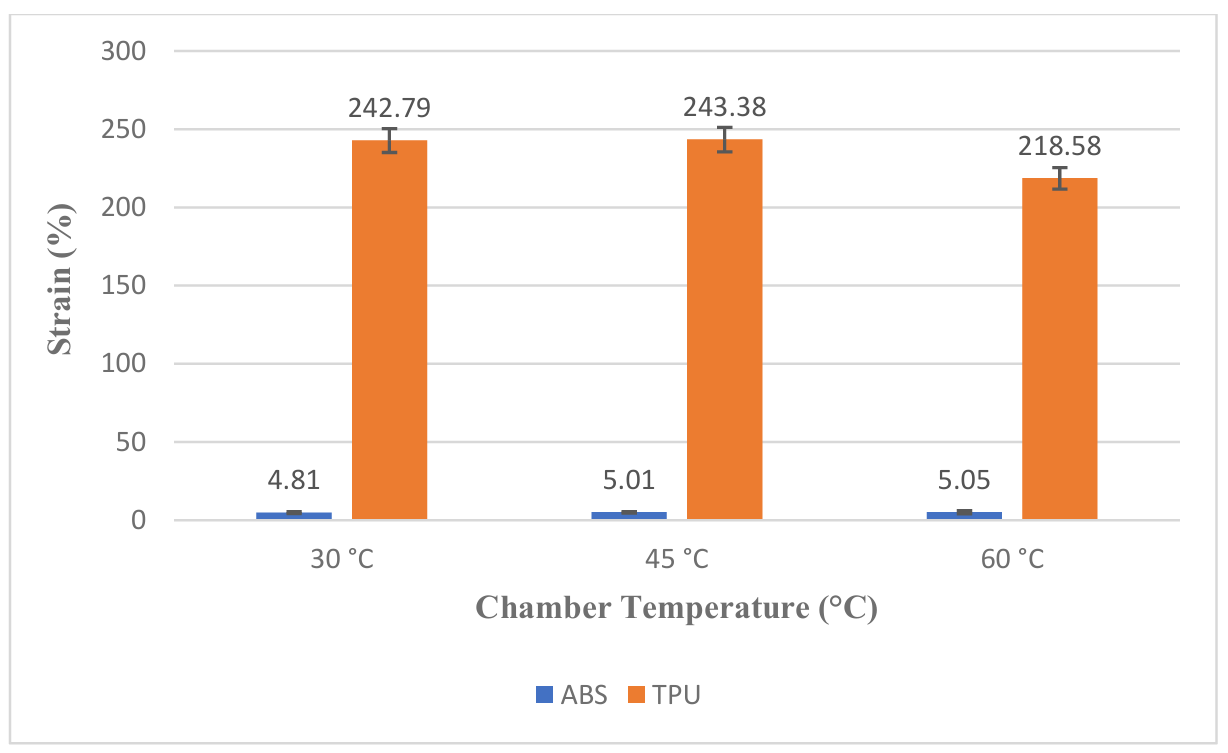
Table 4 and Figure 6 exhibit that for ABS, strain increases with increasing chamber temperature. For TPU, the strain first increases as the chamber temperature rises from 30 °C to 45 °C, but then drops sharply at 60 °C. It can be seen that ABS samples printed at higher chamber temperatures demonstrate higher tensile strain, resulting in lower tensile strength and greater deformation. In contrast, TPU samples printed at higher chamber temperatures become less elastic and break more readily because elevated temperatures alter their stretch properties. A study by Abraheem et al. [14] also showed that printers with a closed chamber, which keeps a higher chamber temperature, reduce the tensile strength of printed parts. This study focuses on tensile strength and demonstrates that increasing the chamber temperature can enhance interlayer adhesion and improve tensile performance, particularly for TPU and ABS materials. This difference suggests that chamber temperature affects each mechanical property differently—higher temperatures may enhance tensile bonding strength by improving layer fusion.
Table 4. Tensile strain of ABS and TPU at different chamber temperatures.
|
Tensile Strain of ABS |
Tensile Strain of TPU |
||||||
|---|---|---|---|---|---|---|---|
|
Sample |
Chamber Temperature |
Sample |
Chamber Temperature |
||||
|
30 °C |
45 °C |
60 °C |
30 °C |
45 °C |
60 °C |
||
|
1 |
5.10 |
4.64 |
5.94 |
1 |
243.20 |
237.97 |
223.52 |
|
2 |
4.91 |
5.78 |
5.78 |
2 |
246.34 |
253.47 |
221.23 |
|
3 |
4.31 |
4.67 |
5.43 |
3 |
241.33 |
233.59 |
205.95 |
|
4 |
5.47 |
5.17 |
3.54 |
4 |
229.83 |
240.07 |
217.01 |
|
5 |
4.27 |
4.77 |
4.56 |
5 |
253.26 |
251.80 |
225.21 |
|
Average |
4.81 |
5.01 |
5.05 |
Average |
242.79 |
243.38 |
218.58 |
|
Standard deviation |
0.52 |
0.48 |
1.00 |
Standard deviation |
7.65 |
7.86 |
6.89 |
3.2. Microstructure
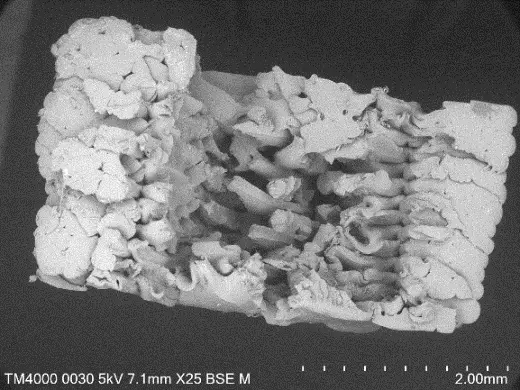
Figure 7 shows the microstructure of the ABS impact test sample. It can be seen that, at chamber temperatures of 30 °C and 45 °C, the bonding between layers is excellent. However, when the chamber temperature increases to 60 °C, the layer bonding is no longer perfect. A clear separation or delamination between layers is visible. Strong bonding between layers improves the tensile strength of the printed sample.
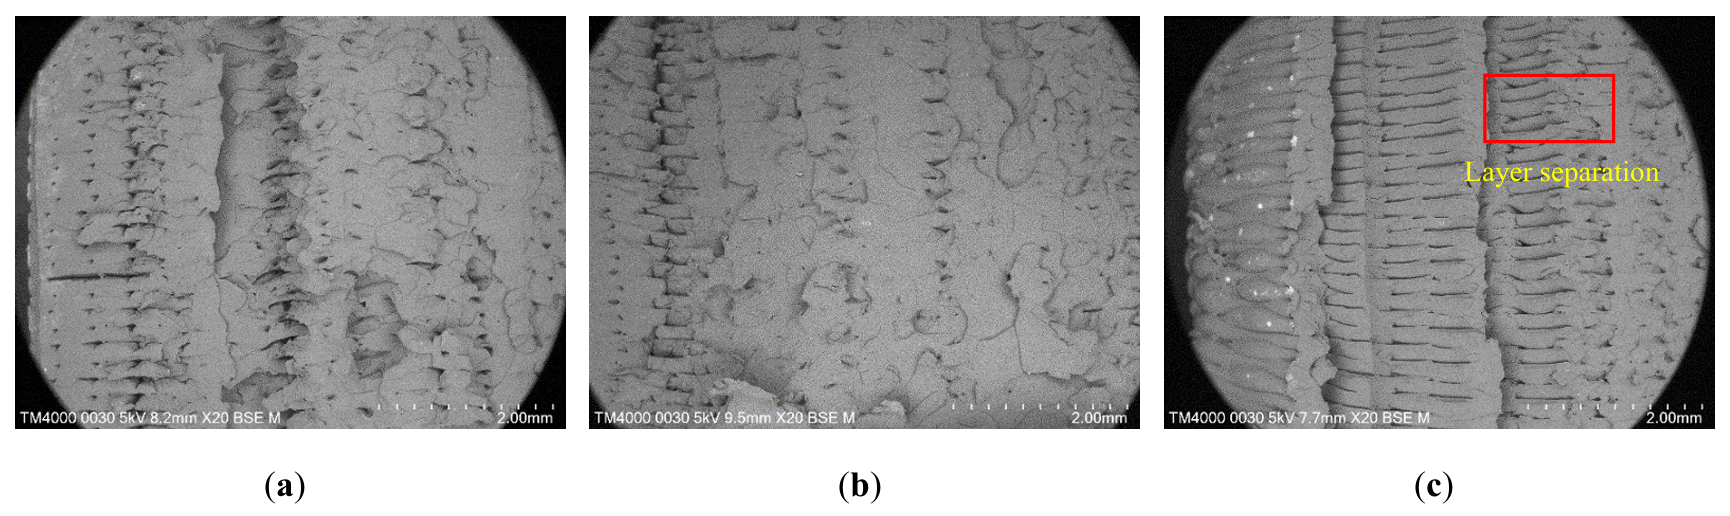
Figure 7. Microstructure of ABS impact sample at different chamber temperatures. (a) Samples printed at 30 °C; (b) Samples printed at 45 °C; (c) Samples printed at 60 °C.
At the same time, the microstructure images show that samples printed at 60 °C exhibit more delamination and larger gaps than those printed at 30 °C and 45 °C. The study by Supaphorn et al. [15] also showed that higher printing temperatures improve layer bonding. However, the SEM images above show that higher chamber temperature also causes delamination. Interestingly, the delaminated samples show higher hardness.
Therefore, it can be concluded that strong layer bonding improves the tensile strength of ABS-printed samples but reduces impact resistance and hardness [14,19]. Figure 7 shows the cross-sections of samples printed at chamber temperatures of 30 °C, 45 °C, and 60 °C. In this figure, the label “layer separation” only marks the boundary between layers, not a fundamental defect. At 30 °C and 45 °C, the layers come into close contact, and the boundaries appear smooth and continuous. This result means the bonding between layers is strong. However, at 60 °C, a clear gap forms between the layers, indicating that absolute separation (delamination) has occurred.
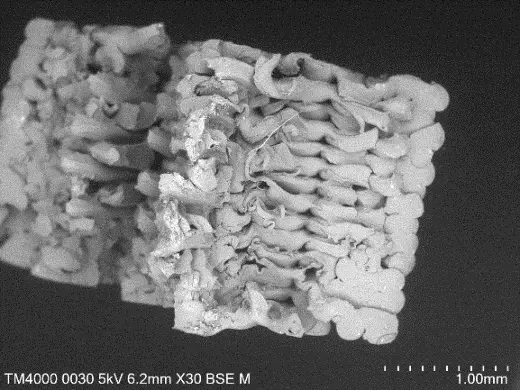
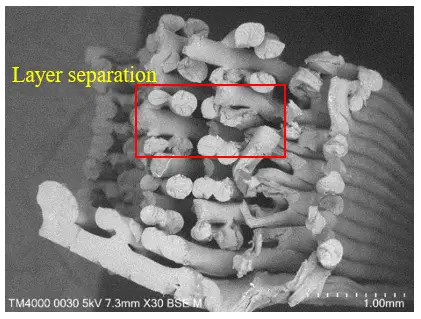
Figure 8 shows the microstructure image of the printed samples. It can be seen that the interlayer bonding is in perfect condition at 30 °C and 45 °C, especially at 45 °C. However, when the samples were printed at 60 °C, the interlayer bonding was found to be poor. The plastic fibers are not strongly bonded to each other; instead, there is a separation between them, leading to weaker interlayer bonding and reduced resistance to tensile stress. Hence, it can be seen that a higher chamber temperature increases interlayer adhesion, but exceeding a specific limit can cause layer separation.
 |
 |
 |
| (a) | (b) | (c) |
Figure 8. Microstructure of tensile-tested TPU specimens at different chamber temperatures. (a) Samples printed at 30 °C; (b) Samples printed at 45 °C; (c) Samples printed at 60 °C.
Figure 8 shows the microstructure of TPU tensile samples. The bonding between printed TPU layers at different chamber temperatures is quite similar to that of ABS. The layer bonding is in good condition at both 30 °C and 45 °C, with stronger bonding at 45 °C. However, when TPU samples are printed at 60 °C, the layer bonding becomes very weak. The filaments do not tightly connect; instead, they are separated and cannot form a solid block at 30 °C or 45 °C. This result indicates weaker bonding between layers under tensile force.
It can be observed that as the chamber temperature increases from 30 °C to 45 °C, adhesion between the TPU layers improves. Nevertheless, if the chamber temperature exceeds 45 °C, it may cause delamination and reduce the sample's tensile strength. A study by Duong et al. [13] also demonstrated that printing temperature significantly affects the shrinkage and mechanical properties of TPU, particularly tensile strength and elastic modulus. The printing temperature alters the bonding ratio between the printed filaments. At a certain level, higher temperature makes it easier for the layers to bond, which increases interlayer strength. However, excessively high printing temperatures can damage polymer molecular chains, resulting in weaker mechanical properties [20]. In Figure 8, the lines labeled “layer separation” show only layer boundaries, not actual cracks or defects. A perfect interlayer bonding means the printed layers are well joined together, with no significant gaps or no real detect between them. It can be seen that the interlayer bonding is in perfect condition at 30 °C and 45 °C, especially at 45 °C. However, when the samples were printed at 60 °C, the interlayer bonding was found to be poor.
4. Conclusions
The study’s results demonstrate that the effect of the building chamber temperature on the mechanical properties of 3D-printed samples using FFF technology is highly significant. As the building chamber temperature increases, the tensile strength of both ABS and TPU materials tends to decrease. The tensile strength of ABS material decreases insignificantly across the building chamber temperature levels. However, the tensile strength of TPU material increases at a building chamber temperature of 45 °C compared to 30 °C, but decreases sharply at 60 °C. At the same temperature, ABS material has higher tensile strength than TPU. The results show that to achieve the best tensile strength in 3D-printed samples, the building chamber temperature should be between 30 °C and 45 °C for both TPU and ABS.
Statement of the Use of Generative AI and AI-Assisted Technologies in the Writing Process
During the preparation of this work, the authors used Grammarly to improve readability and language. After using this tool, the authors reviewed and edited the content as needed and took full responsibility for the publication's content.
Acknowledgments
We acknowledge Ho Chi Minh City University of Technology and Education, Dong Nhan Phat Co., Ltd., and Material Testing Laboratory (HCMUTE). They allowed us to join their team and access the laboratory and research machines. With their appreciated support, it is possible to conduct this research.
Author Contributions
Conceptualization, N.C.K. and L.T.P.; Methodology, P.T.H.N.; Software, L.D.A., H.N.V.P. and D.X.T.; Validation, L.D.A., H.N.V.P. and D.X.T.; Formal Analysis, N.C.K., L.T.P.; Resources, N.V.T. and N.T.T.; Data Curation, N.V.T. and N.T.T.; Writing—Original Draft Preparation, N.C.K., L.T.P.; Writing—Review & Editing, P.T.H.N.; Visualization, P.T.H.N.; Supervision, P.T.H.N.; Project Administration, P.T.H.N. and N.T.T.
Ethics Statement
Not applicable.
Informed Consent Statement
Not applicable.
Data Availability Statement
The data used to support the findings of this study are available from the corresponding author upon request.
Funding
This work belongs to the project in 2026 funded by Ho Chi Minh City University of Technology and Education, Vietnam.
Declaration of Competing Interest
Authors declare that we have no competing interests.
References
-
Ngoc NV, Khai NK, Tung NV, Tien VX, Tan NT, Thien TN, et al. A Review of the Mechanical of SLA 3D Printing Materials: Printing Orientations and Photopolymerization Technology. In Proceedings of the International Conference on Advanced Mechanical Engineering, Automation, and Sustainable Development 2021 (AMAS2021); Lecture Notes in Mechanical Engineering; Springer: Cham, Switzerland, 2022. doi:10.1007/978-3-030-99666-6_95. [Google Scholar]
-
Mohamed OA, Masood SH, Bhowmik JL. Optimization of fused deposition modeling process parameters for dimensional accuracy using I-optimality criterion. Measurement 2015, 81, 174–196. doi:10.1016/j.measurement.2015.12.011. [Google Scholar]
-
Zisopol DG, Iacob DV, Minescu M. A Theoretical-Experimental Study on the Influence of FDM Paramters on the Dimensions of Cylindrical Spur Gears Made of PLA. Eng. Technol. Appl. Sci. Res. 2023, 13, 10471–10477. doi:10.48084/etasr.5733. [Google Scholar]
-
Hasdiansah H, Yaqin RI, Pristiansyah P, Umar ML, Priyambodo BH. FDM-3D printing parameter optimization using Taguchi approach on surface roughness of thermoplastic polyurethane parts. Int. J. Interact. Des. Manuf. (IJIDeM) 2023, 17, 3011–3024. doi:10.1007/s12008-023-01304-w. [Google Scholar]
-
Gao S, Liu R, Xin H, Liang H, Wang Y, Jia J. The Surface Characteristics, Microstructure and Mechanical Properties of PEEK Printed by Fused Deposition Modeling with Different Raster Angles. Polymers 2021, 14, 77. doi:10.3390/polym14010077. [Google Scholar]
-
Frunzaverde D, Cojocaru V, Bacescu N, Ciubotariu CR, Miclosina CO, Turiac RR, et al. The Influence of Layer Height and Filament Color on the Dimensional Accuracy and the Tensile Strength of FDM-Printed PLA Specimens. Polymers 2023, 15, 2377. doi:10.3390/polym15102377. [Google Scholar]
-
Anubhav, Kumar R, Nandi SK, Agrawal A. Influence of Build Orientation on Tensile and Flexural Strength of FDM Fabricated ABS Component. In Advances in Additive Manufacturing and Metal Joining: Proceedings of AIMTDR 2021; Springer: Singapore, 2023; pp. 177–187. doi:10.1007/978-981-19-7612-4_15. [Google Scholar]
-
Rasheed A, Hussain M, Ullah S, Ahmad Z, Kakakhail H, Riaz AA, et al. Experimental Investigation and Taguchi Optimization of FDM process parameters for the Enhancement of Tensile properties of Bi-Layered printed PLA-ABS. Mater. Res. Express 2023, 10, 095307. doi:10.1088/2053-1591/acf1e7. [Google Scholar]
-
Yadavalli VR, Myadam AK, Telu SB. FDM 3D-Print on thermoplastic polyurethane (TPU) with different process parameters using gyroid and zigzag infill patterns. Open Access Libr. J. 2023, 11, 1–15. doi:10.4236/oalib.1111203. [Google Scholar]
-
Elhattab K, Bhaduri SB, Sikder P. Influence of Fused Deposition Modeling Nozzle Temperature on the Rheology and Mechanical Properties of 3D Printed β-Tricalcium Phosphate (TCP)/Polylactic Acid (PLA) Composite. Polymers 2022, 14, 1222. doi:10.3390/polym14061222. [Google Scholar]
-
Ahmad MN, Yahya A. Effect of 3D Printing Parameters on Mechanial Properties of ABS Samples. Designs 2023, 7, 136. doi:10.3390/designs7060136. [Google Scholar]
-
Szot W, and Mateusz R. Effect of the Number of Shells on Selected Mechanical Properties of Parts Manufactured by FDM/FFF Technology. Adv. Mater. Sci. 2024, 24, 1, 86–103. doi:10.2478/adms-2024-0006. [Google Scholar]
-
Le D, Nguyen CH, Pham THN, Nguyen VT, Pham SM, Le MT, et al. Optimization 3D Pringting Process Parameters for the Tensile Strength of Thermoplastic Polyurethane Plastic. J. Mater. Eng. Perform. 2021, 32, 10805–10816. doi:10.1007/s11665-023-07892-8. [Google Scholar]
-
Hadeeyah A, Kessentini A, Alhadar F, Emhemed IAF, Wali M, Masmoudi NK. The Effect of Ambient Temperature on the Quality of Three-Dimensional Printer Products in FDM Techonology for ABS Material. 2023. Available online: https://www.researchgate.net/publication/370770766_The_effect_of_ambient_temperature_on_the_quality_of_three-dimensional_printer_products_in_FDM_technology_for_ABS_material (accessed on 15 March 2023). [Google Scholar]
-
Thumsorn S, Prasong W, Ishigami A, Kurose T, Kobayashi Y, Ito H. Influence of Ambient Temperature and Crystalline Structure on Frature Toughness and Production of Thermoplastic by Enclosure FDM 3D Printer. J. Manuf. Mater. Process. 2023, 7, 44. doi:10.3390/jmmp7010044. [Google Scholar]
-
Zhao Y, Zhao K, Li Y, Chen F. Mechanical characterization of biocompatible PEEK by FDM. J. Manuf. Process. 2020, 56, 28–42. doi:10.1016/j.jmapro.2020.04.063. [Google Scholar]
-
Cuc NT, Nam ND, Son NH, Gin LA, Nga PTH. Effect of Environmental Temperature on the Tensile Strength of ABS Plastic Utilizing FDM Technology. Mechatronics and Automation Technology. In Series Advances in Transdisciplinary Engineering Ebook Volume 64: Mechatronics and Automation Technology; IOS Press: Amsterdam, The Netherlands, 2024. doi:10.3233/ATDE241266. [Google Scholar]
-
Phuc TH, Phuc HN, Nga PTH, Tan NT, Tien NV, Duong L, et al. The Effect of Chamber Temperature on the Flexural Strength of Thermoplastic Polyurethane Plastic via FDM Technology. In Chapter 8 of Book: Multi-Criteria Decision-Making and Optimum Design with Machine Learning; CRC Press: Boca Raton, FL, USA, 2024; pp. 97–106; ISBN 9781032635170. [Google Scholar]
-
Samy AA, Golbang A, Harkin-Jones E, Archer E, Dahale M, McIlhagger A. Influence of ambient temperature on part distortion: A simulation study on amorphous and semi-crystalline polymers. Polymers 2022, 14, 879. doi:10.3390/polym14050879. [Google Scholar]
-
Shakeria Z, Benfriha K, Zirak N, Shirinbayan M. Optimization of FFF Processing Parameters to Improve Geometrical Accuracy and Mechanical Behavior of Polyamide 6 Using Grey Relational Analysis (GRA), Available online: https://www.researchsquare.com/article/rs-1118150/v1 (accessed on 20 December 2021). [Google Scholar]