Electrical Characterization, Optical Micrographs, and the Compositional Analyses of Al-Glass/C-Glass Composites

Electrical Characterization, Optical Micrographs, and the Compositional Analyses of Al-Glass/C-Glass Composites
Received: 15 May 2025 Revised: 30 May 2025 Accepted: 07 August 2025 Published: 14 October 2025

© 2025 The authors. This is an open access article under the Creative Commons Attribution 4.0 International License (https://creativecommons.org/licenses/by/4.0/).
1. Introduction
Materials science plays a vital role in the era of new developments in science and technology, meeting the demand for various kinds of materials used in electrical, mechanical, and electronic industries, housing, transportation, and construction. This demand encouraged a scientific increase in the investigation levels of semiconductor thin film and bulk resistors used in transformers. The specimen slides have been useful for substrate thin film deposition. This is one of the reasons for the choice of glass in this experiment [1,2]. An aluminum material was used as a buffer layer for carbon nanotube growth. It produced the finest and highest multi-layered nanotube growth, depending on the thickness of the buffer layer on the glass substrate [3]. Carbon is commonly used to produce resistors for electronic devices in home usage and industrial applications [4,5,6]. These have formed the major selection of materials for bulk appliances.
The combined electrical properties exhibited by these composites, which cannot be attained in any of the constituent materials alone, make them valuable for use in many applications such as sensors, resistors, transducers, electromagnetic shielding [7,8,9], and wear-resistant materials for cutting tools [10,11,12]. One of the requirements for achieving a good composite is the electrical stability and compatibility between the constituent metallic and glass phase [13,14,15]. If the applications of a good electrical property of the composites are of interest, the composite material is mostly combined with a suitable electrically conductive metallic phase.
Ceramic materials tested and used are alumina, carbides, nitrides, silicates, and titanates [16]. Due to the unique electrical stability and plasticity, the red and white clay materials have been used to manufacture ceramic products [16,17].
The general fabrication process of glass/metal and ceramic/metal matrix composites involves compacting the powders of the conducting and insulating constituents with a liquid binder under pressure. The samples were fired to investigate electrical properties at increasing temperatures [18]. The sample is formed at a constant pressure of 30 MPa to avoid fracture, kink, and rupture. This compaction process initiates interatomic reaction, interaction, and bonding between the constituent materials in forming a solid structure. Thus, the final electrical properties depend on the processing conditions. For instance, several transformations of elemental composition occur within the materials, which change the density of the composites [19,20]. Adjusting the electrical properties to meet specific needs involves the selection of compaction pressure, Particle size, and composition. The investigation of the electrical resistance of Carbon-Glass composites is noted. The current and voltage relationship of Al-Glass composites at constant pressure and the same particle size was reported. The display of resistance in Carbon-Glass composites with carbon composition and the current-voltage relation in Al-Glass composites were also considered. Moreover, the composites for industrial purposes were proposed.
2. Experimental Procedure
Aluminum and carbon powders of 100 µm particle size with a purity level of 99.95% were obtained from British Drug House (BDH), UK. A sodium silicate liquid of purity level 99.50% was also obtained from China. Specimen slides of laboratory standard (25.4 mm × 76.2 mm × 1 mm) were used in the study. The specimen slides were treated with detergent and cleaned in distilled water to remove unwanted stains. The rock laboratory ball milling machine was used to pulverize the specimen slide into powdered form and further sieved into 100 µm particle size with an appropriate mesh. The sodium silicate was used as the binder for the Al-Glass and Carbon-Glass composites. The dimensions of Aluminum-Glass and Carbon-Glass composites are 34 mm × 35 mm × 20 mm. The formulas for mixing are AlxGlass100-x and CarbonxGlass100-x. The percentages of Al and Carbon in the composites range from 10, 20, 30, 40, & 50% weight. The samples were molded at a pressure of 30 MPa. After mixing, the composite samples were subjected to compaction. The samples were molded at the mechanical section of the Centre for Energy Research and Development (CERD) at Obafemi Awolowo University. Resistance measurements of samples were obtained with a Maxtech Digital Multimeter (Suder model SD9208A).
The DC resistance measurements on these composites were carried out by a two-point probe technique using graphite electrodes and a digital multimeter. Good electrical contact between the graphite electrodes and the ends of the composites was assured by depositing small drops of conducting silver paste on the ends of the compact composites. The Proton Induced X-ray Emission (PIXE) and Rutherford Back Scattering (RBS) of samples were obtained from CERD. The current-voltage values of the samples were obtained from the Keithley electrical measuring device at the Electrical Material Development Institute EMDI, Akure. All electrical measurements were carried out at room temperature.
3. Results and Discussion
Table 1 shows the results of the I-V characterization of Al-Glass composites at a constant pressure of 30 MPa, with particle sizes of 100 µm. The electrical properties of the bulk samples are contained in Table 2. The results also showed other bulk samples subjected to a constant pressure of 30 MPa at 100 µm. Tables 3–7 contain the Proton Induced X-ray Emission results and Rutherford Back Scattering of the samples at constant pressure for a particle size of 100 µm for both powdered and solid materials. In Tables 3–7, it was observed that silicon takes the lead of all the elements in Carbon-Glass Composites.
Table 1. I-V Characteristics of Al-Glass Composites at a pressure of 30 MPa at 27 °C and 100 µm.
|
Current I (µA) |
Voltage (Volts) |
||||
|---|---|---|---|---|---|
|
Al10Glass90 |
Al20Glass80 |
Al30Glass70 |
Al40Glass60 |
Al50Glass50 |
|
|
0 |
−0.30 |
−0.4 |
−0.38 |
−0.36 |
−0.23 |
|
0.5 |
0.50 |
−0.35 |
−0.30 |
0.28 |
0.10 |
|
1.0 |
0.38 |
1.0 |
−0.60 |
−0.15 |
−0.35 |
|
1.5 |
−0.30 |
−0.38 |
0.35 |
−0.5 |
0.50 |
|
2.0 |
−0.50 |
−0.35 |
0.38 |
−0.32 |
0.40 |
|
2.5 |
−0.30 |
−0.15 |
0.26 |
−0.28 |
0.15 |
|
3.0 |
−1.00 |
0.20 |
0.20 |
0.05 |
−0.40 |
|
3.5 |
0.15 |
0.38 |
0.05 |
0.30 |
−0.50 |
|
4.0 |
0.40 |
0.35 |
−0.28 |
0.45 |
−0.50 |
|
4.5 |
0.43 |
−0.05 |
−0.35 |
0.30 |
−0.40 |
|
5.0 |
0.45 |
−0.35 |
−0.25 |
0.0 |
−0.15 |
|
5.5 |
0.20 |
−0.42 |
−0.15 |
−0.40 |
0.15 |
|
6.0 |
−0.30 |
−0.20 |
0.15 |
−0.50 |
0.40 |
|
6.5 |
−0.38 |
−0.10 |
0.30 |
−0.25 |
0.50 |
|
7.0 |
−0.40 |
0.08 |
0.40 |
0.20 |
0.55 |
|
7.5 |
−0.30 |
0.32 |
0.37 |
0.45 |
0.30 |
|
8.0 |
−0.10 |
0.42 |
0.15 |
0.40 |
−0.05 |
|
8.5 |
0.30 |
0.28 |
−0.20 |
0.30 |
−0.4 |
|
9.0 |
0.40 |
−0.02 |
0.0 |
0.10 |
−0.45 |
|
9.5 |
0.30 |
−0.15 |
0.30 |
−0.10 |
0.0 |
|
10.0 |
0.15 |
0.04 |
0.40 |
−0.15 |
0.4 |
Table 2. Electrical Properties of bulk samples at pressure of 30 MPa at 27 °C and particle size of 100 µm for Carbon-Glass Composites.
|
% Weight Carbon/Glass |
Side to Side |
Diagonal |
Center to Center |
|||||||||
|---|---|---|---|---|---|---|---|---|---|---|---|---|
|
Resistance (MΩ) |
Conductance (MΩ)−1 |
Resistivity (MΩm) |
Conductivity (µS/m) |
Resistance (MΩ) |
Conductance (MΩ)−1 |
Resistivity (MΩm) |
Conductivity (µS/m) |
Resistance (MΩ) |
Conductance (MΩ)−1 |
Resistivity (MΩm) |
Conductivity (µS/m) |
|
|
0.00/100.0 |
0.9 |
1.11 |
0.162 |
6.172 |
0.9 |
1.11 |
0.162 |
6.172 |
0.9 |
1.11 |
0.162 |
6.172 |
|
10.0/90.0 |
0.8 |
1.25 |
0.150 |
6.667 |
0.8 |
1.25 |
0.150 |
6.667 |
0.8 |
1.25 |
0.150 |
6.667 |
|
20.0/80.0 |
0.9 |
1.25 |
0.150 |
6.667 |
0.9 |
1.11 |
0.162 |
6.172 |
0.9 |
1.11 |
0.162 |
6.172 |
|
30.0/70.0 |
0.8 |
1.25 |
0.150 |
6.667 |
0.8 |
1.25 |
0.150 |
6.667 |
0.9 |
1.11 |
0.162 |
6.172 |
|
40.0/60.0 |
0.9 |
1.11 |
0.162 |
6.172 |
0.9 |
1.11 |
0.162 |
6.172 |
0.8 |
1.25 |
0.150 |
6.667 |
|
50.0/50.0 |
1.0 |
1.00 |
0.180 |
5.556 |
0.8 |
1.25 |
0.150 |
6.667 |
0.9 |
1.11 |
0.162 |
6.172 |
|
60.0/40.0 |
0.9 |
1.11 |
0.162 |
6.172 |
0.9 |
1.11 |
0.162 |
6.172 |
0.9 |
1.11 |
0.162 |
6.172 |
|
70.0/30.0 |
0.8 |
1.25 |
0.150 |
6.667 |
0.8 |
1.11 |
0.162 |
6.172 |
0.9 |
1.11 |
0.162 |
6.172 |
|
80.0/20.0 |
0.9 |
1.11 |
0.162 |
6.172 |
0.9 |
1.11 |
0.162 |
6.172 |
1.0 |
1.00 |
0.180 |
5.556 |
|
90.0/10.0 |
0.8 |
1.11 |
0.162 |
6.172 |
0.8 |
1.11 |
0.162 |
6.172 |
0.9 |
1.11 |
0.162 |
6.172 |
|
100.0/0.00 |
0.9 |
1.11 |
0.162 |
6.172 |
0.9 |
1.11 |
0.162 |
6.172 |
1.0 |
1.00 |
0.180 |
5.556 |
Table 3 summarizes the elements, their percentage elemental concentrations, and the variation in concentration error of the C10 Glass90 composite. The level of significance was between 0.01 and 0.3, and the level of determination was in the range 0.00026 to 0.2983. The results showed that the oxygen and silicon atoms have an equal elemental concentration of 20.0 percent each, with an empirical concentration error of approximately ±0.00016 to ±0.21566. Sodium, calcium, and carbon were determined at approximately 15.0, 12.0, and 11.0 percent concentrations, respectively, with levels of significance between 0.01 and 0.3. It implies there was an increase in the level of determination before highly concentrated elements were determined.
Table 4 indicates the elements, percentage elemental concentrations, and concentration error variation of the C20 Glass80 composite. The level of significance was between 0.01 and 0.3, and the level of determination was in the range 0.00026 to 0.2983. The results showed that the silicon element has a concentration of 25.0 percent, and the empirical concentration error is between ±0.00016 and ±0.21566 approximately. Oxygen, sodium, calcium, and carbon were determined at approximately 15.0, 14.98, 11.6, and 15.0 percent concentrations, respectively, with levels of significance between 0.01 and 0.30. It signifies there was an increase in the level of significance before highly concentrated elements were observed.
Table 3. Concentration of Elements in C10 Glass90 for 30 MPa and 100-µm particle size.
|
S/N |
Element/Symbol |
% Conc. |
% Conc Error |
% LOD |
Present |
|---|---|---|---|---|---|
|
1 |
Oxygen (O2) |
20.34062 |
±0.027508 |
0.01497 |
Y |
|
2 |
Sodium (Na) |
14.97668 |
±0.215664 |
0.29829 |
Y |
|
3 |
Magnesium (Mg) |
1.23964 |
±0.165492 |
0.15065 |
Y |
|
4 |
Aluminum (Al) |
3.73075 |
±0.045969 |
0.01613 |
Y |
|
5 |
Silicon (Si) |
20.11359 |
±0.082875 |
0.02739 |
Y |
|
6 |
Potassium (K) |
3.08710 |
±0.008597 |
0.01600 |
Y |
|
7 |
Calcium (Ca) |
11.59213 |
±0.009712 |
0.00652 |
Y |
|
8 |
Titanium (Ti) |
0.03139 |
±0.002882 |
0.00494 |
Y |
|
9 |
Manganese (Mn) |
0.00430 |
±0.001372 |
0.00240 |
- |
|
10 |
Iron (Fe) |
3.10834 |
±0.002709 |
0.00188 |
Y |
|
11 |
Nickel (Ni) |
0.00029 |
±0.000162 |
0.00026 |
- |
|
12 |
Carbon (C) |
11.00321 |
±0.008597 |
0.15065 |
Y |
|
Total |
83.2245 |
||||
Y = Yes, LOD = Level of Determination, dash = not certain.
Table 4. Concentration of Elements in C20 Glass80 for 30 MPa and 100-µm particle size.
|
S/N |
Element/Symbol |
% Conc. |
% Conc Error |
% LOD |
Present |
|---|---|---|---|---|---|
|
1 |
Oxygen (O2) |
15.34062 |
±0.027508 |
0.01497 |
Y |
|
2 |
Sodium (Na) |
14.97668 |
±0.215664 |
0.29829 |
Y |
|
3 |
Magnesium (Mg) |
1.23964 |
±0.165492 |
0.15065 |
Y |
|
4 |
Aluminum (Al) |
5.73075 |
±0.045969 |
0.01613 |
Y |
|
5 |
Silicon (Si) |
25.11359 |
±0.082875 |
0.02739 |
Y |
|
6 |
Potassium (K) |
3.08710 |
±0.008597 |
0.01600 |
Y |
|
7 |
Calcium (Ca) |
11.59213 |
±0.009712 |
0.00652 |
Y |
|
8 |
Titanium (Ti) |
0.03139 |
±0.002882 |
0.00494 |
Y |
|
9 |
Manganese (Mn) |
0.00430 |
±0.001372 |
0.00240 |
- |
|
10 |
Iron (Fe) |
0.10834 |
±0.002709 |
0.00188 |
Y |
|
11 |
Nickel (Ni) |
0.00029 |
±0.000162 |
0.00026 |
- |
|
12 |
Carbon (C) |
15.00342 |
±0.002882 |
0.01613 |
Y |
|
Total |
82.22826 |
||||
Y = Yes, LOD = Level of Determination, dash = not certain.
In Table 5 for C30 Glass70 composite, it was observed that the concentration of aluminium is twice that of magnesium. Oxygen and sodium were also twice that of the concentration of aluminium. Silicon takes the highest concentration among elements with 25.1 percent, a 0.01 level of significance, a 0.027 level of determination, and a ±0.082875 error concentration. It entails the highest concentration of an element at a low level of determination and small error concentration. Sodium, oxygen, and carbon concentrations in the range 14.98–16.00 percent were determined with levels of significance between 0.01 and 0.3. These were determined at a low level of determination and between low and high error concentrations, ±0.027508 and ±0.215664. This sample was noted to be close to 100.0 percent elemental concentration.
Table 5. Concentration of Elements in C30 Glass70 for 30 MPa and 100-µm particle size.
|
S/N |
Element/Symbol |
% Conc. |
% Conc Error |
% LOD |
Present |
|---|---|---|---|---|---|
|
1 |
Oxygen (O2) |
15.34062 |
±0.027508 |
0.01497 |
Y |
|
2 |
Sodium (Na) |
14.97668 |
±0.215664 |
0.29829 |
Y |
|
3 |
Magnesium (Mg) |
3.23964 |
±0.165492 |
0.15065 |
Y |
|
4 |
Aluminum (Al) |
6.73075 |
±0.045969 |
0.01613 |
Y |
|
5 |
Silicon (Si) |
25.11359 |
±0.082875 |
0.02739 |
Y |
|
6 |
Potassium (K) |
3.08710 |
±0.008597 |
0.01600 |
Y |
|
7 |
Calcium (Ca) |
10.59213 |
±0.009712 |
0.00652 |
Y |
|
8 |
Titanium (Ti) |
0.03139 |
±0.002882 |
0.00494 |
Y |
|
9 |
Manganese (Mn) |
0.00430 |
±0.001372 |
0.00240 |
- |
|
10 |
Iron (Fe) |
0.10834 |
±0.002709 |
0.00188 |
Y |
|
11 |
Nickel (Ni) |
0.00029 |
±0.000162 |
0.00026 |
- |
|
12 |
Carbon (C) |
16.00032 |
±0.009712 |
0.01600 |
Y |
|
Total |
95.224516 |
||||
Y = Yes, LOD = Level of Determination, dash = not certain.
In Table 6 for C40 Glass 60 composite, silicon takes the highest concentration among elements with 25.1 percent, a 0.01 level of significance, a 0.027 level of determination, and a ±0.082875 error concentration. It depicts the highest concentration of the element at a low level of determination and small error concentration. Sodium, oxygen, and carbon concentrations in the range 14.98 to 17.00 percent were sustained with levels of significance between 0.01 and 0.3. These were determined at a low level of determination, and between low and high error concentrations, ±0.027508 and ±0.215664. This sample was revealed to be very close to 100.0 percent elemental concentration.
Table 6. Concentration of Elements in C40 Glass60 for 30 MPa and 100-µm particle size.
|
S/N |
Element/Symbol |
% Conc. |
% Conc Error |
% LOD |
Present |
|---|---|---|---|---|---|
|
1 |
Oxygen (O2) |
15.34062 |
±0.027508 |
0.01497 |
Y |
|
2 |
Sodium (Na) |
14.97668 |
±0.215664 |
0.29829 |
Y |
|
3 |
Magnesium (Mg) |
1.23964 |
±0.165492 |
0.15065 |
Y |
|
4 |
Aluminum (Al) |
8.73075 |
±0.045969 |
0.01613 |
Y |
|
5 |
Silicon (Si) |
25.11359 |
±0.082875 |
0.02739 |
Y |
|
6 |
Potassium (K) |
3.08710 |
±0.008597 |
0.01600 |
Y |
|
7 |
Calcium (Ca) |
11.59213 |
±0.009712 |
0.00652 |
Y |
|
8 |
Titanium (Ti) |
0.03139 |
±0.002882 |
0.00494 |
Y |
|
9 |
Manganese (Mn) |
0.00430 |
±0.001372 |
0.00240 |
- |
|
10 |
Iron (Fe) |
0.10834 |
±0.002709 |
0.00188 |
Y |
|
11 |
Nickel (Ni) |
0.00029 |
±0.000162 |
0.00026 |
- |
|
12 |
Carbon (C) |
17.10002 |
±0.008597 |
0.01613 |
Y |
|
Total |
97.32486 |
||||
Y = Yes, LOD = Level of Determination, dash = not certain.
In Table 7 for C50 Glass50 composite, silicon takes the highest concentration among elements with 24.1 percent, a 0.01 level of significance, a 0.027 level of determination, and a ±0.082875 error concentration. It denotes the highest concentration of an element at a low level of determination and small error concentration. Sodium, oxygen, and carbon concentrations in the range 14.98 to 15.10 percent were determined with levels of significance between 0.01 and 0.3. These were determined at a low level of determination, and between low and high error concentrations, ±0.027508 and ±0.215664. This sample was revealed to be very close to 100.0 percent elemental concentration.
Table 7. Concentration of Elements in C50 Glass50 for 30 MPa and 100-µm particle size.
|
S/N |
Element/Symbol |
% Conc. |
% Conc Error |
% LOD |
Present |
|---|---|---|---|---|---|
|
1 |
Oxygen (O2) |
16.34062 |
±0.027508 |
0.01497 |
Y |
|
2 |
Sodium (Na) |
14.97668 |
±0.215664 |
0.29829 |
Y |
|
3 |
Magnesium (Mg) |
2.23964 |
±0.165492 |
0.15065 |
Y |
|
4 |
Aluminum (Al) |
10.73075 |
±0.045969 |
0.01613 |
Y |
|
5 |
Silicon (Si) |
24.11359 |
±0.082875 |
0.02739 |
Y |
|
6 |
Potassium (K) |
3.08710 |
±0.008597 |
0.01600 |
Y |
|
7 |
Calcium (Ca) |
11.59213 |
±0.009712 |
0.00652 |
Y |
|
8 |
Titanium (Ti) |
0.03139 |
±0.002882 |
0.00494 |
Y |
|
9 |
Manganese (Mn) |
0.00430 |
±0.001372 |
0.00240 |
- |
|
10 |
Iron (Fe) |
0.10834 |
±0.002709 |
0.00188 |
Y |
|
11 |
Nickel (Ni) |
0.00029 |
±0.000162 |
0.00026 |
- |
|
12 |
Carbon (C) |
15.10002 |
±0.008597 |
0.01613 |
Y |
|
Total |
98.42486 |
||||
Y = Yes, LOD = Level of Determination, dash = not certain. Oxygen is obtained from RBS analysis, and other elements are from PIXE. Air trap and moisture constitute the remaining percentage.
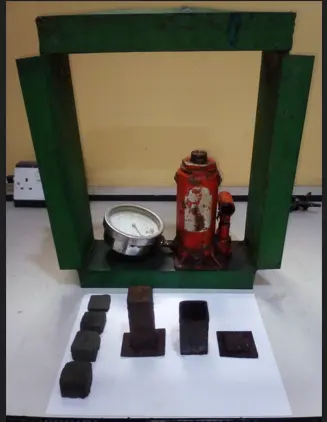
The display of Figure 1 is the setup for molding samples. The square-shaped composites have been produced.
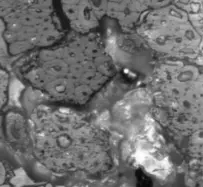
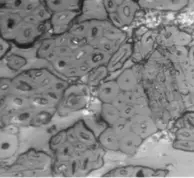
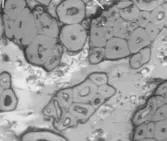
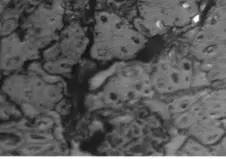
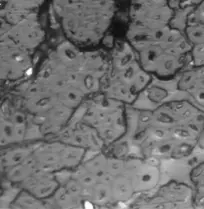
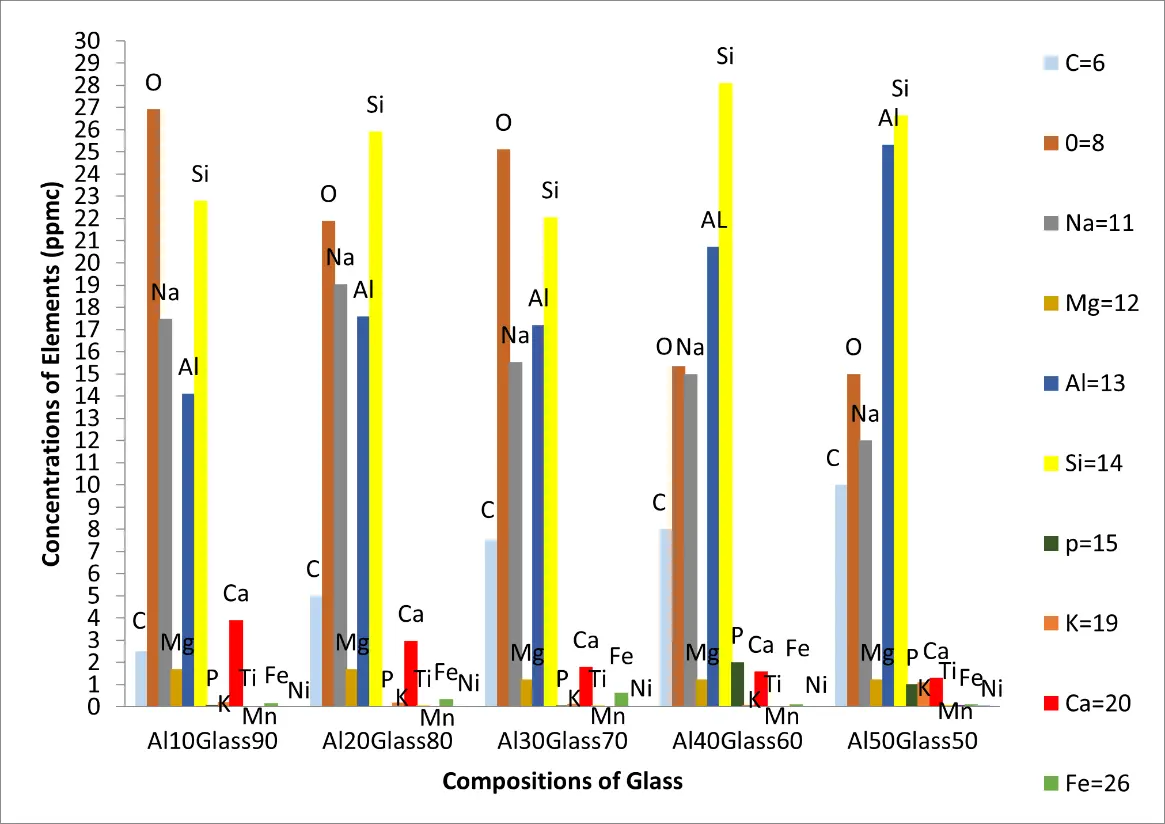
Figure 2a–e contain the results of the optical micrographs of Al-Glass composites, which entail black grains of Al that are dominant and dispersed randomly in the white background of a glass texture of the composites. It also reveals that the grain sizes are not the same. Figures 3 and 4 depict major compositions of Al-Glass and Carbon-Glass composites at 30 MPa and 100 µm. In Figure 3, this silicon tops the elemental composition only for Al20 Glass30, Al40 Glass10, and Al50 Glass50. The other element, oxygen, is the highest of the remaining samples of Al10 Glass40 and Al30 Glass20. The samples of Figure 4 also reveal that silicon assumes the first position in all the elemental compositions of Carbon–Glass Composites.
|
|
|
|
( a ) |
( b ) |
( c ) |
|
|
|
|
( d ) |
( e ) |
Figure 2. (a–e): Optical micrographs for composites at 30 MPa, 100-µm particle size, and Magnification × 100. (a) Al10/Glass90 (10%Al, 90% Glass); (b) Al20/Glass80 (20%Al, 80% Glass); (c) Al30/Glass70 (30%Al, 70% Glass); (d) Al40/Glass60 (40%Al, 60% Glass); (e) Al50/Glass50 (50%Al, 50% Glass).
In Figure 3, silicon atoms take the lead in the highest concentrated elements of Al20 Glass80, Al40 Glass60, and Al50 Glass50 composites, yet silicon ranks second in the highest concentrated elements of Al10 Glass90, and Al30 Glass70.composites. Moreover, in Al10 Glass90 and Al30 Glass70 composites, oxygen was observed to be the most concentrated element. But aluminium and oxygen are second and third in rank of the highest concentrated elements in Al40 Glass60, and Al50 Glass50 composites respectively. Besides, sodium was noted to be the third most concentrated element in Al10 Glass90 and Al20 Glass80 composites and aluminium became the fourth highest concentrated element in Al10 Glass90 and Al20 Glass80 composites. Calcium is the fifth highest concentrated element in Al10 Glass90 but carbon is also the fifth highest concentrated elements in Al20 Glass80, and Al30 Glass70, Al40 Glass60 and Al50 Glass50 composites. The sixth highest concentrated element in Al40 Glass60 composite is phosphorous. But the sixth highest concentrated elements in Al10 Glass90, Al20 Glass80, Al30 Glass70, and Al50 Glass50 is calcium. Other elements such as carbon, potassium, titanium, and magnesium were found in the category of low and very low concentration elements.
In Figure 4, the silicon atoms take the lead as the most concentrated element in nearly all the composites. Moreover, carbon was observed to be the second most concentrated element in C20 Glass80, C30 Glass70, and C40 Glass60 composites. Furthermore, Sodium was the third most concentrated element in C10 Glass90 and C20 Glass80 composites, yet the fourth most concentrated element in C30 Glass40, C40 Glass60, and C50 Glass50. Composites. In addition, Oxygen was the first in rank of the most concentrated element in C10 Glass90 composite, but the second in rank in C50 Glass50 composite. Calcium and oxygen are the fourth most concentrated elements in C10 Glass90 and C20 Glass80 composites respecttively, but calcium is the fifth most concentrated element in C20 Glass80, C30 Glass70, C40 Glass60, and C50 Glass50 composites. Aluminium forms the sixth most concentrated element in all the composites. Other elements, such as magnesium, phosphorous, potassium, and titanium are categorized as low and very low concentrated elements in all the composites.
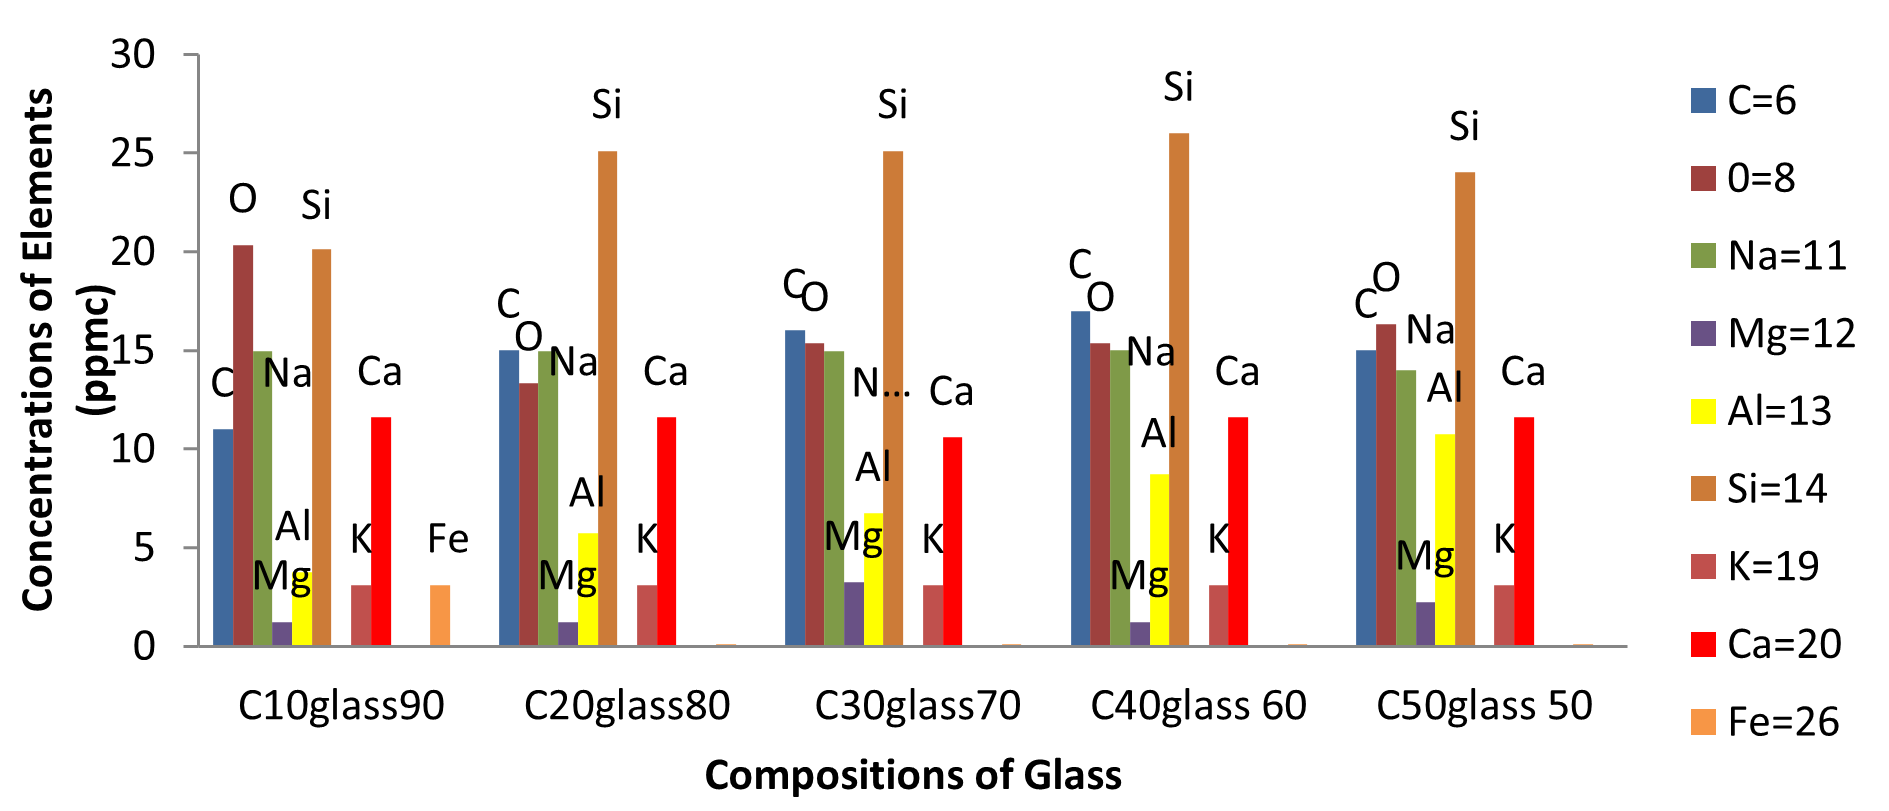
Figure 4. Major compositions of Carbon-Glass composites at 30 MPa and 100 µm.
The variation of the electrical I-V characteristic of the Al-Glass Composites is shown in Figure 5. The Figure revealed the variation of current in the range of 0 to 10 µA, a constant pressure of 30 MPa, and a particle size of 100 µm. The display has shown an interwoven pattern for all the composites. The voltage oscillates between +0.5 V and −0.5 V. This might be useful in electronic devices that require micro-ampere current flow in the circuit. Figure 5 shows the relationship between the current and voltage with an increase in Al composition for some composites. Furthermore, the results revealed the sinusoidal display of the I-V relationship for all the Al-Glass materials investigated. This is due to the near cancellation of the ionic potentials between the atoms of the elements. At a noticeable atomic distance, the ionic potentials were screened. Moreover, the current for all the samples fluctuates at a minute range in micro-amperes. This might be a result of the electron density variation. The delocalization, at times, may occur when the weighted average of the configuration of the holes and electrons undergoes fluctuations when there is an air trap in the volume of the solid material of Al-Glass composites. Furthermore, changing the density of states in its neighborhood. For an electron–particle interaction, the surrounding electrons are pushed away. We get a cloud of positive charge density in a region, and in other regions, we have a negative cloud charge density. The variation of the resistance of carbon with a composition of Glass at a constant pressure of 30 MPa and particle size of 100 µm is revealed in Figure 6.
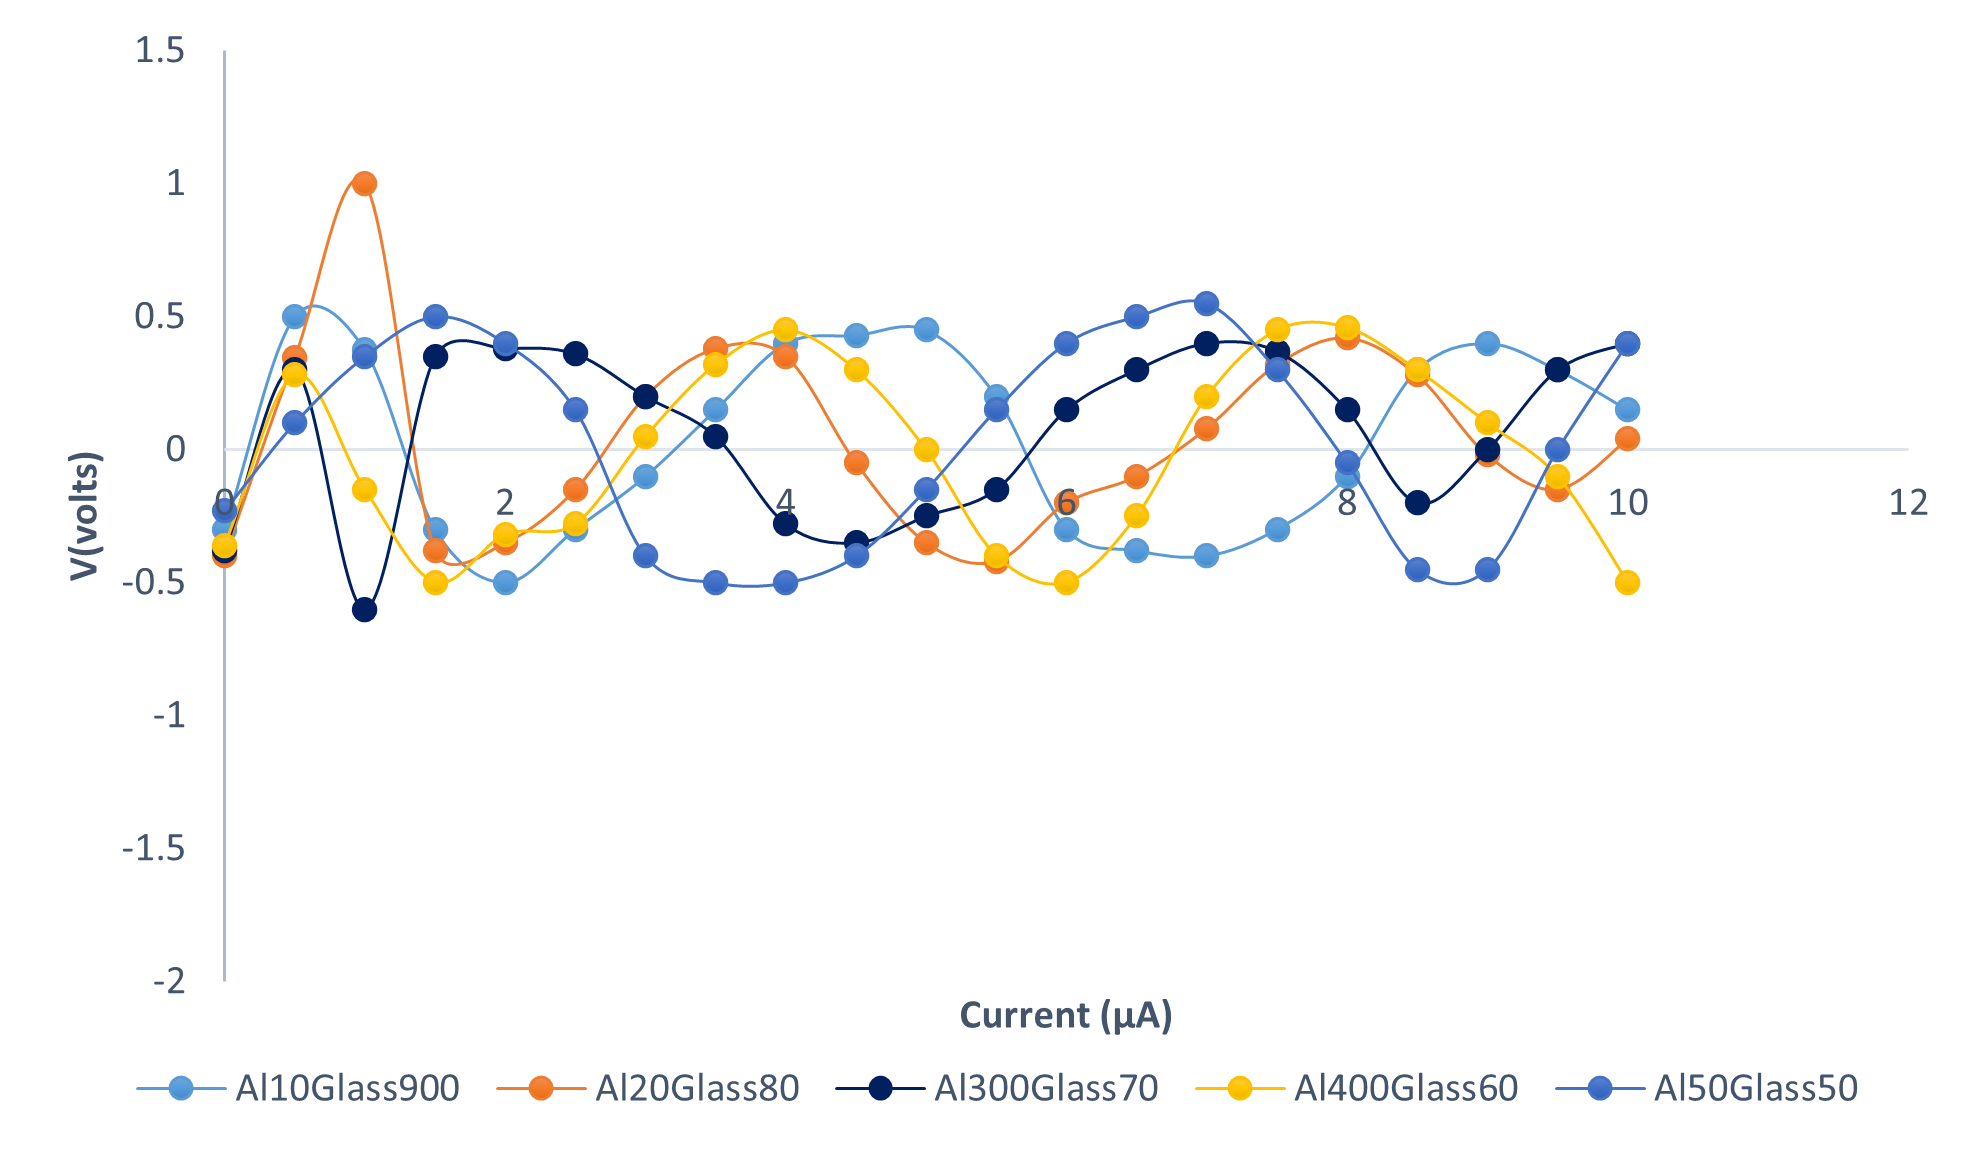
Figure 5. Current-Voltage Characteristics of Al-Glass composites at 30 MPa and 100 µm.
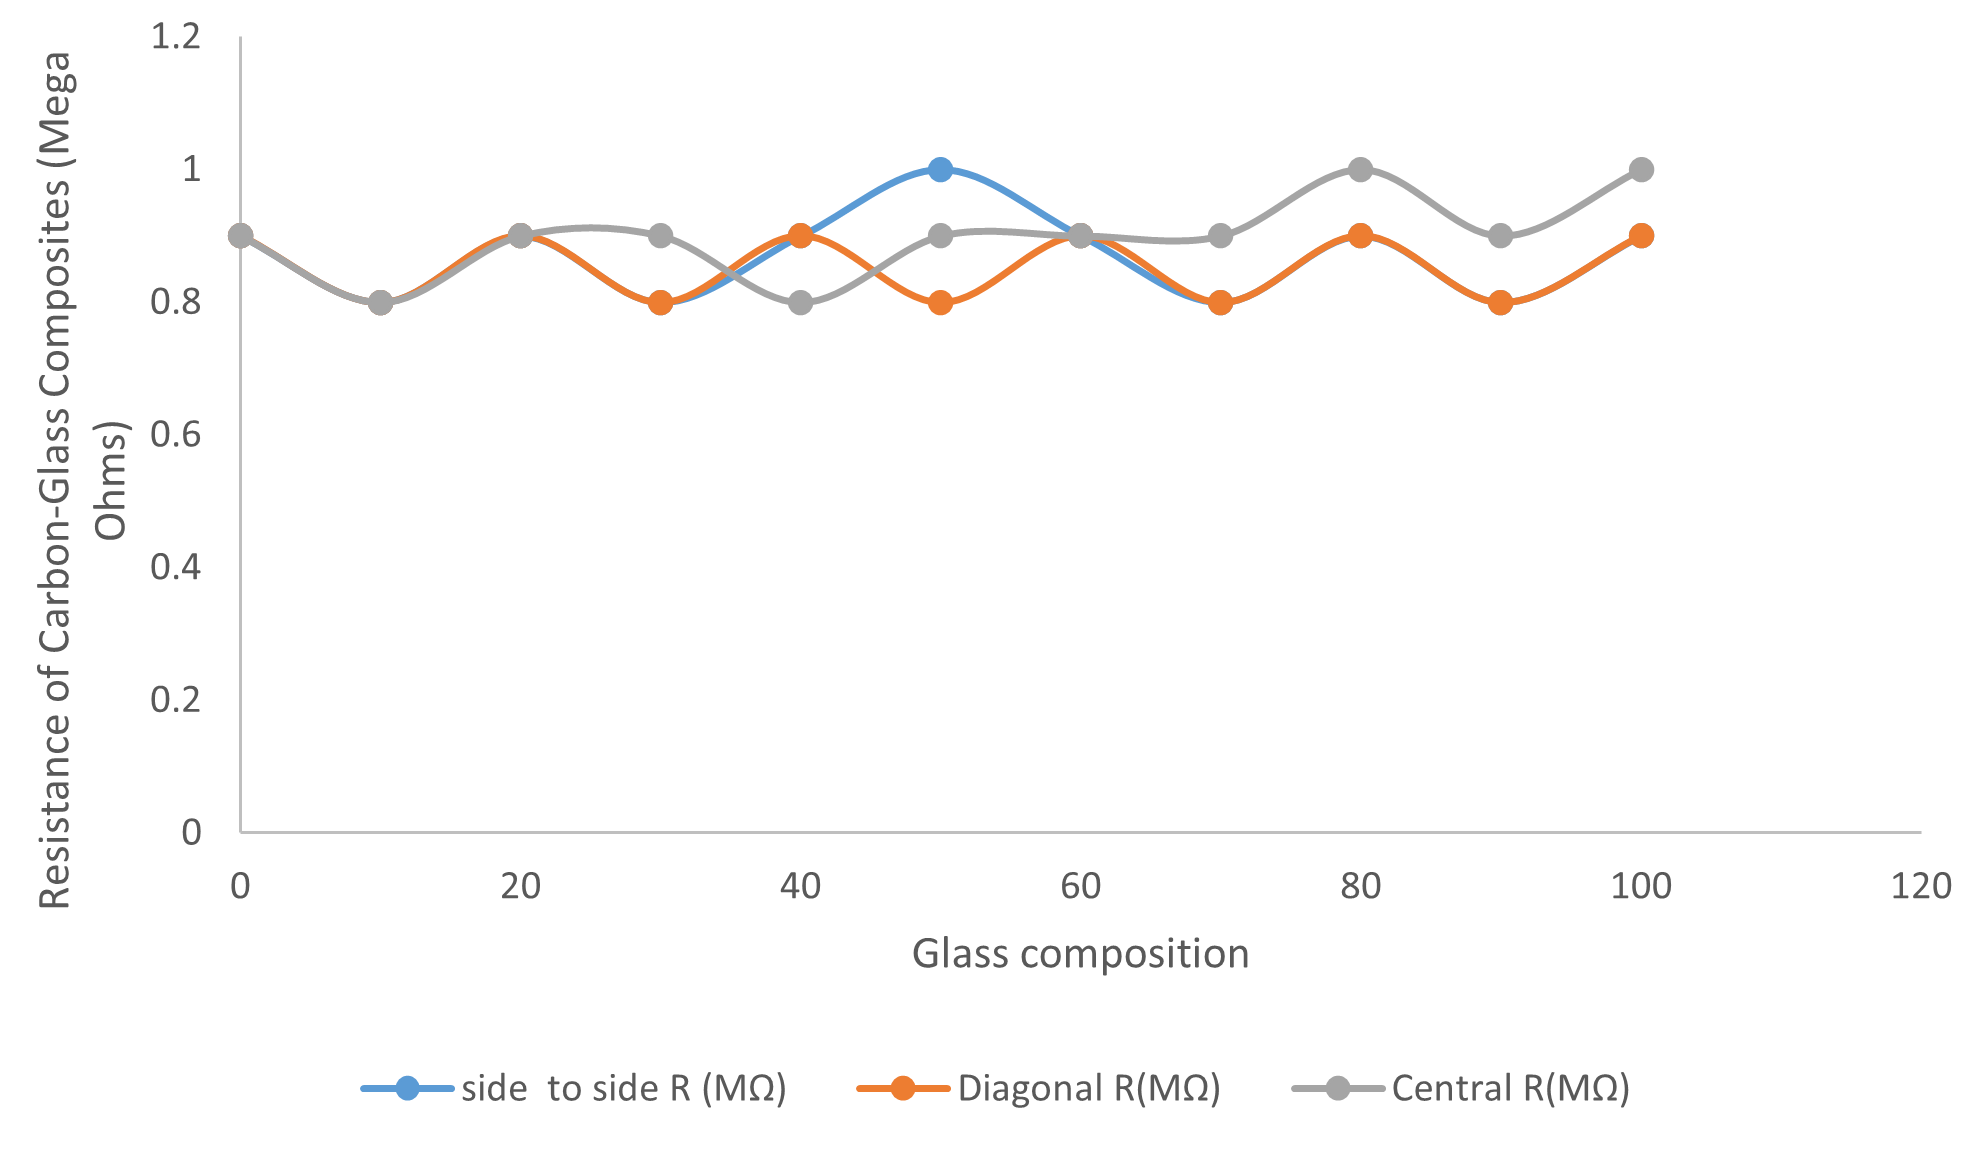
Figure 6. Resistance of Carbon versus Glass composition at 30 MPa and 100 µm.
4. Conclusions
The simple fabrication method of compacting powdered Al, carbon, and glass using sodium silicate as the binder has revealed the nature and elemental composition of Al-Glass and Carbon-Glass composites. The resistance in Mega-ohms of Carbon-Glass composite is useful for industrial high-resistance electrical devices. The micro-current results obtained in Al-Glass are also applicable in electronic devices if an advanced fabrication method is used to reduce the size of the resistor to suit portability. These composites can be used as switching devices, resistors, and sensors.
Authors Contributions
For this research article, individual contributions are specified. The following statements are thereby used: O.W.A. and A.A.A.; Methodology, O.W.A.; grammar check, O.W.A.; Validation, O.W.A. and A.A.A.; Formal Analysis, O.W.A.; Investigation, O.W.A.; Resources, A.A.A.; Data Curation, A.A.A.; Writing—Original Draft Preparation, A.A.A.; Writing—Review & Editing, O.W.A.; Visualization, O.W.A.; Supervision, A.A.A.; Project Administration, A.A.A.; Funding Acquisition, O.W.A.
Ethics Statement
Not applicable.
Informed Consent Statement
Not applicable.
Data Availability Statement
The research data is available in this paper.
Funding
This research received no external funding.
Declaration of Competing Interest
There are no known competing financial interests or personal relationships that could have appeared to influence the work reported in this paper.
References
- Ajayi AA, Aderemi BA, Ogunmola ED, Salau OA, Akinsola SI, Abodunrin OW. Effects of Temperature on the Properties of Cu2ZnSnS4 (CZTS) Thin Film for Solar Cell Application. Jordan J. Phys. 2025, 18, 34–47. [Google Scholar]
- Yalçınkaya S, Mertgenç Yoldaş D, Yoldaş MF. Experimental Investigation of the Effect of Seawater on Glass and Carbon Fiber Composites via Mechanical Characterization. J. Compos. Sci. 2025, 9, 107. [Google Scholar]
- Al Azzawi WS, Kadhim H, Jomah AJS. Mechanical Properties Characterization of Glass/Carbon Fiber Hybrid Multilayer Composite under Environmental Aging Conditions. Diyala J. Eng. Sci. 2024, 17, 94–102. [Google Scholar]
- Atakok G, Mertgenc Yoldas D. Comparison of GFRP (Glass Fiber-Reinforced Polymer) and CFRP (Carbon Fiber-Reinforced Polymer) Composite Adhesive-Bonded Single-Lap Joints Used in Marine Environments. Sustainability 2024, 16, 11105. [Google Scholar]
- Syduzzaman M, Rumi SS, Fahmi FF, Akter M, and Dina RB. Mapping the recent advancements in bast fiber reinforced bio composites: A review on fiber modifications, mechanical properties, and their applications. Results Mater. 2023, 20, 100448. [Google Scholar]
- Biswas R, Sharma N, and Singh KK. Numerical analysis of mechanical and fatigue behaviour of glass and carbon fibre reinforced polymer composite. Mater. Today Proc. 2022, 3, 479. [Google Scholar]
- Olumese NO, Abodunrin OW. Dynamic Stability of Al-Glass/Ceramic Composites. Jordan J. Phys. 2022, 15, 361–368. [Google Scholar]
- Asyraf MRM, Syamsir A, Ishak MR, Sapuan SM, Nurazzi NM, Norrahim MNF, et al. Mechanical Properties of Hybrid Lignocellulose Fiber-Reinforced Biopolymer Green Composites: A Review. Fibers Polym. 2023, 24, 337–353. [Google Scholar]
- Nikolaidis S, Papaevangelou C, Baniotopoulos C. Structural Stability Study and Design of Steel Glass Composites Structures under Earthquake Actions. Jordan Univ. Sci. Technol. 2022, 83, 159–165. [Google Scholar]
- Dudina DV, Georgarakis K, Olevsky EA. Progress in aluminum and magnesium matrix composites obtained by spark plasma, microwave, and induction sintering. Int. Mater. Rev. 2022, 68, 225–246. [Google Scholar]
- Dudina DV, Georgarakis K. Shell particle reinforcements—A new trend in the design and development of metal matrix composites. Materials 2022, 15, 2629. [Google Scholar]
- Zhu J, Cai Y, Zhang Y, Liu X, Tian J, Ma J, et al. Particle-reinforced Cu matrix composites fabricated by sintering core–shell-type amorphous/crystalline composite powders. Mater. Sci. Eng. A 2022, 854, 143823. [Google Scholar]
- Avettand-Fènoël MN, Netto N, Simar A, Marinova M, Taillard R. Design of a metallic glass dispersion in pure copper by friction stir processing. J. Alloys Compd. 2022, 907, 164522. [Google Scholar]
- Bao W, Chen J, Xie G. Optimized strength and conductivity of multi-scale copper alloy/metallic glass composites tuned by a one-step spark plasma sintering (SPS) process. J. Mater. Sci. Technol. 2022, 128, 22–30. [Google Scholar]
- Bao W, Chen J, Yang X, Xiang T, Cai Z, Xie G. Improved strength and conductivity of metallic-glass-reinforced nano-crystalline CuCrZr alloy. Mater. Des. 2022, 214, 110420. [Google Scholar]
- Kvashnin VI, Dudina DV, Ukhina AV, Koga GY, Georgarakis K. The benefit of the glassy state of reinforcing particles for the densification of aluminum matrix composites. J. Compos. Sci. 2022, 6, 135. [Google Scholar]
- Ma J, Fan C, Chen W, Tan H, Zhu S, Li Q, et al. Core-shell structure in situ reinforced aluminum matrix composites: Microstructure, mechanical and tribological properties. J. Alloys Compd. 2022, 901, 163613. [Google Scholar]
- Evseev NS, Matveev AE, Nikitin PY, Abzaev YA, Zhukov IA. A theoretical and experimental investigation on the SHS synthesis of (HfTiCN)-TiB2 high-entropy composite. Ceram. Int. 2022, 48, 16010–16014. [Google Scholar]
- Chen S, Wang L, He G, Li J, Wang CA. Microstructure and properties of porous Si3N4 ceramics by gel casting-self-propagating high-temperature synthesis (SHS). J. Adv. Ceram. 2022, 11, 172–183. [Google Scholar]
- Yan C, Zeng Q, He W, Zhu J. Enhanced surface hardness and tribo-corrosion performance of 60NiTi by boron ion implantation and post-annealing. Tribol. Int. 2022, 155, 106816. [Google Scholar]