Identification of Pathways That Drive Myofibroblast Transformation in Hypertrophic Scars

Identification of Pathways That Drive Myofibroblast Transformation in Hypertrophic Scars
Alice R. Lapthorn
1
 Melissa Nelson
1,2
Sheryaar Khan
1,2
Kieran M. Feltham
1
Peter Dziewulski
1,3
Selim Cellek
1,*
Melissa Nelson
1,2
Sheryaar Khan
1,2
Kieran M. Feltham
1
Peter Dziewulski
1,3
Selim Cellek
1,*
Received: 28 August 2025 Revised: 17 September 2025 Accepted: 28 September 2025 Published: 09 October 2025

© 2025 The authors. This is an open access article under the Creative Commons Attribution 4.0 International License (https://creativecommons.org/licenses/by/4.0/).
Graphical Abstract
1. Introduction
Scarring following burn injury is described as one of the greatest unmet challenges in the treatment of these injuries [1]. Burn scars usually manifest as hypertrophic scars (HTS), which can cause psychological stress, pain, itching, contractures, disfigurement, and loss of function [2,3]. There are no safe and efficacious treatment options to prevent HTS [4,5].
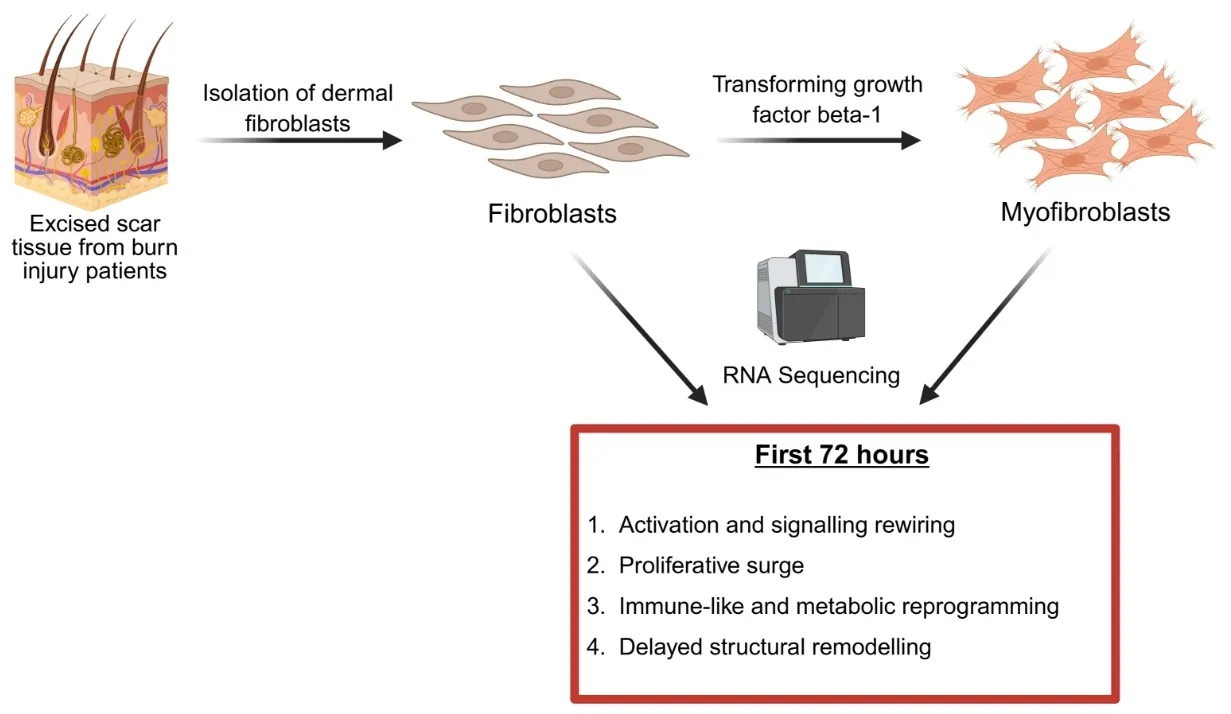
HTS are fibrotic disorders characterized by the excessive and disorganized accumulation of extracellular matrix (ECM) proteins in the wound bed [6]. In HTS, myofibroblasts produce ECM proteins, which arise from quiescent, resident dermal fibroblasts. This transformation is prominently driven by elevated levels of transforming growth factor-beta 1 (TGF-β1), which is overexpressed in HTS tissues and scar-derived fibroblasts compared to normal skin [7]. The activated TGF-β1 signalling—through both canonical Smad and non-Smad pathways—promotes fibroblast proliferation, upregulation of α-smooth muscle actin (α-SMA), and increased synthesis of collagens and fibronectin, leading to the fibrotic characteristics associated with HTS. Therefore, myofibroblasts have a higher capacity to proliferate and produce ECM compared to fibroblasts, and theylso gain the ability to contract due to the de novo expression of contractile filaments [8,9]. The transformation of fibroblasts to myofibroblasts is a key event in the pathophysiology of not only HTS but also other fibrotic disorders and its inhibition has been suggested to be a therapeutic or preventive anti-fibrotic approach [10].
RNA sequencing uses next-generation sequencing (NGS) to analyse and quantify RNA molecules in a biological sample and provides a snapshot of gene expression, also known as the transcriptome. Transcriptomic analysis of disease and normal tissue samples could help identify novel molecular targets or pathways for drug development and further our understanding of disease pathophysiology. In previous studies, RNA sequencing was performed at the tissue and cell level, using patient-derived HTS and normal skin samples [11,12,13]. Although transcriptomics analysis of myofibroblast transformation has been performed using commercially available dermal fibroblasts from non-burn skin [14], such analysis has not been done with dermal fibroblasts obtained from burn patients with HTS. In this report, we present data from RNA sequencing of fibroblasts isolated from HTS samples before and after exposure to TGF-β1.
2. Materials and Methods
2.1. Ethical Approval and Tissue Acquisition
Ethical approval for this study was obtained from the NHS Health Research Authority and NHS East of England—Cambridge Central Research Ethics Committee (REC 18/EE/0072), and institutional approval was granted from Anglia Ruskin University (FMSFREP/17/18 187). The patients recruited to the study gave fully informed written consent prior to participation.
Three patients (17 year old female, 27 year old female, and 48 year old male, no co-morbidities, no co-medications) undergoing burn scar excision surgery at St. Andrew’s Centre for Plastic Surgery and Burns, Broomfield Hospital, Chelmsford, UK, were recruited to the study. Burn scar tissue from these patients was used to isolate fibroblasts in this study.
2.2. Fibroblast Isolation and Culturing
Fibroblasts were isolated using the explant method, as previously described [15,16]. Briefly, the dermis and epidermis were mechanically separated before cutting the dermis into 1 cm2 fragments. Dermal fragments were anchored to the bottom of 6-well plates (Nunc Fisher Scientific, Loughborough, UK) and cultured in DMEM (Gibco Invitrogen, Paisley, UK) containing 20% foetal calf serum (FCS; Fisher Scientific, Loughborough, UK) and 1% penicillin/streptomycin (Pen/Strep; Gibco Invitrogen, UK). The dermal fragments were incubated at 37 °C, 5% CO2, for 5–7 days. Once fibroblast outgrowth was observed, the dermal fragments were removed, and the fibroblasts were grown in DMEM containing 10% FCS and 1% Pen/Strep, supplemented with 4 ng/mL human basic fibroblast growth factor to promote fibroblast growth and prevent spontaneous transformation (hbFGF; Sigma-Aldrich, Gillingham, UK). For all experiments, passages 2–5 were used. The fibroblast phenotype was previously confirmed by negative staining for desmin, cytokeratin-14 and α-SMA and positive staining for vimentin [15,16]. We have previously shown that these cells express α-SMA after 72 h following exposure to TGF-β1, confirming myofibroblast transformation [15,16]. In our previous studies, we determined that the optimum concentration of TGF-β1 for the transformation in these cells was 10 ng/mL, which was used in this study [15,16].
2.3. RNA Isolation and Quality Assessment
Fibroblasts were serum starved for 30 min prior to seeding using DMEM containing only 1% Pen/Strep. Cells were seeded into 6-well plates at a concentration of 50,000 cells per well and left overnight to adhere at 37 °C, 5% CO2. The following day, the cells were given blank DMEM with 1% FCS and 1% Pen/Strep, or treated with media containing 10 ng/mL TGF-β1 (Sigma-Aldrich, UK), and incubated for 72 h at 37 °C, 5% CO2. Using the RNeasy Mini Kit (Qiagen, Manchester, UK), total RNA was isolated from the cells, following the manufacturers instructions. RNA was resuspended in water and stored at −80 °C until use. The Agilent Bioanalyser (Agilent Scientific Instruments, Stockport, UK) was used to assess RNA concentration and integrity. All RNA samples were deemed suitable for sequencing, with RIN values > 9.
2.4. RNA Sequencing
After determining RNA integrity and quality, RNA was prepared and sequenced at Eurofins Genomics (Constance, Germany) using an INVIEW Transcriptome product. This included purification of mRNA, fragmentation, strand-specific cDNA synthesis, end-repair, ligation of sequencing adapters, amplification and purification. The prepared libraries were then quality-checked, pooled and sequenced on an Illumina platform (Illumina NovaSeq X+, PE150 mode, San Diego, CA, USA).
2.5. Data Analysis
Gene set enrichment analysis (GSEA) was performed by Edinburgh Genomics using the “GSEA” function from the “cluster profiler” Bioconductor package with default parameters, to look for Gene Ontology (GO) terms or Reactome pathways. Heatmaps showing expression of genes interest (mostly differentially expressed genes and genes belonging to differentially expressed pathways) were created using the Bioconductor package “pheatmap” function. Dotplots were created from the GSEA results using the “dotplot” function, and the enrichment map plots were created using the “emaplot” function from the “enrichplot” Bioconductor package. For both types of plot, only the most significantly enriched gene sets are shown. R version 4.3.1 was used for all analysis.
Differential expression analysis was performed in R v4.3.1 using DESeq2. Low-count genes (fewer than 10 average reads across groups) were excluded. Counts were normalised to account for sequencing depth and variance across replicates. Significance testing was carried out with the Wald test and adjusted using the Benjamini–Hochberg FDR correction. Genes with |log2 fold change| > 1 and adjusted p-value < 0.1 were considered significantly differentially expressed. In total, 9 samples (3 patients with untreated and TGF-β1-treated fibroblasts in triplicate) passed QC and were included in the analysis.
Downstream functional enrichment was performed by Edinburgh Genomics using clusterProfiler. Gene set enrichment analysis (GSEA) was applied to GO (cellular component, molecular function, biological process) and Reactome pathway databases (updated December 2024–January 2025). Results were visualised using pheatmap (heatmaps), dotplot, and emaplot (enrichment mapping).
3. Results
The gene expression data from treated and untreated cells can be found in Supplementary File S1. Figure 1 shows a heatmap of the 50 most differentially expressed genes (by adjusted p-value) between untreated fibroblasts (control) and fibroblasts which were treated with 10 ng/mL TGF-β1 for 72 h (treated). 33 of these genes showed significant up-regulation and 17 showed significant down-regulation in response to treatment with TGF-β1. The list of these 50 most differentially expressed genes can be found in Supplementary File S2.
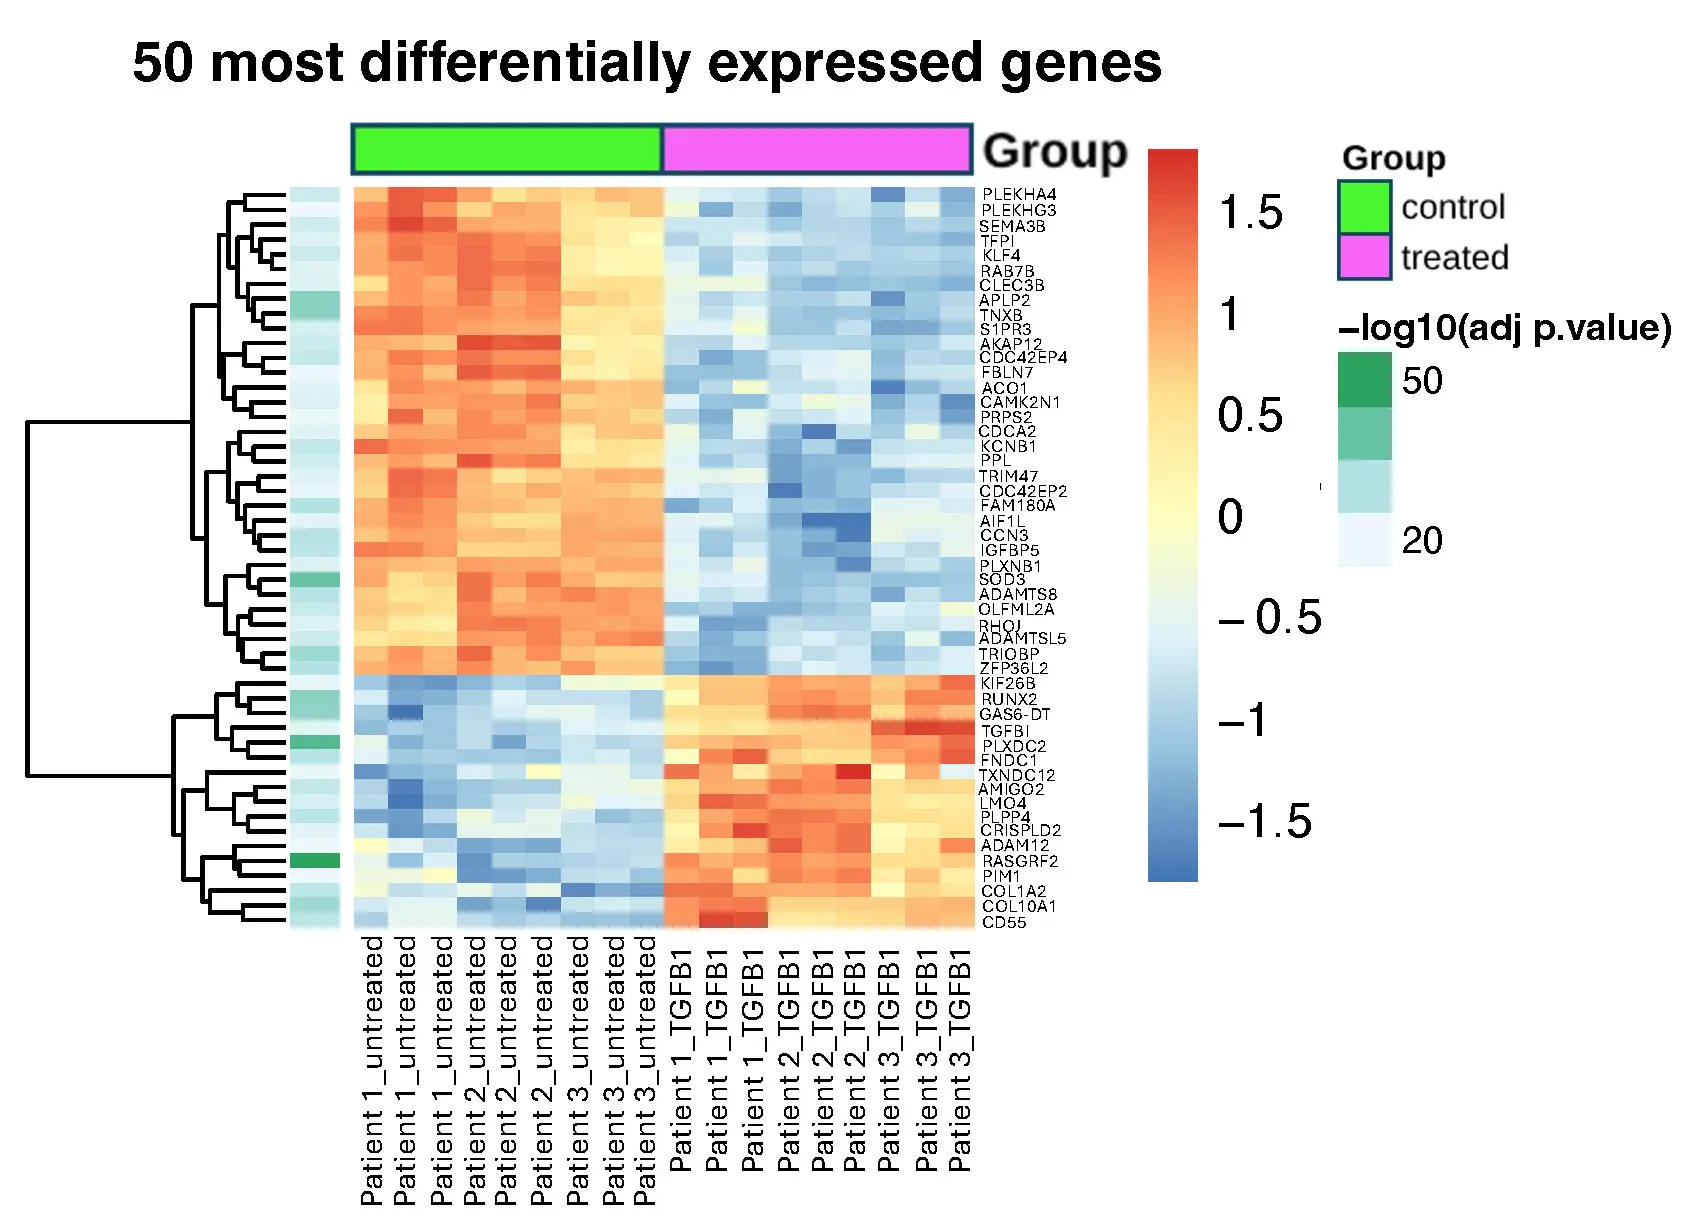
Figure 1. Heatmap of expression for the 50 most differentially expressed genes which have an adjusted p-value of less than 0.05. The data were obtained from 3 patient samples with 3 replicates for each. Control: untreated cells; Treated: cells treated with 10 ng/mL TGF-β1 for 72 h.
Gene set enrichment analysis (GSEA) was performed to identify groups of functionally related genes enriched among the most differentially expressed genes. This analysis revealed three groupings: “cellular components”, “molecular function” and “biological process”. The number of up- and down-regulated sets for each grouping is shown in Table 1. Figure 2, Figure 3 and Figure 4 show the dot plots of the most significant gene ontology terms for each grouping. The list of these genes in each grouping can be found alphabetically in Supplementary File S3.
Table 1. The numbers of functional gene sets in each grouping was found to be significantly enriched (with an adjusted p-value of less than 0.05) among the most differentially expressed genes.
Grouping |
Total Number of Significant Sets |
Significantly Up-Regulated Sets |
Significantly Down-Regulated Sets |
|---|---|---|---|
Cellular component |
31 |
26 |
5 |
|
Molecular function |
9 |
7 |
2 |
|
Biological process |
35 |
32 |
3 |
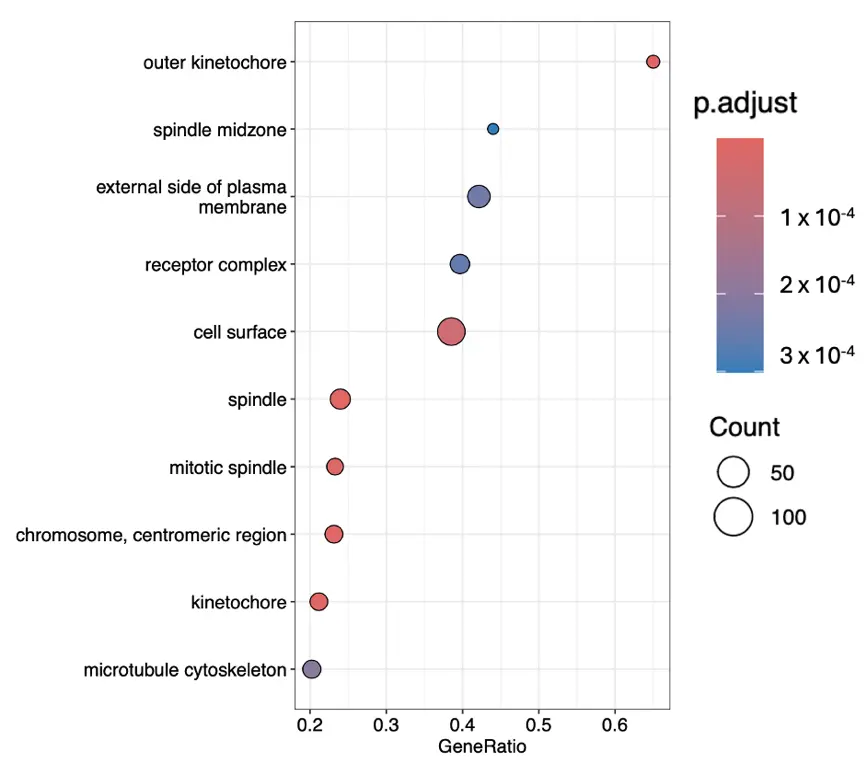
Figure 2. The most significant gene ontology terms within cellular components ranked according to their gene ratios.
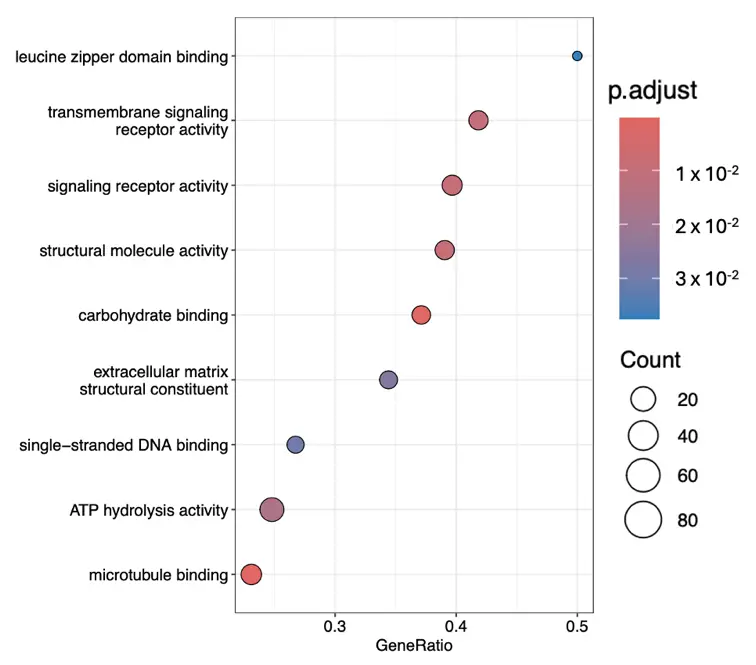
Figure 3. The most significant gene ontology terms within the molecular function cluster ranked according to their gene ratios.
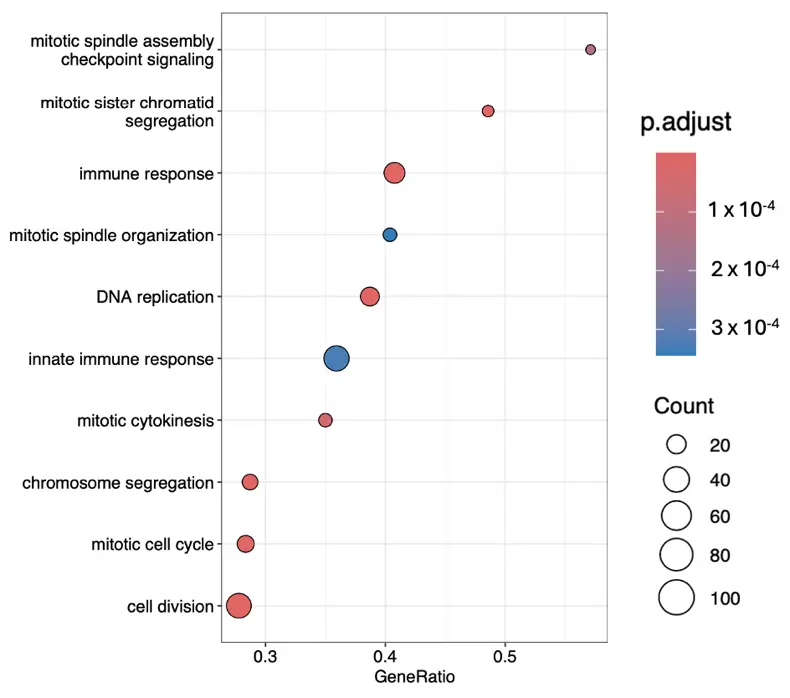
Figure 4. The most significant gene ontology terms within biological processes ranked according to their gene ratios.
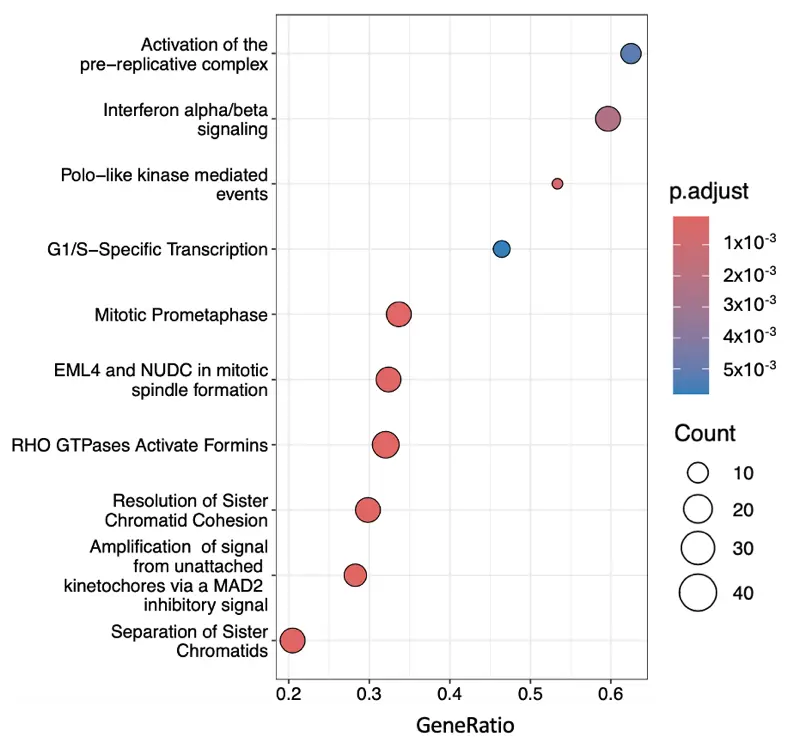
The most significantly expressed genes were also analysed using Reactome, which revealed 15 up-regulated and 7 down-regulated pathways. Figure 5 shows the 10 most significantly enriched and up-regulated pathways. The list of these pathways can be found in alphabetical order in Supplementary File S3.
4. Discussion
GSEA revealed significant up-regulation of genes involved in signalling, mitotic and replication machinery, and immune and inflammatory activation. Using the GSEA and Reactome analysis, we suggest four groups of events which may be significant in coordinating the transformation of fibroblasts to myofibroblasts, in response to TGF-β1:
Activation and signalling rewiring: GPCR and receptor activity terms (e.g., signalling receptor activity, transmembrane signalling receptor activity, GPCR signalling pathways) indicate fibroblasts are tuning their surface “antennae” for diverse inputs. ATP hydrolysis activity and microtubule binding highlight preparation for energy-intensive remodelling and cytoskeletal engagement. Binding functions shift toward carbohydrate binding and single-stranded DNA binding (ECM and gene regulation interfaces), while some interactions (e.g., decrease in leucine zipper binding) hint at transcriptional reprogramming. Early suppression of ECM structural constituents suggests matrix synthesis is delayed until signalling and proliferation are established.
Proliferative Surge: Cellular component enrichment indicates a dramatic up-regulation of mitotic and replication machinery. Structures such as the mitotic spindle, kinetochore, chromosome centromeric region, midbody, and anaphase-promoting complex are all elevated. DNA replication initiation, spindle assembly, chromosome segregation, and cytokinesis are also up-regulated. This is coupled with microtubule cytoskeleton reorganization and checkpoint signalling, ensuring fidelity during rapid division. Down-regulation of stress fibres and Z disc indicates remodelling of the actin cytoskeleton away from contractile, stationary structures toward dynamic, division-supportive architecture.
Immune-like and Metabolic Reprogramming: TGF-β1–treated fibroblasts also show immune and inflammatory activation. Processes like complement activation, innate immune response, inflammatory response, and defence response to virus are up-regulated, along with negative regulation of viral genome replication. This fits with the concept of fibroblasts as sentinel cells that contribute to immune signalling in injury or fibrosis [17,18]. Sterol metabolism and ATP-dependent processes are increased, suggesting lipid membrane remodelling and sustained energy demand. Down-regulation of respiratory chain complex I hints at a shift from oxidative phosphorylation toward glycolysis (a common activation pattern). Suppression of negative regulation of phosphorylation indicates stronger kinase signalling cascades, which act to amplify both proliferative and immune pathways.
Delayed Structural Remodelling: Across datasets, ECM assembly and structural ECM components are down-regulated in this early activation window. Instead, up-regulated terms point to intermediate filaments and membrane raft domains, which suggests internal structural fortification. Receptor complexes and cell–cell junction components are also modulated, indicating that the fibroblasts are being prepared for later ECM deposition and stable tissue integration.
Interestingly, we have observed a down-regulation in the genes controlling ECM structural constituents, ECM assembly and signal recognition particle (SRP) co-translational protein. This contrasts with the known effect of TGF-β1 where it up-regulates ECM production and secretion. One explanation for this contradiction could be that the RNA extraction was performed at 72 h after TGF-β1 treatment, and ECM production in these cells does not start until 5 days after the treatment [15,16]; therefore, the cells in this study have not entered the ECM production state yet, and resources are diverted to cell cycle and proliferation. This is in alignment with a previous study where a TGF-β1 time-course in human dermal fibroblasts identified a clear early phase (0–72 h) where cell-cycle and glycolysis genes are up-regulated, followed by a switch after 72 h toward the differentiated myofibroblast program. This study also showed proliferation increasing through 72 h, declining as Smad-dependent differentiation takes over across days 4–7 [14]. Such a pattern matches our mitotic spindle/kinetochore/DNA replication enrichments at 72 h. In contrast, a study using human lung fibroblasts showed a rapid upregulation of ECM production genes as early as 9 h after TGF-β1 treatment [19]. The difference could be simply due to the different cell types. A time course covering early time points as well as late time points would be able to shed more light into the temporal gene expression changes during the transformation of fibroblasts to myofibroblasts from different organs.
Down-regulation of SRP-dependent co-translational protein is unexpected. SRP is a ribonucleoprotein complex that recognizes the signal peptide on a nascent protein as it emerges from the ribosome, pauses translation briefly, then directs the ribosome–nascent chain complex to the endoplasmic reticulum (ER) membrane. There, translation resumes, and the protein is co-translationally threaded into the ER for secretion or membrane insertion. Many ECM proteins (collagens, fibronectin, laminins) are secreted and require SRP targeting to enter the ER [20]. Down-regulation of this pathway in our data could mean that global secretion of proteins may be reduced temporarily while the resources are diverted to cell proliferation. Such resource diversion would be interesting to explore in future research.
A previous study investigated the changes in gene expression using RNA sequencing in human dermal fibroblasts in response to TGF-β1 treatment at different time points (0, 1, 2, 3, 4, 5, 6 and 7 days) [14]. Our results concur with theirs, particularly cell proliferation dominating the phenotype over ECM production in the first 72 h, as mentioned above. The two studies also agree on the glycolysis switch: Ye et al. [14] report a switch from oxidative phosphorylation to glycolysis during the early phase of transformation. We also observed a down-regulation of respiratory chain complex I and upregulation of ATP/sterol metabolism, consistent with reprogramming toward glycolysis/membrane biogenesis at day 3. However, the two studies diverge at down-regulation of the secretory pathway. Our results show down-regulation of SRP-dependent co-translational targeting as mentioned above at 72 h. Ye et al. [14] don’t report secretory-routing suppression; their emphasis is that ECM/myofibroblast features consolidate after day 5. Our SRP signal may indicate a transient reprioritization during the proliferative burst, which is not explicitly documented by Ye et al. This difference may result from the source of dermal fibroblasts: we used human primary dermal fibroblasts isolated from HTS, whereas Ye et al. used commercially available human primary dermal assuming from normal skin. It would be interesting to compare the SRP signal in normal and HTS fibroblasts at different time points.
Limitations and strengths: The unique strength of our study is that we used human primary dermal fibroblasts from HTS skin samples; however, we did not perform a time course.
The changes in gene expression have not been confirmed using protein expression, biochemical or functional analysis.
We isolated fibroblasts from burn scar tissue; although there were α-SMA-negative suggesting that they were not activated (i.e., quiescent) fibroblasts, ideally, cells isolated from burn scar and non-burn skin from the same patient should be compared.
5. Conclusions
TGF-β1 transforms fibroblasts into highly proliferative, signalling-competent, immune-active, and metabolically rewired cells, primed for later stages of matrix deposition and fibrotic tissue remodelling. This matches a biological logic: first sense and expand, then build and reinforce.
Supplementary Materials
The following supporting information can be found at: https://www.sciepublish.com/article/pii/709. Supplementary File S1: Raw data of gene read counts from untreated and treated cells from 3 patients in 3 replicates. Tab 1: Gene read counts; Tab 2: untreated vs. treated fold change. Supplementary File S2: The list of 50 most up and down regulated genes. Supplementary File S3: The results from GEAS and Reactome analysis. Tab 1: Most up and down regulated genes in GEAS analysis within “cellular components”; Tab 2: Most up and down regulated genes in GEAS analysis within “molecular function”; Tab 3: Most up and down regulated genes in GEAS analysis within “biological processes”; Tab 4: Most up and down regulated pathways in Reactome analysis.
Acknowledgments
The authors thank the patients for donating their tissue for the purposes of this research. The authors thank the staff at Eurofins and Edinburgh Genomics for RNA sequencing and data analysis, respectively.
Author Contributions
Conceptualization, A.R.L. and S.C.; Methodology, A.R.L.; Analysis, M.N., A.R.L., S.K.; Investigation, A.R.L. and K.M.F.; Resources, S.C. and P.D.; Data Curation, A.R.L.; Writing—Original Draft Preparation, S.C.; Writing—Review & Editing, A.R.L., M.N., S.K., K.M.F., P.D., S.C.; Supervision, A.R.L.; Project Administration, A.R.L.; Funding Acquisition, S.C.
Ethics Statement
The study was conducted according to the guidelines of the Declaration of Helsinki, and approved by the NHS Health Research Authority and NHS East of England—Cambridge Central Research Ethics Committee (REC 18/EE/0072 on 11 April 2018), and institutional approval granted from Anglia Ruskin University (FMSFREP/17/18 187 on 24 April 2018).
Informed Consent Statement
Informed consent was obtained from all subjects involved in the study.
Data Availability Statement
Full data set is available upon request from the corresponding author.
Funding
This research received no external funding.
Declaration of Competing Interest
The authors declare that they have no known competing financial interests or personal relationships that could have appeared to influence the work reported in this paper.
References
- Finnerty CC, Jeschke MG, Branski LK, Barret JP, Dziewulski P, Herndon DN. Hypertrophic scarring: The greatest unmet challenge after burn injury. Lancet 2016, 388, 1427–1436. doi:10.1016/S0140-6736(16)31406-4. [Google Scholar]
- Brewin MP, Homer SJ. The lived experience and quality of life with burn scarring—The results from a large-scale online survey. Burns 2018, 44, 1801–1810. doi:10.1016/j.burns.2018.04.007. [Google Scholar]
- van Baar ME. Epidemiology of Scars and Their Consequences: Burn Scars. In Textbook on Scar Management; Springer International Publishing: Cham, Switzerland, 2020; pp. 37–43. doi:10.1007/978-3-030-44766-3_5. [Google Scholar]
- Ogawa R. The Most Current Algorithms for the Treatment and Prevention of Hypertrophic Scars and Keloids: A 2020 Update of the Algorithms Published 10 Years Ago. Plast Reconstr. Surg. 2022, 149, 79e–94e. doi:10.1097/PRS.0000000000008667. [Google Scholar]
- Davies BM, Carter AR, Brindley DA. A scoping review of the treatment of hypertrophic scars and keloids. Dermatol. Rev. 2024, 5, e118. doi:10.1002/der2.118. [Google Scholar]
- Klingberg F, Hinz B, White ES. The myofibroblast matrix: implications for tissue repair and fibrosis. J. Pathol. 2013, 229, 298–309. doi:10.1002/path.4104. [Google Scholar]
- Liu Y, Li Y, Li N, Teng W, Wang M, Zhang Y, et al. TGF-β1 promotes scar fibroblasts proliferation and transdifferentiation via up-regulating MicroRNA-21. Sci. Rep. 2016, 6, 32231. doi:10.1038/srep32231. [Google Scholar]
- Tan J, Wu J. Current progress in understanding the molecular pathogenesis of burn scar contracture. Burn. Trauma. 2017, 5, 14. doi:10.1186/s41038-017-0080-1. [Google Scholar]
- Kohlhauser M, Mayrhofer M, Kamolz L-P, Smolle C. An Update on Molecular Mechanisms of Scarring—A Narrative Review. Int. J. Mol. Sci. 2024, 25, 11579. doi:10.3390/ijms252111579. [Google Scholar]
- Tomasek JJ, Gabbiani G, Hinz B, Chaponnier C, Brown RA. Myofibroblasts and mechano-regulation of connective tissue remodelling. Nat. Rev. Mol. Cell Biol. 2002, 3, 349–363. doi:10.1038/nrm809. [Google Scholar]
- Zhang S, Zhang Y, Min P. Single-Cell and Bulk Transcriptome Data Integration Reveals Dysfunctional Cell Types and Aberrantly Expressed Genes in Hypertrophic Scar. Front. Genet. 2022, 12, 806740. doi:10.3389/fgene.2021.806740. [Google Scholar]
- Vorstandlechner V, Laggner M, Kalinina P, Haslik W, Radtke C, Shaw L, et al. Deciphering the functional heterogeneity of skin fibroblasts using single-cell RNA sequencing. FASEB J. 2020, 34, 3677–3692. doi:10.1096/fj.201902001RR. [Google Scholar]
- Song B, Zhu Y, Zhao Y, Wang K, Peng Y, Chen L, et al. Machine learning and single-cell transcriptome profiling reveal regulation of fibroblast activation through THBS2/TGFβ1/P-Smad2/3 signalling pathway in hypertrophic scar. Int. Wound J. 2024, 21, e14481. doi:10.1111/iwj.14481. [Google Scholar]
- Ye Z, Li W, Jiang Z, Wang E, Wang J. An intermediate state in trans-differentiation with proliferation, metabolic, and epigenetic switching. IScience 2021, 24, 103057. doi:10.1016/j.isci.2021.103057. [Google Scholar]
- Lapthorn AR, Ilg MM, Sullivan JV, Dziewulski P, Cellek S. Phenotypic screening identifies hydroxypyridone anti-fungals as novel medicines for the prevention of hypertrophic scars. Eur. J. Pharmacol. 2022, 937, 175374. doi:10.1016/j.ejphar.2022.175374. [Google Scholar]
- Lapthorn AR, Ilg MM, Dziewulski P, Cellek S. Hydroxypyridone anti-fungals selectively induce myofibroblast apoptosis in an in vitro model of hypertrophic scars. Eur. J. Pharmacol. 2024, 967, 176369. doi:10.1016/j.ejphar.2024.176369. [Google Scholar]
- Correa-Gallegos D, Jiang D, Rinkevich Y. Fibroblasts as confederates of the immune system. Immunol. Rev. 2021, 302, 147–162. doi:10.1111/imr.12972. [Google Scholar]
- Buckley CD, Pilling D, Lord JM, Akbar AN, Scheel-Toellner D, Salmon M. Fibroblasts regulate the switch from acute resolving to chronic persistent inflammation. Trends Immunol. 2001, 22, 199–204. doi:10.1016/S1471-4906(01)01863-4. [Google Scholar]
- Chambers RC, Leoni P, Kaminski N, Laurent GJ, Heller RA. Global Expression Profiling of Fibroblast Responses to Transforming Growth Factor-β1 Reveals the Induction of Inhibitor of Differentiation-1 and Provides Evidence of Smooth Muscle Cell Phenotypic Switching. Am. J. Pathol. 2003, 162, 533–546. doi:10.1016/S0002-9440(10)63847-3. [Google Scholar]
- Hsieh H-H, Shan S. Fidelity of Cotranslational Protein Targeting to the Endoplasmic Reticulum. Int. J. Mol. Sci. 2021, 23, 281. doi:10.3390/ijms23010281. [Google Scholar]