1. Introduction
The aerospace industry is continuously evolving due to the increasing demand for commercial aircraft that suffer fuel-efficiency pressure and reduce the environmental impact. In addition, aircraft manufacturers need to cover delivery delays partially attributed to the COVID-19 pandemic and the bottlenecks faced in the production lines [
1]. The wing assemblies and some of the fuselage structures are made of stack layers of aluminum alloy, titanium alloy and CFRP (Carbon Fiber Reinforced Polymer), and it requires drilling operations of the assembled stacks for riveting/bolt nut assembly purposes [
2]. The practice of stacking different layers of materials, especially in wing assemblies, engine pylons and the main fuselage is advantageous as it offers a blend of mechanical properties from different stacked materials [
3]. For example, the engine pylon is made of aluminium, titanium, and composites, which are assembled together by a bolt/nut and require a drilling operation [
4]. The single shot drilling process results in a set of problems, including poor hole quality, rework and reduced tool life, mainly due to the different machinability of materials in the sandwich [
5]. As the hole making operation is one of the last crucial operations during aircraft assemblies, deviations will lead to loss of time and money spent in the previous stages of the production process.
Portillo et al. [
6] monitored power signals from the machine spindle during axial drilling of aluminum, cast iron and steel stacks. They determine material transition by defining threshold values to detect material changes during cutting. Neugebauer et al. [
7] used Acoustic Emission (AE) sensors and thrust forces during stack drilling of CFRP and aluminum alloy. A gradient monitoring algorithm was developed to identify the true position of the tool in a stack. The noise of the AE signals was one of the significant challenges observed for tool position identification, as also claimed by Renganathan et al. [
8] that detected tool transition between the layers using AE crest factor and thresholds. Pardo et al. [
9] discussed decision making strategies to identify the tool position in an Aluminium-CFRP stack during drilling by monitoring thrust force in a CNC machine through a dynamometer and motor current in a portable drilling unit. Their objective was to consider tool wear and its effects on the thresholds for detection of tool position. Gerber et al. [
10] proposes and compares three material detection methods for multi-material stack drilling, specifically addressing challenges posed by tool wear and signal distortions. The study contributes to the development of a digital twin for multi-material stack drilling with Automatic Drilling Unit, aiming to guarantee drilled hole quality and integrate this technology with human operators.
Several researchers implement machine learning (ML) models to optimise the machining process, and numerous works have demonstrated the applicability [
11]. Most common topics include predicting tool life (tool wear monitoring), surface quality, cutting forces and energy consumption [
12,
13,
14]. For example, Domínguez et al. [
15] demonstrated the reliability of tool wear prediction in real time using ML models during drilling of CFRP/Titanium/Aluminium stacks for aerospace manufacturing application. They concluded that the gradient boosting regressor model was most accurate in comparison to other models. Also in drilling, Köttner et al. [
16] predicted cutting forces by training ML models with motor current data from drilling units used in assembly lines. In this case, they use the data already available on the machine to train and the ML model, eliminating the need for expensive additional equipment.
For effective optimization of the drilling process, the system should identify the material in real time using sensor data and subsequently adjust the cutting parameters to the requirements of each layer [
17]. The majority of existing research focused on axial drilling in aerospace stacks, particularly those composed of composites and metallic alloys. The article published by Haoua et al. [
18] showed a methodology that used an electrical Automatic Drilling Unit (eADU) that could adapt the parameters while drilling multi-material (CFRP-Aluminum) stacks. Thrust force, torque, spindle current, servomotor current and workpiece vibrations were monitored for feature extraction. A random forest ML model was trained to develop a material recognition method. Zhang et al. [
19] proposed a deep learning-based approach to accurately identify the crucial process incidence in drilling aluminium-CFRP stacks. Thrust force and torque signals are monitored, and the signal’s feasibility boundary for deep learning models is established for industry application, especially where real-time and low latency are valued.
A smaller number of studies explore helical milling on aerospace stacks [
20,
21,
22] and utilize external sensors to monitor data to optimize the hole making operation. This strategy of hole making has offered significant advantages in terms of hole quality compared to axial drilling in stacked applications, mostly due to better chip breakage and evacuation [
23].
Our work aims to address this gap by showcasing material prediction using trained machine learning models during helical milling of aluminum and titanium stacks on a CNC machine utilizing internal sensors. ML models can be further useful for creating digital twins or the application of AI for intelligent machining [
24,
25]. This study extends our earlier work on a material identification methodology, which utilized CNC machine spindle power to develop material data maps [
26]. In this regard, the data maps of cutting coefficients developed from helical milling experiments were used as training data sets for different machine learning models. The trained ML models were used to predict material layers in trimetallic stacks made of aluminium and titanium alloys. The results show accurate predictions irrespective of cutting conditions, stack sequences, and the number of layers compared to the experiments. This model can have significant interest for easy implementation on the shop floor, which aides to adapt smart machining during stack drilling of aerospace materials without any additional expensive investment or change of setup.
2. Helical Milling Process and Cutting Power
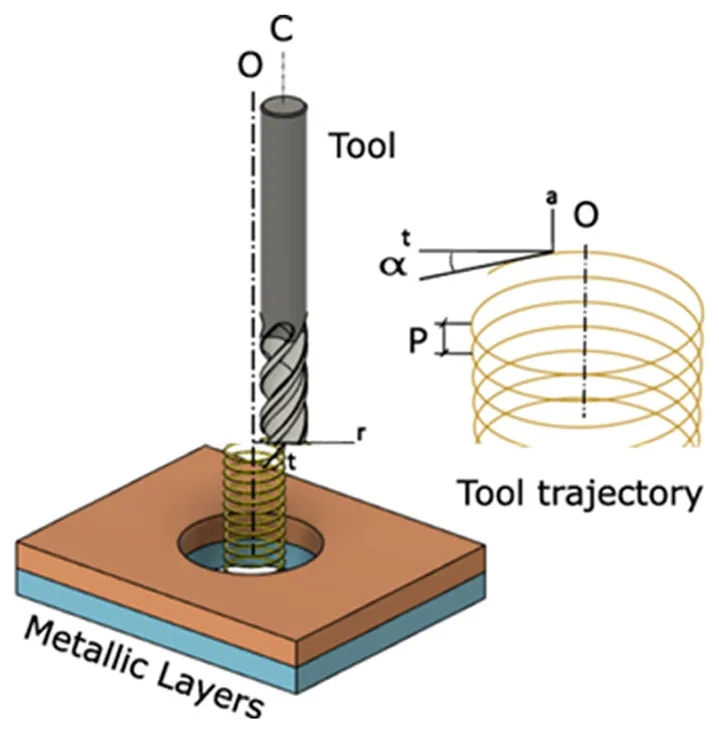
The helical milling, also called orbital drilling, as presented in
, is a milling operation where an end mill follows a helical trajectory to produce a hole or enlarge an existing hole to the machined diameter
D.
. Helical milling parameters.
The offset distance between tool center C and hole center O is the tool trajectory radius, designated as
Rtt, and the helical path is a composition of the circular and vertical movement, so the cutting generates chips by the peripheral and bottom cutting edges. The cutting velocity
Vcp (m/min) of the peripheral edge defines the spindle speed
N (in rpm, or d
θ2/dt in rad/s) as a function of the tool diameter
Dt in the relation:
N = (1000
Vcp)/(π
Dt).
2.1. Machining Parameters
As the milling tool follows a helical trajectory, the feed per tooth in the tool path (
fz) is a combination of the feed per tooth on the circular trajectory in the XY plane (
fxy) and the axial feed per tooth
fa in the vertical direction (
Equation (1)).
The ramp angle
α (
Equation (2)) is a useful parameter to describe the inclination of the helical path [
27]:
To identify the number of spirals, the pitch
P (mm/rev) of the helical path is calculated as a function of
fxy,
fa and
Rtt (or described using the tool diameter
Dt and the machined diameter
D):
The orbital speed
Norb (in rpm or
dθ1/dt in rad/s) describes the secondary revolution velocity around the hole center O, and it is calculated as a function of the feed velocity (
Vf =
fa Zn N, where
Zn is the number of flutes in the tool) and the pitch
P:
2.2. Power Model for Material Identification
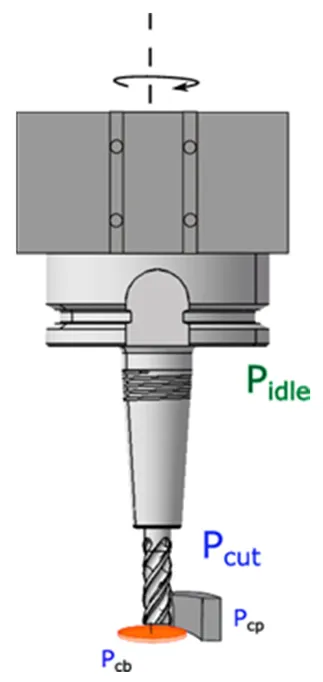
The total power
Ptotal consumed during helical milling in a CNC machine is majorly because of the cutting force
Pcut by the end mill, tool feed motion
Pfeed in helical trajectory (combination of the servo motors in three axis) and also to overcome the inertia of the spindle drive system itself
Pidle, as expressed in
Equation (5).
The spindle power consumption during helical milling is schematically described in the
.
. Spindle power consumption during helical milling.
can be obtained by monitoring the spindle power value during non cutting positions at a specific spindle speed. This power consumption is due to friction in spindle bearings required to keep the rotation overcoming the mass of the rotating system [
28]. The power consumed during cutting
Pcut is described as the sum of all the tangential forces (cutting forces
Ft) along the cutting edges in contact with the material multiplied by the cutting velocity. The servomotors consume the power to move the table or the tool to describe the tool trajectory and remove the material continuously. The feed power, calculated using the feed velocity
Vf $$\,$$ and the force on the feed direction
Ff$$\,$$ of each cutting edge.
Equation (6) describes power (
Pfeed) because of tool feed motion in XY (
Pfxy) and Z (
Pfa) direction simultaneously, the power drawn by the feed drive motors during helical milling operation.
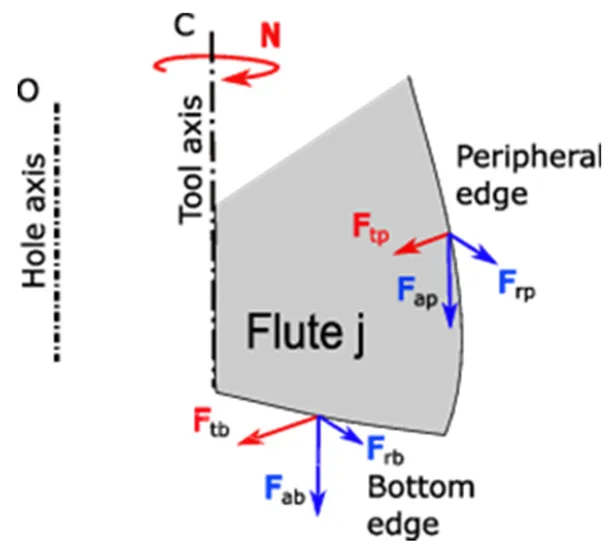
Pfxy can be attributed to the consumption of the table feed in radial direction
Vfr (mm/min), and corresponding cutting force components are shown in
, calculated by:
. Force components in a single flute (bottom and peripheral edges).
Similarly,
Pfz can be attributed to axial table feed
Vfa and axial force component
Fab:
During experiments, the cutting power
Pcut can be obtained from the monitored spindle power
Pspindle, considering idle power
Pidle, which is specific for a particular CNC machine under consideration.
Pcut can be further expressed as
Pcb and
Pcp, indicating power consumption due to cutting action at the bottom and peripheral edge of the end mill respectively during helical milling (
). The corresponding equation is as follows:
Depending upon the tool helix angle, the number of peripheral flutes simultaneously in contact with the part is different. It can be determined considering the peripheral immersion angle between ϕ = 0 to 180° for helical milling. It is important to note that the bottom edges of all the flutes are always in contact with the workpiece during helical milling. The function
g(
θ2) has a binary valor that describes if the
j peripheral edge is in contact (1), or not (0) with the part, in or out of the immersion angle zone. The cutting power
Pcut in helical milling can be expressed by:
where
Vcp is the cutting velocity of the peripheral edge (constant along the cylindrical envelop) and
Vcb here considered as the average cutting velocity on the bottom edge. In fact, the cutting velocity at each point of the bottom edge is different, as it is dependent on distance from the tool center, so it is a simplification needed for the modeling.
Tangential force at tool periphery (
Ftp) and tangential force at bottom edge (
Ftb) can be further expressed as a function of specific force coefficients (
Ktp and
Ktb) and uncut chip load (
hp and
bp refered to the periphery and at the bottom edges are
hb and
bb) as follows:
The detailed chip geometry modeling and description can be accessed from our previous work [
26].
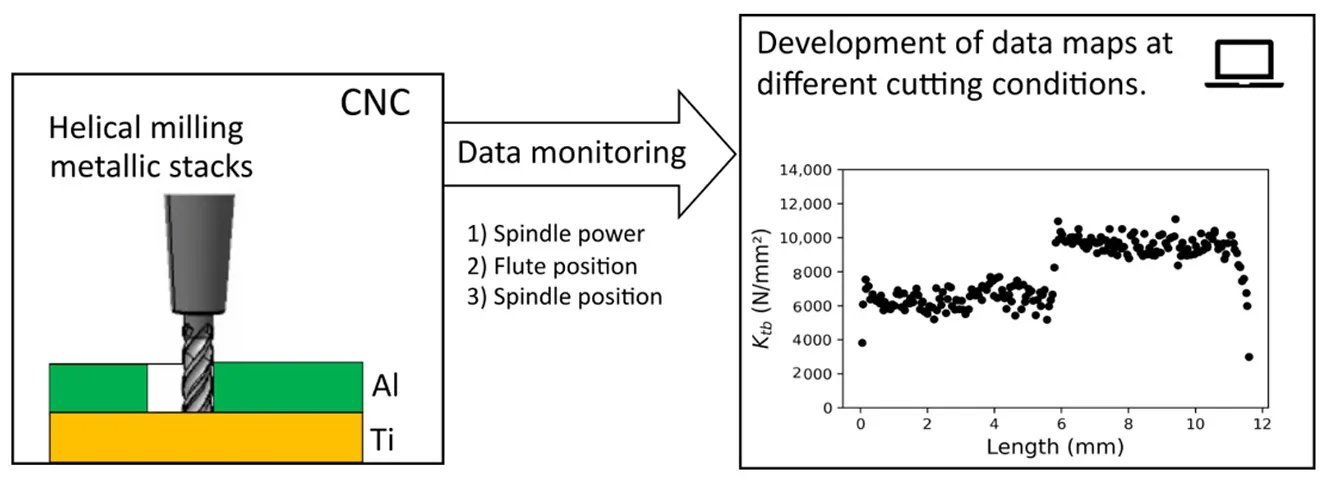
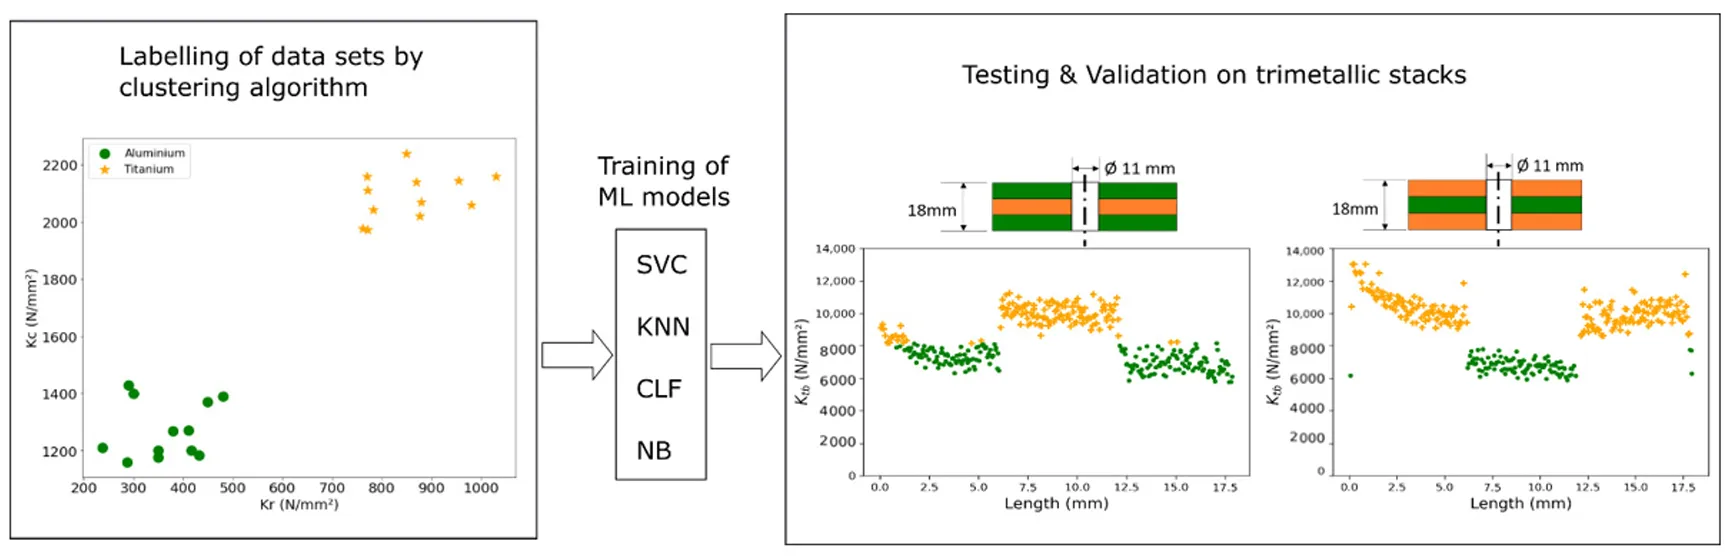
2.3. Data Maps for Smart Machining
Data maps consisting of cutting coefficients aid in identifying material layers during helical milling of aluminum and titanium alloys [
29]. Several such data maps were developed for aluminium and titanium alloys independently, and also for bimetallic stacks under different cutting conditions by monitoring spindle power from the CNC machine. The schematic of the approach is shown in the
.
. Data maps for material identification.
In this regard, data points were labeled using Density Based Spatial Clustering Algorithm (DBSCAN) corresponding to aluminum and titanium material layers at different cutting conditions. The labeled data sets were used to train different machine learning models for predicting material layers based on cutting coefficients at different cutting conditions. Several prediction models like K Nearest Neighbour (KNN), Linear Regression, NB (Naive Bayes), SVC (Support Vector Classifier) and CLF (Classifier) were trained by labled data set, and accuracy scores were compared. The predicted results were compared with the actual experiments to validate the prediction results with actual material layers and thickness. The schematic of this approach is shown in
. The results of the trained ML models are described in the subsequent results section of this article.
. Material prediction in trimetallic stacks.
3. Experiments
3.1. Experimental Setup
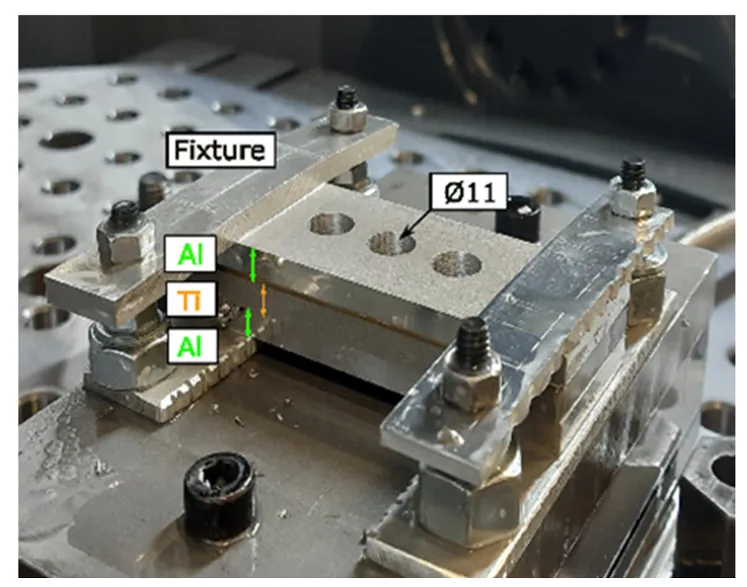
Experiments were carried out on a CNC milling center DMU85-DMG mono block machine under wet conditions. A carbide end mill from Fraisa with 4 flutes and 8 mm diameter was used to produce a hole of 11 mm by helical milling. The stack is made of aluminum (2024A) and titanium (Ti6Al4V) alloy with a 6 mm thickness of each layer bearing dimensions 35 mm × 100 mm. The material layers are fastened together by a bolt/nut assembly using a fixture as shown in
. The stack sequences are represented as Al→Ti→Al for aluminum, titanium and aluminum sequence and Ti→Al→Ti for titanium, aluminum and titanium sequence for trimetallic sequences. For spindle power acquisition, the Sinucom NC trace software tool, which can monitor spindle power at a rate of 4 ms, is utilised.
. Experimental setup for trimetallic stacks.
Along with spindle power, tool position data from CNC machine (X1,Y1,Z1) and spindle angular position SP is also recorded. An external photoelectric sensor (WL150-P132 Sick®) is setup to identify cutting flute position [
21].
3.2. Design of Experiments
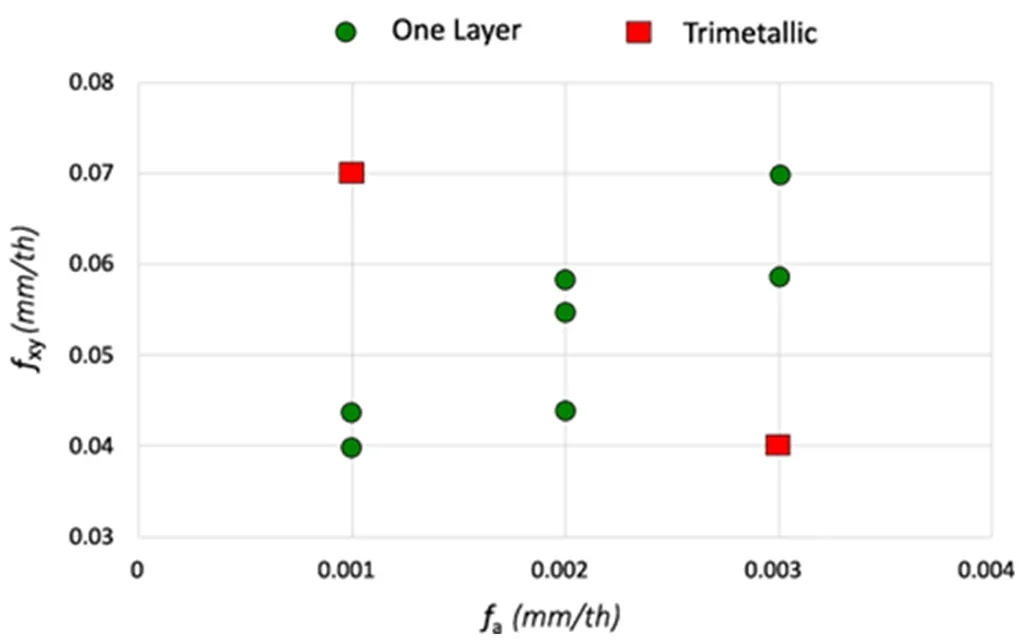
The cutting conditions for the trimetallic stack experiments were chosen in continuation of our previous work on bimetallic and singular stacks.
shows cutting conditions for trimetallic stacks for both the stack sequences (Al→Ti→Al and Ti→Al→Ti) under wet conditions.
shows an overview of cutting conditions, specifically, feed per tooth used for helical milling experiments on individual materials and also bimetallic stacks previously. It is important to claim that the two sequences of tri-stacks are chosen to show that it is possible to predict for any number of layers. In the actual configuration in the laboratory, which uses short plates, adding more layers could add additional forces that are not representative of the industrial case, such as perpendicular torque or inter-layer shear.
The data maps generated from these experiments are used to train ML models to predict material layers in trimetallic stacks. The results are compared with the actual experiments with the indicated cutting conditions in
and
.
.
Cutting conditions for trimetallic stacks: Al→Ti→Al and Ti→Al→Ti (D = 11 mm and Dt = 8 mm).
| Test |
fa (mm/th) |
fxy (mm/th) |
Vc m/min |
N (rpm) |
Norb (rpm) |
P (mm/rev) |
α (degree) |
| 1 |
0.001 |
0.07 |
60 |
2387 |
71 |
0.13 |
0.82 |
| 2 |
0.003 |
0.04 |
60 |
2387 |
41 |
0.71 |
4.29 |
| 3 |
0.003 |
0.04 |
40 |
1592 |
27 |
0.71 |
4.29 |
. Summary of cutting conditions for helical milling experiments.
The following subsections present the results of helical milling experiments on trimetallic stacks of aluminum and titanium alloys. The cutting power and material prediction based on cutting coefficients by an ML model are presented for different cutting conditions.
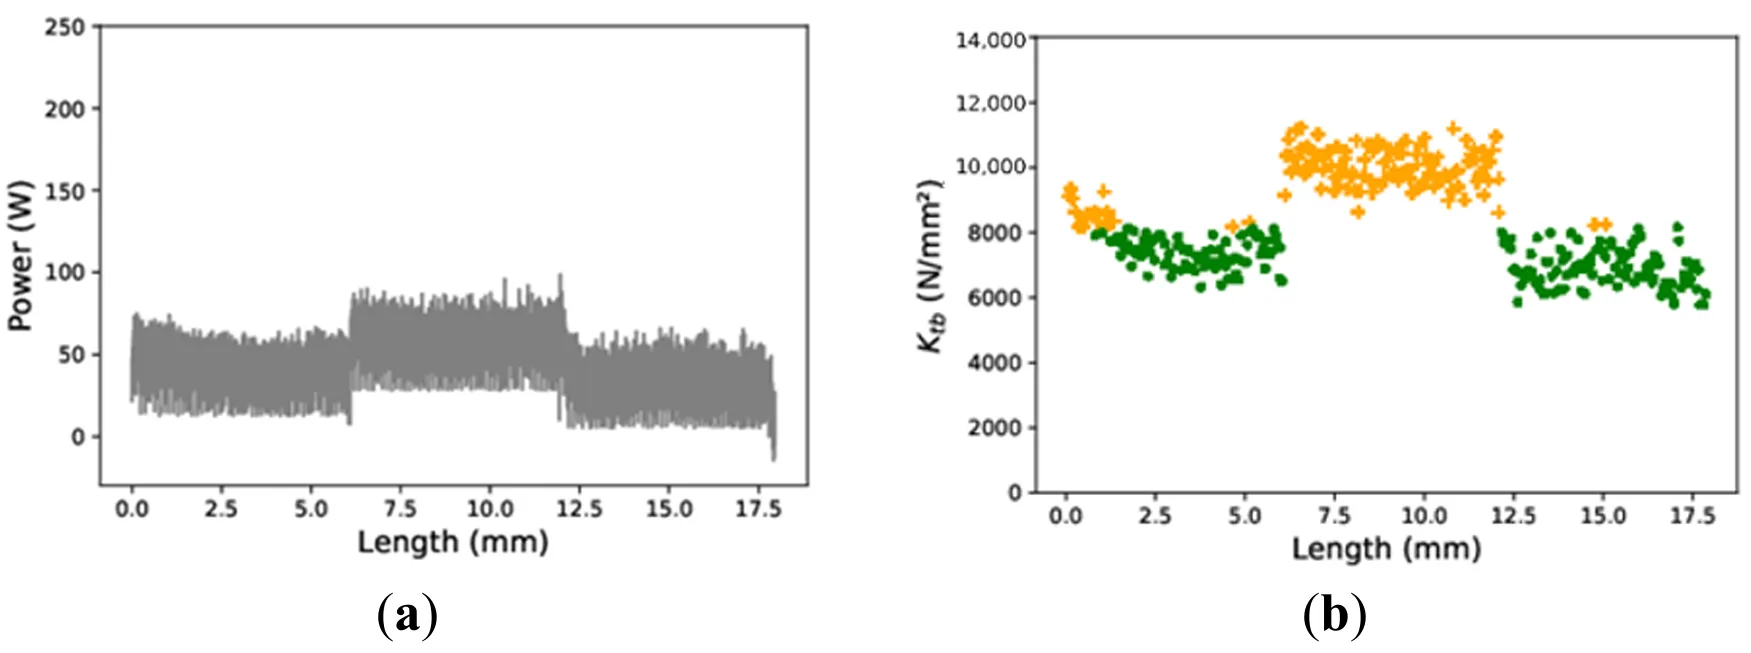
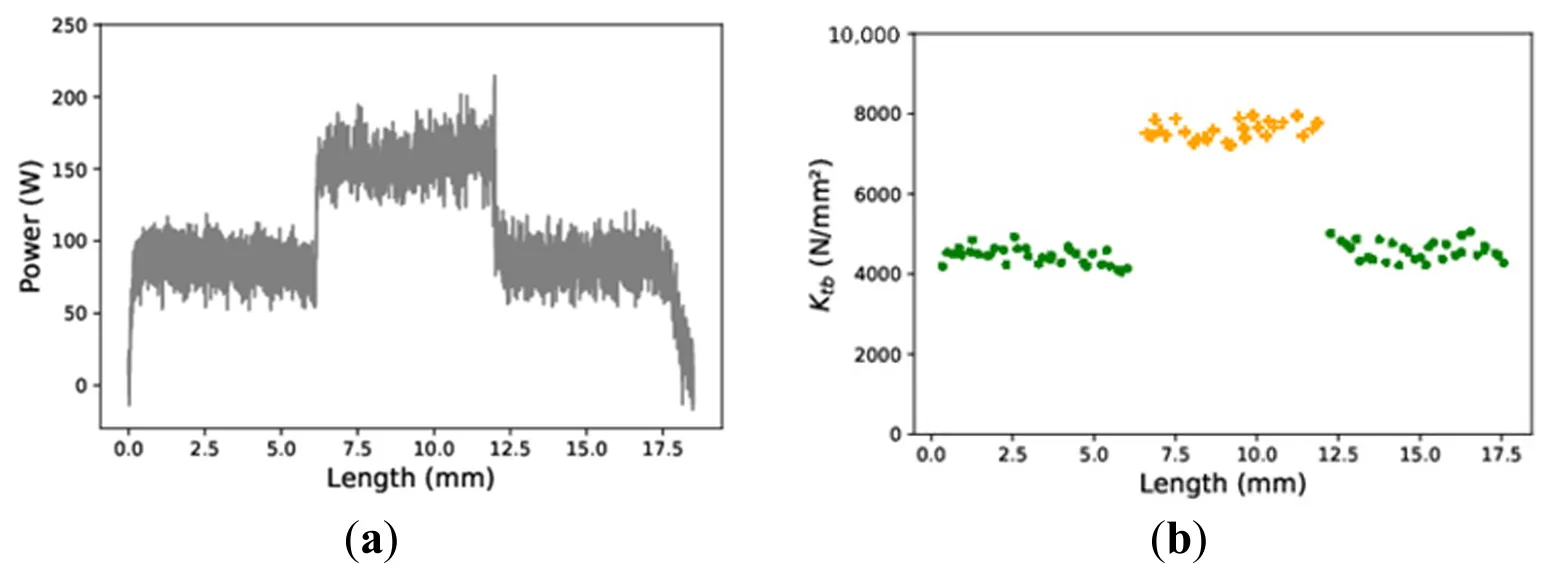
a shows cutting power signals for the Al → Ti → Al sequence at the lowest tool pitch (0.13 mm/rev) and ramp angle (0.82°).
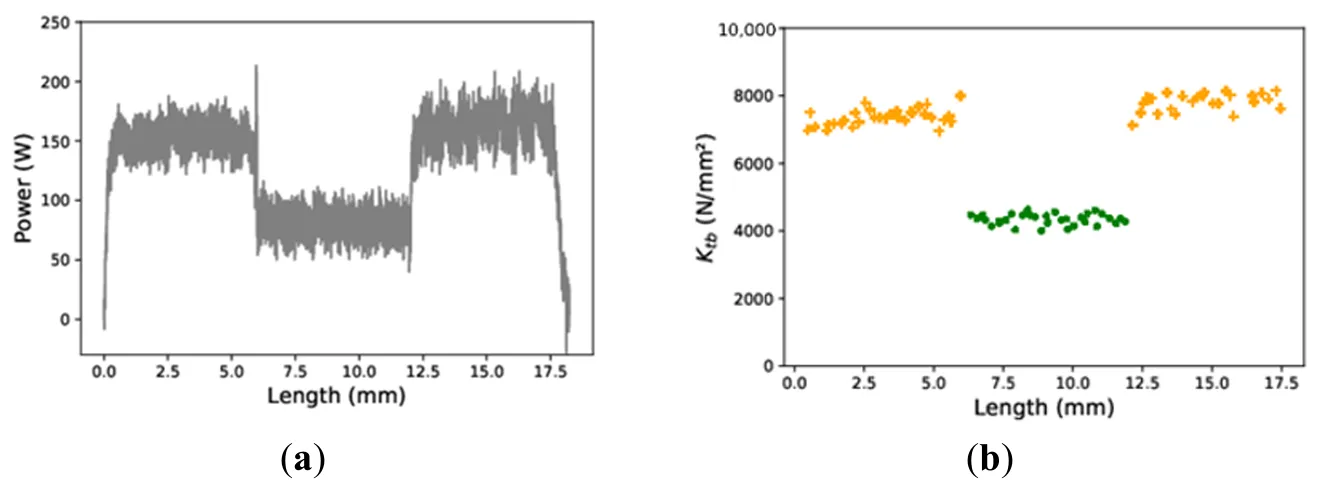
a shows the cutting power signal for the highest tool pitch (0.71 mm/rev) and ramp angle (4.29°). The evolution of the signal corresponding to the depth of aluminum and titanium layers is easily recognizable as expected in the cutting power signals. The signal transition at 6 mm and 12 mm of hole depth corresponds to the individual stack layer thickness. The cutting power signals for the Ti→Al→Ti stack sequence and the corresponding material layer predictions are shown in
and
.
. Al→Ti→Al using<em> f<sub>a</sub></em> = 0.001 mm/th, <em>f<sub>z</sub></em> = 0.07 mm/th<em>. </em>(<strong>a</strong>) Experimental spindle power; (<strong>b</strong>) Material prediction using specific cutting and ML model [Aluminum in <span style="color:#3a7c22;">•</span> and Titanium in <span style="color:#e97132;">+</span>]<em>.</em>
. Al→Ti→Al using <em>f<sub>a</sub></em> = 0.003 mm/th, <em>f<sub>z</sub></em> = 0.04 mm/th<em>. </em>(<strong>a</strong>) Experimental spindle power; (<strong>b</strong>) Material prediction using specific cutting and ML model [Aluminum in <span style="color:#3a7c22;">•</span> and Titanium in <span style="color:#e97132;">+</span>]<em>.</em>
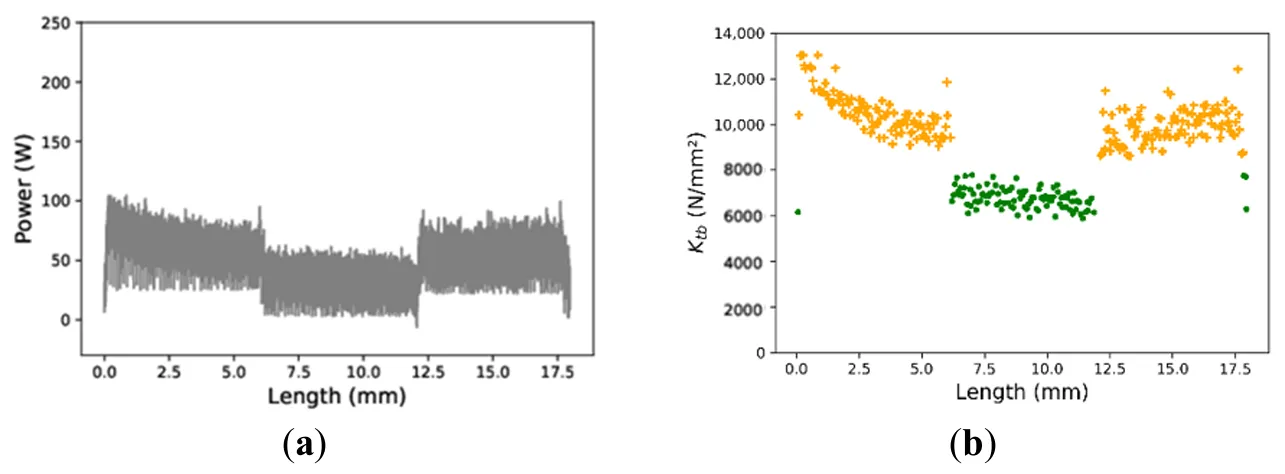
. Ti→Al→Ti using <em>f<sub>a</sub></em> = 0.001 mm/th, <em>f<sub>z</sub></em> = 0.07 mm/th. (<strong>a</strong>) Experimental spindle power; (<strong>b</strong>) Material prediction using specific cutting and ML model [Aluminum in <span style="color:#3a7c22;">•</span> and Titanium in <span style="color:#e97132;">+</span>].
. Ti→Al→Ti using <em>f<sub>a</sub></em> = 0.003 mm/th, <em>f<sub>z</sub></em> = 0.04 mm/th. (<strong>a</strong>) Experimental spindle power; (<strong>b</strong>) Material prediction using specific cutting and ML model [Aluminum in <span style="color:#3a7c22;">•</span> and Titanium in <span style="color:#e97132;">+</span>].
4. ML Model for Layer Prediction
Several prediction models like K Nearest Neighbor (KNN), Linear Regression, NB (Naive Bayes), SVC (Support Vector Classifier) and CLF (Classifier) were trained by labeled data set obtained by a clustering algorithm. The model score accuracy of these models varied between 95% to 98% and the SVC model performed better in comparison to all the models for our data set. However, it is important to note that the training of ML models was limited to the available data sets (5 different cutting conditions), and this article aimed to demonstrate material predictions by ML models based on data maps consisting of cutting coefficients. The accuracy of the prediction models would significantly improve with increased training by more data sets, including different cutting conditions and hole sizes. The training accuracy score of different ML models and the datasets used for training are shown in
.
.
Model accuracy score for different machine learning models.
Cutting Condition
fxy, fa (mm/th) |
SVC
(%) |
LR
(%) |
Decision Tree (%) |
NB
(%) |
KNN
(%) |
| 0.04, 0.001 |
100 |
80.487 |
100 |
100 |
100 |
| 0.055, 0.002 |
100 |
100 |
82.689 |
100 |
100 |
| 0.07, 0.003 |
100 |
100 |
100 |
100 |
81.47 |
| 0.04, 0.003 |
100 |
100 |
100 |
100 |
100 |
| 0.04, 0.001 |
94.456 |
100 |
95.19 |
100 |
100 |
| 0.055, 0.002 |
100 |
100 |
100 |
100 |
100 |
| 0.04, 0.003 |
97.98 |
93.75 |
100 |
89.28 |
100 |
| 0.04, 0.001 |
100 |
100 |
100 |
100 |
100 |
Based on the values of the cutting coefficient (tangential coefficient at bottom edge:
Ktb), the prediction model could predict the right metallic layer in trimetallic stacks irrespective of the cutting conditions. The material prediction map for trimetallic stacks as predicted by the ML model based on tangential cutting coefficient calculated from cutting power is shown in
,
,
and
on the side of the experimental results to show the reader when the identification is achieved.
The sequence Al→Ti→Al stacks are represented in
b and
b, while
b and
b show predictions for Ti→Al→Ti stack sequences.
The predicted material layers are mostly accurate and match closely with the material layer thickness (6 mm each layer) of trimetallic stack experiments at different cutting conditions.
b shows titanium layer prediction at approximately 0 to 1 mm of hole depth initially in the place of the actual aluminum layer. In a real application case of smart machining, this does not lead to any catastrophic tool failure, as the recommended cutting conditions for titanium are much lower compared to aluminum and would result in low-speed machining in the aluminum layer for the first 1 to 2 mm.
5. Conclusions
The main goal of this work was to demonstrate the application of data maps in training machine learning models to predict the right material layers in aerospace stack drilling. In this regard, the developed data maps during helical milling were labeled by the DBSCAN clustering algorithm, belonging to aluminum and titanium alloys. The labeled data sets obtained at different cutting conditions formed the basis for training different ML models to predict material layers during trimetallic stack helical milling. The SVC (Support Vector Classifier) model performed better with greater accuracy (98%) in predicting the right material layer in the trimetallic stack at different cutting conditions and layer sequences.
The key contribution of this work lies in showing that reliable material layer detection can be achieved directly from machine tool data without external sensors, enabling an easily deployable and cost-effective solution on the shop floor. Beyond its immediate applicability, the developed model provides a scalable template for future stack drilling processes involving aluminum and titanium alloys. It supports smart machining by allowing adaptive selection of cutting conditions for each layer.
Furthermore, this study highlights critical directions for advancing the approach, including reducing sampling time for data acquisition and enabling real-time feedback control, and expanding the data library with maps incorporating varying tool geometries, hole diameters, and cutting parameters. Together, these contributions establish a foundation for intelligent machining strategies in aerospace manufacturing.
Acknowledgments
The work was carried out within the context of the working group Manufacturing '21, which comprises 24 French research laboratories addressing different topics on the manufacturing process.
Author Contributions
Conceptualization, S.D., A.C.A. & P.L.; Methodology, S.D. & A.C.A.; Validation, S.D. & A.C.A.; Investigation, S.D. & A.C.A.; Resources, A.C.A. & P.L.; Data Curation, S.D.; Writing—Original Draft Preparation, S.D.; Writing—Review & Editing, S.D. & A.C.A.; Supervision, A.C.A. & P.L.; Project Administration, A.C.A. & P.L.; Funding Acquisition, A.C.A. & P.L.
Ethics Statement
Not applicable.
Informed Consent Statement
Not applicable.
Data Availability Statement
The data that support the findings of this study are available from the corresponding author, upon reasonable request.
Funding
This work was carried out within the research project SHAIR no.ANR-22-CE10-0009-01, funded by the French National Research Agency (ANR), and officially stamped by the AerospaceValley and EMC2 competitiveness clusters.
Declaration of Competing Interest
The authors declare that they have no known competing financial interests or personal relationships that could have appeared to influence the work reported in this paper.
References
-
1.
Suau-Sanchez P, Voltes-Dorta A, Cugueró-Escofet N. An early assessment of the impact of COVID-19 on air transport: Just another crisis or the end of aviation as we know it?
J. Transp. Geogr. 2020,
86, 102749. doi:10.1016/j.jtrangeo.2020.102749.
[Google Scholar]
-
2.
Boyer RR, Cotton JD, Mohaghegh M, Schafrik RE. Materials considerations for aerospace applications.
MRS Bull. 2015,
40, 1055–1066. doi:10.1557/mrs.2015.278.
[Google Scholar]
-
3.
Parveez B, Kittur MI, Badruddin IA, Kamangar S, Hussien M, Umarfarooq MA. Scientific Advancements in Composite Materials for Aircraft Applications: A Review.
Polymers 2022,
14, 5007. doi:10.3390/polym14225007.
[Google Scholar]
-
4.
AERO—Fire Protection: Engines and Auxiliary Power Units. Available online: https://www.boeing.com/commercial/aeromagazine/articles/2010_q4/3/ (accessed on 28 April 2023).
-
5.
Krishnaraj V, Zitoune R, Collombet F. Comprehensive Review on Drilling of Multimaterial Stacks.
J. Mach. Form. Technol. 2010,
2, 1–32.
[Google Scholar]
-
6.
Portillo E, Cabanes I, Sánchez JA, Orive D, Ortega N, Marcos M. A case study of a flexible software tool in the drilling process.
IFAC Proc. 2012,
45, 333–338. doi:10.3182/20120403-3-DE-3010.00025.
[Google Scholar]
-
7.
Neugebauer R, Ben-Hanan U, Ihlenfeldt S, Wabner M, Stoll A. Acoustic emission as a tool for identifying drill position in fiber-reinforced plastic and aluminum stacks.
Int. J. Mach. Tools Manuf. 2012,
57, 20–26. doi:10.1016/j.ijmachtools.2012.01.013.
[Google Scholar]
-
8.
Prasanth R, Prabukarthi A, Kumar MS, Krishnaraj V, Rajamani R. Identification of drill position in CFRP/Titanium alloy stacks using acoustic emission signals. In Proceedings of International Conference on Advances in Materials, Manufacturing and Applications-AMMA, Trichy, India, 9–11 April 2015.
-
9.
Pardo A, Heinemann R, Nobre NM, Bagshaw L. Assessment of decision-making algorithms for adaptive drilling of aerospace stacks.
Procedia CIRP 2021,
99, 392–397. doi:10.1016/j.procir.2021.03.055.
[Google Scholar]
-
10.
Gerber L, Rey P-A, Ritou M, Cherif M. Material Detection by Stack Drilling Monitoring and Reservoir Computing.
Procedia CIRP 2025,
133, 489–494. doi:10.1016/j.procir.2025.02.084.
[Google Scholar]
-
11.
Kim DH, Kim TJ, Wang X, Kim M, Quan YJ, Oh JW, et al. Smart Machining Process Using Machine Learning: A Review and Perspective on Machining Industry.
Int. J. Precis. Eng. Manuf.-Green Technol. 2018,
5, 555–568. doi:10.1007/s40684-018-0057-y.
[Google Scholar]
-
12.
Liang Y, Dai C, Wang J, Zhang G, To S, Zhao Z. Typical applications and perspectives of machine learning for advanced precision machining: A comprehensive review.
Expert Syst. Appl. 2025,
283, 127770. doi:10.1016/j.eswa.2025.127770.
[Google Scholar]
-
13.
Stencel S, Hartman N. Using machine learning with supplemented NC code to predict machining energy.
Manuf. Lett. 2025,
44, 734–745. doi:10.1016/j.mfglet.2025.06.086.
[Google Scholar]
-
14.
Aggogeri F, Pellegrini N, Tagliani FL. Recent Advances on Machine Learning Applications in Machining Processes.
Appl. Sci. 2021,
11, 8764. doi:10.3390/app11188764.
[Google Scholar]
-
15.
Monferrer CD, Ramajo Á, Moreno JMA, Guisández JLC. Spot-Checking Machine Learning Algorithms for Tool Wear Monitoring in Automatic Drilling Operations in CFRP/Ti6Al4V/Al Stacks in the Aircraft Industry. December 2024. Available online: https://hdl.handle.net/10016/47672 (accessed on 7 September 2025).
-
16.
Köttner L, Mehnen J, Romanenko D, Bender S, Hintze W. Process Monitoring Using Machine Learning for Semi-Automatic Drilling of Rivet Holes in the Aerospace Industry. In Production at the Leading Edge of Technology; Behrens B-A, Brosius A, Hintze W, Ihlenfeldt S, Wulfsberg JP, Eds.; Lecture Notes in Production Engineering; Springer: Berlin/Heidelberg, Germany, 2021; pp. 497–507. doi:10.1007/978-3-662-62138-7_50.
-
17.
Araujo AC, Landon Y, Lagarrigue P. Smart drilling for Aerospace Industry: state of art in research and education. In Proceedings of the 14th CIRP Conference on Intelligent Computation in Manufacturing Engineering, CIRP ICME ˈ20, Naples, Italy, July 2020. Available online: https://hal.archives-ouvertes.fr/hal-02985411 (accessed on 1 June 2021).
-
18.
Haoua AA, Rey P-A, Cherif M, Abisset-Chavanne E, Yousfi W. Material recognition method to enable adaptive drilling of multi-material aerospace stacks.
Int. J. Adv. Manuf. Technol. 2023,
131, 779–796. doi:10.1007/s00170-023-12046-0.
[Google Scholar]
-
19.
Zhang J, Heinemann R, Bakker OJ, Li S, Xiao X, Ding Y. Minimum sufficient signal condition of identifying process incidence in stacked drilling through deep learning.
Mech. Syst. Signal Process. 2025,
229, 112499. doi:10.1016/j.ymssp.2025.112499.
[Google Scholar]
-
20.
Denkena B, Boehnke D, Dege JH. Helical milling of CFRP–titanium layer compounds.
CIRP J. Manuf. Sci. Technol. 2008,
1, 64–69. doi:10.1016/j.cirpj.2008.09.009.
[Google Scholar]
-
21.
Fang Q, Pan Z-M, Han B, Fei S-H, Xu G-H, Ke Y-L. A Force Sensorless Method for CFRP/Ti Stack Interface Detection during Robotic Orbital Drilling Operations.
Math. Probl. Eng. 2015,
2015, 952049. doi:10.1155/2015/952049.
[Google Scholar]
-
22.
Zou Y, Chen G, Ren C, Ge J, Qin X. Performance and mechanism of hole-making of CFRP/Ti-6Al-4V stacks using ultrasonic vibration helical milling process.
Int. J. Adv. Manuf. Technol. 2021,
117, 3529–3547. doi:10.1007/s00170-021-07906-6.
[Google Scholar]
-
23.
Ge J, Reji R, Feist T, Elmore A, McClelland J, Higgins C, et al. Investigating hole making performance of Al 2024-T3/Ti-6Al-4V alloy stacks: A comparative study of conventional drilling, peck drilling and helical milling.
Int. J. Adv. Manuf. Technol. 2022,
120, 5027–5040. doi:10.1007/s00170-022-09062-x.
[Google Scholar]
-
24.
Suleiman DY, Li Q, Li B, Zhang Y, Zhang B, Liu D, et al. Digital Twin and Artificial Intelligence in Machining: A Bibliometric Analysis.
Intell. Sustain. Manuf. 2025,
2, 10005. doi:10.70322/ism.2025.10005.
[Google Scholar]
-
25.
Hu S, Li C, Li B, Yang M, Wang X, Gao T, et al. Digital Twins Enabling Intelligent Manufacturing: From Methodology to Application.
Intell. Sustain. Manuf. 2024,
1, 10007. doi:10.35534/ism.2024.10007.
[Google Scholar]
-
26.
Deshpande S, Bouzid A, Lagarrigue P, Landon Y, Araujo AC. Data maps for material identification in helical milling by spindle power monitoring.
Procedia CIRP 2023,
117, 1–6. doi:10.1016/j.procir.2023.03.002.
[Google Scholar]
-
27.
Wang H, Qin X, Ren C, Wang Q. Prediction of cutting forces in helical milling process.
Int. J. Adv. Manuf. Technol. 2012,
58, 849–859. doi:10.1007/s00170-011-3435-y.
[Google Scholar]
-
28.
Pawar SS, Bera TC, Sangwan KS. Modelling of Energy Consumption for Milling of Circular Geometry.
Procedia CIRP 2021,
98, 470–475. doi:10.1016/j.procir.2021.01.136.
[Google Scholar]
-
29.
Deshpande S, Araujo AC, Lagarrigue P, Landon Y. Experimental Analysis of Circular Milling for Material Identification in Aerospace Industry.
Key Eng. Mater. 2022,
926, 1650–1659. doi:10.4028/p-04tr68.
[Google Scholar]