The study of intermetallic compounds, especially those involving rare earth elements, has attracted much attention due to their interesting magnetic, electrical, and structural properties [
1,
2,
3]. For instance, the recently reported La-F-Se compounds exhibit exceptional electronic characteristics [
4,
5]. Notably, the La-Ni system and the La-Ni-Si ternary system have been identified as promising materials for various applications, including hydrogen storage alloys [
6,
7,
8,
9,
10], battery electrodes [
11], thermoelectric materials [
12], superconducting materials [
13,
14,
15,
16,
17,
18], and catalytic materials [
19,
20,
21].
The La-Ni binary alloy system contains numerous compounds of various types and proportions, which have been thoroughly explored and extensively researched. These different ratios contribute to the diverse performance characteristics of the alloys. Buschow and Yamamoto synthesized a series of La-Ni binary alloys with varying ratios in their respective research teams. The alteration of the ratio resulted in changes in the crystal microstructure, ultimately impacting the hydrogen absorption and release capabilities of the alloy [
22,
23]. The influence of this phenomenon on the thermodynamic properties of the alloy material was further investigated in a subsequent study by Dischinger et al. [
24]. In another study, Chesalkin et al. highlighted the specific synthesis parameters of various La-Ni binary compounds through detailed analysis. They also discussed the current status and future significance of the system in the context of energy sources [
6]. Among these compounds, LaNi
5 is recognized as one of the most promising commercial solid hydrogen storage alloys due to its high hydrogen storage capacity. Many researchers have reported that hydrogen atoms can enter the LaNi
5 lattice, occupying tetrahedral or octahedral interstices, to form metal hydrides for hydrogen storage [
8,
9,
12]. Joubert et al. provided a comprehensive overview of the properties of materials based on LaNi
5 and its derivatives, including their electrochemical, thermodynamic, and kinetic properties [
1]. These properties play a crucial role in the hydrogen absorption and release capacity of hydrogen storage alloys. Additionally, researchers have shown interest in the electromagnetic properties of LaNi
5 alloy. Stucki et al. discussed the electromagnetic properties of LaNi
5 and other materials, which positively impacted the electromagnetic applications of this alloy system [
7]. Due to its unique superlattice structure, La
2Ni
7 exhibits better hydrogen storage performance than LaNi
5. It has also been demonstrated to possess a distinctive low-temperature discharge capacity [
25]. Iwase et al. studied the crystal structure changes and phase transitions of La
2Ni
7 during hydrogen absorption using in situ XRD, while Iwatake specifically investigated the crystal structure changes of the two coexisting La
2Ni
7 hydrides formed at hydrogen absorption saturation [
26,
27]. Additionally, several superconducting materials exist in the La-Ni binary system, such as La
3Ni and La
7Ni
3, as reported in previous studies [
13,
14]. The La-Ni-Si system comprises various compound proportions, serving purposes in hydrogen storage and superconductivity. Numerous researchers have delved into the composition and performance of this system [
2,
3,
28,
29]. Mayer et al. tested the crystallographic data of rare earth silicides at high temperature using in situ XRD and found that binary compounds were generally more stable than ternary compounds, which is reflected in their performance [
30]. Baisheva mentioned that in intermetallic compounds, the addition of a small amount of impurities may act as a catalyst and increase the active site [
31]. Kakuta et al. explored the hydrogen absorption and discharge characteristics of several La-Na-Si ternary compounds in experiments, while Dakka et al. comprehensively compared LaNi
5 with La
28.9Ni
67.55Si
3.55. The study showed that after Si replaced Ni, the hydrogen storage would decrease slightly, but the thermodynamic and kinetic performance would greatly improve [
32,
33]. In the La-Ni-Si system, many superconducting materials have been discovered. Kasahara et al. found that La
3Ni
4Si
4 is a superconducting material. Winiarski et al. compared it with La
3Ni
4Ge
4, another superconducting material, and found that they were highly similar in many properties, providing direction and ideas for exploring more similar superconducting materials [
15,
34]. Furthermore, Smetana et al. recently employed single-crystal X-ray diffraction to identify four new compounds in the La-Ni-Si system. They noted the existence of unknown phases that necessitate further investigation [
35]. Previous studies have shown that these two systems play an important role in material science and application, but there are few studies on the symbiosis of the two, and the rules of symbiosis have an important impact on the growth and performance of materials.
Single-crystal X-ray diffraction (SXRD) has become a powerful technique for the accurate determination of crystal structures, enabling researchers to gain insight into the arrangement and bonding of atoms in materials [
36]. Deriving an unknown and complex crystal structure from powder X-ray diffraction (PXRD) data alone remains a very difficult and even impossible task. However, SXRD measurements can provide not only precise atomic coordinates, bond lengths, and bond angles but also atomic thermal displacements and occupancy rates, which are unavailable from PXRD even when measured using highly monochromatized and very intense synchrotron radiation [
37]. By utilizing cutting-edge SXRD techniques, we will demonstrate how high-quality data can be obtained for solving and refining the atomic positions of each phase.
In this paper, we investigated the crystal structure evolution of La-Ni binary alloys under varying oxygen partial pressures using SXRD, EDX, and TEM. Initially, the nominal chemical composition of La
3Ni
2 samples produced via the arc melting method. Then the mixture was coated with a tantalum sheet as well as vacuum sealed, followed by the same high-temperature sintering conditions. The crystal structural information, their topological features, and crystallographic orientation relationships, including their microstructures of those phases during such different synthesized conditions, have been investigated.
3.1. SXRD Test of Synthesized Sample by the Melting Method
The La
3Ni
2 sample obtained through the melting method was analyzed using the SXRD test. The results indicated that both LaNi and La
7Ni
3 phases coexisted within the sample. According to the results of the SXRD test, the sample consists of several La
7Ni
3 and LaNi twins.
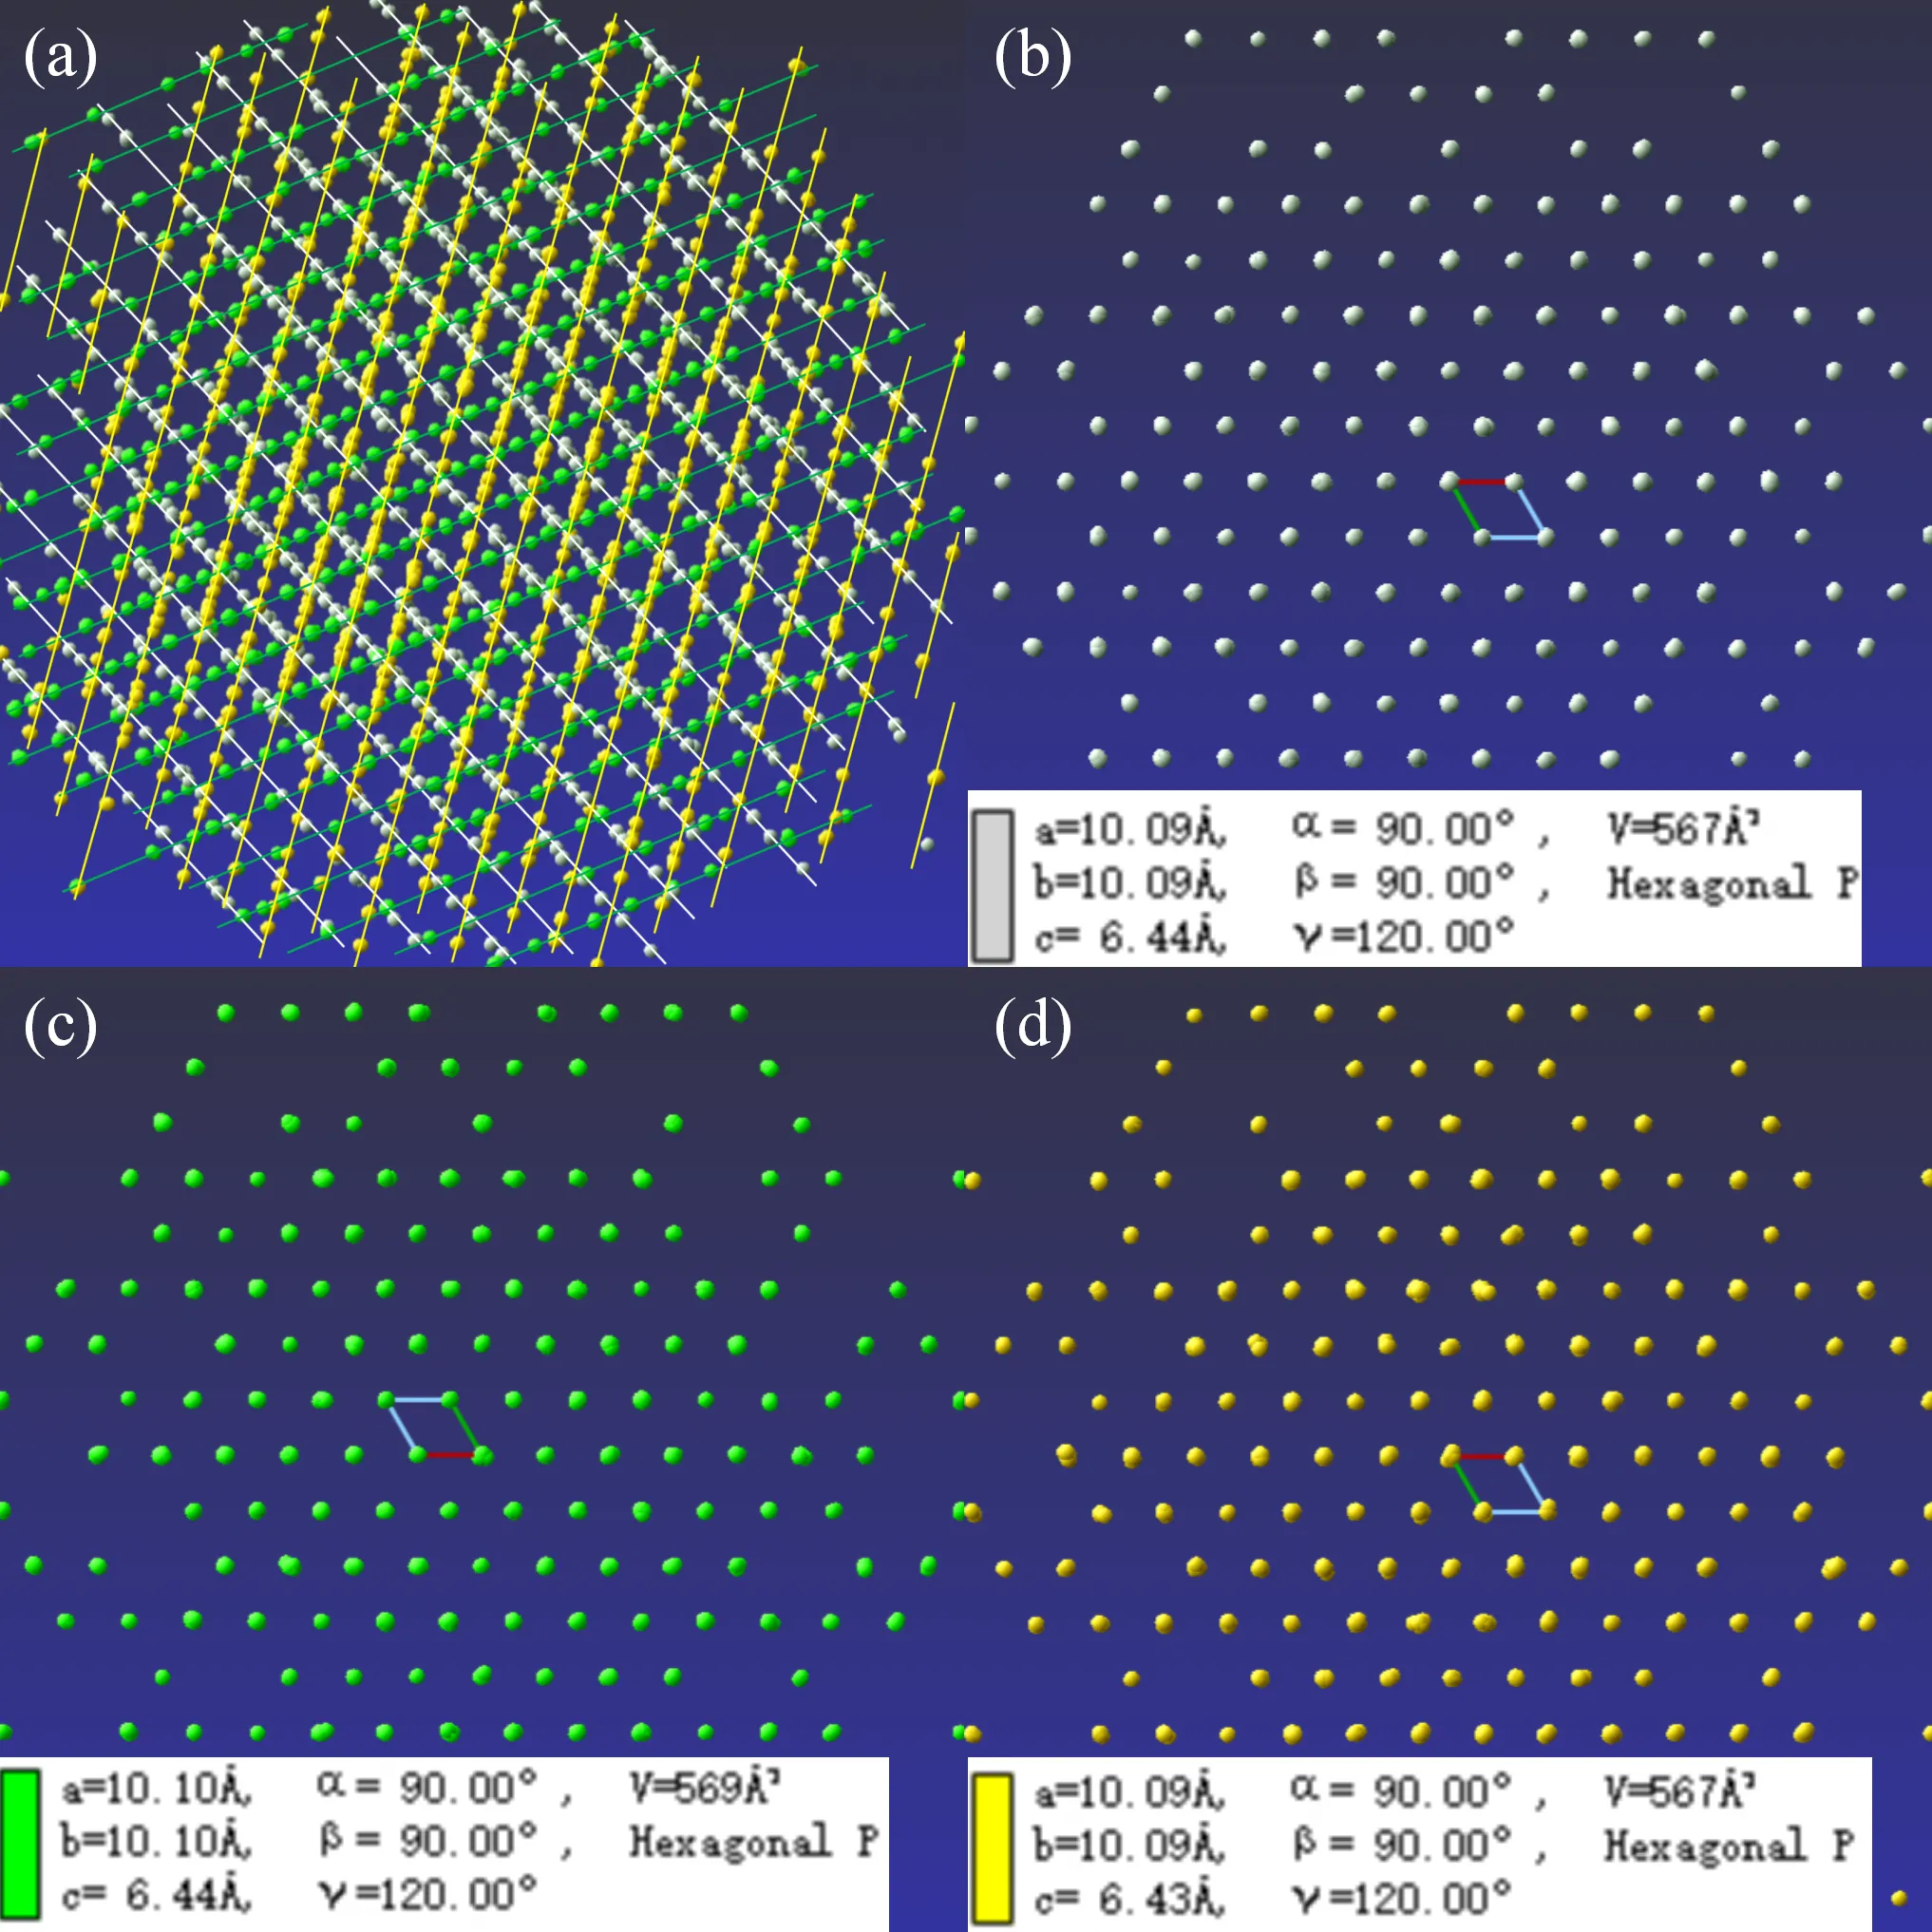
and
show the reciprocal points of the La
7Ni
3 and LaNi twins.
presents the reciprocal points of the triple-twinned La
7Ni
3.
a shows the reciprocal points of the triple-twinned La
7Ni
3 along a random direction.
b–d sequentially illustrate the reciprocal lattice of the triple-twinned La
7Ni
3 along the
c∗ axis. The indexed crystal parameters confirm that these are La
7Ni
3 twins.
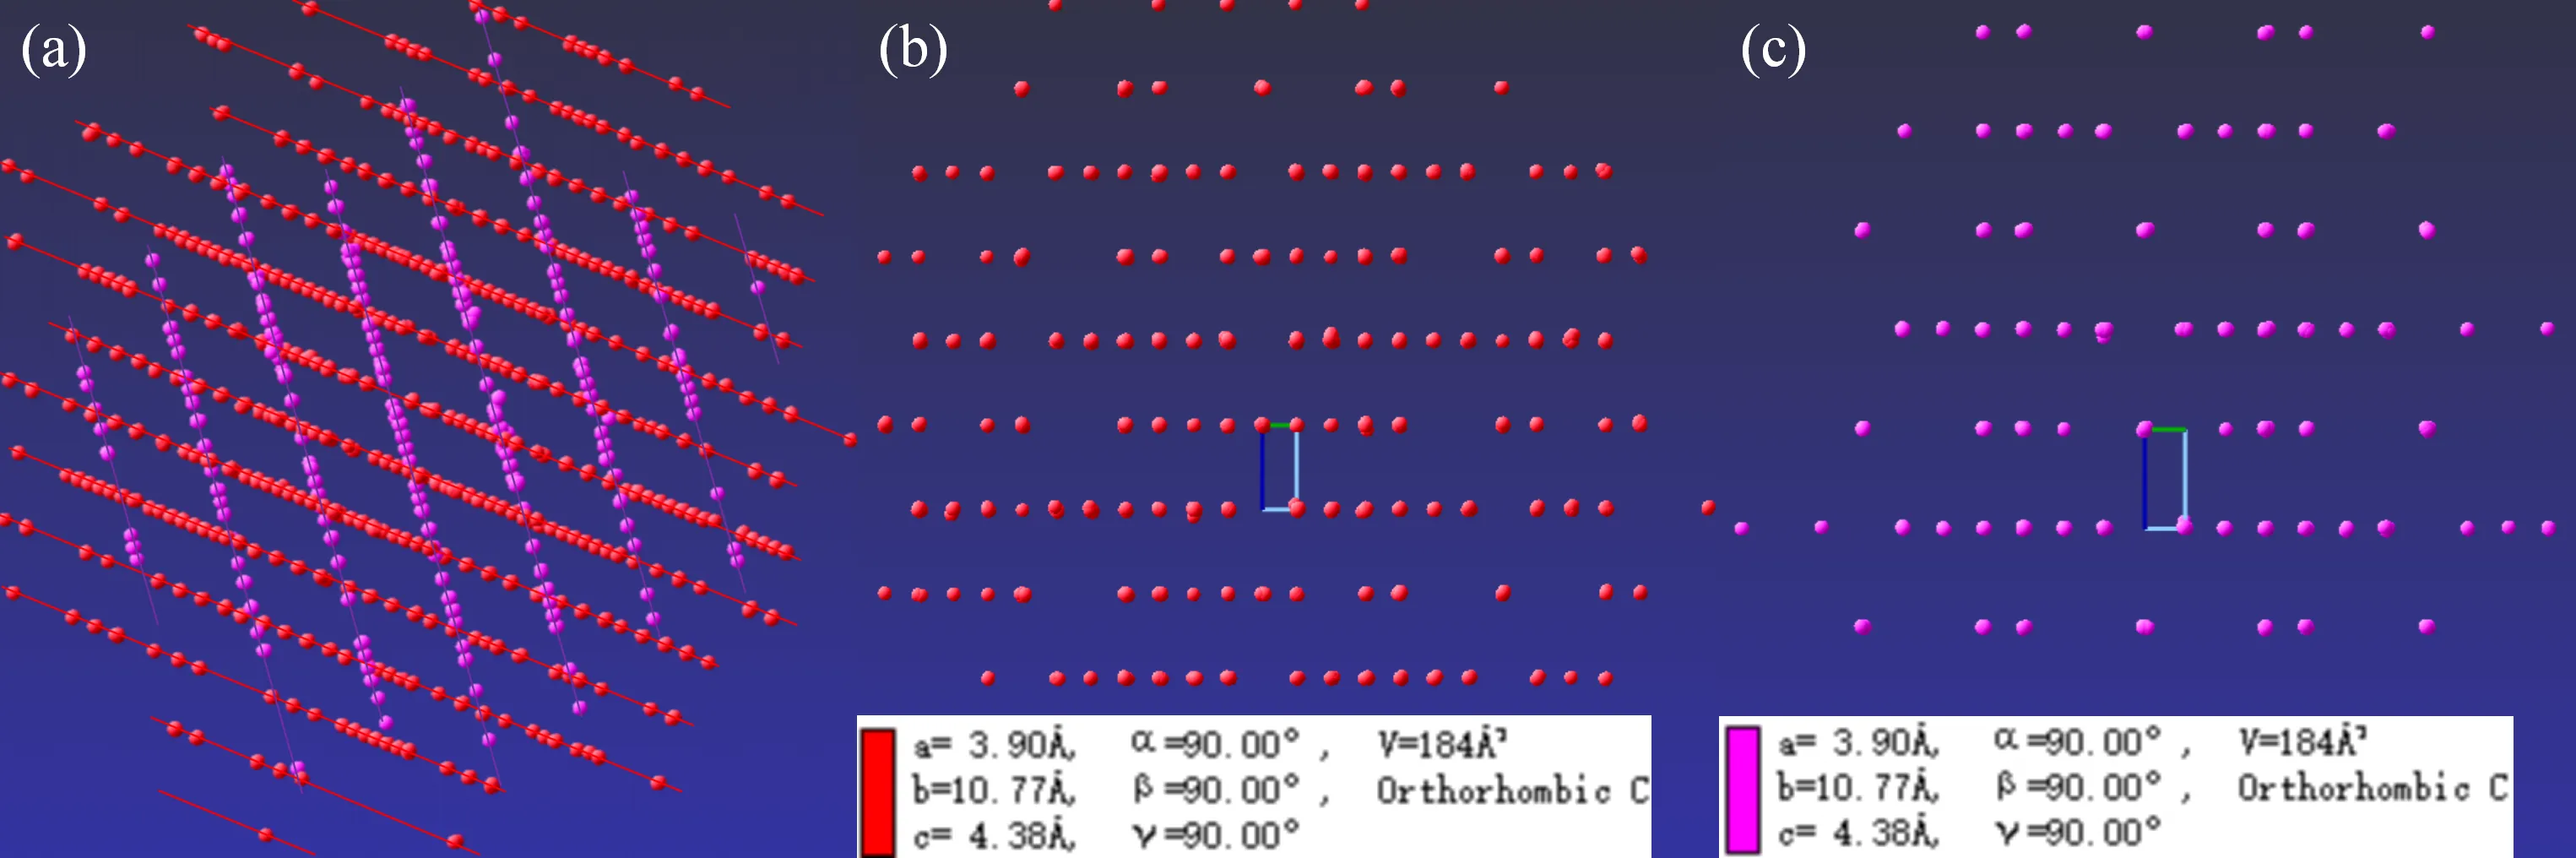
displays the reciprocal points of twinned LaNi.
a shows the reciprocal points of the LaNi twinning along a random direction.
b–d sequentially illustrate the reciprocal lattice of the LaNi twinning along the
a∗ axis. The indexed crystal parameters confirm that these are LaNi twins. This method for confirming twin crystals was also employed in another paper previously published by our group [
45]. In
b, there are 2662 white diffraction points. In
c, there are 2179 green diffraction points. In
d, there are 2570 yellow diffraction points. In
b, there are 1740 red diffraction points. In
c, there are 622 purple diffraction points. To facilitate the analysis and refinement of the crystal structure, the La
7Ni
3 phase and the LaNi phase, which have the largest number of diffraction points (without intersection with diffraction points from other grains), were selected for crystal structure refinement. The reciprocal lattices of the La
7Ni
3 and LaNi phases projected in three axes and their crystal structures are shown in
Figure S1 and
Figure S2 of the supplementary material. The reciprocal lattice is a lattice made up of points known as reciprocal points. It is a geometric approach used to describe crystal structures, having a reciprocal relationship with the spatial lattice. Each reciprocal point in the reciprocal lattice corresponds to a set of lattice planes with the same crystal plane spacing in the spatial lattice.
. The reciprocal points of the La<sub>7</sub>Ni<sub>3</sub> triple twins (<strong>a</strong>), the reciprocal points of the first layer of La<sub>7</sub>Ni<sub>3</sub> twins (<strong>b</strong>), the reciprocal points of the second layer of La<sub>7</sub>Ni<sub>3</sub> twins (<strong>c</strong>), the reciprocal points of the third layer of La<sub>7</sub>Ni<sub>3</sub> twins (<strong>d</strong>).
. The reciprocal points of LaNi twins (<strong>a</strong>), the reciprocal points of the first layer of LaNi twins (<strong>b</strong>), the reciprocal points of the second layer of LaNi twins (<strong>c</strong>).
Detailed crystallographic data, data collection, and structural refinement details for the La
7Ni
3 and LaNi phases are summarized in
. The crystallographic parameters of both phases adhere to the standards established by international crystallography for the rationalization of crystal structures.
.
Crystallographic and experimental data of La7Ni3 and LaNi obtained through arc melting.
|
La7Ni3 |
LaNi |
| a/Å |
10.0995(18) |
3.9014(4) |
| b/Å |
10.0995(18) |
10.7782(12) |
| c/Å |
6.4490(16) |
4.3854(5) |
| α, β, γ/° |
90, 90, 120 |
90, 90, 90 |
| V/Å3 |
569.7(2) |
184.41(3) |
| Z |
8 |
2 |
| Space group |
P63mc |
Cmcm |
| Crystal system |
Hexagonal |
Orthorhombic |
| Diffractometer |
Bruker D8 Venture Photon 100 COMS |
| Monochromator |
Graphite |
| Tmeas/K |
300(2) |
| Radiation |
Mo-Kα, λ = 0.71073 (Å) |
| Scan mode |
φ and ω scan |
| Time per step/s |
5 |
| Absorption correction |
Multi-scan |
| F(000) |
966 |
340 |
| θ range/° |
3.93~27.50 |
3.78~27.49 |
| μ/mm−1 |
30.372 |
32.472 |
| No. measured reflections |
4501 |
2438 |
| No. unique reflections |
388 |
109 |
| No. observed reflections (I > 2σ(I)) |
337 |
104 |
| No. reflections used in refinement |
388 |
109 |
| No. parameters used in refinement |
22 |
9 |
| Reflection range |
−12 ≤ h ≤ 11, −12 ≤ k ≤ 11, −6 ≤ l ≤ 7 |
−4 ≤ h ≤ 4, −12 ≤ k ≤ 12, −5 ≤ l ≤ 5 |
| Rint |
0.1072 |
0.0657 |
| R(σ) |
0.0479 |
0.0192 |
| Final R indices (Fobs > 4σ(Fobs)) |
R1 = 0.0316, ωR2 = 0.0615 |
R1 = 0.0153, ωR2 = 0.0326 |
| R indices (all data) |
R1 = 0.0359, ωR2 = 0.0615 |
R1 = 0.0165, ωR2 = 0.0326 |
| Goodness of fit |
1.094 |
1.243 |
presents detailed information on La
7Ni
3, indicating that all atoms are fully occupied at their respective positions. The coordinate positions and occupancy of each atom are highly consistent with Olcese reported in 1973 [
46].
.
Fractional atomic coordinates and equivalent isotropic displacement parameters (Å2) of La7Ni3.
| Label |
Site |
x |
y |
z |
Occ. |
Ueq |
| La1 |
2b |
0.333333 |
0.666667 |
0.7870(5) |
1 |
0.0129(7) |
| La2 |
6c |
0.12531(11) |
0.87469(11) |
0.0006(2) |
1 |
0.0145(5) |
| La3 |
6c |
0.53923(11) |
0.46077(11) |
0.8123(3) |
1 |
0.0152(5) |
| Ni1 |
6c |
0.8120(2) |
0.1880(2) |
0.0586(6) |
1 |
0.0173(10) |
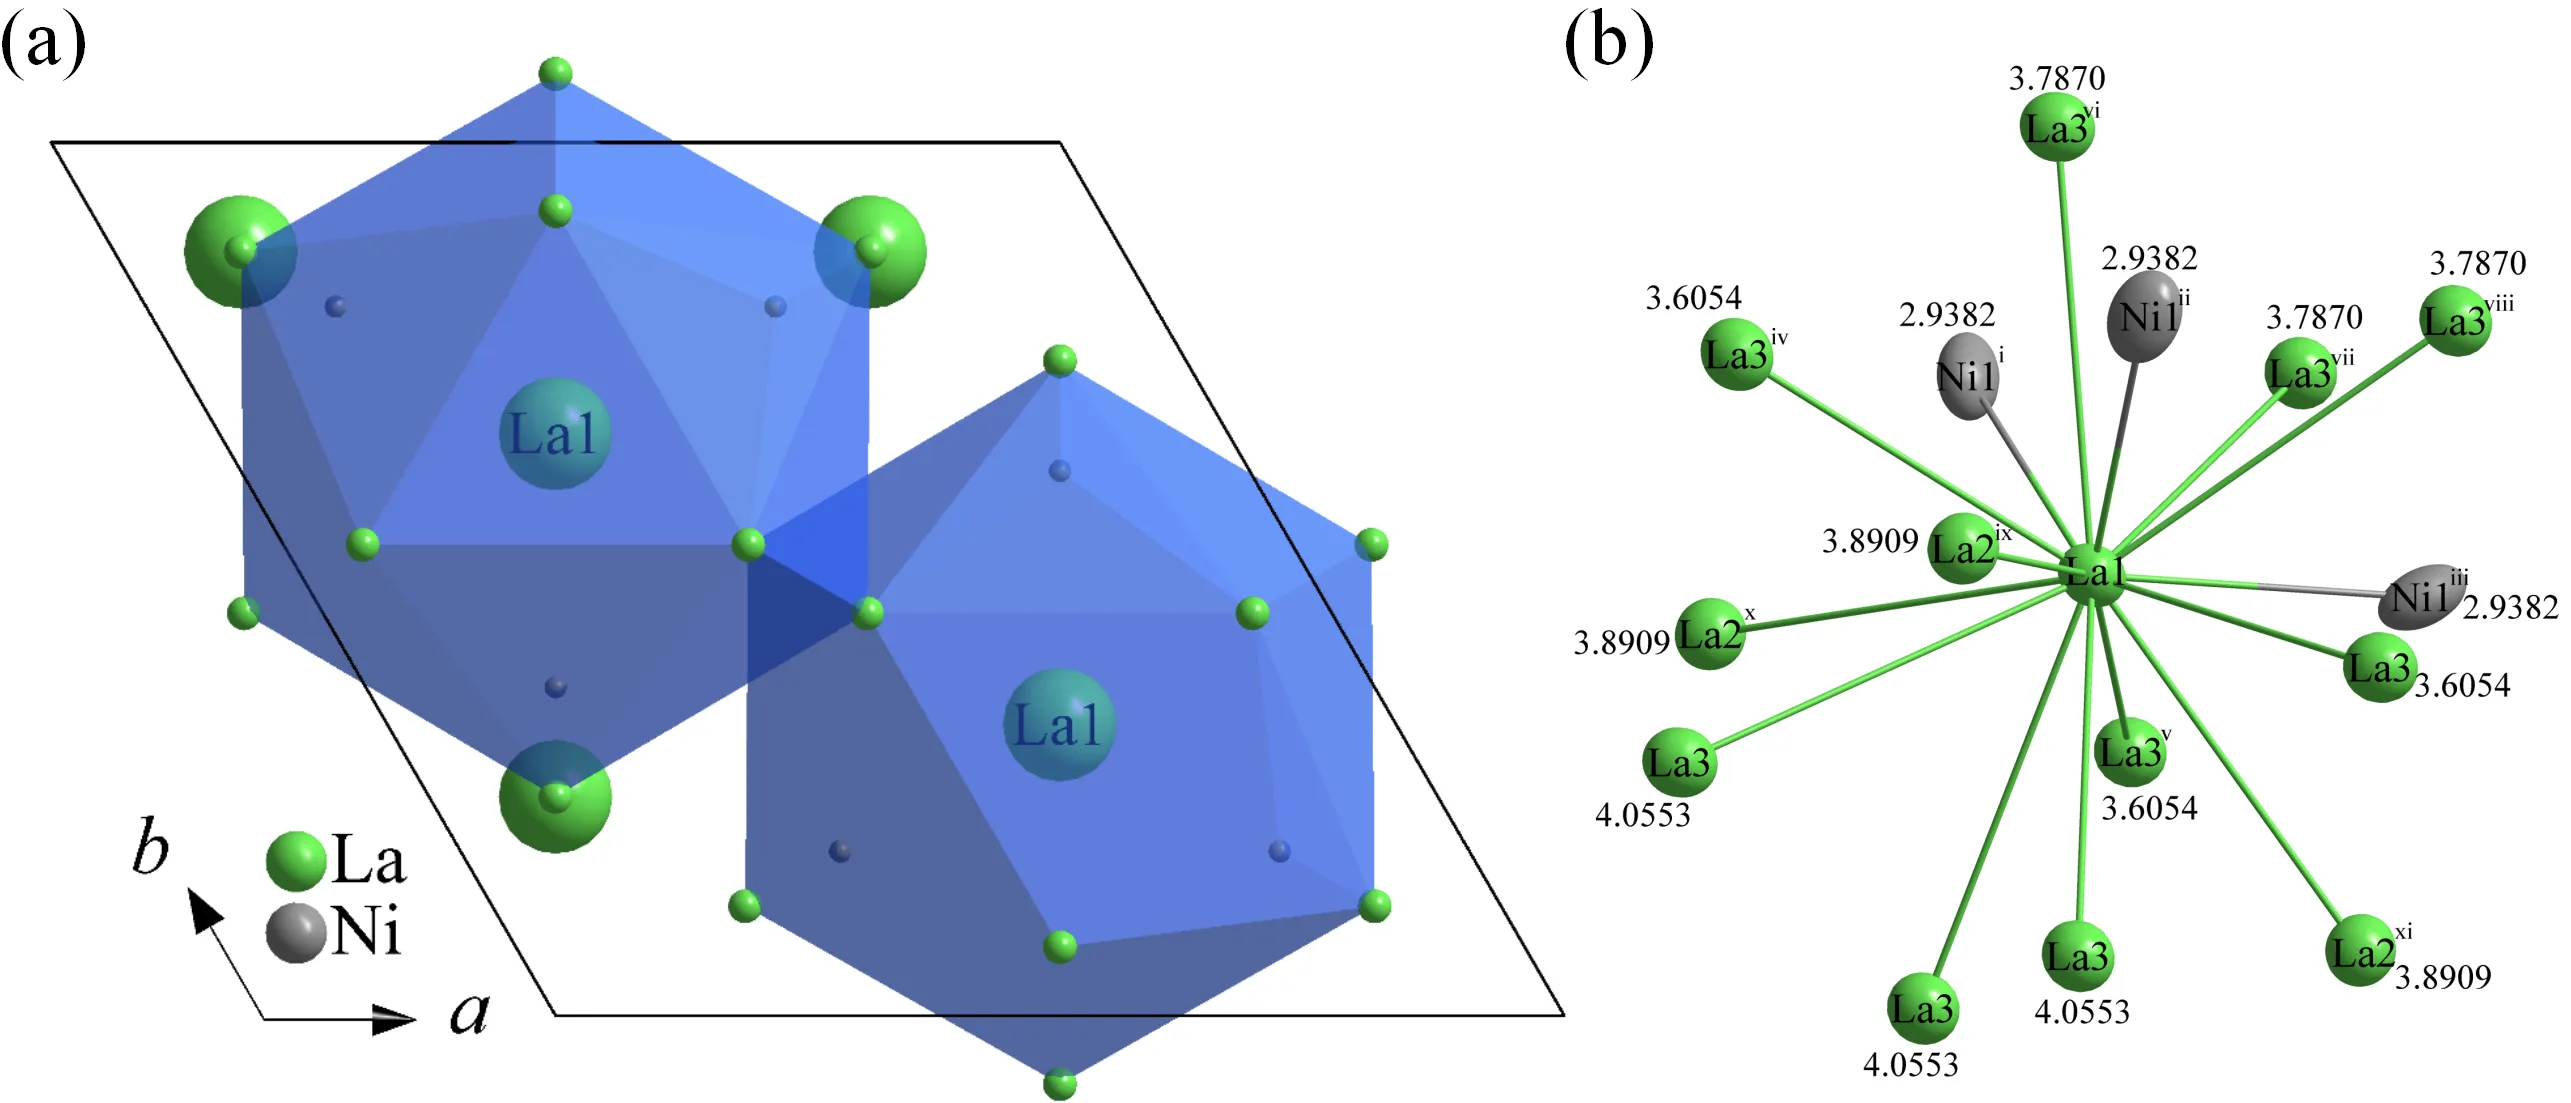
Next, the building units in the structure of the La
7Ni
3 phase were analyzed using the nanocluster method in Topospro software (Version 5.5.2.0). The nanocluster method can be used to decompose the structure into construction units and describe the overall structural model in the form of combinations. This approach simplifies the structure, making it more intuitive and facilitating the identification of connections and differences between different structures. Through topology analysis, the La
7Ni
3 phase structure can be described by the cluster model of La1(1)(1@15). The cluster is centered on the La1 atom.
a demonstrates the cluster assembly model of the La
7Ni
3 phase. There are two La1(1)(1@15) clusters in the La
7Ni
3 cell, and the connections between clusters are collinear.
b depicts the environment diagram of the La1 atom, showing 15 surrounding atoms, including 3 La2 atoms, 9 La3 atoms and 3 Ni1 atoms. In addition, the distances between each coordination atom and the central atom La1 are indicated in
b. The longest distance, measuring 4.0553 Å, is observed between the La3 and La1 atoms, while the shortest distance, at 2.9382 Å, occurs between the Ni1 and La1 atoms.
. Cluster assembly model of La<sub>7</sub>Ni<sub>3</sub> phase (<strong>a</strong>) and atomic environment diagram of La1 atom (<strong>b</strong>). Symmetry codes: (i) −<em>x</em> + 1, −<em>y</em> + 1, <em>z</em> + 1/2; (ii) <em>y</em>, −<em>x</em> + <em>y</em> + 1, <em>z</em> + 1/2; (iii) <em>x</em> − <em>y</em>, <em>x</em>, <em>z</em> + 1/2; (iv) −<em>y</em> + 1, <em>x</em>−<em>y</em> + 1, <em>z</em>; (v) −<em>x</em> + <em>y</em>, −<em>x</em> + 1, <em>z</em>; (vi) −<em>x</em> + 1, −<em>y</em> + 1, <em>z</em> − 1/2; (vii) <em>x</em> − <em>y</em>, <em>x</em>, <em>z</em>−1/2; (viii) <em>y</em>, −<em>x</em> + <em>y</em> + 1, <em>z</em>−1/2; (ix) <em>x</em>, <em>y</em>, <em>z</em> + 1; (x) −<em>x</em> + <em>y</em>, −<em>x</em> + 1, <em>z</em> + 1; (xi) −<em>y</em> + 1, <em>x</em> − <em>y</em> + 1, <em>z</em> + 1.
demonstrates the fractional atomic coordinates, atomic occupancy (Occ.) and equivalent isotropic displacement parameters (U
eq) of the LaNi phase. Notably, all atoms have an occupancy of 1. This finding is in strong agreement with the LaNi study by Raman et al. in 1968 [
47]. The key distinction is that our study utilizes single crystal X-ray diffraction, whereas the 1968 paper relied on powder X-ray diffraction.
.
Fractional atomic coordinates and equivalent isotropic displacement parameters (Å2) of LaNi.
| Label |
Site |
x |
y |
z |
Occ. |
Ueq |
| La1 |
4c |
0.000000 |
0.13715(5) |
0.250000 |
1 |
0.0116(2) |
| Ni1 |
4c |
0.000000 |
0.42884(16) |
0.250000 |
1 |
0.0173(4) |
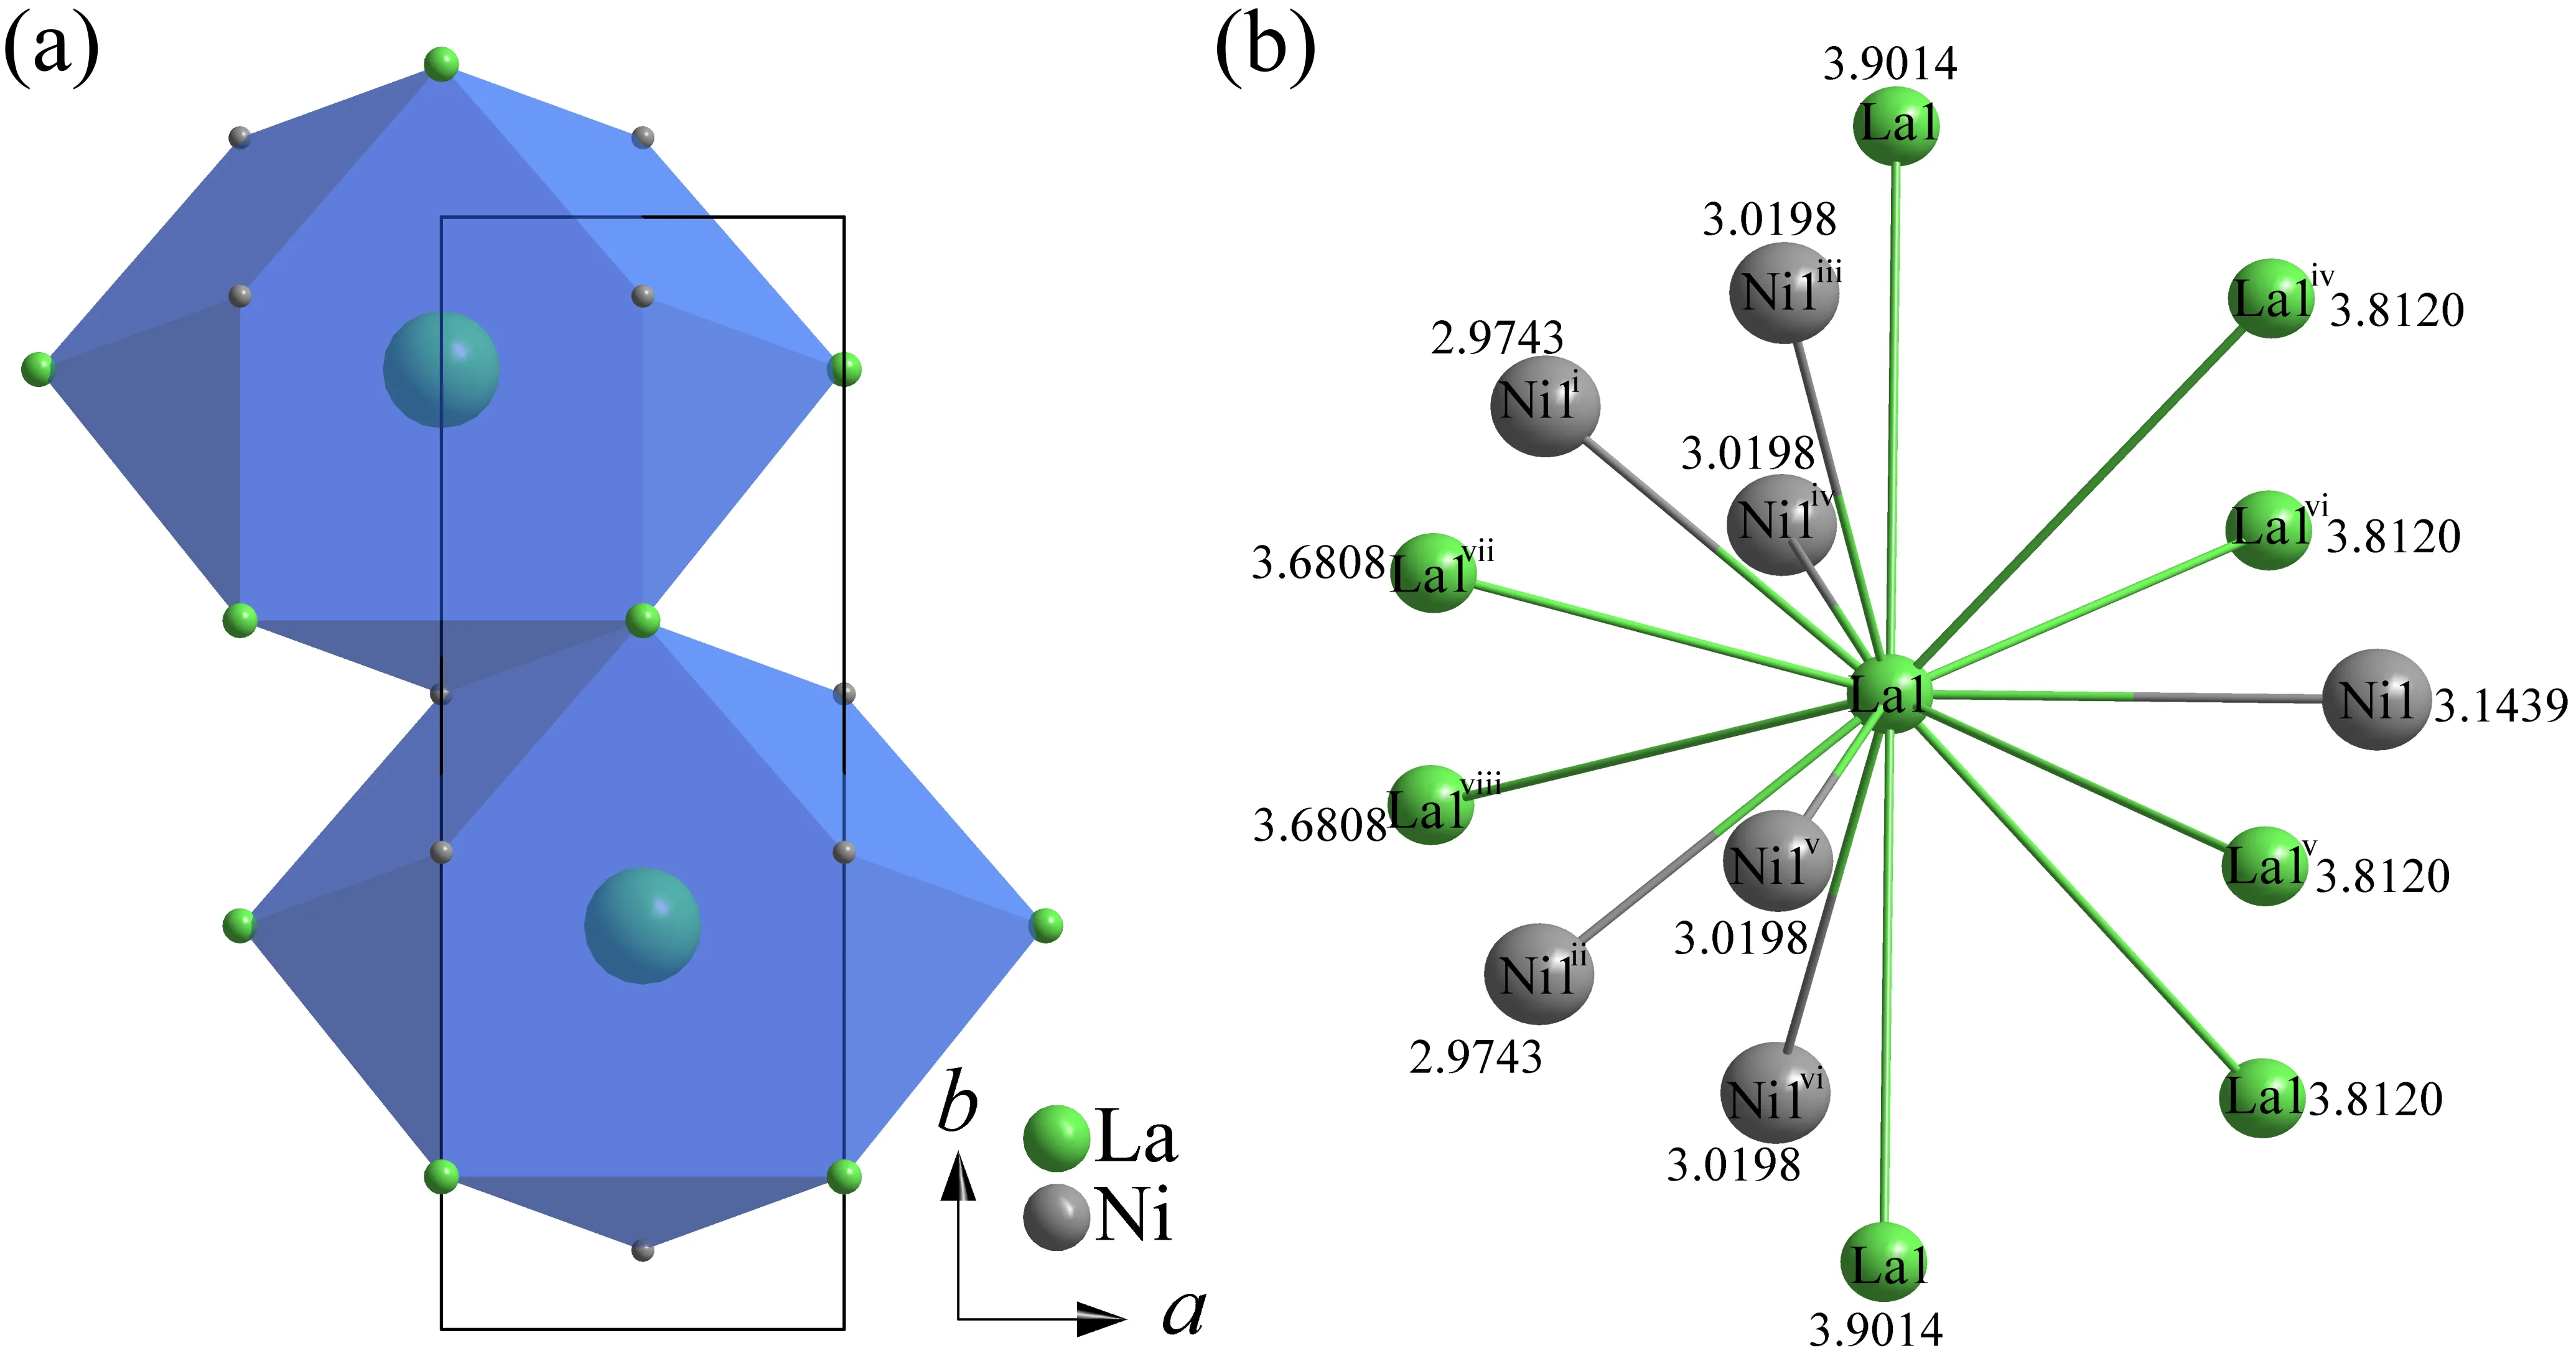
Next, the building units in the structure of the LaNi phase were analyzed using the nanocluster method in Topospro software (Version 5.5.2.0). Through topology analysis, the LaNi phase structure can be described by the cluster model of La1(1)(1@15). The cluster is a octadechedron cluster centered on the La1 atom.
a illustrates the cluster assembly model of the LaNi phase. There are two La1(1)(1@15) clusters in the LaNi cell, and the connections between clusters are collinear.
b depicts the environment diagram of the La1 atom, showing 15 surrounding atoms, including 8 La1 atoms and 7 Ni1 atoms. The distances between each coordination atom and the central atom La1 are indicated in
b. The longest distance, measuring 3.9014 Å, is observed between the La1 and La1 atoms, while the shortest distance, at 2.9743 Å, occurs between the Ni1 and La1 atoms.
. Cluster assembly model of LaNi phase (<strong>a</strong>) and atomic environment diagram of La1 atom (<strong>b</strong>). Symmetry codes: (i) <em>x</em> − 1/2, <em>y</em> − 1/2, <em>z</em>; (ii) <em>x</em> + 1/2, <em>y</em> − 1/2, <em>z</em>; (iii) −<em>x</em> − 1/2, −<em>y</em> + 1/2, −<em>z</em>; (iv) −<em>x</em> + 1/2, −<em>y</em> + 1/2, −<em>z</em> + 1; (v) −<em>x</em> + 1/2, −<em>y</em> + 1/2, −<em>z</em>; (vi) −<em>x</em> − 1/2, −<em>y</em> + 1/2, −<em>z</em> + 1; (vii) −<em>x</em>, −<em>y</em>, −<em>z</em>; (viii) −<em>x</em>, −<em>y</em>, −<em>z</em> + 1.
Some melted samples were wrapped in tantalum sheets and heat-treated to investigate the structural transformation. Subsequently, SXRD tests were conducted on the samples. The results indicated that the samples were predominantly composed of LaNi
5 twins. To facilitate crystal structural refinement, we selected a set of diffraction points exhibiting the strongest diffraction intensity for refinement. The reciprocal lattice and crystal structure of LaNi
5 are shown in
Figure S3 of the supplementary materials. In addition, an unknown phase is present in this batch of samples. Due to the limited number and weak intensity of the diffraction points associated with this phase, structural refinement cannot be performed. Currently, it is only known that the cell parameter obtained from its indexing are
a = 7.23 Å,
b = 3.96 Å,
c = 6.70 Å,
α = 90°,
β = 94.50°,
γ = 90°.
Detailed crystallographic data, data collection, and structural refinement details of the LaNi
5 phase are summarized in
. The crystallographic parameters of the LaNi
5 phase adhere to the standards established by international crystallography for the rationalization of crystal structures.
.
Crystallographic and experimental data of LaNi5 obtained through tantalum sheet-wrapping heat treatment.
|
LaNi5 |
| a, b, c/Å |
5.0149(4), 5.0149(4), 3.9751(5) |
| α, β, γ/° |
90, 90, 120 |
| V/Å3 |
86.577(18) |
| Z |
1 |
| Space group |
P6/mmm |
| Crystal system |
Hexagonal |
| Diffractometer |
Bruker D8 Venture Photon 100 COMS |
| Monochromator |
Graphite |
| Tmeas/K |
300(2) |
| Radiation |
Mo-Kα, λ = 0.71073 (Å) |
| Scan mode |
φ and ω scan |
| Time per step/s |
3 |
| Absorption correction |
Multi-scan |
| F(000) |
197 |
| θ range/° |
4.69~27.47 |
| μ/mm−1 |
38.406 |
| No. measured reflections |
1897 |
| No. unique reflections |
47 |
| No. observed reflections (I > 2σ(I)) |
47 |
| No. reflections used in refinement |
47 |
| No. parameters used in refinement |
9 |
| Reflection range |
−5 ≤ h ≤ 5, −5 ≤ k ≤ 5, −4 ≤ l ≤ 4 |
| Rint |
0.0670 |
| R(σ) |
0.0181 |
| Final R indices (Fobs > 4σ(Fobs)) |
R1 = 0.0294, ωR2 = 0.0709 |
| R indices (all data) |
R1 = 0.0289, ωR2 = 0.0709 |
| Goodness of fit |
1.374 |
presents detailed information on LaNi
5, indicating that La and Ni atoms are fully occupied at their respective positions. The coordinate positions and occupancy of each atom are highly consistent with Thompson et al. reported in 1987 [
48].
.
Fractional atomic coordinates and equivalent isotropic displacement parameters (Å2) of LaNi5.
| Label |
Site |
x |
y |
z |
Occ. |
Ueq |
| La1 |
1a |
0.000000 |
0.000000 |
0.000000 |
1 |
0.0061(10) |
| Ni1 |
2c |
0.333333 |
0.666667 |
0.000000 |
1 |
0.0078(12) |
| Ni2 |
3g |
0.500000 |
0.000000 |
0.500000 |
1 |
0.0063(11) |
Next, the building units in the structure of the LaNi
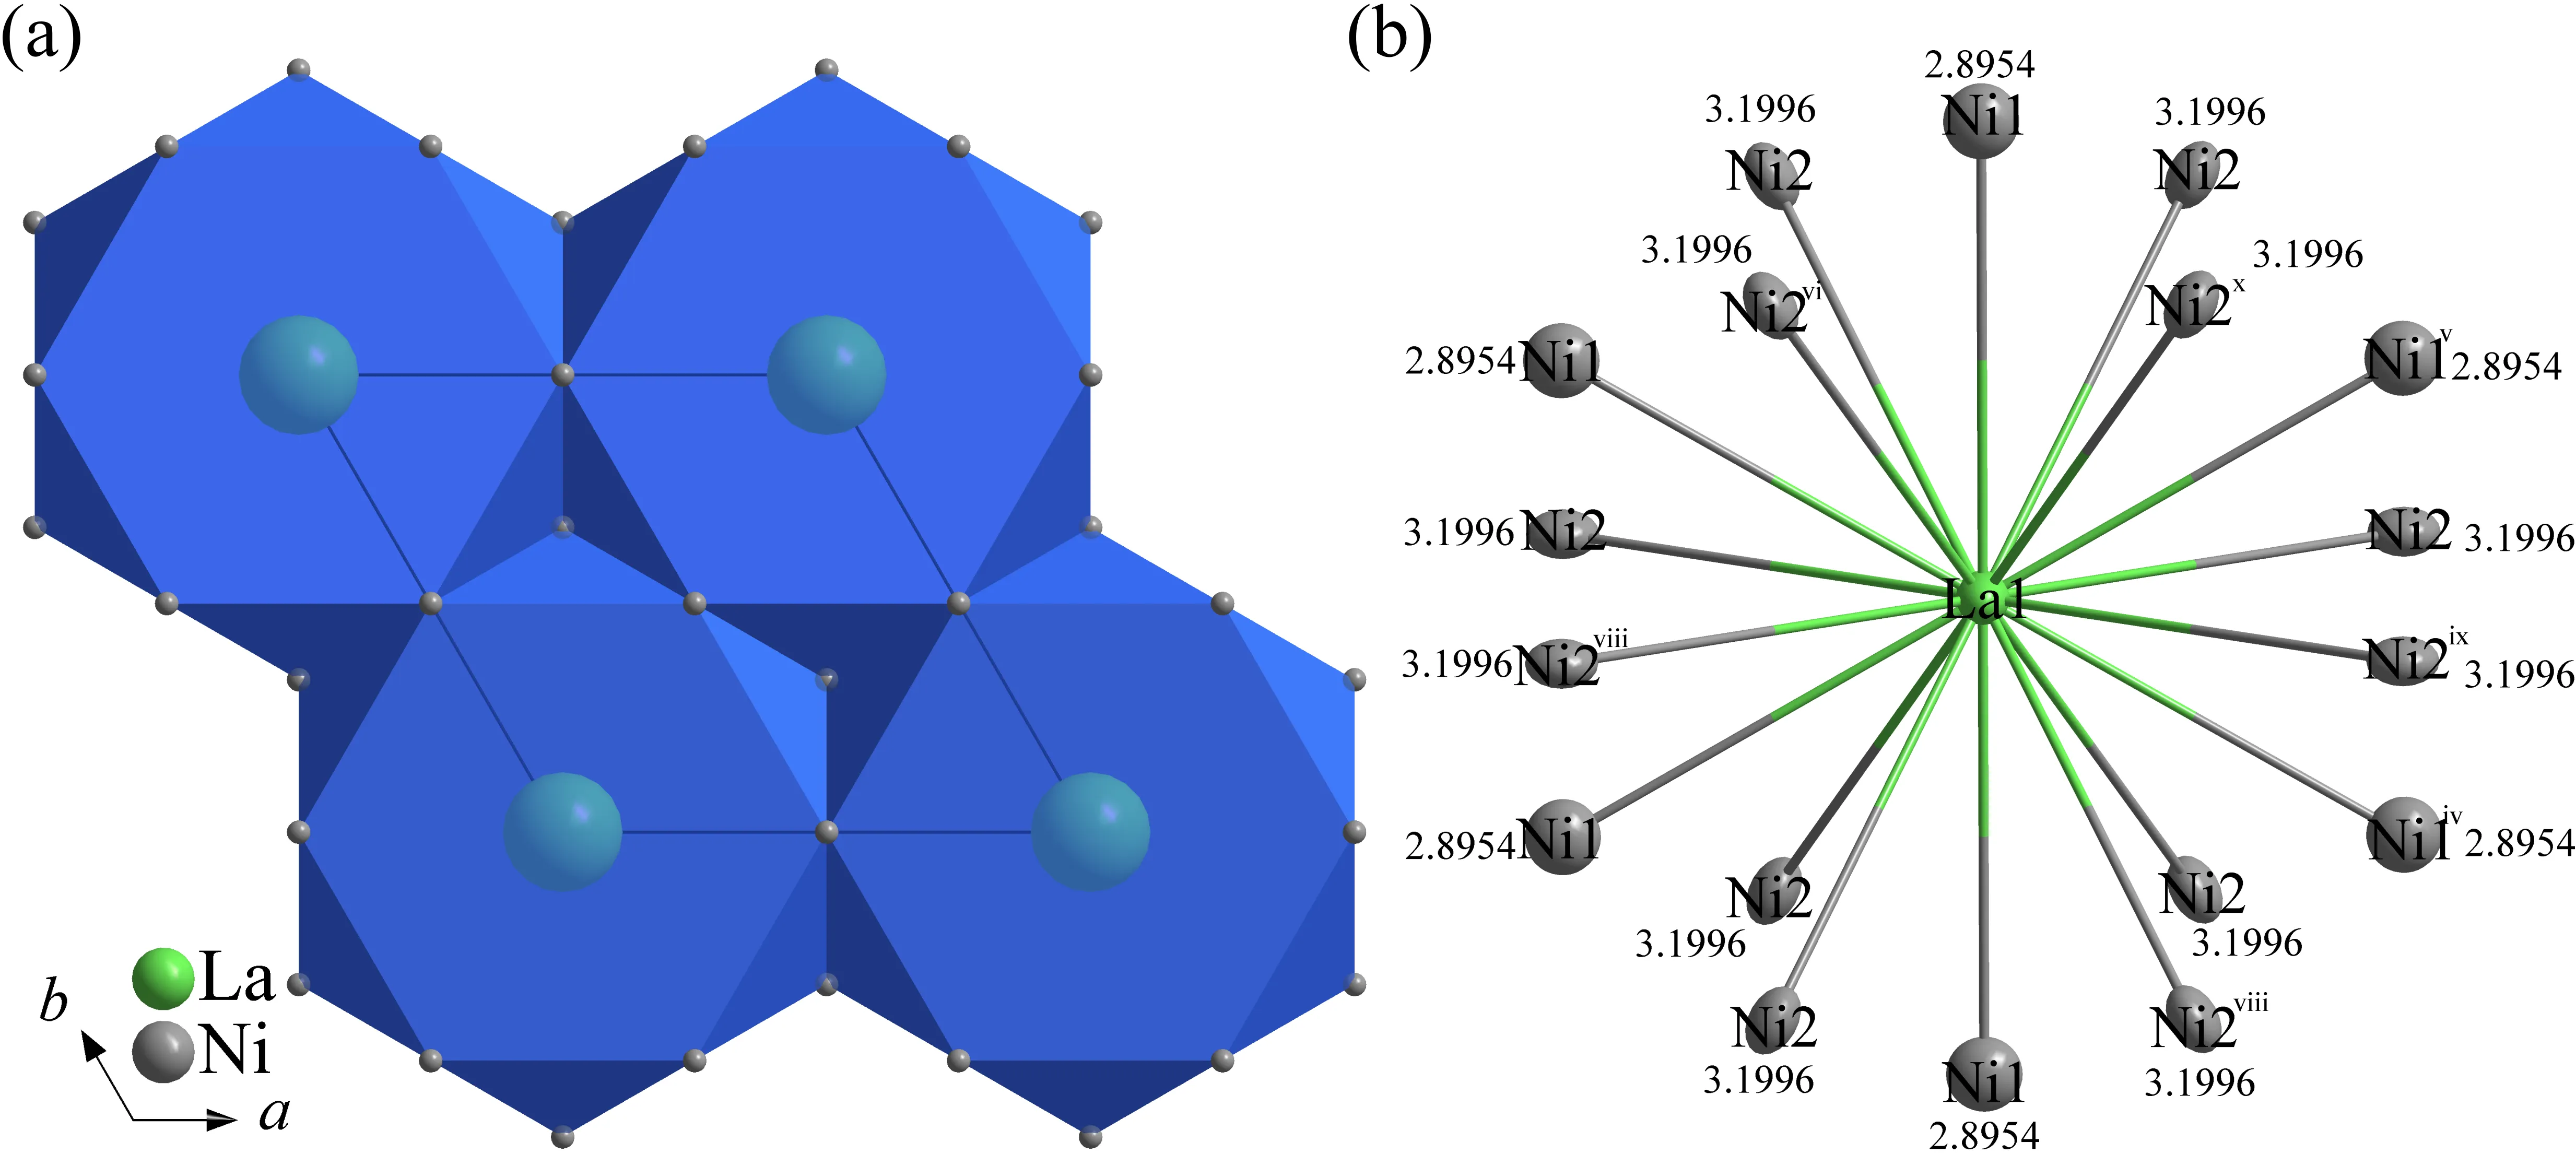
5 phase were analyzed using the nanocluster method in Topospro software (Version 5.5.2.0). Through topology analysis, the LaNi
5 phase structure can be described by the cluster model of La1(1)(1@18), which is a icosahedron cluster centered on the La1 atom.
a illustrates the cluster assembly model of the LaNi
5 phase. There are eight La1(1)(1@18) clusters in the LaNi
5 cell, and the connections between clusters are coplanar.
b depicts the environment diagram of the La1 atom, showing 18 surrounding atoms, including 6 Ni1 atoms and 12 Ni2 atoms. In addition, the distances between each coordination atom and the central atom La1 are indicated in
b. The longest distance, measuring 3.1996 Å, is observed between the La1 and Ni2 atoms, while the shortest distance, at 2.8954 Å, occurs between the Ni1 and La1 atoms.
. Cluster assembly model of LaNi<sub>5</sub> phase (<strong>a</strong>) and atomic environment diagram of La1 atom (<strong>b</strong>). Symmetry codes: (iv) −<em>x</em>, −<em>y</em> + 1, −<em>z</em>; (v) <em>x</em>, <em>y</em> − 1, <em>z</em>; (vi) −<em>x</em> + <em>y</em> + 1, −<em>x</em> + 1, <em>z</em>; (viii) −<em>y</em>, <em>x</em> − <em>y</em>, <em>z</em>; (ix) <em>x</em>−1, <em>y</em>, <em>z</em> − 1; (x) −<em>y</em>, <em>x</em> – <em>y</em> − 1, <em>z</em> − 1.
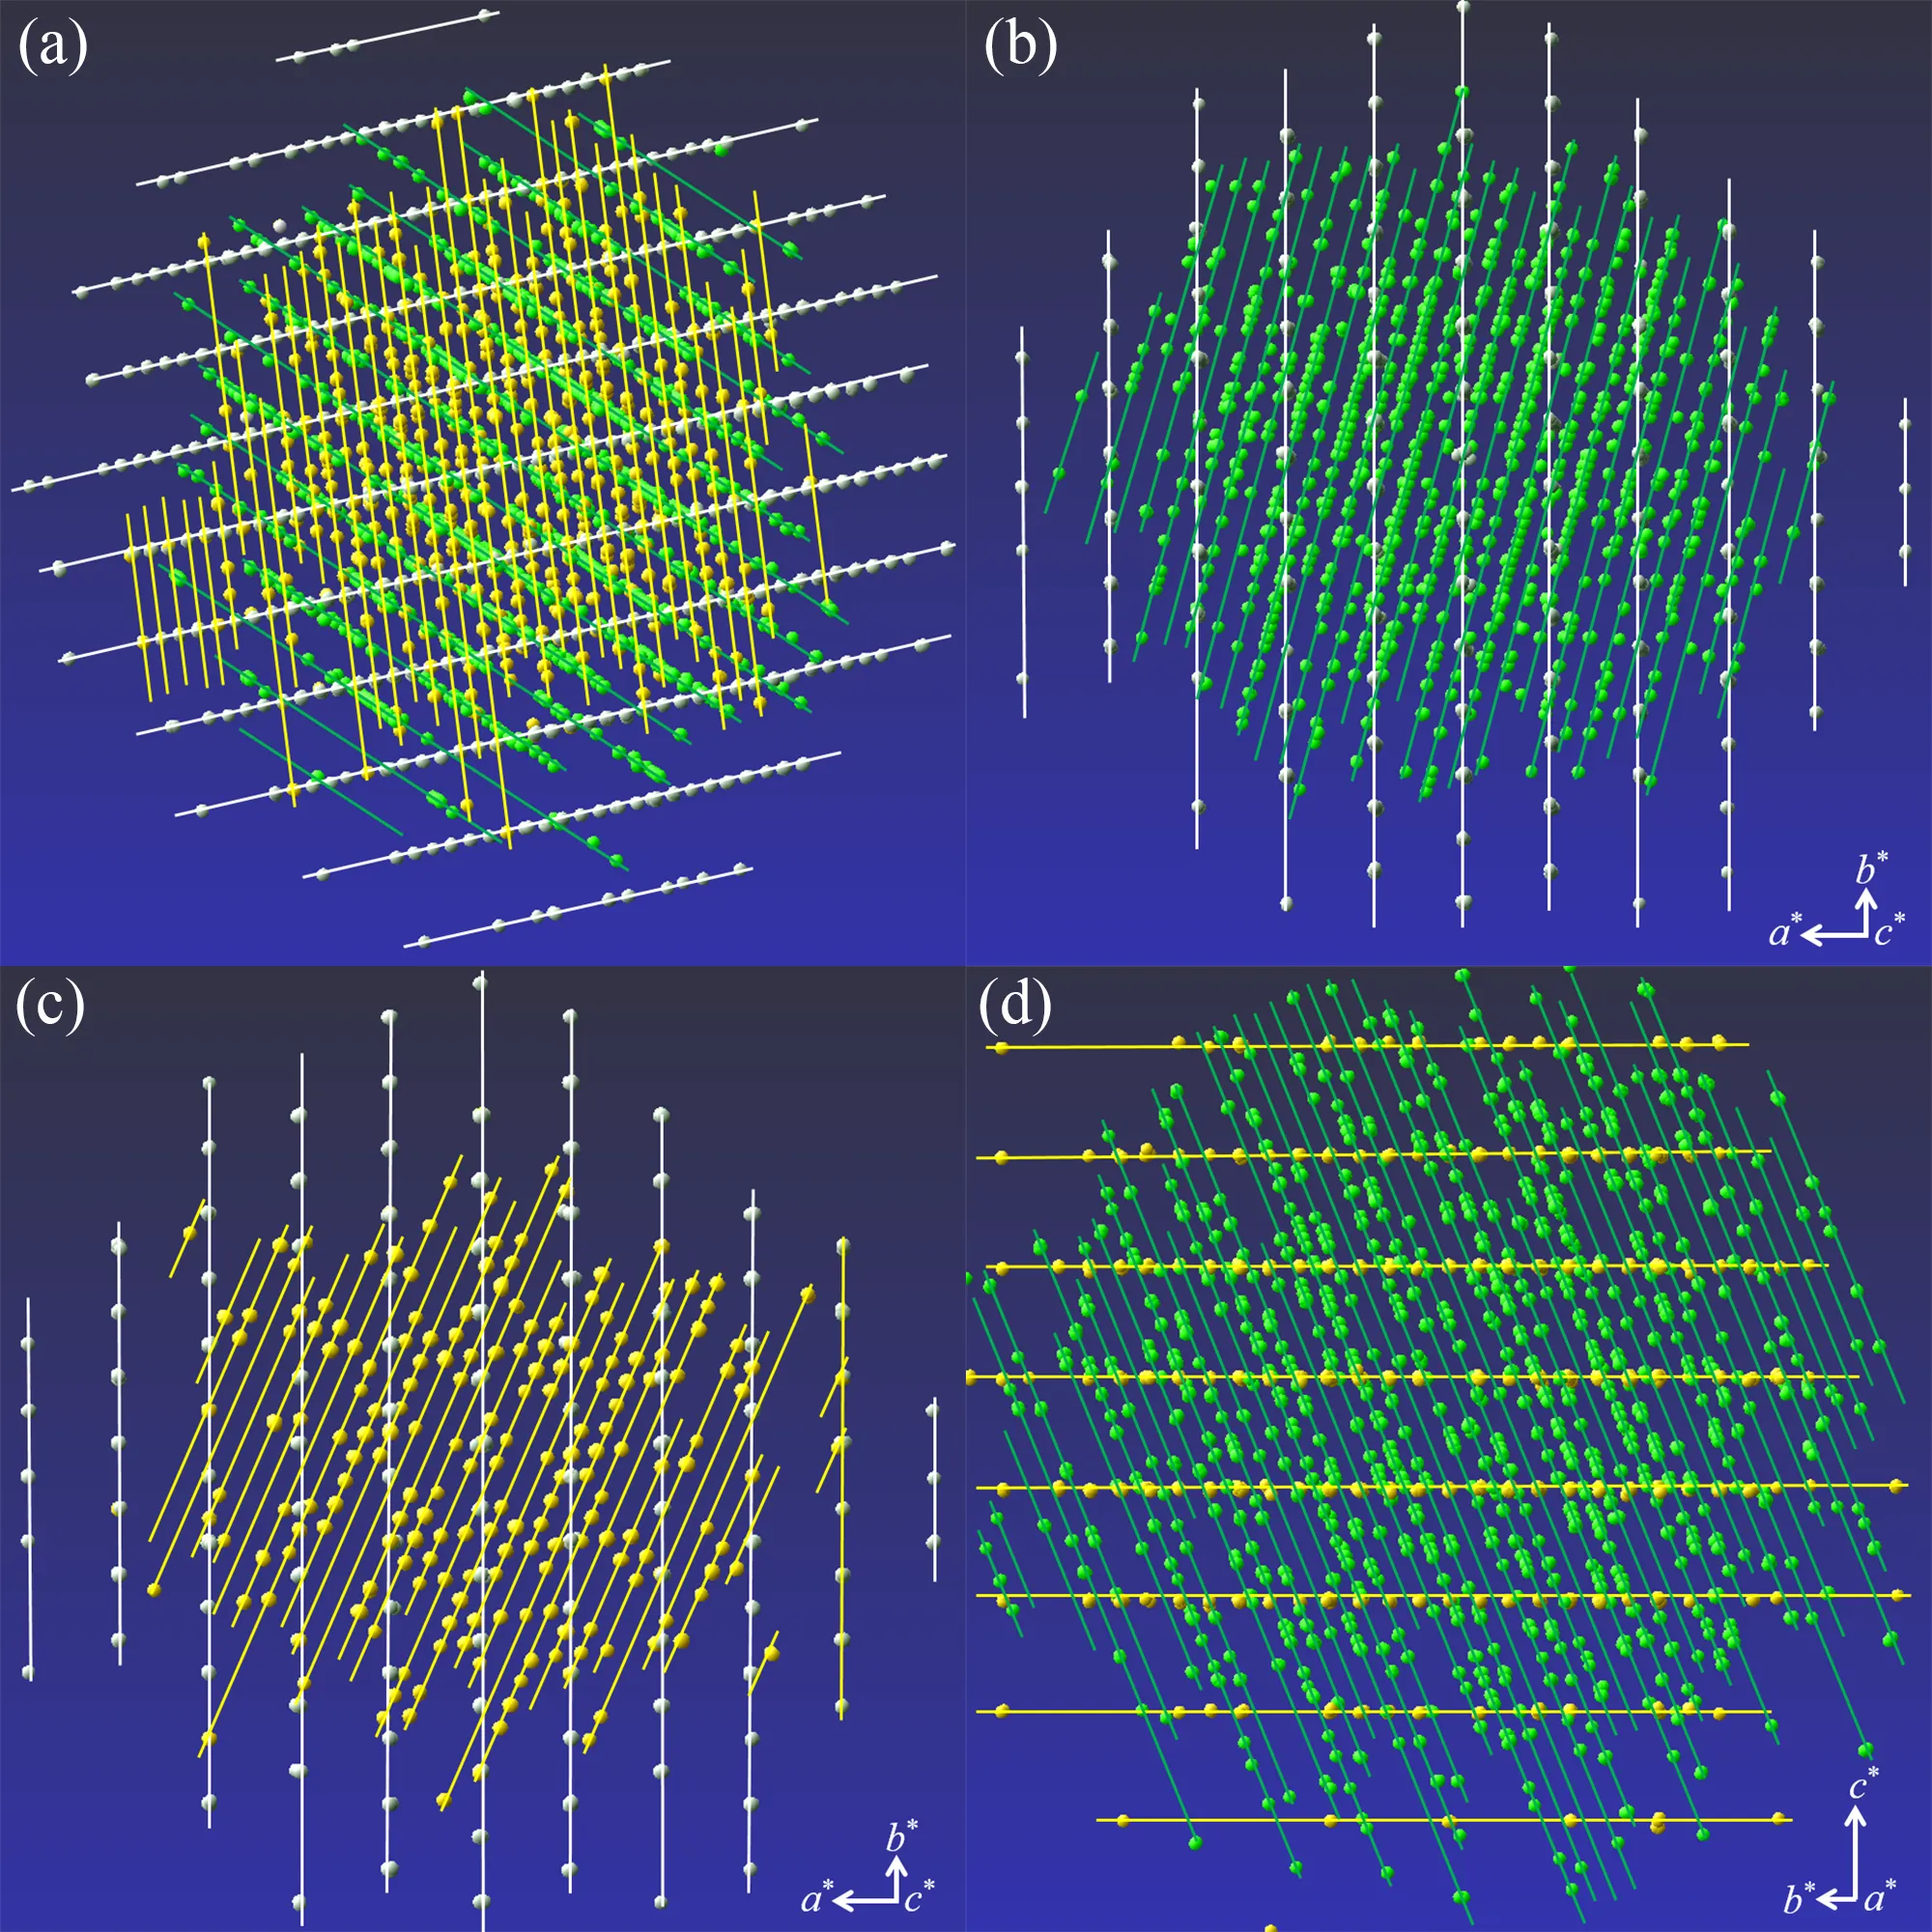
In this section, SXRD tests are conducted on samples of vacuum-sealed tube following heat treatment. The diffraction points in the reciprocal space of the collected sample, obtained from the 12 runs of SXRD measurements, are demonstrated in
. In
, white spots represent the LaNi phase because the cell parameters after indexing are
a = 3.92 Å,
b = 10.81 Å,
c = 4.39 Å,
α =
β =
γ = 90°. Green spots represent the La
3Ni
3Si
2 phase because the cell parameters after indexing are
a = 6.11 Å,
b = 7.47 Å,
c = 14.28 Å,
α =
β =
γ = 90°, and yellow spots represent the La
2NiSi phase because the cell parameters after indexing are
a =
b = 16.18 Å,
c = 4.35 Å,
α =
β = 90°,
γ = 120°. It can be clearly divided into three different sets of data sets, which means three independent different phases. Next, the three datasets were analyzed separately. The SXRD analysis of the sample involved a total of 12 runs, resulting in the collection of 8050 diffraction points in reciprocal space when the criterion of I/σ(I) equaled 3 for phase indexing. Within these diffraction points, 2437 were attributed to the LaNi phase, 3131 to the La
3Ni
3Si
2 phase, and 1388 to the La
2NiSi phase. The remaining 1094 diffraction points were associated with very small crystalline phases that could not be indexed to determine a unit cell (For a detailed description of the remaining diffraction points, see
Figure S5 in Supplementary materials).
The reciprocal lattices of the LaNi, La
3Ni
3Si
2 and La
2NiSi phases projected in three axes and their crystal structures are in the
Figure S6,
Figure S7 and
Figure S8 of the supplementary material.
. Diffraction spots of the entire sample in the reciprocal space. (<strong>a</strong>) Projection of three sets of data in reciprocal space in a random direction; (<strong>b</strong>) Projection of LaNi phase and La<sub>3</sub>Ni<sub>3</sub>Si<sub>2</sub> phase along the <em>c</em><sup>∗</sup> axis of LaNi phase; (<strong>c</strong>) Projection of LaNi phase and La<sub>3</sub>Ni<sub>3</sub>Si<sub>2</sub> phase along the <em>c</em><sup>∗</sup> axis of LaNi phase; (<strong>d</strong>) Projection of La<sub>3</sub>Ni<sub>3</sub>Si<sub>2</sub> phase and La<sub>2</sub>NiSi phase along the <em>a</em><sup>∗</sup> axis of La<sub>2</sub>NiSi phase.
Detailed crystallographic data, data collection, and structural refinement details of LaNi phase and La
3Ni
3Si
2 phase are summarized in
. The crystallographic parameters of both phases conform to the standards set by international crystallography for the rationalization of crystal structures. For the La
2NiSi phase, due to the limited number of diffraction points and low intensity of the phase, structural refinement is not feasible. However, the crystal structure of La
2NiSi has been previously reported [
49,
50]. Therefore, the crystal structure of the La
2NiSi phase determined by Bodak et al. [
49] is utilized in the topological analysis of the phase. It can be observed from
that the La
3Ni
3Si
2 phase exhibits a narrow range of
θ values and higher
Rint,
R1, and
R2 values. This phenomenon is likely attributed to the presence of the three coexisting phases in the measured crystal, which contributes to the aforementioned issues in the final refinement results of the La
3Ni
3Si
2 phase. To address this, selected samples from the same batch for SXRD tests and found a sample belonging to La
3Ni
3Si
2 phase, the diffraction quality of this sample is quite good. After indexing the unit cell, it is found that this set of data shows a small number of La
3Ni
3Si
2 twins. Among them, 80.8% of the diffraction points belong to the first domain La
3Ni
3Si
2, 16.7% belong to the second domain La
3Ni
3Si
2, and 2.5% cannot be indexed, these are crystals that are extremely small in size. Since only a small portion of the diffraction points belong to the second domain La
3Ni
3Si
2, we refined the crystal structure of the main 80.8% of the diffraction points. The refinement results were very good, and the crystallographic data from the refined results are presented in
Table S3 of the supplementary material, while the fractional coordinates and equivalent isotropic displacement parameters of the atoms are displayed in
Table S4 of the supplementary material.
.
Crystallographic and experimental data of LaNi and La3Ni3Si2 obtained through vacuum-sealed tube heat treatment.
|
LaNi |
La3Ni3Si2 |
| a/Å |
3.9213(5) |
7.435(5) |
| b/Å |
10.7970(13) |
14.227(9) |
| c/Å |
4.3833(6) |
6.069(4) |
| α, β, γ/° |
90, 90, 90 |
90, 90, 90 |
| V/Å3 |
185.58(4) |
641.9(7) |
| Z |
2 |
8 |
| Space group |
Cmcm |
Pnma |
| Crystal system |
Orthorhombic |
Orthorhombic |
| Diffractometer |
Bruker D8 Venture Photon 100 COMS |
| Monochromator |
Graphite |
| Tmeas/K |
300(2) |
| Radiation |
Mo-Kα, λ = 0.71073 (Å) |
| Scan mode |
φ and ω scan |
| Time per step/s |
5 |
| Absorption correction |
Multi-scan |
| F(000) |
340 |
1132 |
| θ range/° |
3.77~27.48 |
5.46~25.38 |
| μ/mm−1 |
32.266 |
28.370 |
| No. measured reflections |
3183 |
6122 |
| No. unique reflections |
138 |
581 |
| No. observed reflections (I > 2σ(I)) |
130 |
362 |
| No. reflections used in refinement |
138 |
581 |
| No. parameters used in refinement |
9 |
40 |
| Reflection range |
−5 ≤ h ≤ 5, −14 ≤ k ≤ 14, −5 ≤ l ≤ 5 |
−8 ≤ h ≤ 8, −16 ≤ k ≤ 16, −7 ≤ l ≤ 7 |
| Rint |
0.0611 |
0.2268 |
| R(σ) |
0.0183 |
0.1225 |
| Final R indices (Fobs > 4σ(Fobs)) |
R1 = 0.0248, ωR2 = 0.0612 |
R1 = 0.0543, ωR2 = 0.1150 |
| R indices (all data) |
R1 = 0.0263, ωR2 = 0.0612 |
R1 = 0.1159, ωR2 = 0.1150 |
| Goodness of fit |
1.280 |
1.048 |
Since the atomic positions and topology of the LaNi phase have been detailed in Section 3.1, we will not elaborate further here.
presents detailed information on La
3Ni
3Si
2, indicating that the three types of atoms La, Ni, and Si are fully occupied at their respective positions. Compared with the crystal structure of La
3Ni
3Si
2 mentioned by Pani et al. in 2022 [
2], the coordinate positions and occupancy of each atom are highly consistent.
.
Fractional atomic coordinates and equivalent isotropic displacement parameters (Å2) of La3Ni3Si2.
| Label |
Site |
x |
y |
z |
Occ. |
Ueq |
| La1 |
8d |
0.01646(18) |
0.60636(9) |
0.3610(2) |
1 |
0.0127(4) |
| La2 |
4c |
0.6169(2) |
0.25000 |
0.3744(4) |
1 |
0.0118(6) |
| Ni1 |
8d |
0.1292(4) |
0.4596(2) |
0.1013(5) |
1 |
0.0121(8) |
| Ni2 |
4c |
0.2745(6) |
0.25000 |
0.5646(8) |
1 |
0.0167(12) |
| Si1 |
8d |
0.3305(8) |
0.4121(4) |
0.3630(11) |
1 |
0.0087(15) |
Next, the topological structure of the La
3Ni
3Si
2 phase is analyzed. It is found that the structure of La
3Ni
3Si
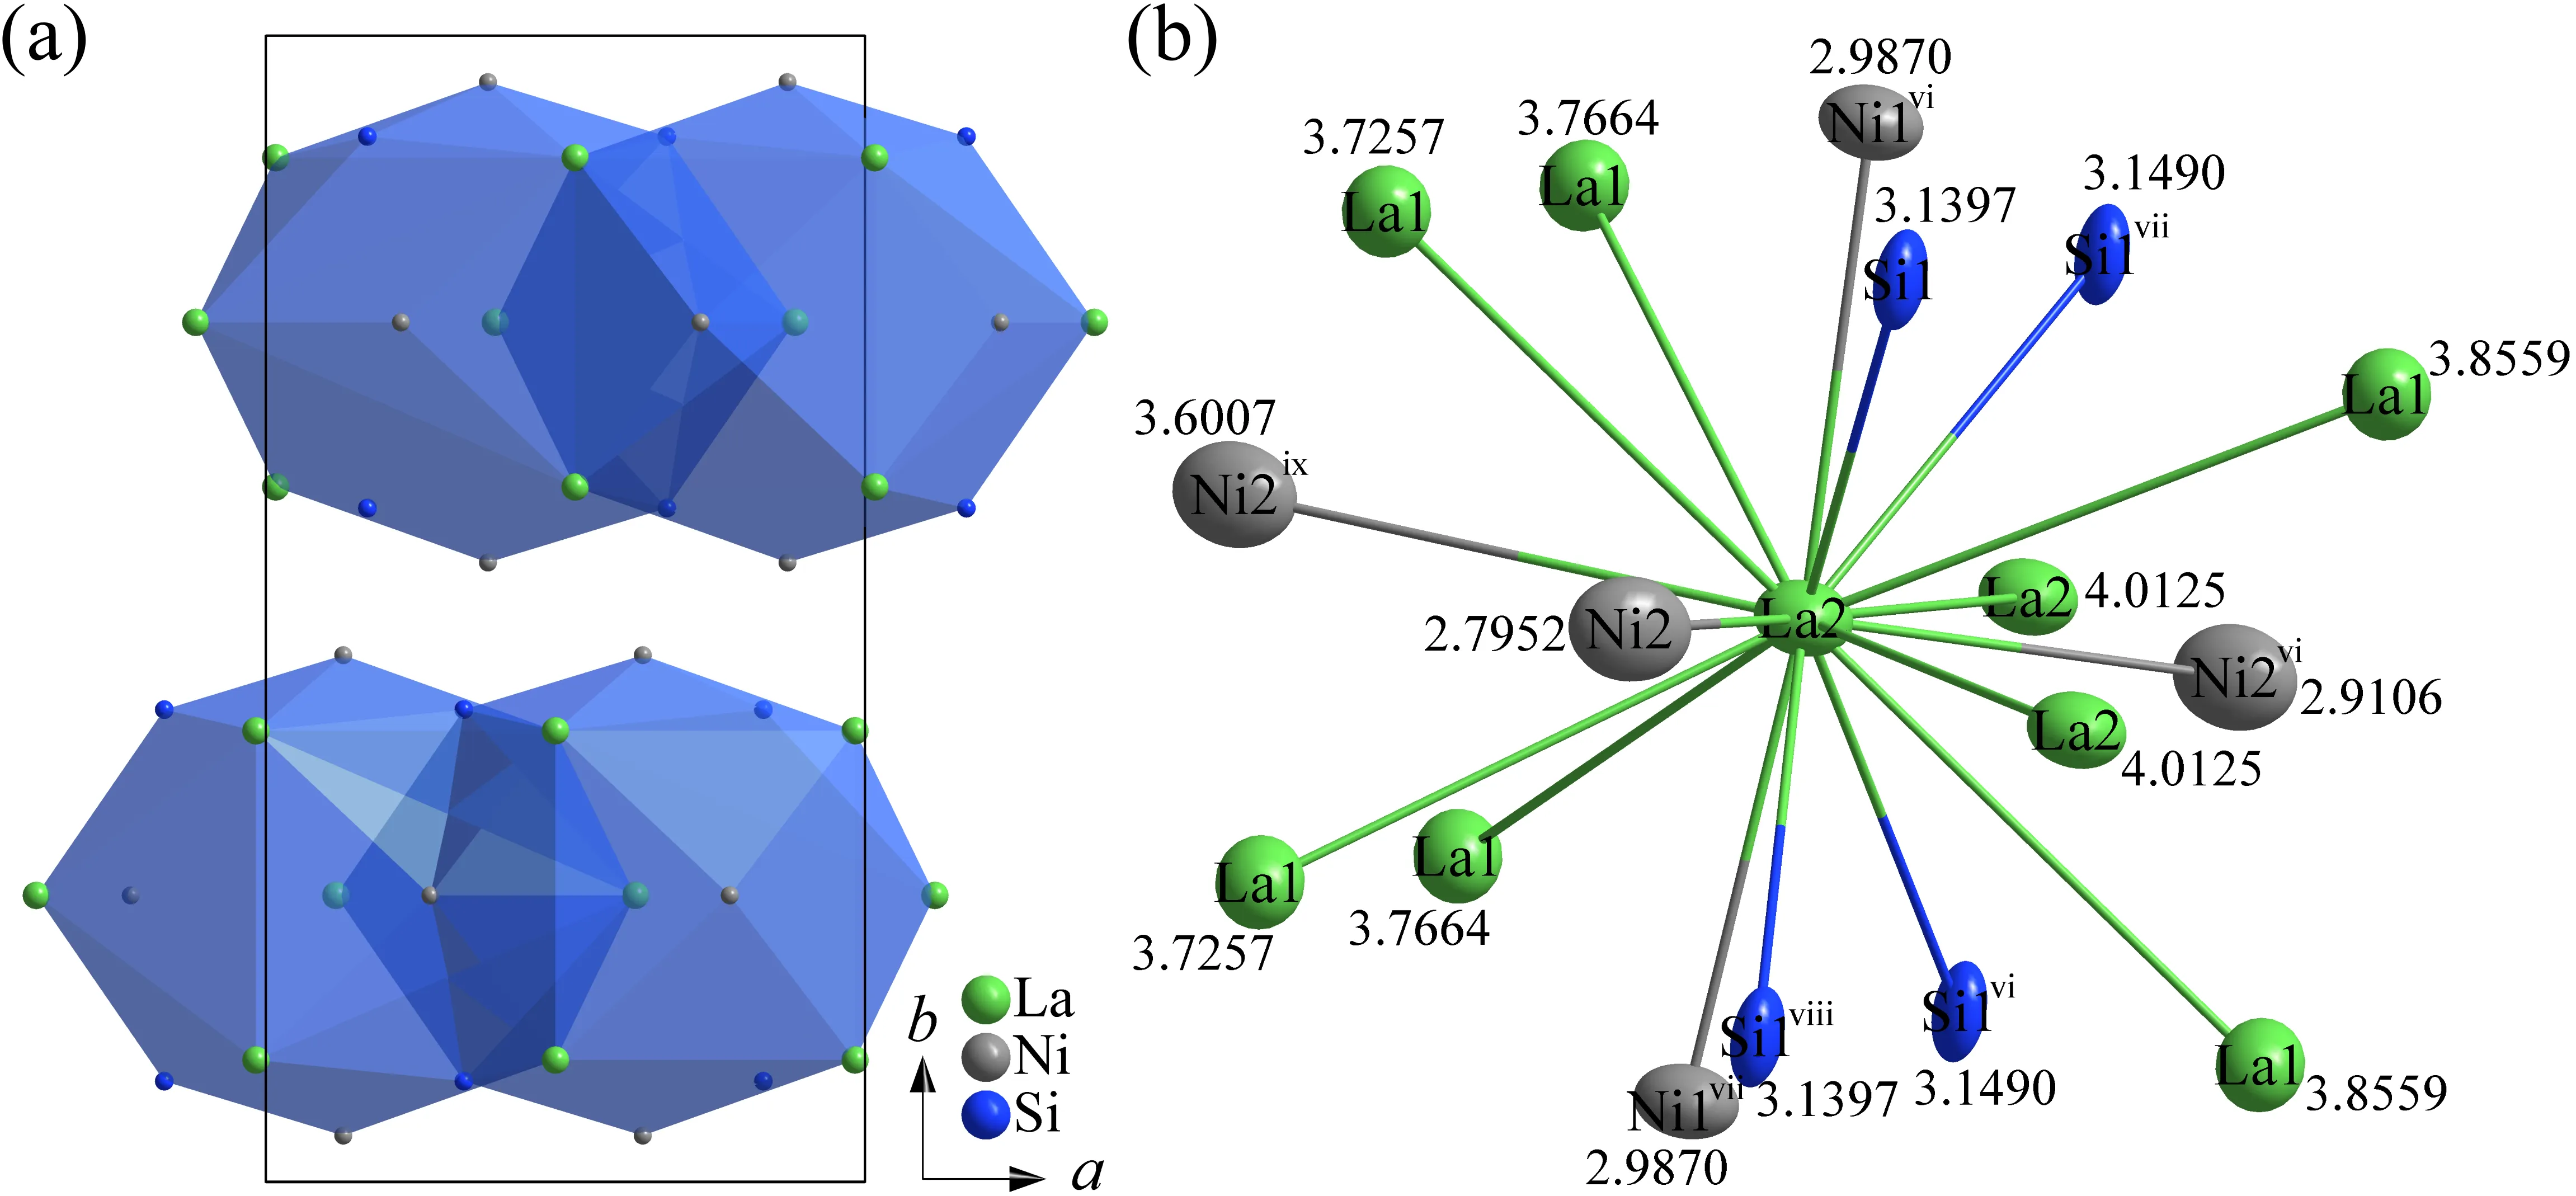
2 can be described by the model of a La2(1)(1@17) cluster, which is a centered on the La2 atom.
a illustrates the cluster assembly model in the La
3Ni
3Si
2 unit. There are 4 La2(1)(1@17) clusters that are interleaved with each other connections.
b presents an environmental diagram of the La2 atom, showing 17 atoms around it, including 6 La1 atoms, 2 La2 atoms, 2 Ni1 atoms, 3 Ni2 atom, and 4 Si1 atoms. In addition, the distances between each coordination atom and the central atom La1 are indicated in
b. The longest distance, measuring 4.0125 Å, is observed between the La2 and La2 atoms, while the shortest distance, at 2.7952 Å, occurs between the Ni2 and La2 atoms.
. Cluster assembly model of La<sub>3</sub>Ni<sub>3</sub>Si<sub>2</sub> phase (<strong>a</strong>) and atomic environment diagram of La2 atom (<strong>b</strong>). Symmetry codes: (vi) <em>x</em> + 1/2, <em>y</em>, −<em>z</em> + 1/2; (vii) <em>x</em> + 1/2, −<em>y</em> + 1/2, −<em>z</em> + 1/2; (viii) <em>x</em>, −<em>y</em> + 1/2, <em>z</em>; (ix) <em>x</em> + 1/2, <em>y</em>, −<em>z</em> + 3/2.
As for the La
2NiSi phase, the structural model of Bodak et al. is used in this paper [
49].
shows the coordinate positions and occupancy of each atom in the La
2NiSi phase. It can be seen from
that there are two pairs of co-occupying atoms in the La
2NiSi phase, namely Ni2/Si2 co-occupying atoms and Ni3/Si3 co-occupying atoms.
.
Fractional atomic coordinates of La2NiSi.
| Label |
Site |
x |
y |
z |
Occ. |
| La1 |
6h |
0.83200 |
0.82000 |
0.25000 |
1 |
| La2 |
6h |
0.60200 |
0.86400 |
0.25000 |
1 |
| La3 |
6h |
0.38700 |
0.93300 |
0.25000 |
1 |
| La4 |
2c |
0.33333 |
0.66667 |
0.25000 |
1 |
| Ni1 |
2b |
0.00000 |
0.00000 |
0.00000 |
1 |
| Si1 |
6h |
0.54700 |
0.16700 |
0.25000 |
1 |
| Ni2 |
6h |
0.75800 |
0.09200 |
0.25000 |
0.45 |
| Si2 |
6h |
0.75800 |
0.09200 |
0.25000 |
0.55 |
| Ni3 |
6h |
0.71700 |
0.21900 |
0.25000 |
0.90 |
| Si3 |
6h |
0.71700 |
0.21900 |
0.25000 |
0.10 |
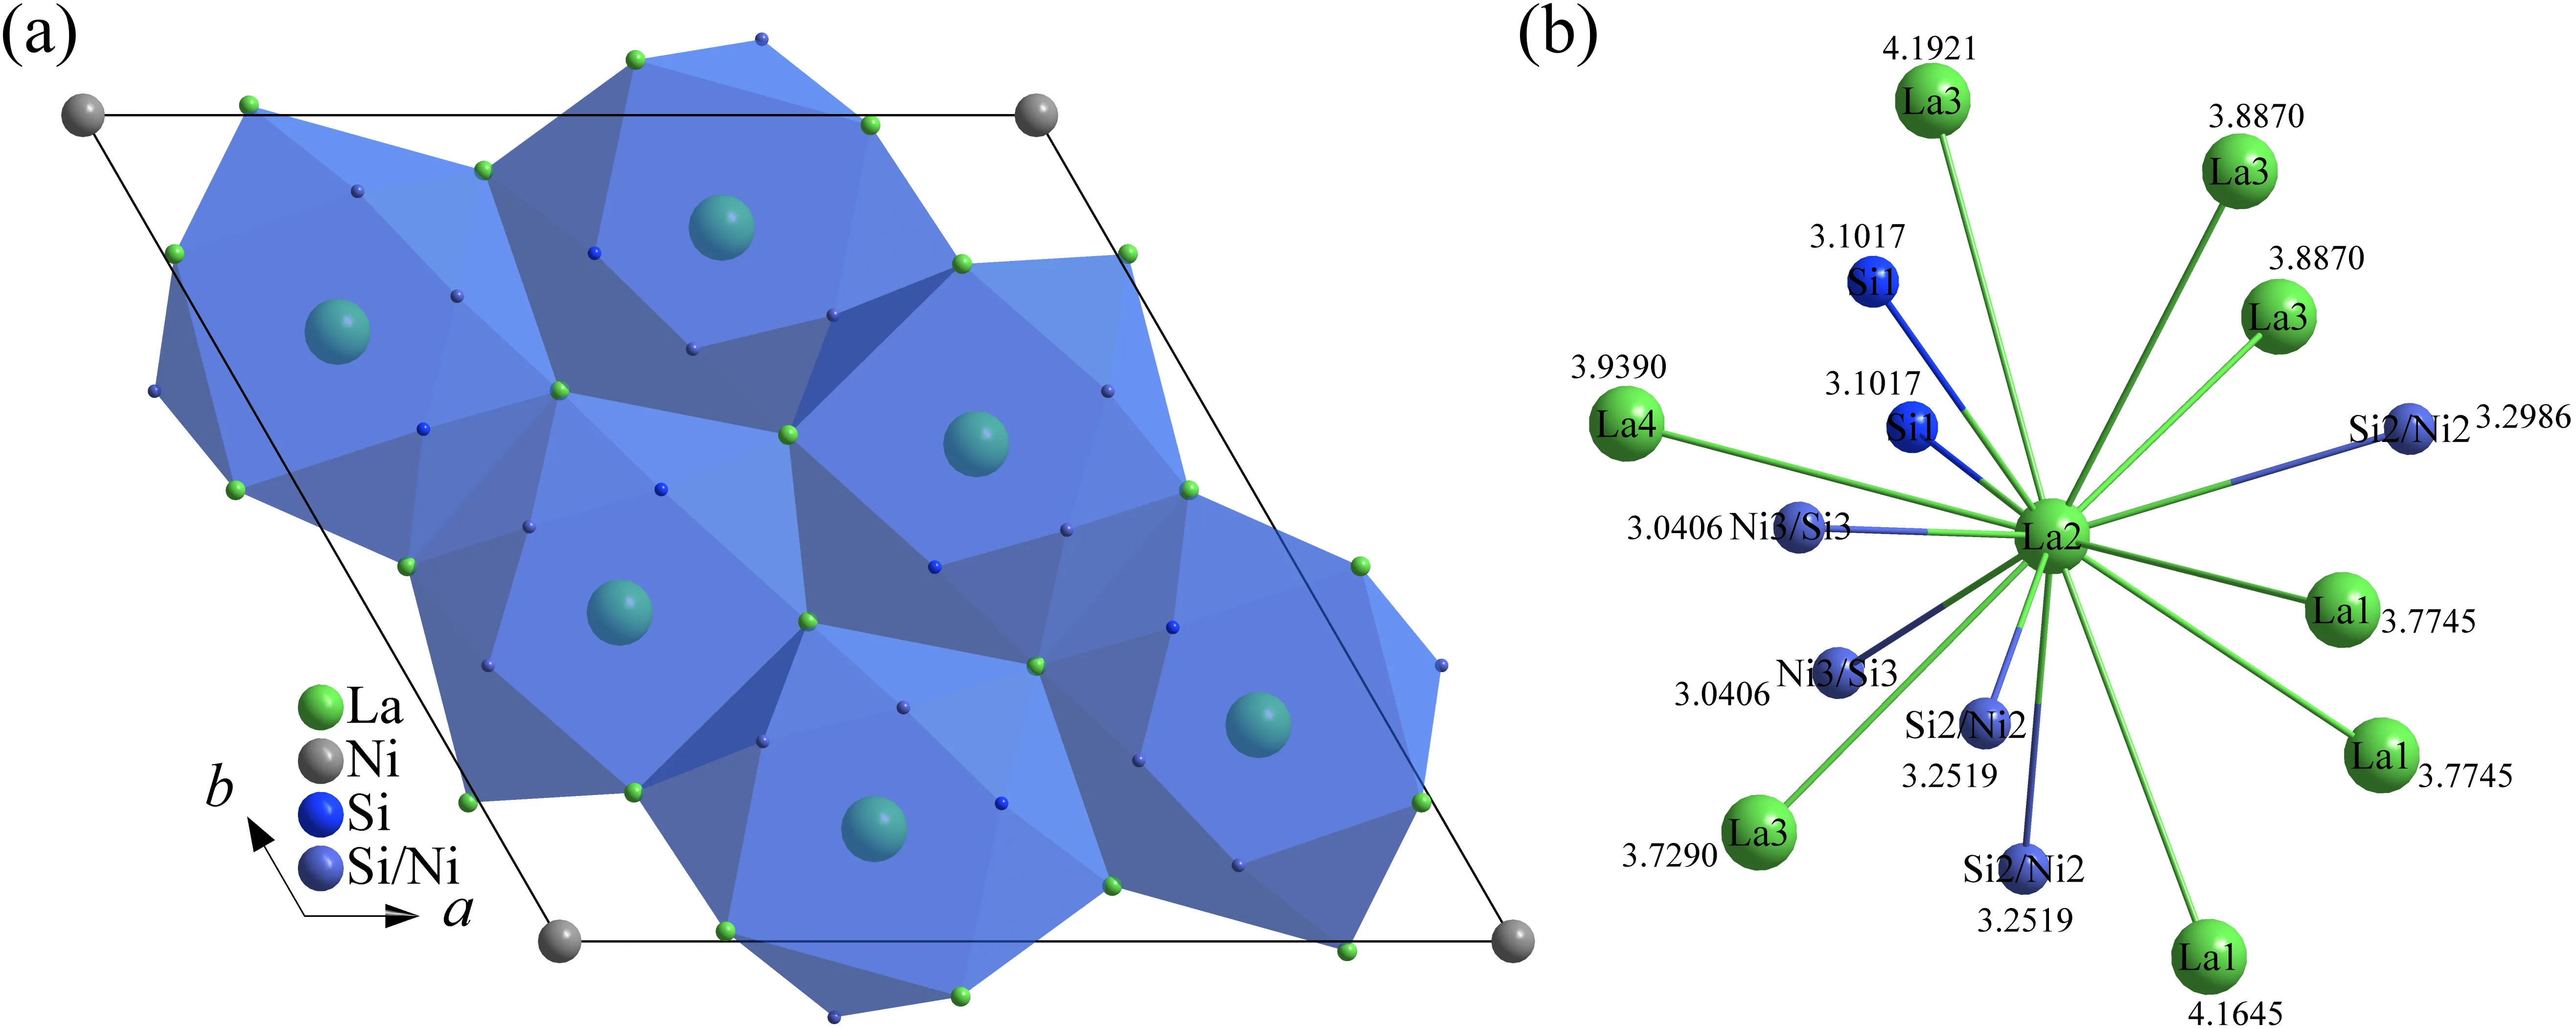
Similarly, we conducted a topological analysis of the La
2NiSi phase and found that the phase can be characterized by one cluster model: La2(1)(1@15). The central atom of the La2(1)(1@15) cluster is the La2 atom.
a illustrates the cluster assembly model in the La
2NiSi phase cell, while
b depicts the surrounding environment diagram of the La2 atom, which includes 15 atoms: 3 La1 atoms, 4 La3 atoms, 1 La4 atom, 2 Si1 atoms, 3 Si2/Ni2 atoms, and 2 Ni3/Si3 atoms. Additionally, the distances between each coordination atom and the central atom La2 are indicated in
b. The longest distance, measuring 4.1921 Å, is observed between the La2 and La3 atoms, while the shortest distance, at 3.0406 Å, occurs between the La2 and Ni3/Si3 atoms.
. Cluster assembly model of La<sub>2</sub>NiSi phase (<strong>a</strong>) and atomic environment diagram of La2 atom (<strong>b</strong>).
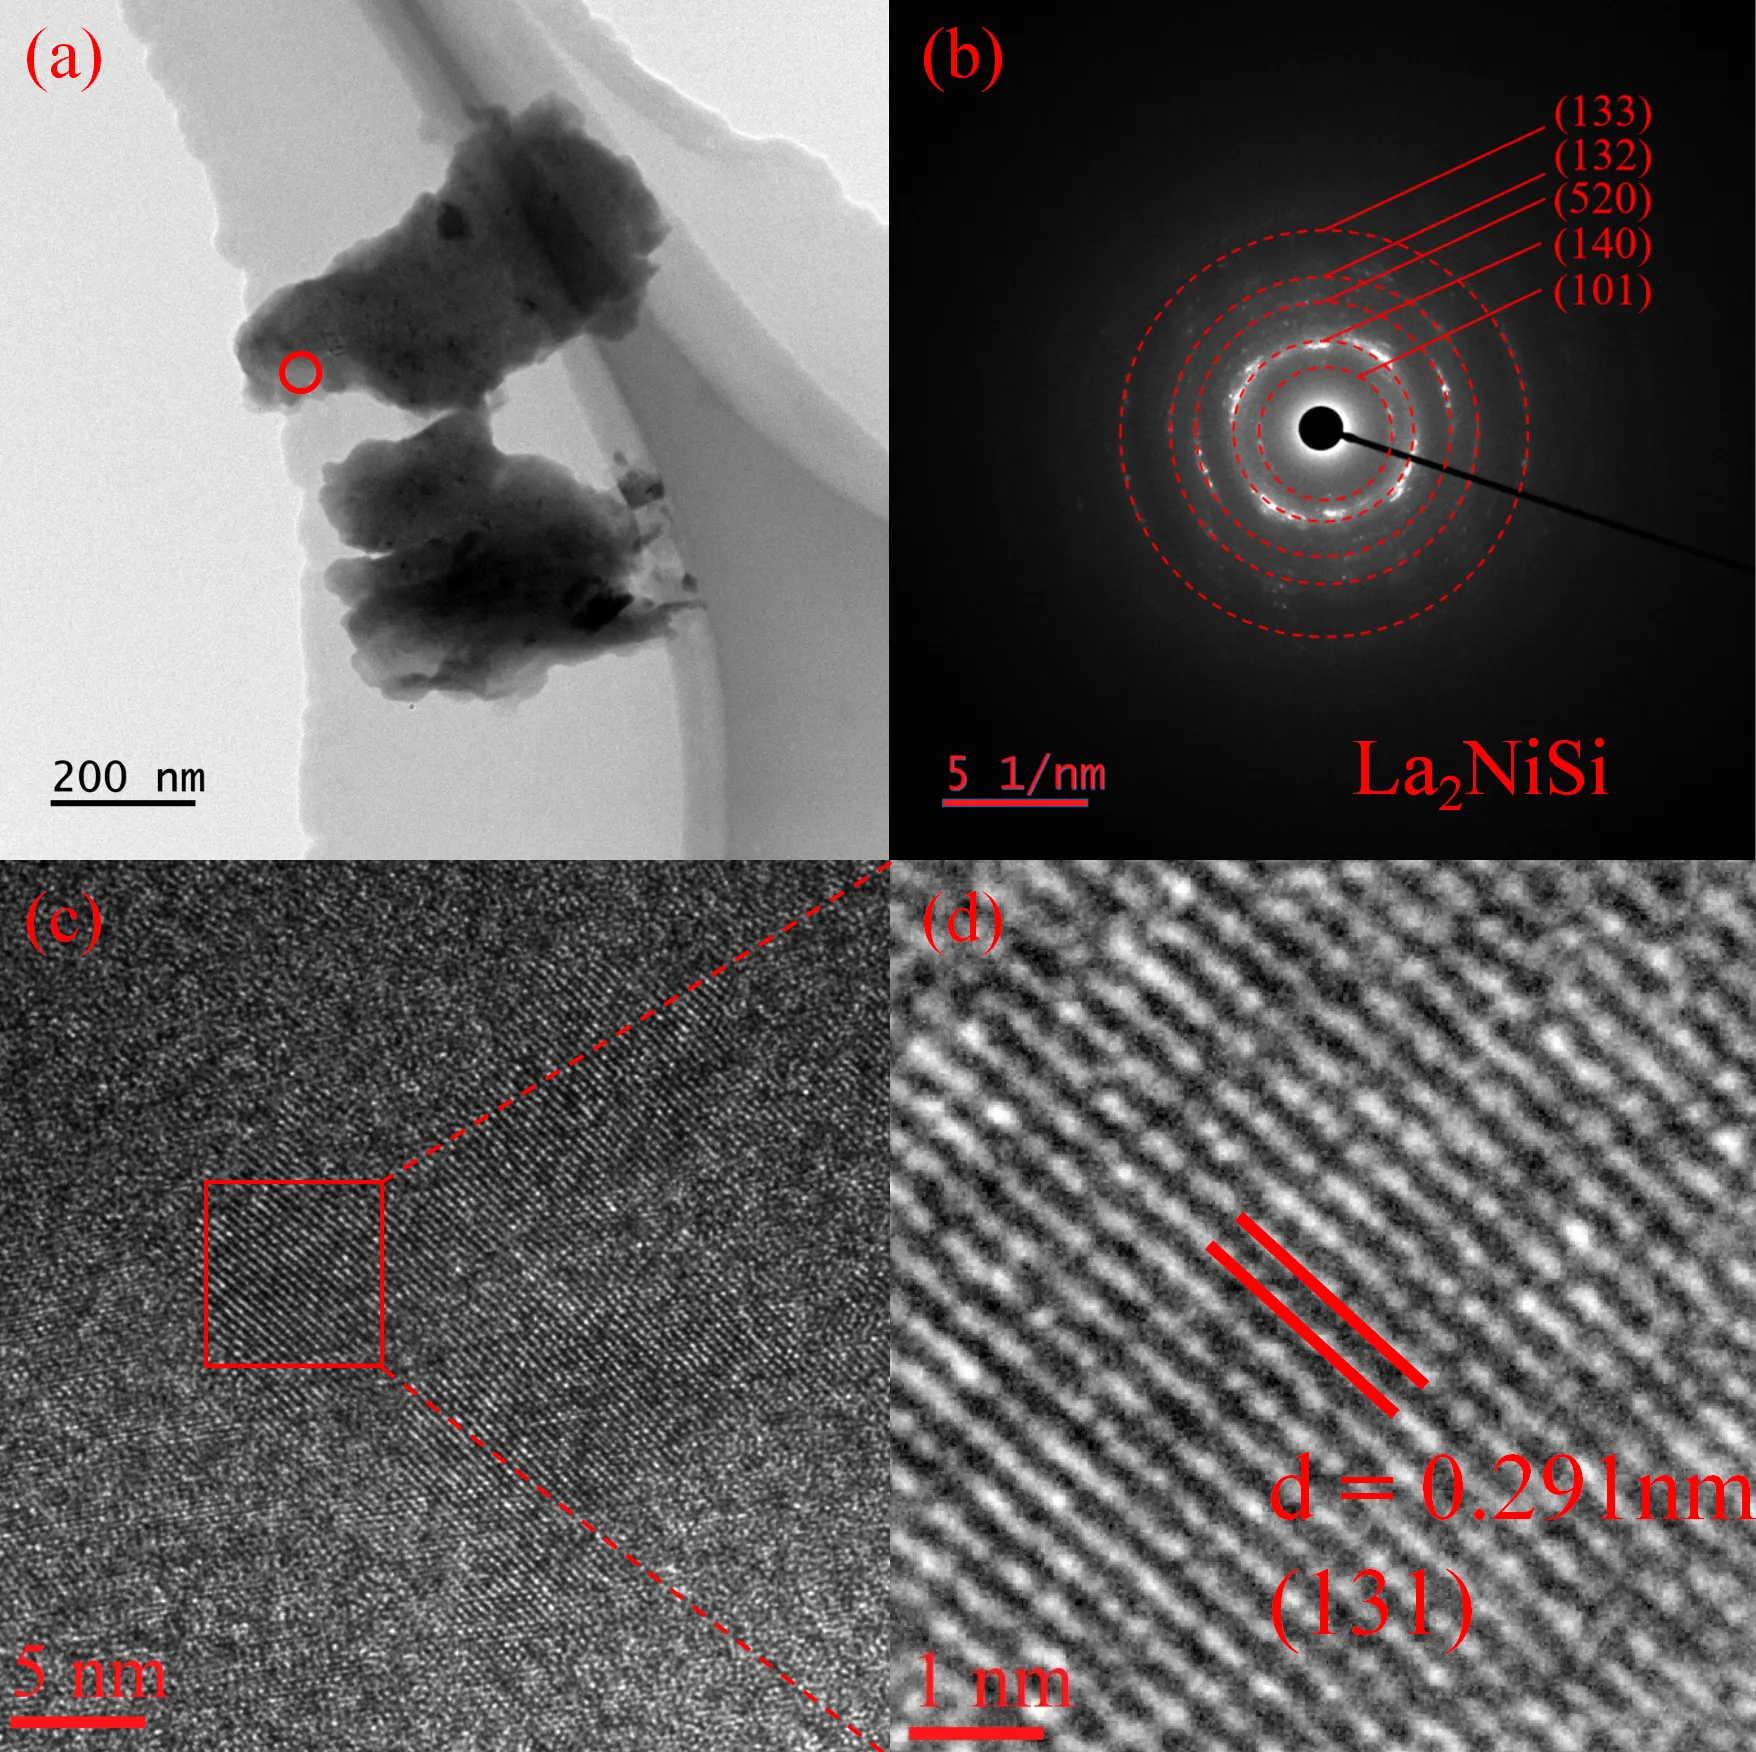
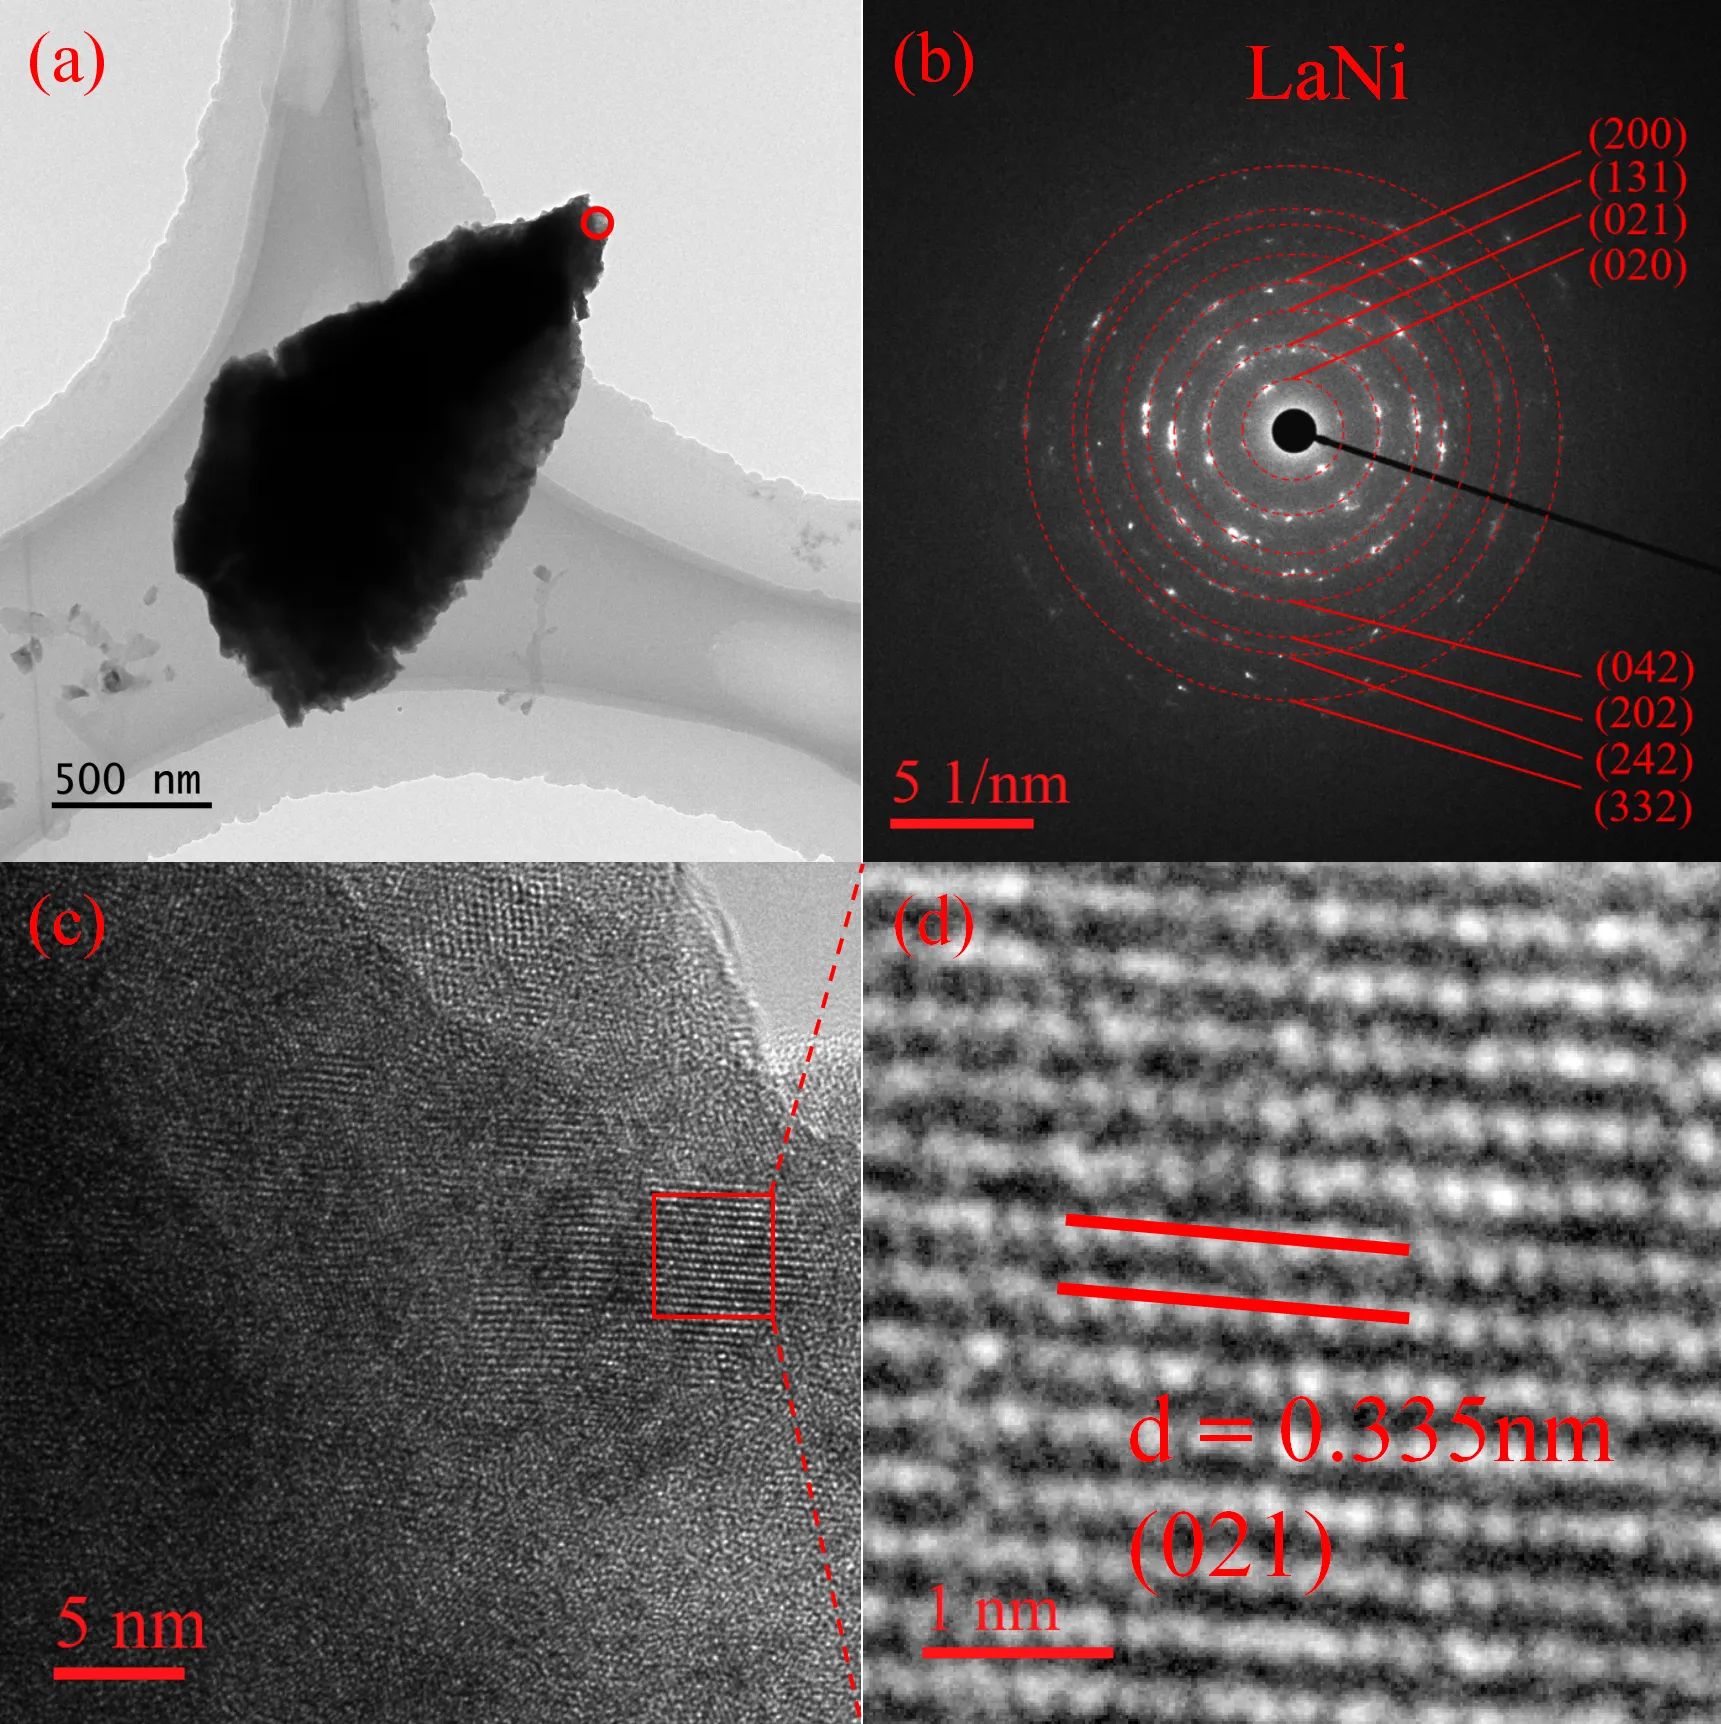
3.3.1. TEM Test
In order to verify the accuracy of our SXRD tests, transmission electron microscopy (TEM) analyses were conducted on the same batch of samples. The results are presented in
,
,
and
.
and
confirm the presence of the La
2NiSi phase, while
and
confirm the presence of the LaNi phase. It is important to note that although the atomic ratio of La to Ni in
is approximately 3:2, the indexing results from the SAED and HRTEM images in
are in good agreement with LaNi. Therefore, the sample is considered to be LaNi phase. In addition, only the La
2NiSi and LaNi phases were identified in the TEM test, while the La
3Ni
3Si
2 phase was not detected at this time. However, the La
3Ni
3Si
2 phase was observed multiple times during the SXRD test. In summary, the TEM test results further confirmed the presence of silicon (Si) elements. Additionally, these findings lend support to the accuracy of our SXRD test results to some extent.
. Microstructures of the La<sub>2</sub>NiSi phase. (<strong>a</strong>) TEM topography of La<sub>2</sub>NiSi phase. (<strong>b</strong>) SAED of La<sub>2</sub>NiSi phase. (<strong>c</strong>) HRTEM image for the area outlined by the red circle in (<strong>a</strong>). (<strong>d</strong>) HRTEM image of La<sub>2</sub>NiSi acquired from the red box in (<strong>c</strong>).
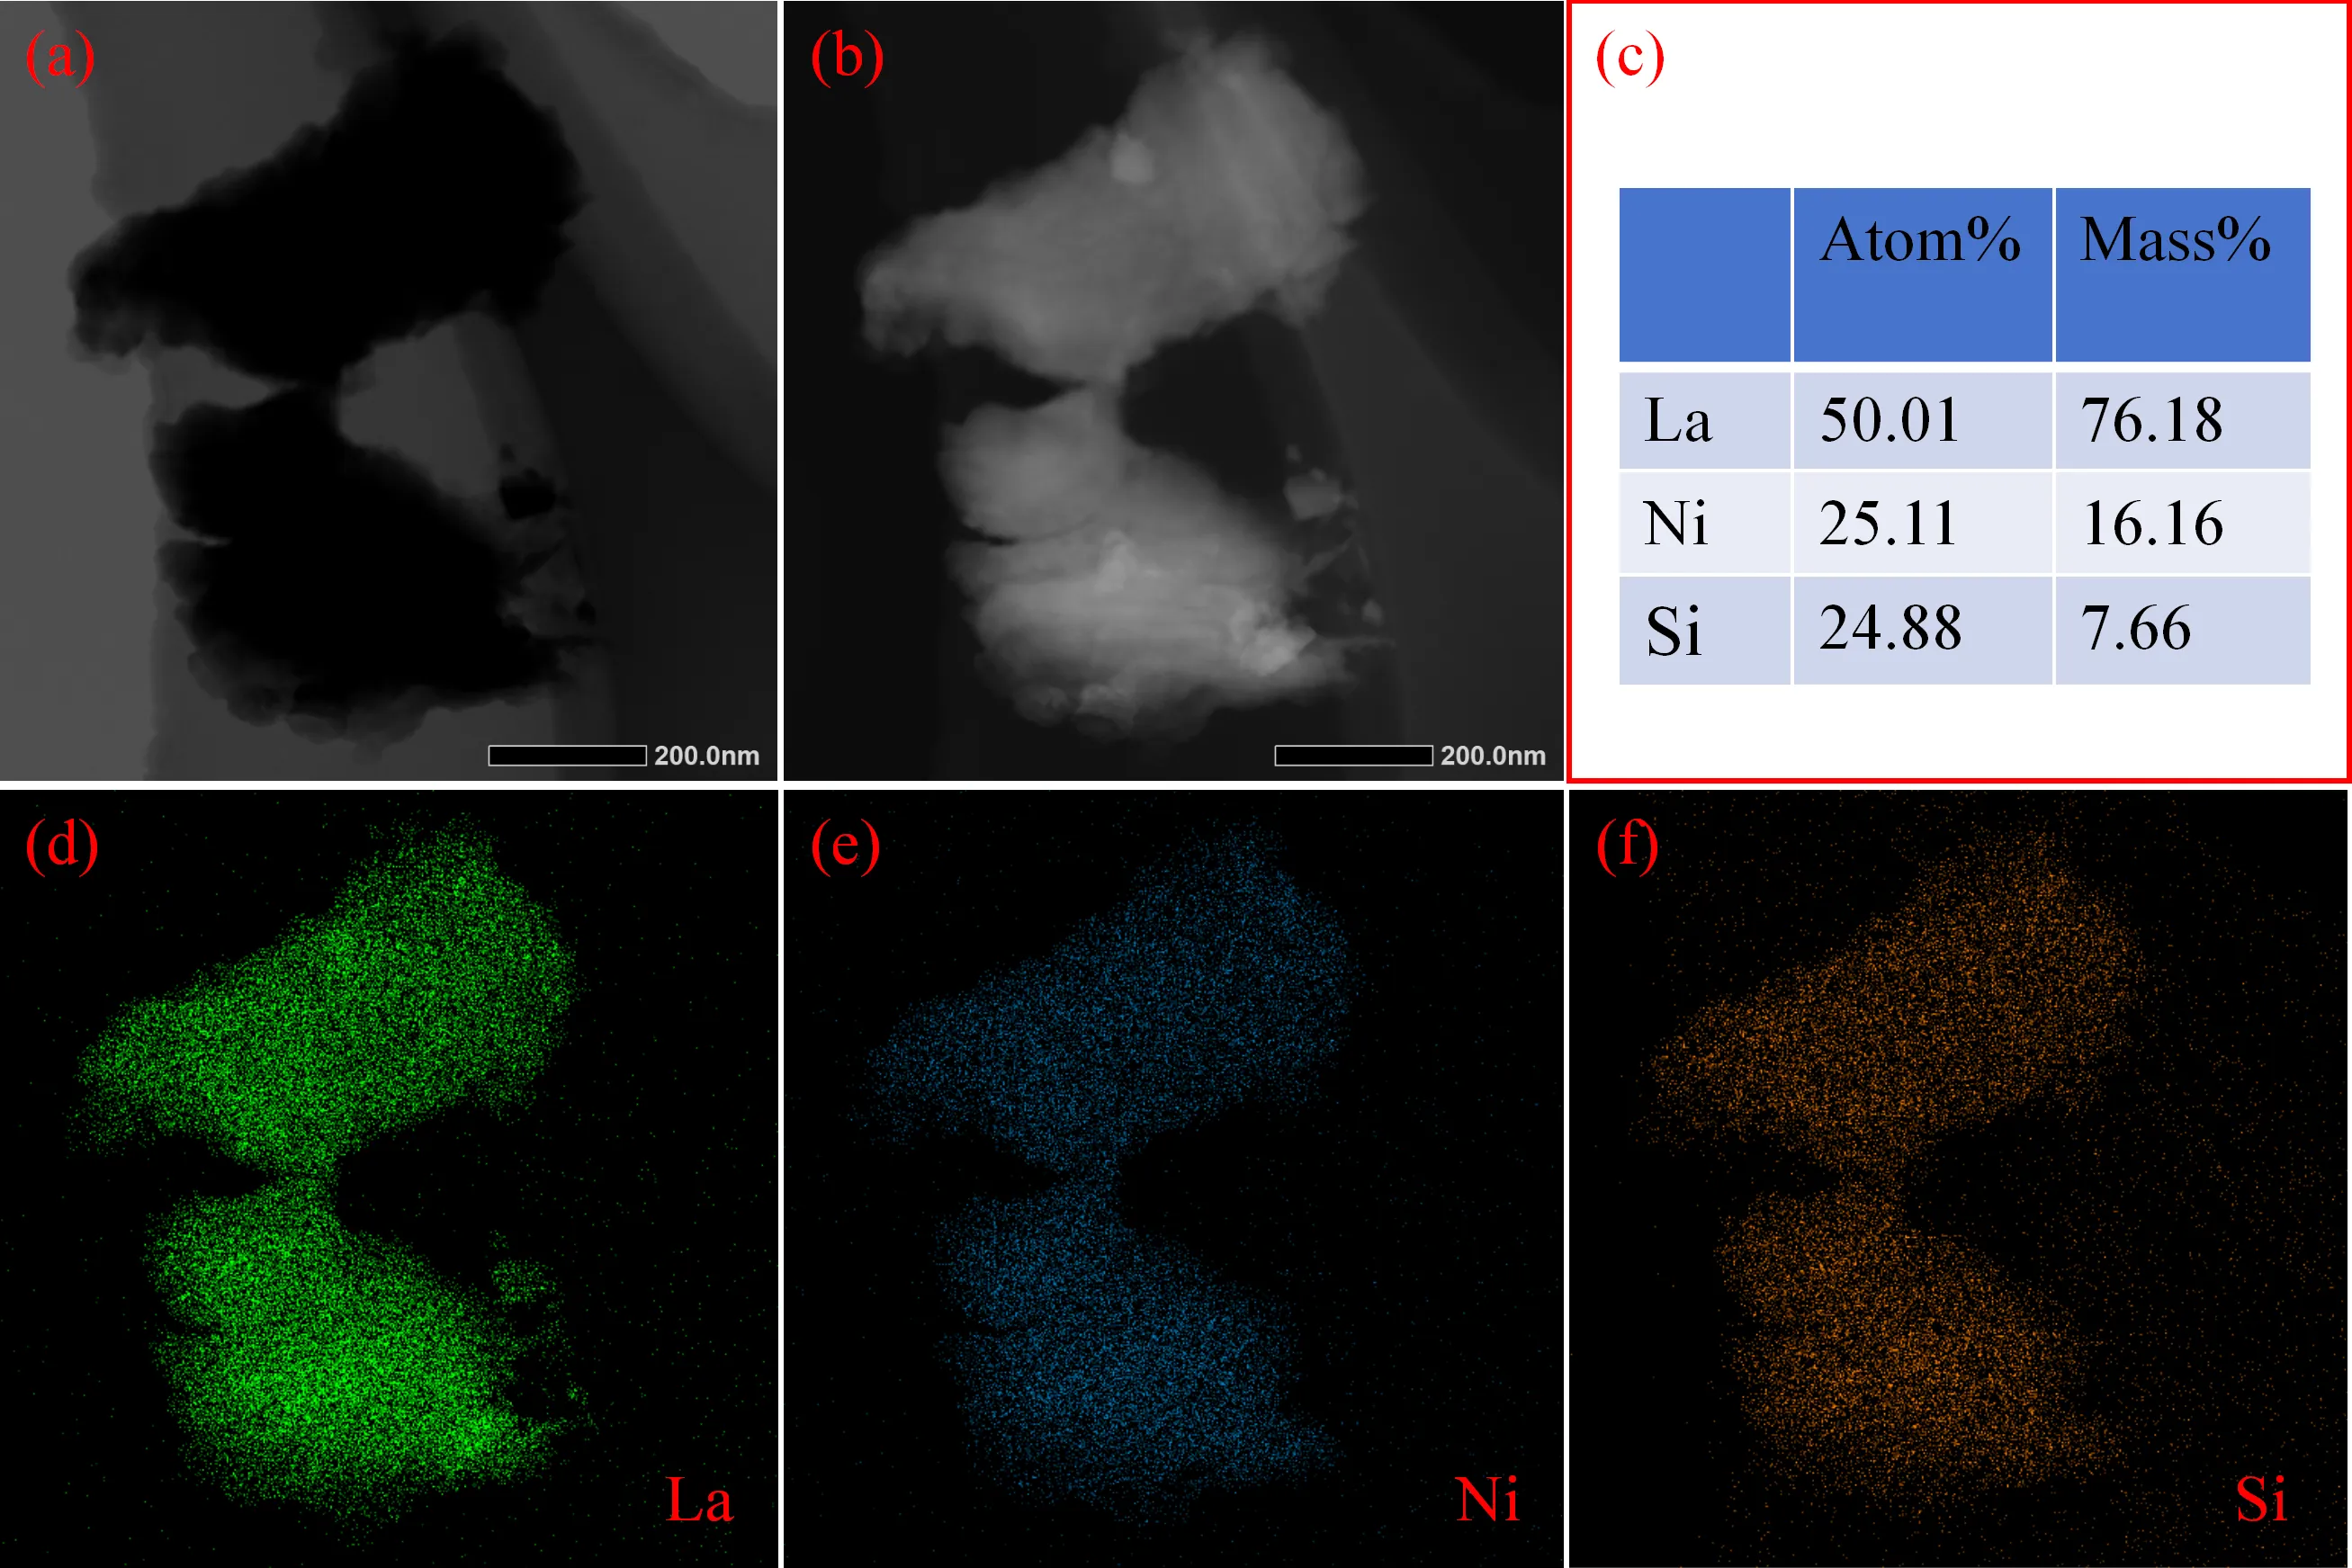
. STEM image and elemental mappings of La, Ni and Si. (<strong>a</strong>) BF image. (<strong>b</strong>) DF image. (<strong>c</strong>) Element composition test results. (<strong>d</strong>) elemental mapping of La. (<strong>e</strong>) elemental mapping of Ni. (<strong>f</strong>) elemental mapping of Si.
. Microstructures of the LaNi phase. (<strong>a</strong>) TEM topography of LaNi phase. (<strong>b</strong>) SAED of LaNi phase. (<strong>c</strong>) HRTEM image for the area outlined by the red circle in (<strong>a</strong>). (<strong>d</strong>) HRTEM image of LaNi acquired from the red box in (<strong>c</strong>).
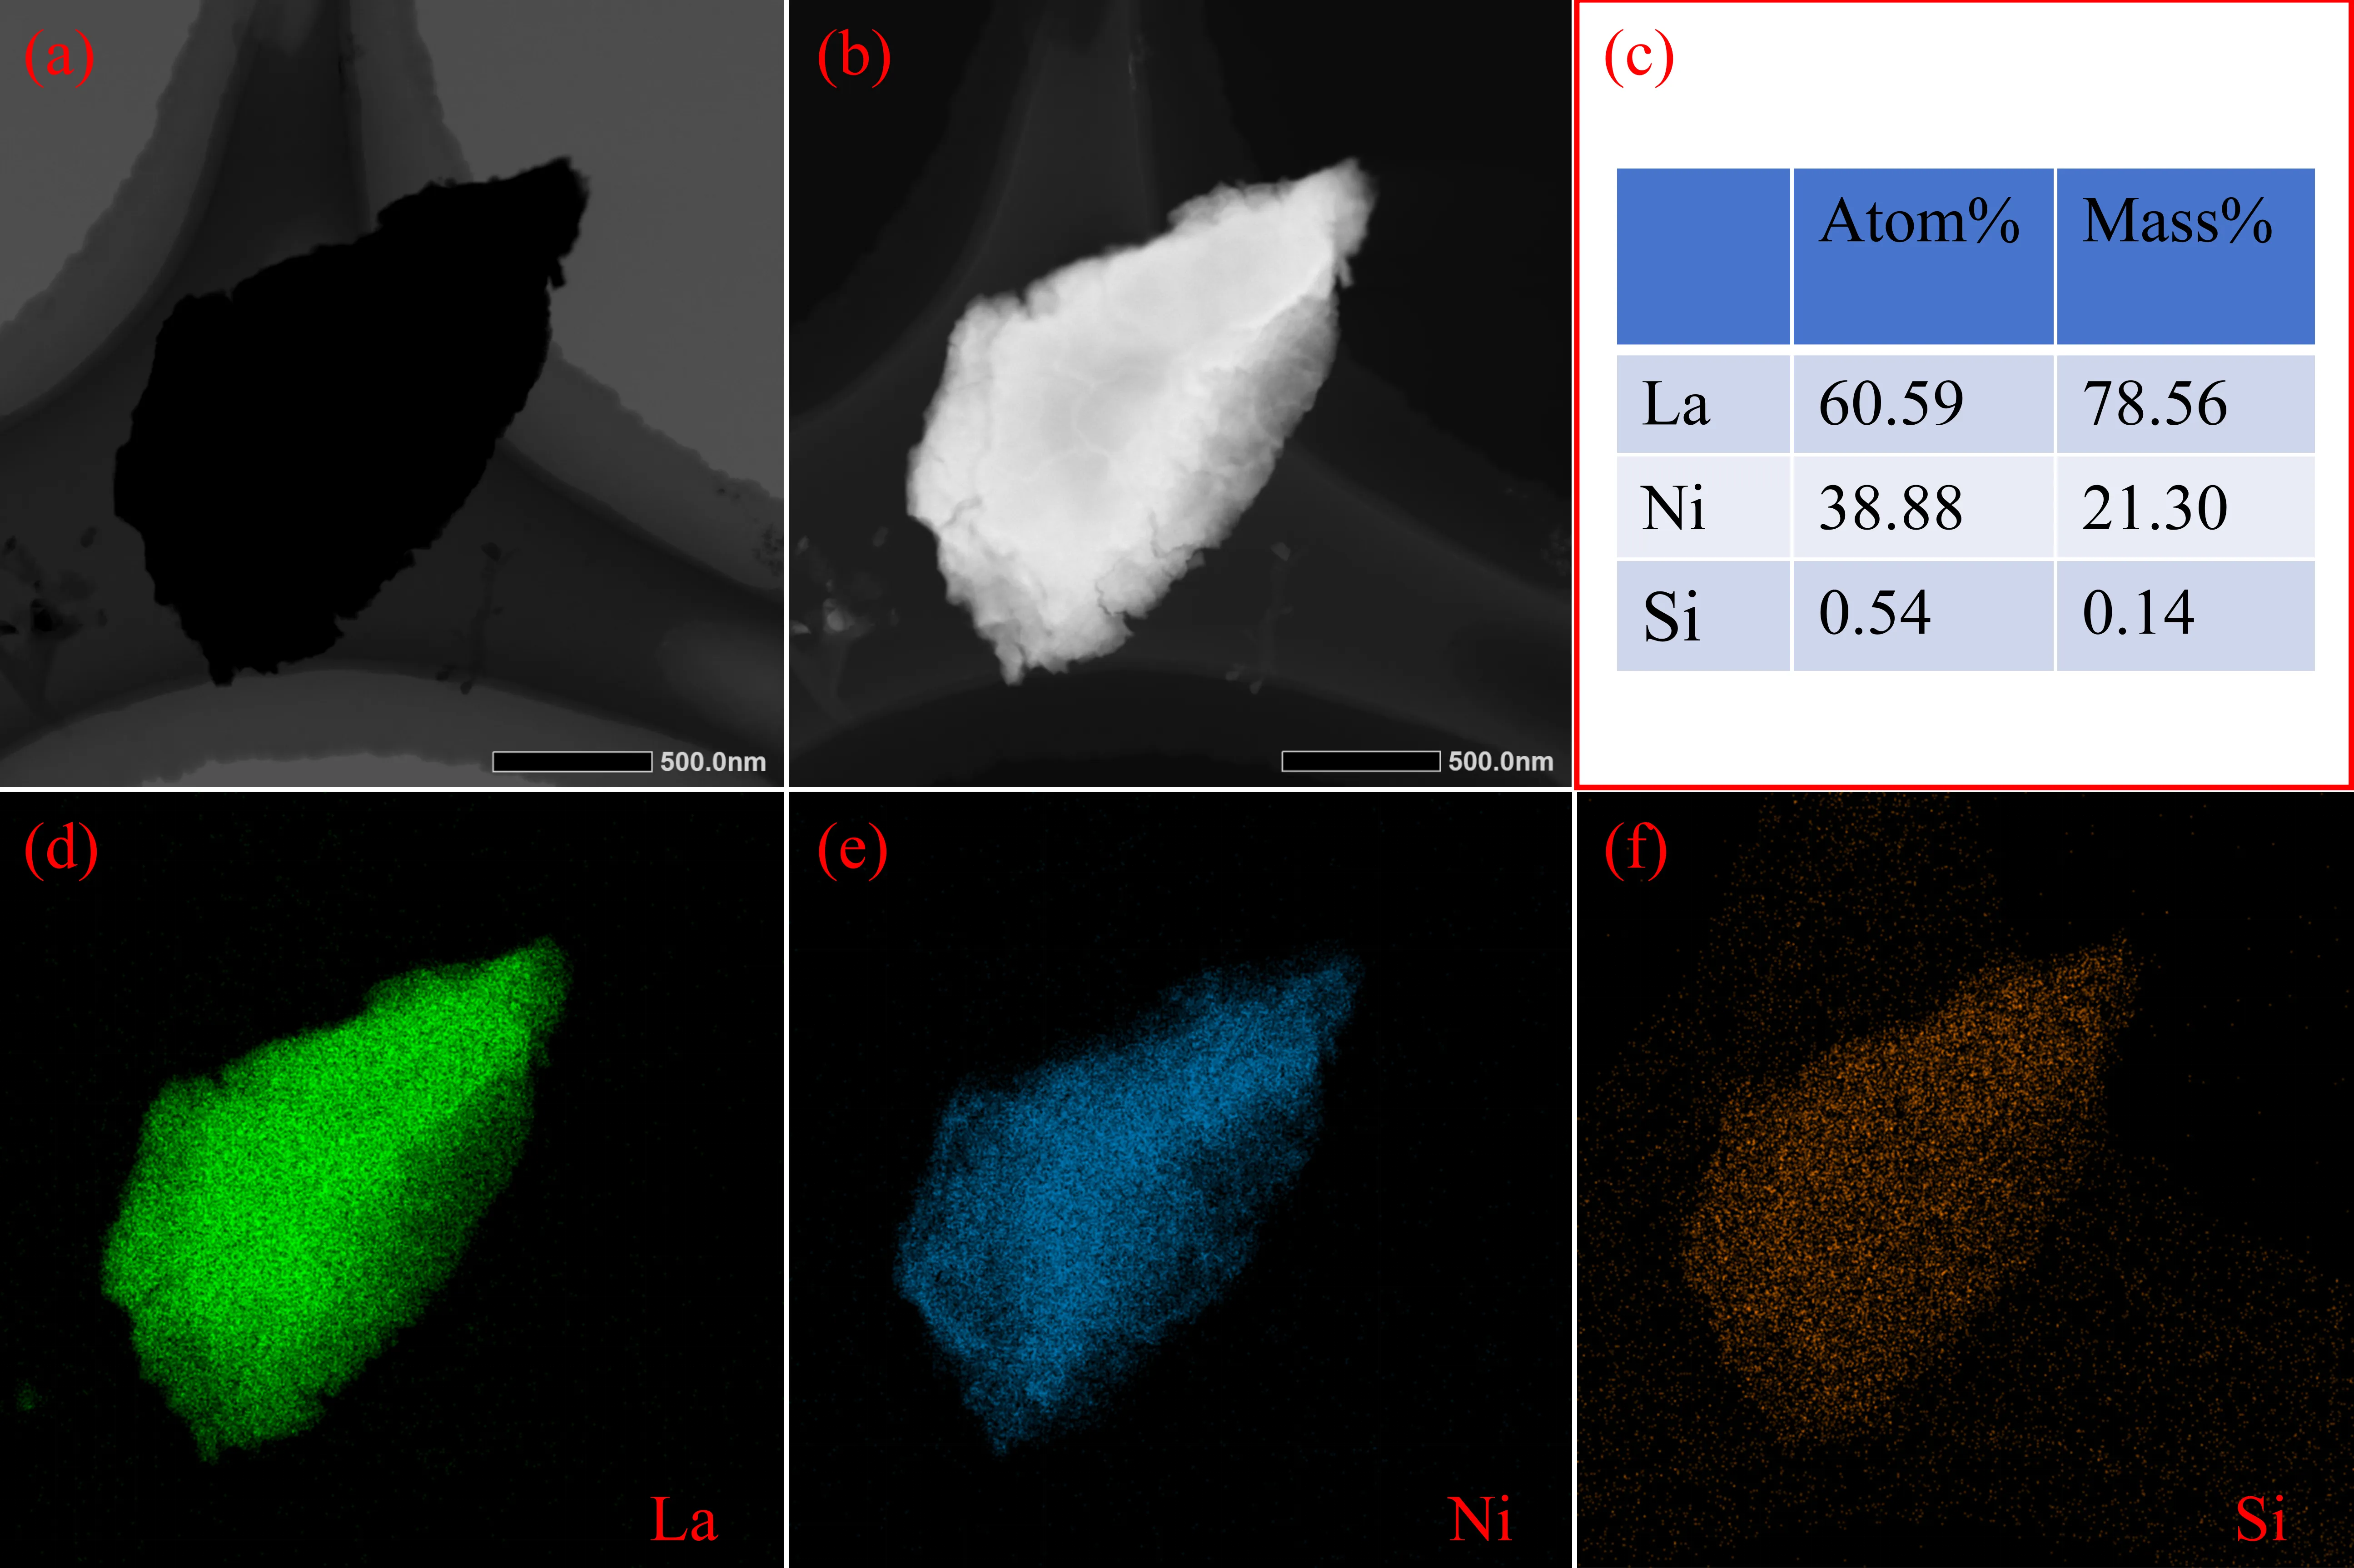
. STEM image and elemental mappings of La, Ni and Si. (<strong>a</strong>) BF image. (<strong>b</strong>) DF image. (<strong>c</strong>) Element composition test results. (<strong>d</strong>) elemental mapping of La. (<strong>e</strong>) elemental mapping of Ni. (<strong>f</strong>) elemental mapping of Si.
3.3.2. Construction of Structure Models for Intergrowth LaNi Phase, La
3Ni
3Si
2 Phase and La
2NiSi Phase in Real Space
According to the preceding section, it was observed that LaNi, La
3Ni
3Si
2, and La
2NiSi are three coexisting phases based on SXRD testing. However, the precise orientation of these three coexisting phases in real space remains unknown. This section aims to establish the orientation model of real space by utilizing the orientation matrices of the LaNi phase, La
3Ni
3Si
2, and La
2NiSi phase in reciprocal space. Refer to Appendix A for the detailed method of constructing the orientation model of these three coexisting phases in real space. In a diffraction experiment, the orientation matrix describes the orientation of the single crystal in space. The matrix relates the reciprocal axes of the crystal with the Cartesian coordinate system of the diffractometer. The orientation matrix of the three coexisting phases in reciprocal space is initially determined using APEX3 software. Subsequently, the orientation matrix of the three coexisting phases in real space is derived by establishing the fundamental correspondence between reciprocal space and real space. The orientation model of the interface of the three coexisting phases in real space is then deduced based on the orientation matrix of the three coexisting phases in real space. In
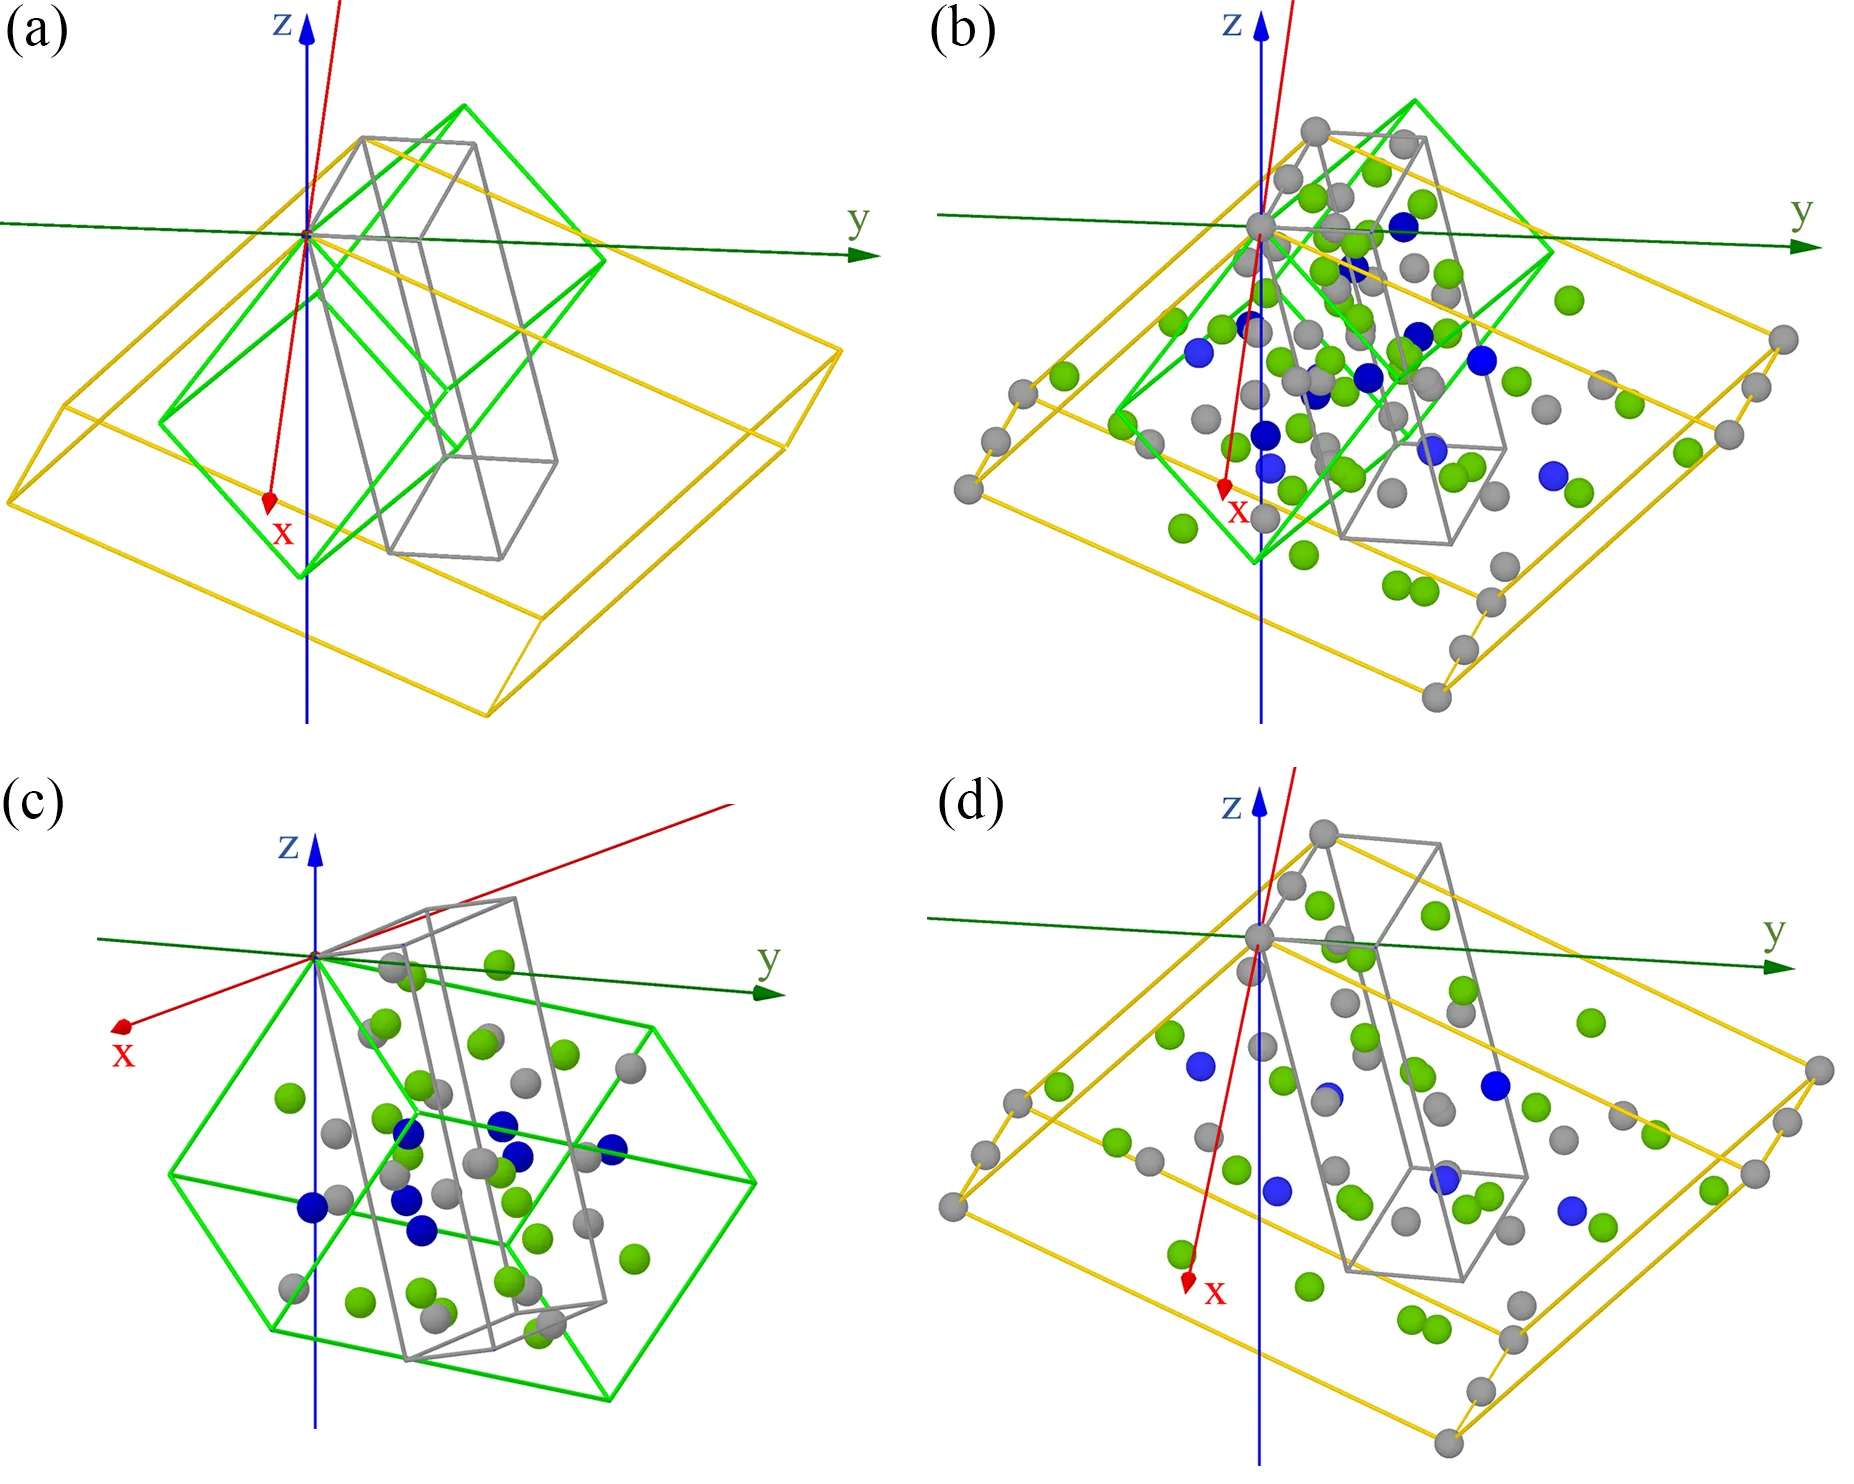
a, the gray, green, and yellow frames correspond to the LaNi, La
3Ni
3Si
2, and La
2NiSi phases, respectively. Finally, the ultimate orientation model depicted in
b is achieved by introducing atoms to the interface of the three coexisting phase units.
c illustrates the orientation model of LaNi and La
3Ni
3Si
2 phases in real space, while
d displays the orientation model of LaNi and La
2NiSi phases in real space. Notably, it is evident from
d that the
c-axis of the LaNi phase aligns perfectly with that of the La
2NiSi phase.
. The orientation model of the single-cell border and the LaNi, La<sub>3</sub>Ni<sub>3</sub>Si<sub>2</sub>, and La<sub>2</sub>NiSi phases after adding atoms in real space is as follows: (<strong>a</strong>) single-cell border, (<strong>b</strong>) LaNi, La<sub>3</sub>Ni<sub>3</sub>Si<sub>2</sub>, and La<sub>2</sub>NiSi three coexisting phases, (<strong>c</strong>) LaNi and La<sub>3</sub>Ni<sub>3</sub>Si<sub>2</sub> two phases, (<strong>d</strong>) LaNi and La<sub>2</sub>NiSi two phases. (The green atoms are La atoms, the gray atoms are Ni atoms, and the blue atoms are Si atoms).
3.3.3. Interface between the LaNi Phase and the La
3Ni
3Si
2 Phases
In the previous section, we obtained oriented structural models for the LaNi, La
3Ni
3Si
2, and La
2NiSi phases. However, the orientation of the three coexisting phases interface and the arrangement of atoms within the interface remain ambiguous. In this section, we will focus on addressing these issues by studying the synthetic precession images of the SXRD dataset as shown in
and
.
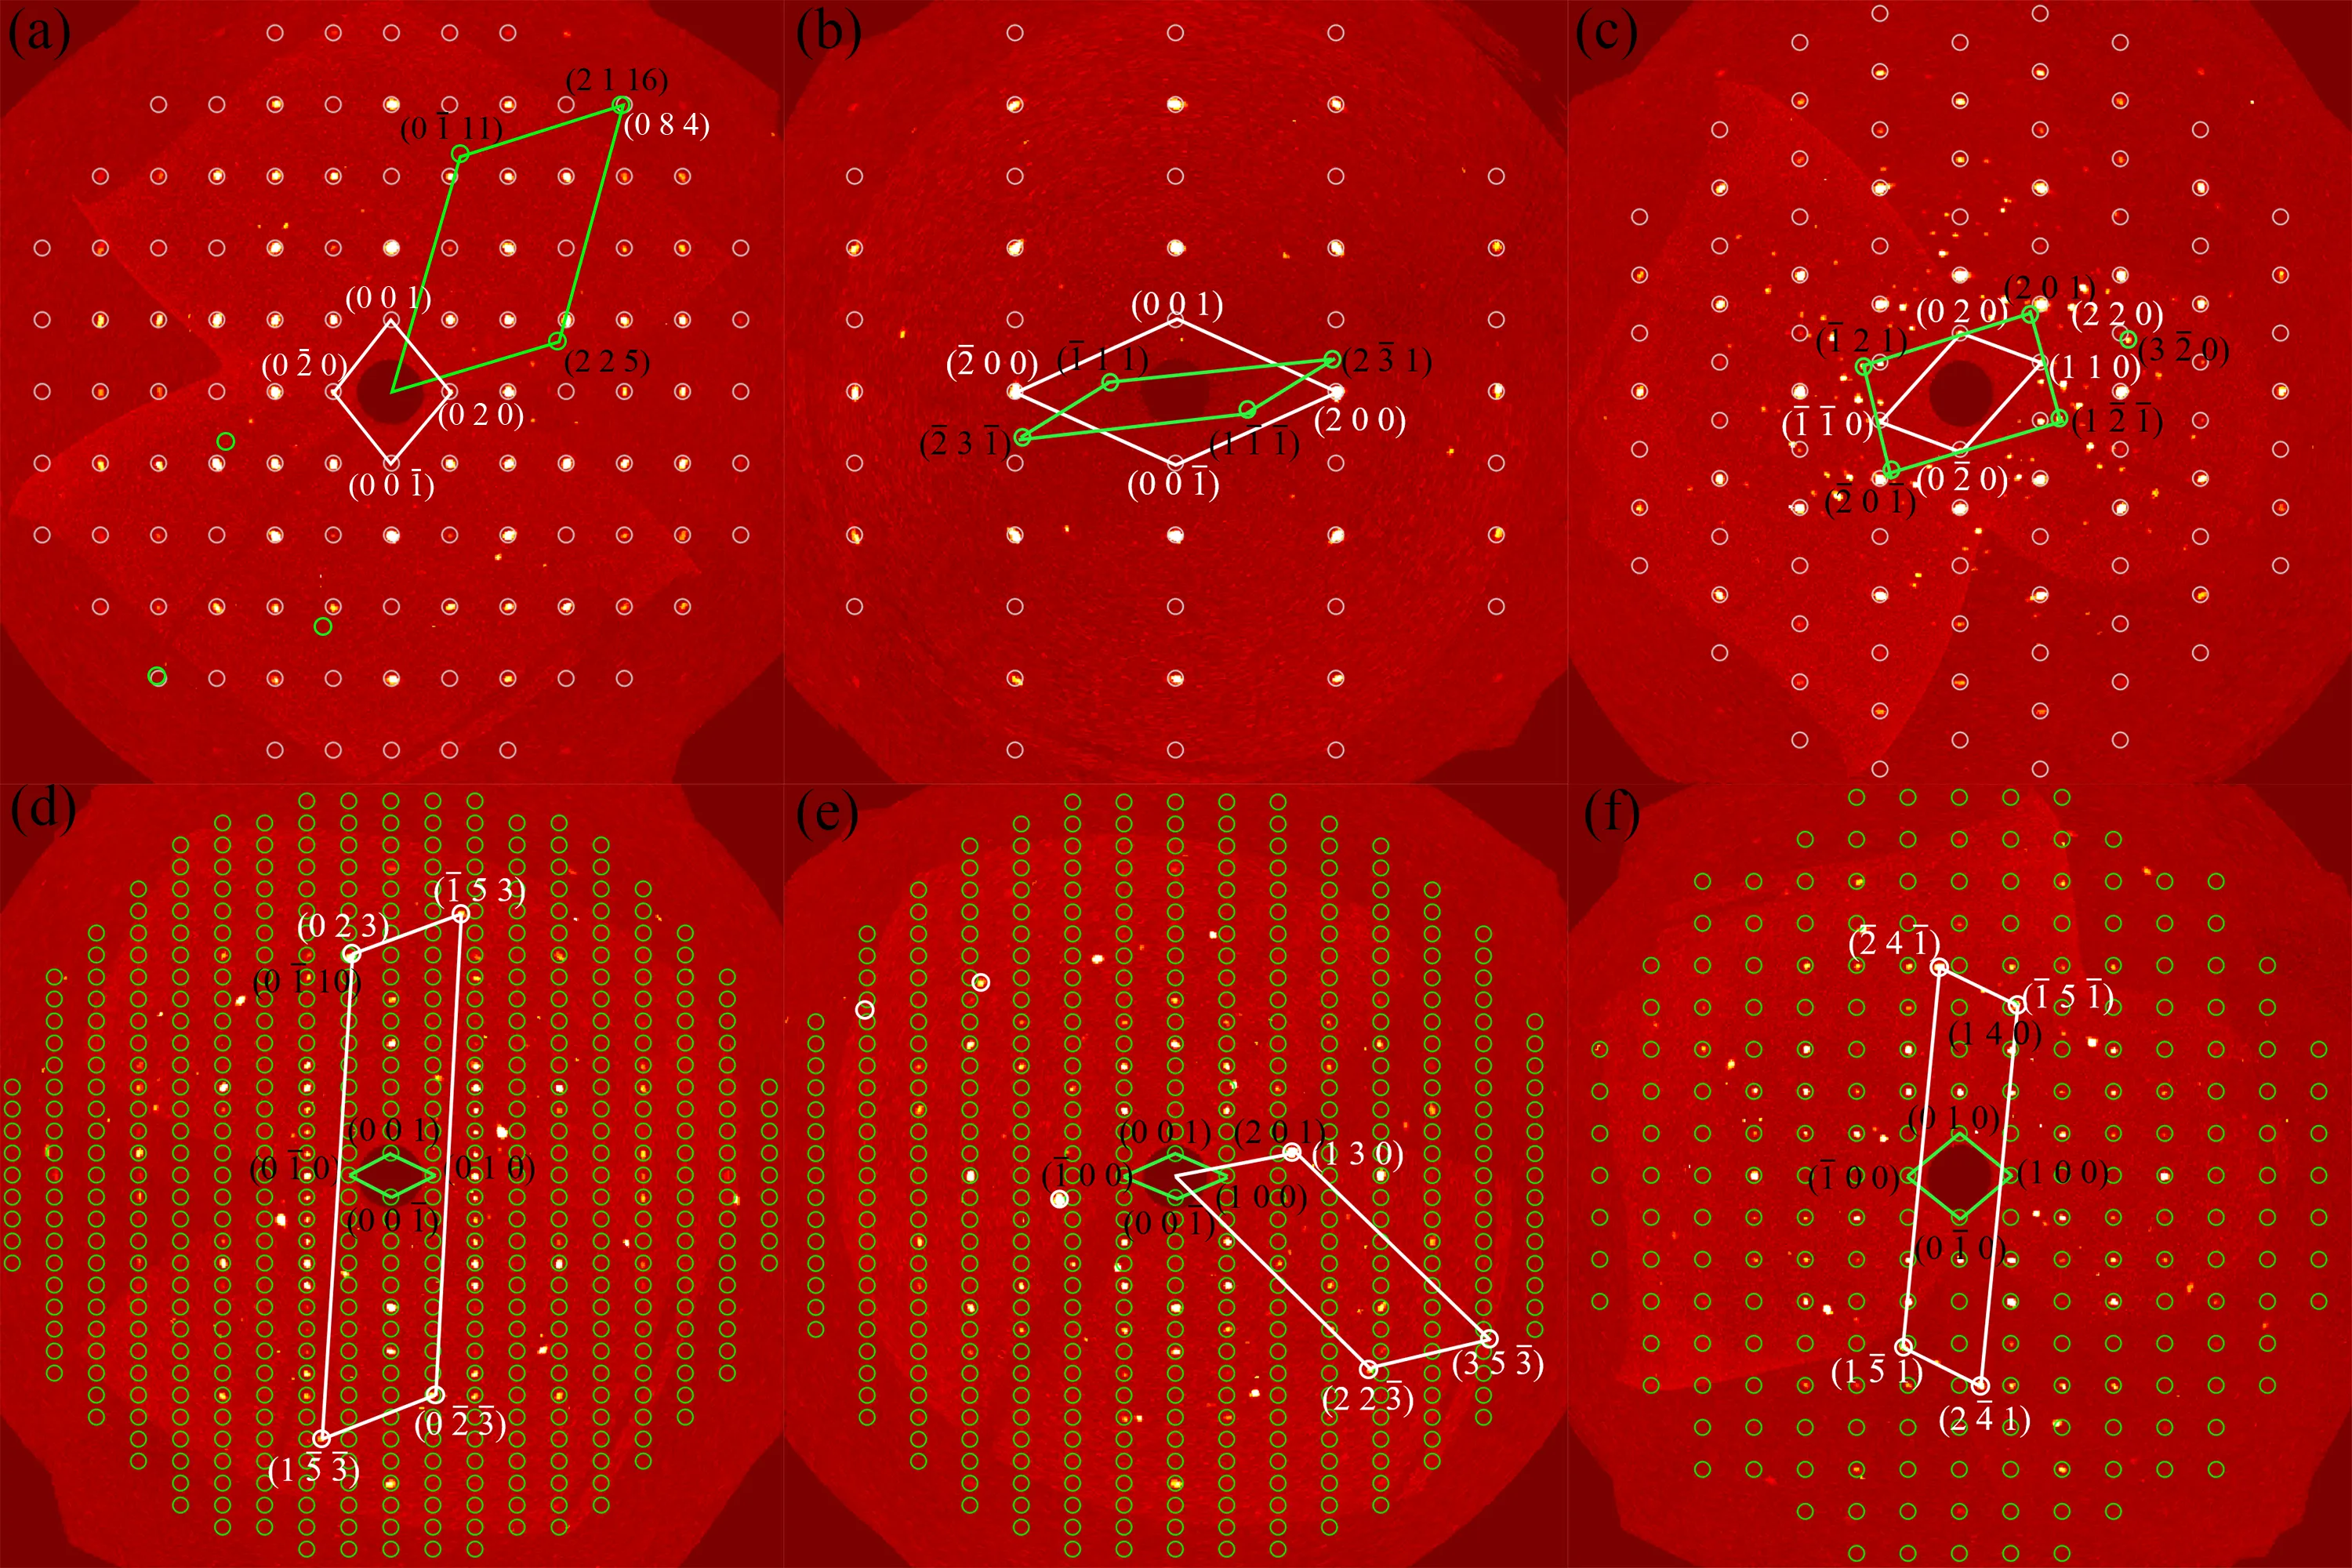
a, b and c represent the precession images of the (0
kl), (
h0
l) and (
hk0) planes from the LaNi phase while the
d, e and f represent the precession images of the (0
kl), (
h0
l) and (
hk0) planes from the La
3Ni
3Si
2 phase. In
a–c, the precession images are constructed with a thickness of 0.01 Å
−1 and a resolution of 0.80 Å. While in
d–f, the precession images are constructed with a thickness of 0.05 Å
−1 and a resolution of 0.80 Å. In
, the white and green circles represent the crystal planes of the LaNi and La
3Ni
3Si
2 phases, respectively.
directly shows the orientation relationship between the LaNi and La3Ni3Si2 phases represented by a pair of crystal planes. These diffraction points from the two phases overlap, mean that they represent crystal planes parallel to each other. In summary, five orientation relationships were obtained from
a, c, d, e and f, named OR1, OR2, OR3, OR4 and OR5, as shown in
.
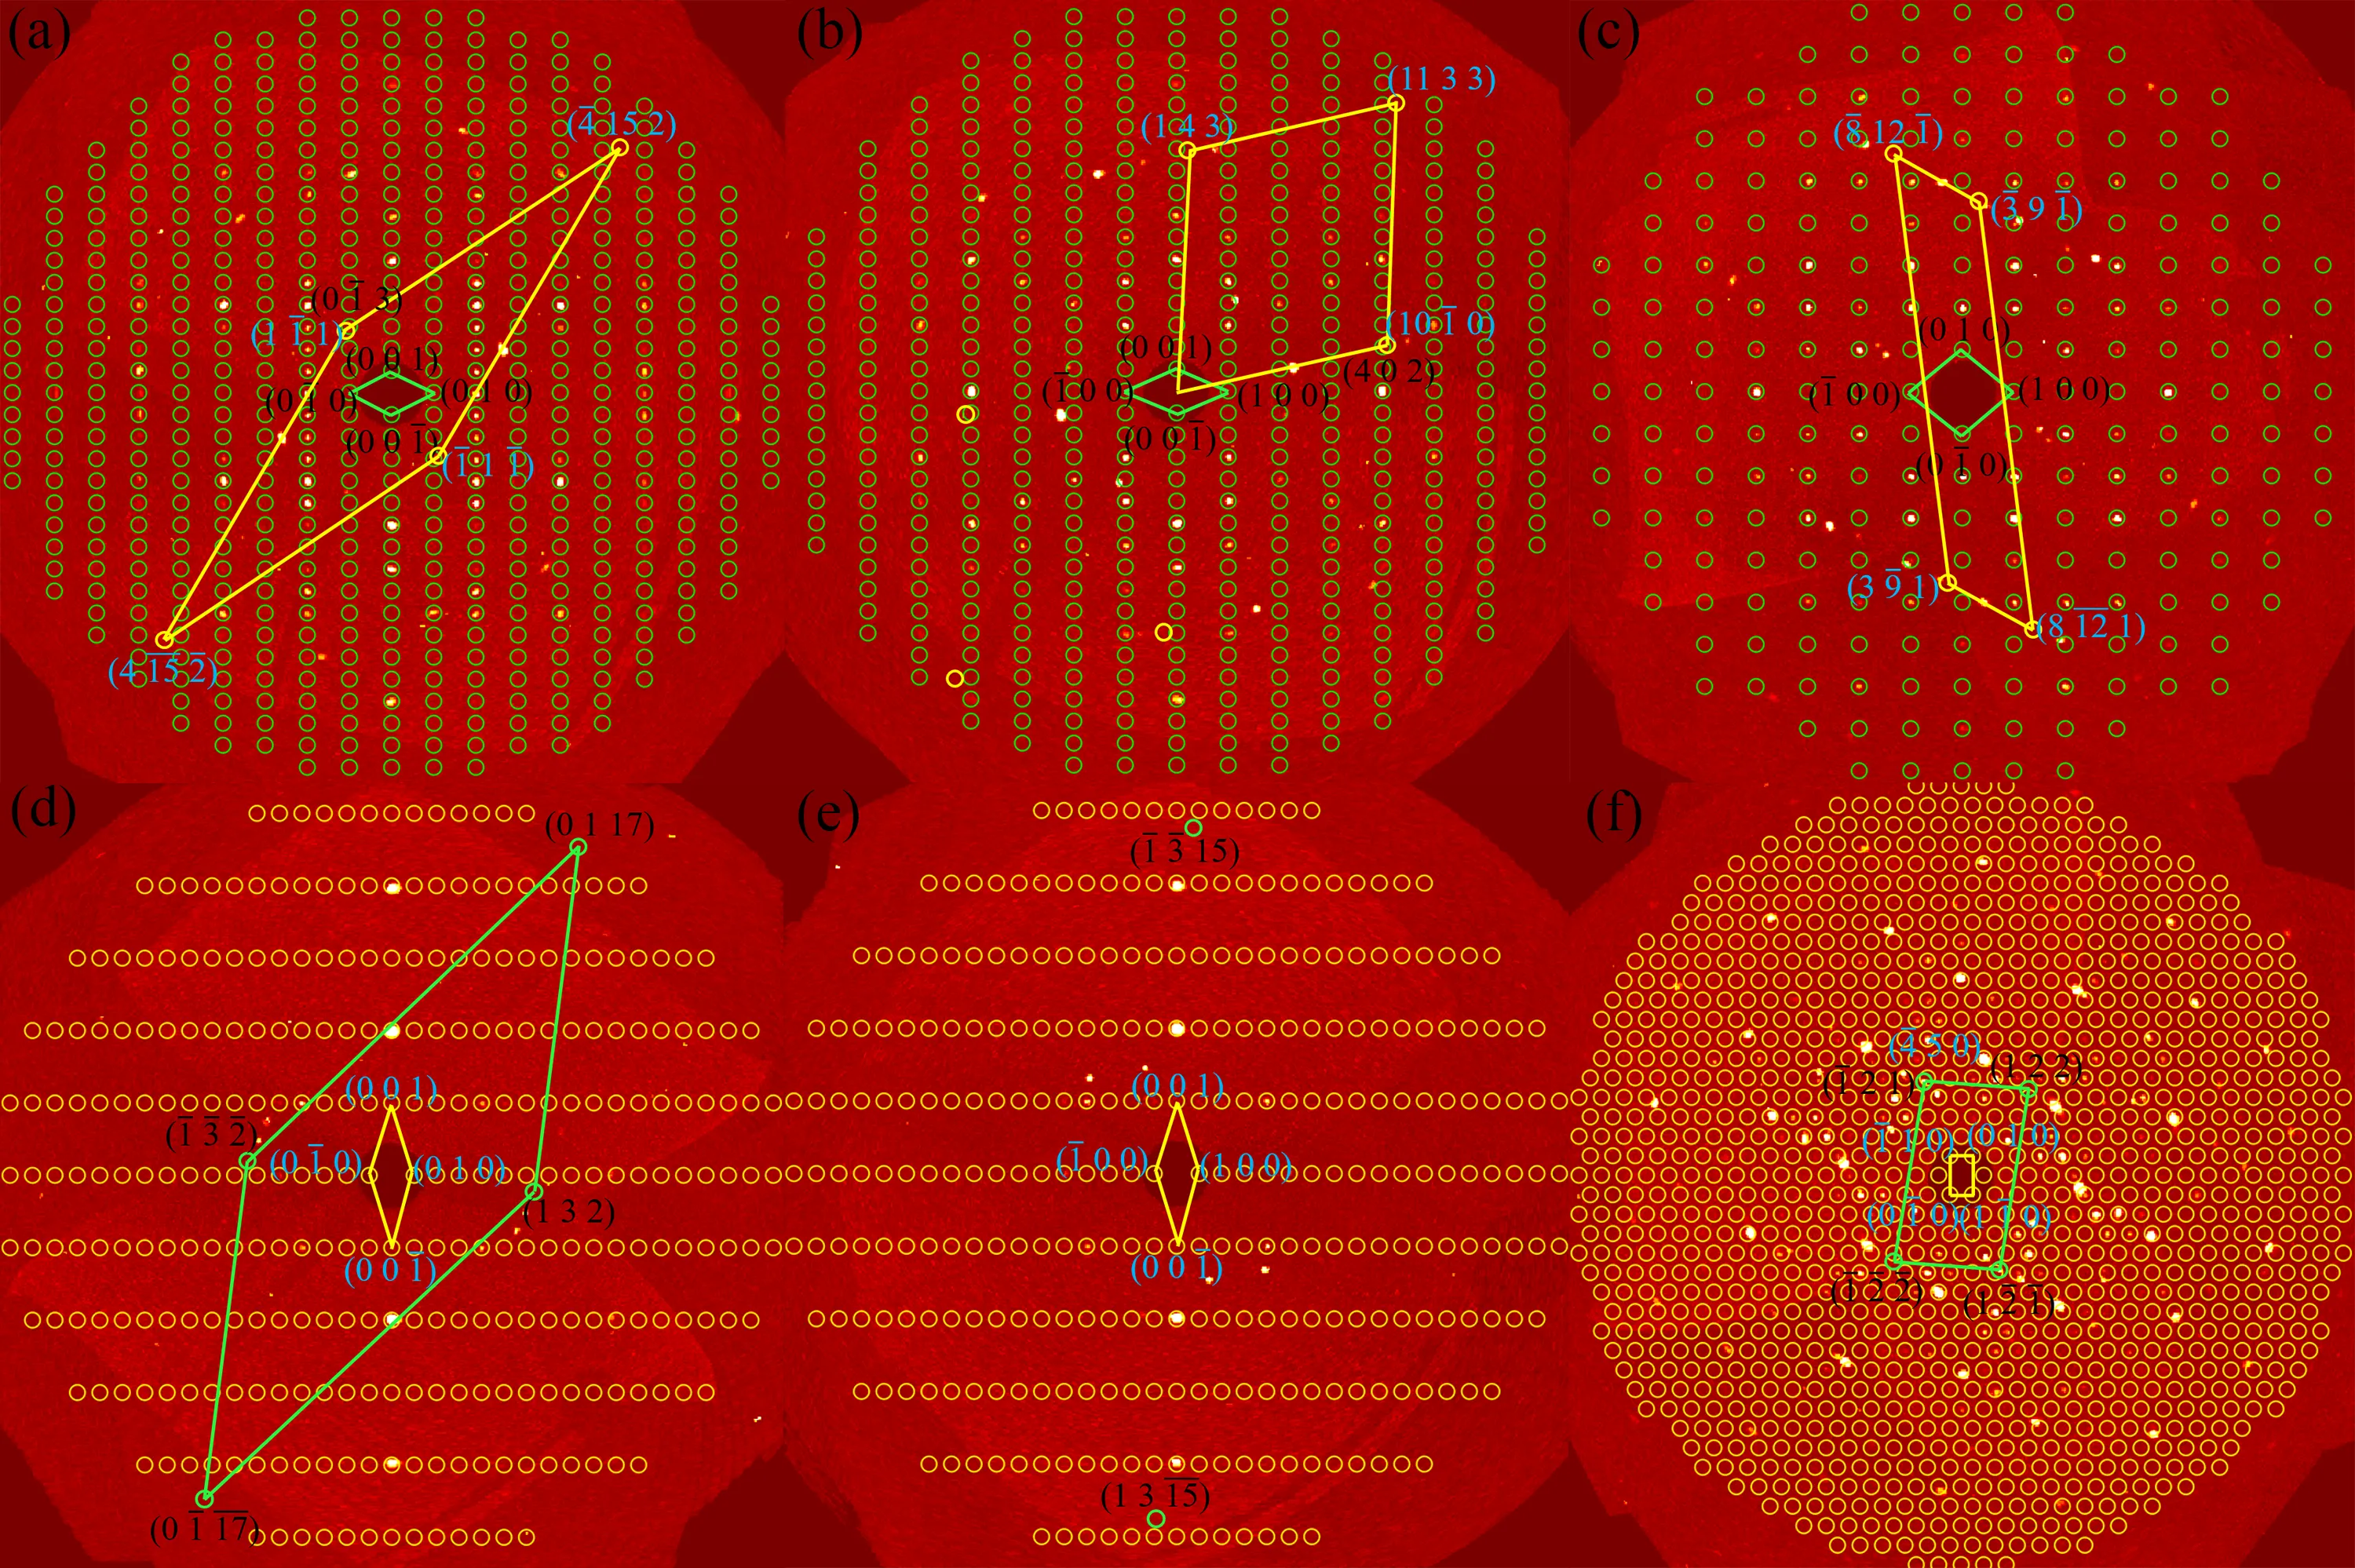
a, b and c represent precession images of the (0
kl), (
h0
l) and (
hk0) planes from the La
3Ni
3Si
2 phase, while
d, e and f represent precession images of the (0
kl), (
h0
l) and (
hk0) planes from the La
2NiSi phase. In
, the green and yellow circles represent the crystal planes of the La
3Ni
3Si
2 and La
2NiSi phases, respectively. The precession image has a thickness of 0.01Å
−1 and the resolution of 0.80 Å. From
a, b and f, three orientation relationships between La
3Ni
3Si
2 and La
2NiSi phases are obtained, named OR6, OR7 and OR8. These three orientation relationships are shown in
.
. The precession images of intergrowth crystals: (<strong>a</strong>) LaNi (0<em>kl</em>), (<strong>b</strong>) LaNi (<em>h</em>0<em>l</em>), (<strong>c</strong>) LaNi (<em>hk</em>0), (<strong>d</strong>) La<sub>3</sub>Ni<sub>3</sub>Si<sub>2</sub> (0<em>kl</em>), (<strong>e</strong>) La<sub>3</sub>Ni<sub>3</sub>Si<sub>2</sub> (<em>h</em>0<em>l</em>), (<strong>f</strong>) La<sub>3</sub>Ni<sub>3</sub>Si<sub>2</sub> (<em>hk</em>0).
. The precession images of intergrowth crystals: (<strong>a</strong>) La<sub>3</sub>Ni<sub>3</sub>Si<sub>2</sub> (0<em>kl</em>), (<strong>b</strong>) La<sub>3</sub>Ni<sub>3</sub>Si<sub>2</sub> (<em>h</em>0<em>l</em>), (<strong>c</strong>) La<sub>3</sub>Ni<sub>3</sub>Si<sub>2</sub> (<em>hk</em>0), (<strong>d</strong>) La<sub>2</sub>NiSi (0<em>kl</em>), (<strong>e</strong>) La<sub>2</sub>NiSi (<em>h</em>0<em>l</em>), (<strong>f</strong>) La<sub>2</sub>NiSi (<em>hk</em>0).
.
Five crystallographic orientation relationships at the interface of LaNi and La3Ni3Si2.
|
[uvw] LaNi//[uvw] La3Ni3Si2 |
(hkl) LaNi //(hkl) La3Ni3Si2 |
| OR1 |
[100] LaNi//[27$$\overset{-}{22} \overset{-}{2}$$] La3Ni3Si2 |
(084) LaNi//(2 1 16) La3Ni3Si2 |
| OR2 |
[001] LaNi//[23$$\overset{-}{4}$$] La3Ni3Si2 |
(220) LaNi//(3$$\overset{-}{2} 0$$) La3Ni3Si2 |
| OR3 |
[$$\overset{-}{9} \overset{-}{3}$$2] LaNi//[$$1$$00] La3Ni3Si2 |
(023) LaNi//(0$$\overset{-}{1}$$10) La3Ni3Si2 |
| OR4 |
[$$\overset{-}{9}$$3$$\overset{-}{4}$$] LaNi//[$$0$$10] La3Ni3Si2 |
(130) LaNi//(201) La3Ni3Si2 |
| OR5 |
[$$\overset{-}{1}$$16] LaNi//[$$0$$01] La3Ni3Si2 |
($$\overset{-}{1}$$5$$\overset{-}{1}$$) LaNi//(140) La3Ni3Si2 |
.
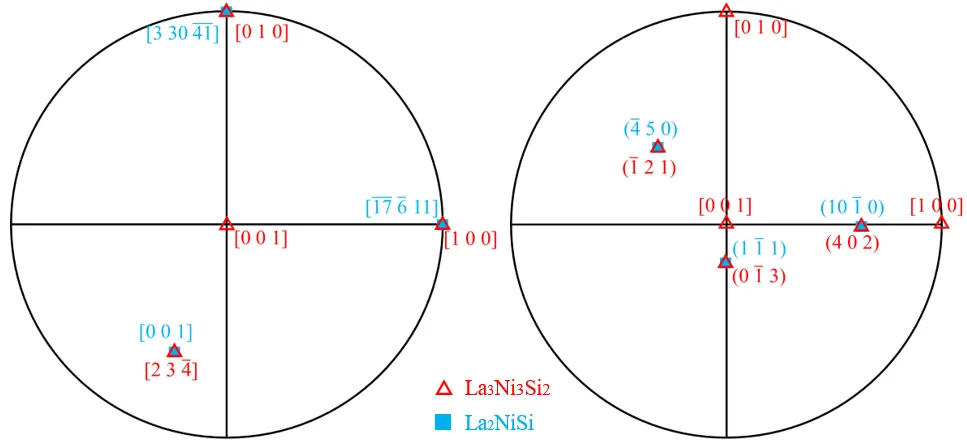
Three crystallographic orientation relationships at the interface of La3Ni3Si2 and La2NiSi.
|
[uvw] La3Ni3Si2//[uvw] La2NiSi |
(hkl) La3Ni3Si2//(hkl) La2NiSi |
| OR6 |
[100] La3Ni3Si2//[$$\overset{-}{17} \overset{-}{6}$$ 11] La2NiSi |
(0$$\overset{-}{1}$$3) La3Ni3Si2//(1$$\overset{-}{1}$$1) La2NiSi |
| OR7 |
[010] La3Ni3Si2//[3 30$$\overset{-}{41}$$] La2NiSi |
(402) La3Ni3Si2//(10$$\overset{-}{1}$$0) La2NiSi |
| OR8 |
[23$$\overset{-}{4}$$] La3Ni3Si2//[$$0$$01] La2NiSi |
($$\overset{-}{1}$$21) La3Ni3Si2//($$\overset{-}{4}$$50) La2NiSi |
In order to more intuitively express the five orientation relationships listed in
and the three orientation relationships listed in
, they are represented by stereoscopic projection diagrams, as shown in
and
.
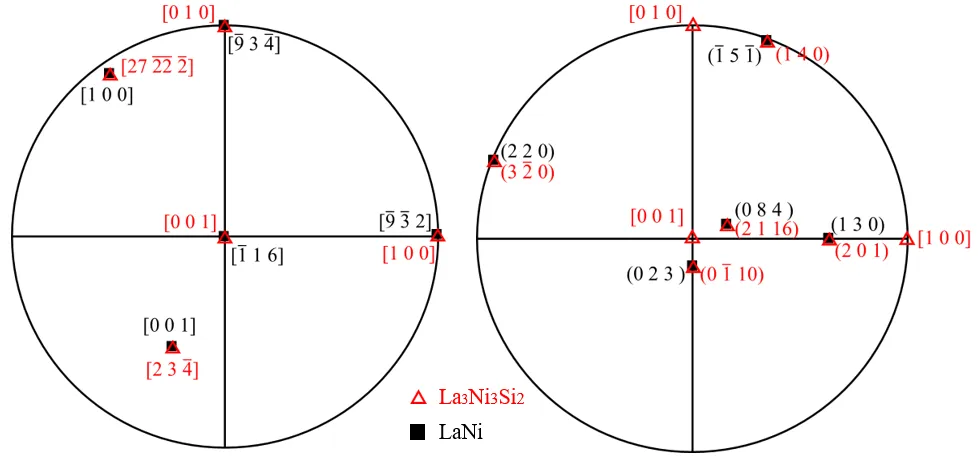
. Stereographic projection of the orientation relationships between LaNi and La<sub>3</sub>Ni<sub>3</sub>Si<sub>2</sub> based on the La<sub>3</sub>Ni<sub>3</sub>Si<sub>2</sub> phase: the orientation relationships between crystal directions (<strong>left</strong>), the orientation relationships between crystal planes (<strong>right</strong>).
. Stereographic projection of the orientation relationships between La<sub>3</sub>Ni<sub>3</sub>Si<sub>2</sub> and La<sub>2</sub>NiSi based on the La<sub>3</sub>Ni<sub>3</sub>Si<sub>2</sub> phase: the orientation relationships between crystal directions (<strong>left</strong>), the orientation relationships between crystal planes (<strong>right</strong>).
As mentioned above,
identifies five crystal orientation relationships between the LaNi and La
3Ni
3Si
2 phases. Three crystal orientation relationships of the La
3Ni
3Si
2 phase and La
2NiSi phase can be determined from
. According to the symmetry principle of crystallography, a set of experimentally determined orientation relationships often has multiple variants. Therefore, it is necessary to determine whether the eight crystal orientation relationships observed in this experiment are equivalent. Next, we use the matrix method to analyze and discuss the experimental results. The matrix method is used to determine the conversion relationship between the crystal plane index and the crystal direction index between two phases mathematically. This involves finding the transformation matrices B and A for each type of orientation relation. If the absolute values of the nine elements in the transformation matrix are the same, it indicates that the orientation relation of the two phases belongs to the same type, even if the positive/negative signs, arrangement order, and position are different. A detailed description of the matrix approach can be found in our group’s previous research [
51]. This method obtained the transformation matrix for the eight orientation relations. They are presented in
and
below.
shows the conversion matrix for the five crystal orientation relationships between the LaNi and La
3Ni
3Si
2 phases, while
displays the conversion matrix for the three crystal orientation relationships between the La
3Ni
3Si
2 and La
2NiSi phases. Where matrix A represents the conversion matrix between crystal planes, and matrix B represents the conversion matrix between crystal directions. It can be determined that there are eight independent orientation relationships because the elements in the transformation matrix corresponding to the eight orientation relationships have different absolute values.
.
Orientation relationships and corresponding conversion matrixes between LaNi and La3Ni3Si2 interfaces.
|
Orientation Relationship |
Conversion Matrix B |
Conversion Matrix A |
| OR1 |
(084) LaNi//(2 1 16) La3Ni3Si2
[100] LaNi//[27 $$\overset{-}{22}$$ $$\overset{-}{2}$$] La3Ni3Si2
|
$$\begin{pmatrix} + 1 . 08 & - 1 . 32 & - 0 . 44 \\ + 0 . 38 & + 0 . 42 & + 0 . 51 \\ - 0 . 27 & - 0 . 60 & + 2 . 96 \end{pmatrix}$$ |
$$\begin{pmatrix} + 0 . 45 & - 0 . 37 & - 0 . 03 \\ + 1 . 21 & + 0 . 90 & + 0 . 29 \\ - 0 . 14 & - 0 . 21 & + 0 . 28 \end{pmatrix}$$ |
| OR2 |
(220) LaNi//(3$$\overset{-}{2} 0$$) La3Ni3Si2
[001] LaNi //[23$$\overset{-}{4}$$] La3Ni3Si2
|
$$\begin{pmatrix} + 0 . 17 & - 1 . 05 & + 0 . 07 \\ + 0 . 19 & - 0 . 2 2 & - 0 . 07 \\ + 0 . 84 & + 1 . 87 & - 9 . 12 \end{pmatrix}$$ |
$$\begin{pmatrix} + 1 . 11 & + 0 . 87 & + 0 . 28 \\ - 4 . 93 & - 8 . 18 & - 2 . 13 \\ + 0 . 0 5 & + 0 . 07 & - 0 . 09 \end{pmatrix}$$ |
| OR3 |
(023) LaNi//(0$$\overset{-}{1}$$10) La3Ni3Si2
[$$\overset{-}{9} \overset{-}{3}$$2] LaNi//[100] La3Ni3Si2
|
$$\begin{pmatrix} - 1 . 37 & + 1 . 90 & + 0 . 69 \\ - 0 . 46 & - 0 . 71 & - 0 . 11 \\ + 0 . 31 & + 0 . 33 & + 1 . 5 1 \end{pmatrix}$$ |
$$\begin{pmatrix} - 0 . 38 & + 0 . 2 4 & + 0 . 02 \\ - 0 . 97 & - 0 . 84 & + 0 . 38 \\ + 0 . 11 & - 0 . 17 & + 0 . 68 \end{pmatrix}$$ |
| OR4 |
(130) LaNi//(201) La3Ni3Si2
[$$\overset{-}{9}$$3$$\overset{-}{4}$$] LaNi//[$$0$$10] La3Ni3Si2
|
$$\begin{pmatrix} + 1 . 10 & - 2 . 51 & + 0 . 15 \\ + 0 . 43 & + 0 . 84 & + 0 . 35 \\ - 0 . 01 & - 1 . 12 & + 1 . 30 \end{pmatrix}$$ |
$$\begin{pmatrix} + 0 . 50 & - 0 . 19 & - 0 . 16 \\ + 1 . 04 & + 0 . 48 & + 0 . 42 \\ - 0 . 33 & - 0 . 11 & + 0 . 68 \end{pmatrix}$$ |
| OR5 |
($$\overset{-}{1}$$5$$\overset{-}{1}$$) LaNi//(140) La3Ni3Si2
[$$\overset{-}{1}$$16] LaNi//[$$0$$01] La3Ni3Si2
|
$$\begin{pmatrix} + 1 . 28 & - 2 . 07 & - 0 . 21 \\ + 0 . 55 & + 0 . 84 & + 0 . 21 \\ - 0 . 38 & - 1 . 12 & + 1 . 27 \end{pmatrix}$$ |
$$\begin{pmatrix} + 0 . 39 & - 0 . 23 & - 0 . 09 \\ + 0 . 86 & + 0 . 46 & + 0 . 67 \\ - 0 . 08 & - 0 . 12 & + 0 . 66 \end{pmatrix}$$ |
Table 12.
Orientation relationships and corresponding conversion matrixes between La3Ni3Si2 and La2NiSi interfaces
|
Orientation Relationship |
Conversion Matrix B |
Conversion Matrix A |
| OR6 |
(0$$\overset{-}{1}$$3) La3Ni3Si2//(1$$\overset{-}{1}$$1) La2NiSi
[100] La3Ni3Si2//[$$\overset{-}{17}\, \overset{-}{6}$$ 11] La2NiSi
|
$$\begin{pmatrix} - 2 . 02 & + 0 . 36 & + 0 . 11 \\ + 0 . 14 & - 1 . 76 & - 0 . 74 \\ + 0 . 73 & - 1 . 27 & + 0 . 44 \end{pmatrix}$$ |
$$\begin{pmatrix} - 0 . 51 & - 0 . 18 & + 0 . 33 \\ - 0 . 09 & - 0 . 29 & - 0 . 68 \\ + 0 . 0 2 & - 0 . 44 & + 1 . 03 \end{pmatrix}$$ |
| OR7 |
(402) La3Ni3Si2//(10$$\overset{-}{1}$$0) La2NiSi
[010] La3Ni3Si2//[3 30 $$\overset{-}{41}$$] La2NiSi
|
$$\begin{pmatrix} + 2 . 43 & - 0 . 68 & - 0 . 32 \\ - 0 . 45 & + 1 . 07 & - 0 . 11 \\ - 0 . 18 & + 0 . 89 & + 0 . 64 \end{pmatrix}$$ |
$$\begin{pmatrix} + 0 . 44 & + 0 . 17 & - 0 . 12 \\ + 0 . 09 & + 0 . 85 & - 1 . 17 \\ + 0 . 24 & + 0 . 24 & + 1 . 30 \end{pmatrix}$$ |
| OR8 |
($$\overset{-}{1}$$21) La3Ni3Si2//($$\overset{-}{4}$$50) La2NiSi
[23$$\overset{-}{4}$$] La3Ni3Si2//[$$0$$01] La2NiSi
|
$$\begin{pmatrix} - 0 . 78 & - 1 . 82 & + 0 . 30 \\ - 1 . 75 & + 1 . 04 & + 0 . 45 \\ - 0 . 43 & - 0 . 05 & - 0 . 60 \end{pmatrix}$$ |
$$\begin{pmatrix} - 0 . 22 & - 0 . 43 & + 0 . 13 \\ - 0 . 38 & + 0 . 21 & + 0 . 29 \\ - 0 . 39 & - 0 . 06 & - 1 . 40 \end{pmatrix}$$ |
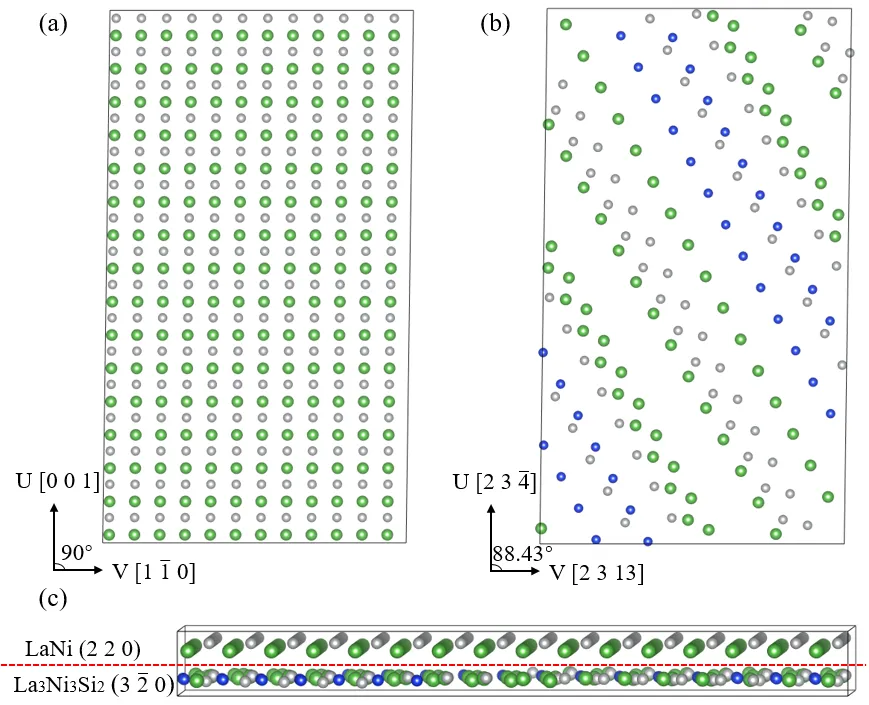
Furthermore, a preliminary interface model of these interface relationships was established. Take OR1 orientation relationship: [001]
LaNi //[23$$\overset{-}{4}$$]
La3Ni3Si2, (220)
LaNi//(3$$\overset{-}{2} 0$$)
La3Ni3Si2 as an example. For the (220)
LaNi surface model, as shown in
a, the
u and
v directions are parallel to [001] and [1$$\overset{-}{1}$$0], respectively. At this time, the lattice parameters on the surface of (020)
LaNi are:
u = 4.383 Å,
v = 11.487 Å, and
θ = 90°. For the surface model of (3$$\overset{-}{2}$$0)
La3Ni3Si2, as shown in
b, the
u and
v directions are parallel to [23$$\overset{-}{4}$$] and [2 3 13], respectively. The lattice parameters on the surface of (3$$\overset{-}{2}$$0)
La3Ni3Si2 are as follows:
u = 51.304 Å,
v = 90.926 Å,
θ = 88.43°. Considering the significant mismatch between the surfaces of (220) LaNi and (3$$\overset{-}{2} 0$$) La
3Ni
3Si
2, it is essential to construct a supercell interface model to minimize the disparity. It was observed that utilizing the 12(
u) × 8(
v) (220) LaNi interface and the 1(
u) × 1(
v) La
3Ni
3Si
2 interface led to relatively minor mismatches, with δ(
u) = 2.52% and δ(
v) = 1.07% discrepancies in the
u and
v directions, respectively.
c displays the atomic interface model of LaNi(220)/ La
3Ni
3Si
2(3$$\overset{-}{2} 0$$).
. (<strong>a</strong>): (220) surface of the LaNi phase; (<strong>b</strong>): (3$$\overset{-}{2}$$0) surface of the La<sub>3</sub>Ni<sub>3</sub>Si<sub>2</sub> phase; (<strong>c</strong>): the atomic interface model of LaNi(220)/ La<sub>3</sub>Ni<sub>3</sub>Si<sub>2</sub>(3$$\overset{-}{2} 0$$) (The green atoms are La atoms, the gray atoms are Ni atoms, and the blue atoms are Si atoms).
We conducted SXRD tests on La-Ni alloys obtained through three different treatment methods in this experiment. Firstly, the La3Ni2 samples produced by the melting method consist of La7Ni3 and LaNi phases. The space group corresponding to La7Ni3 is P63mc, with the following cell parameters: a = b = 10.0995(18) Å, c = 6.4490(16) Å, α = β = 90°, γ = 120°. Topological analysis demonstrates that the La7Ni3 phase consists of La1(1)(1@15) type clusters, with the La1 atom serving as the central atom. The corresponding space group for LaNi is Cmcm, and its cell parameters are as follows: a = 3.9014(4) Å, b = 10.7782(12) Å, c = 4.3854(5) Å, α = β = γ = 90°. Topological analysis demonstrates that the LaNi phase consists of La1(1)(1@15) type clusters, with the La1 atom serving as the central atom.
Secondly, the phase composition of the La3Ni2 sample, after coating with a tantalum sheet and subsequent heat treatment, primarily consists of the LaNi5 phase. The corresponding space group is P6/mmm, and the cell parameters are as follows: a = b = 5.0149(12) Å, c = 3.9751(5) Å, α = β = 90°, γ = 120°. The crystal structure can be described as composed of La1(1)(1@18) type clusters, with the La1 atom serving as the central atom.
Finally, the phase composition of the La3Ni2 sample after vacuum-sealed tube heat treatment consists of LaNi, La3Ni3Si2, and La2NiSi phases, which coexist in three distinct phases. Among these, the space group corresponding to LaNi is Cmcm, with the following cell parameters: a = 3.9213(5) Å, b = 10.7970(13) Å, c = 4.3833(6) Å, α = β = γ = 90°. The corresponding space group for La3Ni3Si2 is Pnma, with cell parameters of a = 7.435(5) Å, b = 14.227(13) Å, c = 6.069(6) Å, α = β = γ = 90°. The crystal structure can be described as composed of La2(1)(1@17) type clusters, with the La2 atom at the center. Due to the limited and weak number of diffraction points, the crystal structure of the La2NiSi phase cannot be refined. However, the cell parameters of the La2NiSi phase, after indexing, are known to be a = b = 16.18 Å, c = 4.35 Å, α = β = 90°, and γ = 120°. Furthermore, the synthetic precession images of the SXRD data set were studied to obtain the orientation relationship of the three coexisting phases interface. By analyzing the (0kl), (h0l), and (hk0) planes of the three coexisting phases, eight independent orientation relationships were obtained for OR1, OR2, OR3, OR4, OR5, OR6, OR7, and OR8, respectively. Taking OR2 as an example, the preliminary interface model illustrates the arrangement of atoms within the interface.
This study analyzed the phase composition of La-Ni alloys under various treatment methods, which plays an important role in the future study of the La-Ni and La-Ni-Si systems.
The authors express gratitude to the Fund of National Natural Science Foundation of China (grant No. 52173231; grant No. 51925105), Hebei Natural Science Foundation (grant No. E2022203182; grant No. E2020203158), Project of Hebei Provincial Department of Human Resources and Social Security (grant No. E2020100006), The Innovation Ability Promotion Project of Hebei supported by Hebei Key Lab for Optimizing Metal Product Technology and Performance (grant No. 22567609H) for providing financial support for this study.
Conceptualization, C.F., B.W. and L.Z.; methodology, Y.L. and C.F.; investigation, Y.L., T.R., Z.X. and Y.W., C.F.; writing—original draft preparation, Y.L. and T.R.; writing—review and editing, Z.X., Y.W., C.F., B.W. and L.Z.; supervision, C.F., B.W. and L.Z.; funding acquisition, C.F., B.W. and Z.X. All authors have read and agreed to the published version of the manuscript.
Not applicable.
Not applicable.
Data will be made available on request.
This research was funded by National Natural Science Foundation of China (grant No. 52173231; grant No. 51925105), Hebei Natural Science Foundation (grant No. E2022203182; grant No. E2020203158), Project of Hebei Provincial Department of Human Resources and Social Security (grant No. E2020100006), and The Innovation Ability Promotion Project of Hebei supported by Hebei Key Lab for Optimizing Metal Product Technology and Performance (grant No. 22567609H).
The authors declare that they have no known competing financial interests or personal relationships that could have appeared to influence the work reported in this paper.