In the past decade, a new exciting class of metal-free and carbon-rich photoluminescent (PL) nanomaterials, carbon dots (CDs), has been developed as a promising functional component in bioimaging, sensors, photocatalysts, and optoelectronic devices [
1,
2]. Various approaches have been developed to fabricate CDs, including “top-down” and “bottom-up” methods. Compared with top-down derived CDs [
3,
4,
5], the bottom-up derived CDs, which are mainly prepared through dehydration, condensation, polymerization and carbonization of organic precursors, exhibit distinctive advantages including high PL quantum yield (QY) [
6,
7], large-scale synthesis [
8], emission color tuning [
9,
10,
11], multi-element doping [
12,
13]. Citric acid has been one of the most frequently used precursors for synthesizing CDs through bottom-up carbonization routes due to the direct process and high PLQY [
14,
15]. Inspired by the citric acid methodology, other organic precursors with definite chemical structures are explored to synthesize multicolor CDs, such as phenylenediamines [
10], chloroform/diethylamine [
11], diaminobenzenesulfonic acid [
16], and trinitropyrene [
17]. Nevertheless, it is highly desirable and a great challenge to establish a new and extendable synthesis methodology for multicolor CDs covering the entire visible region, especially long wavelength light emission [
18,
19,
20,
21,
22,
23].
Another important issue is that, for most of the bottom-up CDs, a complete characterization of their structural and chemical properties is still lacking, making the possible PL origins debatable, which then lead to several hypotheses including sp
2 cluster [
24,
25,
26], surface state [
27,
28,
29,
30], charged nitrogen and molecular states [
31,
32]. Highly photoluminescent molecules have been frequently reported as the main PL origins in bottom-up pathways to CDs [
33,
34,
35]. For example, in citric acid derived CDs, the 2-pyridone compound has been separated and proved to be the sole PL origin [
36,
37]. These CDs are characterized as fluorophore dominating and lack a carbon lattice, exhibiting analogous PL properties as those carbogenic or graphene dots, including excitation dependent and large Stokes shift emission [
38,
39]. To explain the unique PL properties of amorphous CDs, the viewpoint of supramolecular aggregation is frequently proposed. For citric acid derived CDs, the molecular fluorophore is found to self-assemble into amorphous aggregates through hydrophobic interaction and π-π
* stacking [
40,
41]. By means of liquid chromatography-tandem mass spectrometry, citric acid derived CDs are disclosed to exist as supramolecular clusters with their individual monomer units linked together through noncovalent bonding forces [
42,
43,
44]. In analogy with dye aggregation, both J-type and H-type aggregates have also been suggested in citric-acid-based CDs [
45,
46,
47], and the exciton model is used to explain the large Stokes shift of CDs’ PL [
48]. The strong support of the idea of considering CDs as H-type aggregate emitters has been found in the results of experiments on single nanoparticles [
49,
50] and cryogenic studies [
51]. Meanwhile, weakly coupled H-aggregate looks like J-aggregate due to the exciton-lattice interaction, which was independently found in amorphous CDs by two groups. Compared with the collective explanation for the origin of PL in CDs, such as core and surface states, the viewpoint of supramolecular aggregation provides more definitive evidence for fundamental ambiguities regarding the photoluminescence of CDs, which should be adapted to a wider range of CDs materials, not limited to citric acid derived CDs. In CDs, phenomena like aggregation-induced emission (AIE) have been reported, specifically aggregation-induced fluorescence enhancement and aggregation-induced wavelength-redshifts. To a large degree, concentration-dependent PL reflects AIE in CDs. Many researchers have proposed that aggregation increases the conjugation degree of surface luminophores, leading to a decrease in band gap. Hence, emission wavelengths gradually red shift with increasing CDs concentration [
52]. Yang et al. synthesized hydrophobic N, S-doped CDs (H-CDs) via a one-pot solvothermal method using melamine (MA) and dithiosalicylic acid (DTSA)/acetic acid solution. The H-CDs display dual-switch mode luminescence between blue dissolved fluorescence and red AIE [
53]. Wang et al. used phloroglucinol and urea as sources, and by adjusting the reactant ratio and microwave power, prepared four typical CDs, emitting green (G-CD), yellow (Y-CD), orange (O-CD), and red fluorescence (R-CD) in a one-step microwave method [
54].
This work explored a new synthetic method using 1,3-dihydroxynaphthalene/2,3-dichloro-5,6-dicyano-
p-benzoquinone (DDQ) as precursors and ethanol-mediated solvothermal synthesis to produce amorphous carbon dots (CDs) with green fluorescence. Due to the low reaction temperature (mainly under 200 °C) and the presence of an oxidant, the diphenols are unlikely to experience carbonization to form CDs with a clear carbon lattice [
55], thus only supramolecular aggregates are generated. Through concentration- and temperature-dependent spectroscopy, strong H-type and weakly coupled H′-type aggregates were identified in the green CDs [
56]. Subsequently, the salt effect induced a transformation in the PL spectra and morphology between H-type and H′-type aggregates.
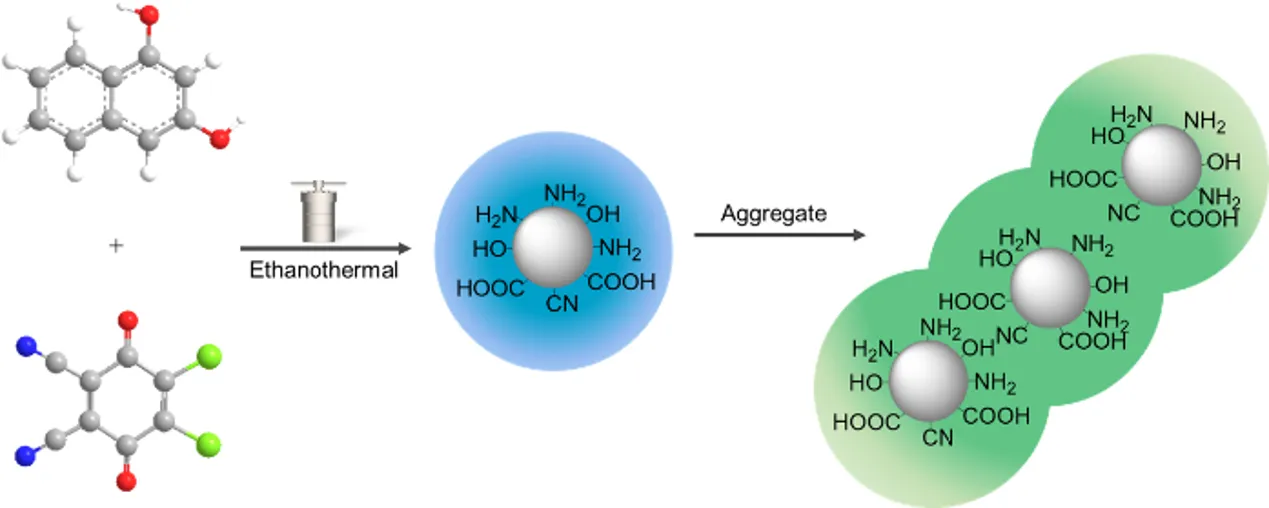
As illustrated in
Scheme 1, nitrogen-doped, green-fluorescent CDs bearing amino and hydroxyl surface groups were synthesized via an ethanol-mediated solvothermal method. The reaction employed 1,3-dihydroxynaphthalene as a rigid, π-conjugated aromatic carbon source and DDQ as a dual-function reagent, serving both as an oxidant (via its quinone moiety) and a nitrogen donor (via its cyano groups), in a molar ratio of 1:2.5. The formation process involves several key stages: (1) DDQ abstracts phenolic hydrogen atoms from 1,3-dihydroxynaphthalene, leading to its reduction to DDQH
2 and the formation of phenoxy radicals. This promotes π-π stacking and molecular aggregation through radical coupling and hydrogen bonding; (2) Under high-temperature ethanol conditions, the cyano groups of DDQ undergo nucleophilic addition, followed by rearrangement and hydrolysis to yield carboxyl or amide functionalities. Alternatively, alcoholysis may generate imine esters that subsequently hydrolyze into primary amides, contributing to nitrogen doping; (3) The resulting hydroxyl, carboxyl, and amino groups participate in dehydration-condensation reactions, forming a molecularly cross-linked network. (4) Progressive aromatization and partial carbonization result in the formation of supramolecular carbon dots, stabilized by noncovalent interactions rather than graphitized cores. When ethanol is used as the solvent, the final H-CD solution appears brown under white light and emits green fluorescence, consistent with the formation of emissive molecular aggregates.
Scheme 1. Schematic illustration of the ethanothermal synthesis of fluorescent CDs. Photographs on the right show the resulting CD solutions under white light (<strong>left</strong>) and 365 nm UV light (<strong>right</strong>), with ethanol as the solvent.
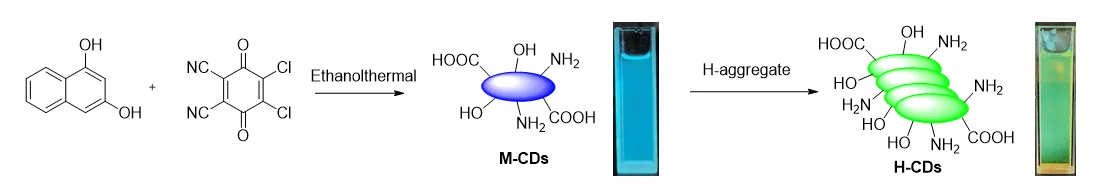
As shown in
a, TEM images reveal the presence of supramolecular nanodots alongside typical carbon nanodots. The concentration of the sample used for testing TEM is 10
−4 mg/mL, which can prevent aggregation. Size analysis from TEM indicates an average particle diameter of 17.8 nm with a standard deviation of 7.4 nm. AFM was employed for the first time to characterize the morphology of the CDs (
b). A methanol solution of CDs was drop-cast onto freshly cleaved mica and dried at room temperature, enabling self-assembly. Discrete nanostructures were observed across all samples, with minor variations in height and distribution. AFM height profiles (
c) indicate that individual carbon dots are typically 5–8 nm in height, generally smaller than 10 nm, while aggregates exceed 25 nm. These observations support the notion that the CDs exist as supramolecular aggregates or self-assembled nanostructures. The abundant surface functional groups likely promote extensive hydrogen bonding, contributing to the formation of amorphous, supramolecular aggregates.
. (<b>a</b>) Transmission electron microscopy (TEM) images of H-CDs. (<b>b</b>) AFM images of H-CDs with individual carbon dots and aggregates are indicated. (<b>c</b>) Height profiles corresponding to the selected particles are marked in panel (<b>b</b>).
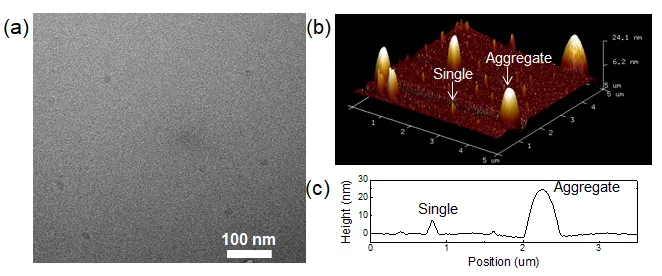
The FT-IR spectrum of H-CDs (
a) displays abundant oxygen-containing functional groups, including hydroxyl (–OH, 3212 cm
−1), carbonyl (C=O, 1705 cm
−1), cyano groups (C≡N, 2251 cm
−1), and ether (C–O, 1192 cm
−1) vibrations. The sharp and intense vibrational band observed at approximately 2200–2260 cm
−1 in the FT-IR spectrum is characteristic of the C≡N stretching vibration. This signal strongly corresponds to the cyano (-C≡N) functional groups present in the DDQ structure. These results suggest that the CDs derived from the diphenol/oxidant system consist of π-conjugated heterocyclic frameworks bearing various oxygen-containing moieties such as carboxyl, hydroxyl, ester, ether, and aldehyde groups. The presence, abundance, and spatial distribution of these groups are believed to play critical roles in the supramolecular self-assembly and multicolor emission properties of the CDs. XRD analysis of solid-state H-CDs (
b) reveals a broad, diffuse peak centered at 2θ = 22.8°, characteristic of an amorphous structure. The absence of sharp diffraction peaks confirms the lack of long-range crystalline order. Notably, no crystalline signatures corresponding to unreacted molecular precursors (e.g., 1,3-dihydroxynaphthalene or DDQ) or byproducts were detected, which would typically exhibit distinct sharp peaks. These findings confirm that the hydrothermally synthesized and purified H-CDs are amorphous carbon nanodots with disordered internal structure, consistent with common solution-processed carbon dots and distinct from crystalline molecular species. The
1H NMR spectrum of H-CDs (
c) exhibits broad signals indicative of heterogeneous chemical environments, in line with the formation of amorphous carbon nanodots. A downfield resonance at δ = 11.6 ppm is assigned to carboxylic acid protons (–COOH) involved in face-to-face π-stacked aggregates, while the signal at δ = 10.5 ppm is attributed to phenolic hydroxyl protons (Ar–OH) located at hydrogen-bonding interfaces. The peak at δ = 6.40 ppm is assigned to the aromatic proton of an enolized β-diketone structure (–C=C–OH), where intramolecular hydrogen bonding creates a pseudo-aromatic system. This chemical shift is characteristic of enol tautomers in conjugated systems. Meanwhile, the signal at δ = 4.25 ppm corresponds to benzylic methylene protons (–CH
2–O–Ph) formed through nucleophilic addition between carbonyl intermediates and phenolic moieties during microwave-assisted carbonization. The overall broadening of these resonances reflects the complex, disordered nature of the CDs and further supports the exclusion of residual crystalline molecular species after purification by column chromatography.
. (<strong>a</strong>) FT-IR spectrum of H-CDs.; (<strong>b</strong>) XRD patterns of H-CDs; (<strong>c</strong>) <sup>1</sup>H-NMR (400 MHz, DMSO-d<sub>6</sub>) spectrum of H-CDs.
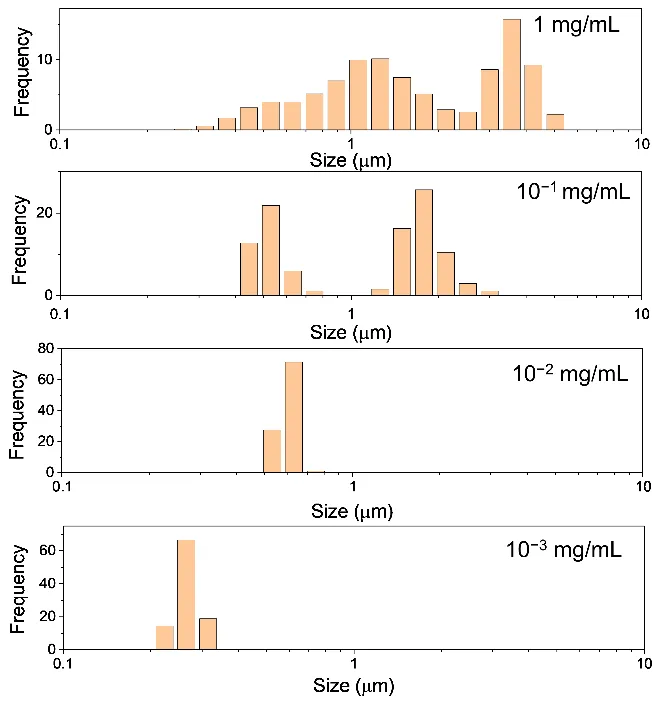
As shown in
, the particle sizes of H-CDs at concentrations of 10
−3, 10
−2, 10
−1, and 1 mg/mL were measured to be approximately 0.27 μm, 0.60 μm, 1.27 μm, and 2.06 μm, respectively, using a laser particle size analyzer. Notably, relatively large particle sizes were observed even at low concentrations, suggesting the presence of stable aggregates rather than isolated nanodots. This phenomenon is attributed to a hierarchical assembly process driven by H-type aggregation. Specifically, the H-CDs possess abundant π-conjugated domains and polar functional groups, enabling π–π stacking and hydrogen bonding interactions that promote the formation of nanoscale aggregates (~0.27 μm) even at dilute concentrations. These primary aggregates are responsible for the blue fluorescence observed at low concentrations. Upon increasing the concentration, these nanoscale aggregates further assemble into larger supraparticles through directional H-type stacking, characterized by face-to-face π–π interactions. This higher-order aggregation leads to extended structures with increased particle size and a concomitant red-shift in fluorescence emission from blue to green.
. Particle size distribution histograms of H-CDs at different concentrations measured by laser particle size analyzer. From bottom to top: 10<sup>−3</sup> mg/mL, 10<sup>−2</sup> mg/mL, 10<sup>−1</sup> mg/mL, and 1 mg/mL.
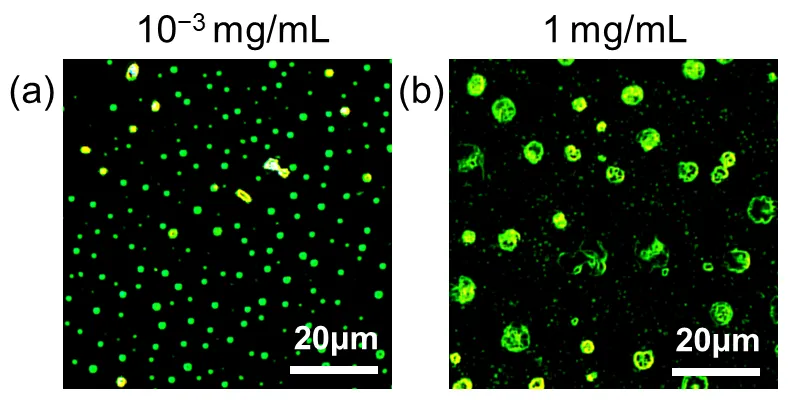
reveals distinct concentration-dependent morphological transitions of H-CDs as observed under dark-field optical microscopy. The H-CDs exhibit a fine, well-dispersed distribution characterized by discrete nanoscale particulates at a low concentration of 10
–3 mg/mL (
a). These are interpreted as monomeric or small supramolecular assemblies of carbon dots, stabilized by relatively weak intermolecular forces such as hydrogen bonding and π-π interactions. The uniformity and isolation of the particles at this concentration suggest minimal aggregation, enabling the retention of individual dot-like features and resulting in consistent blue photoluminescence under UV illumination. In stark contrast, when the concentration is increased to 1 mg/mL (
b), the morphology shifts dramatically toward the formation of large, micron-sized aggregates with complex clustered structures. These aggregates indicate a hierarchical H-type assembly process, driven by intensified intermolecular interactions due to the increased proximity of particles in solution. Specifically, the π-conjugated domains of the carbon dots facilitate directional face-to-face stacking (characteristic of H-aggregation), which promotes anisotropic growth of the assemblies. Additionally, the presence of abundant polar functional groups (e.g., hydroxyl, carboxyl, and amine groups) likely contributes to forming a dynamic hydrogen bonding network, further stabilizing these higher-order structures. This transition from monodisperse particles to large hierarchical assemblies illustrates a delicate balance between concentration, molecular interactions, and colloidal stability. At lower concentrations, entropic factors and solvent interactions dominate, favoring dispersion. At higher concentrations, enthalpic contributions from noncovalent interactions overcome dispersion forces, leading to spontaneous self-organization into larger structures. These morphological changes are also accompanied by optical property evolution, such as a red-shift in emission from blue to green, highlighting the interplay between structural organization and photophysical behavior.
. Dark-field optical micrographs of H-CDs prepared at concentrations of (<strong>a</strong>) 10<sup>−3 </sup>mg/mL and (<strong>b</strong>) 1 mg/mL.
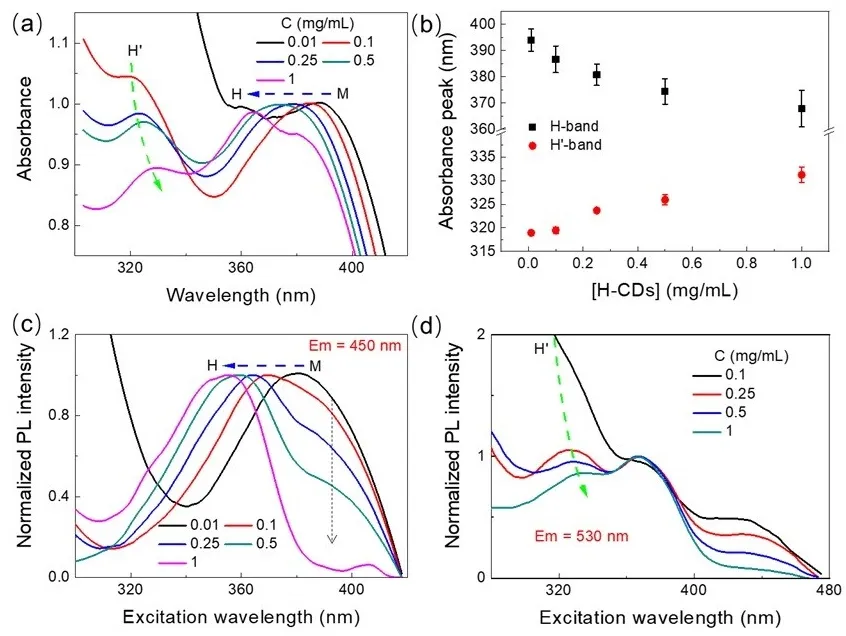
Continuing with the assumption that H-CDs tend to form H-type aggregates upon increasing concentration, a detailed comparative analysis of their absorption and PL excitation spectra was conducted. As shown in
a, the UV-vis absorption spectra of H-CDs evolve significantly with increasing concentration. In comparison with the monomeric CDs (M-CDs), two new absorption bands emerge, exhibiting opposite spectral shifts: the absorption peak at ~395 nm gradually blueshifts to ~370 nm, while the peak at ~318 nm red-shifts to ~330 nm (
b). Drawing on classical excitonic models of dye aggregation [
57,
58], the blue-shifted band can be attributed to the formation of ordered H-aggregates, characterized by excitonic coupling with a side-by-side geometry. In contrast, the red-shifted band is ascribed to a locally distorted H′-aggregate, in which structural disorder or excitonic relaxation causes a J-aggregate-like red-shift. Further insights are provided by the PL excitation spectra. When monitored at 450 nm (corresponding to blue emission), the excitation spectrum exhibits a narrow peak at 353 nm with a shoulder around 400 nm (
c). However, when monitored at 530 nm (green emission), the excitation spectrum shows a more complex structure: the 353 nm peak splits into two peaks centered at 330 nm and 367 nm, while the shoulder around 410 nm shifts further to ~450 nm (
d). These spectral changes suggest distinct excitation pathways and stronger coupling effects at higher concentrations, consistent with the emergence of H′-aggregates. The splitting and red-shift of excitation bands further support the role of structural relaxation and local symmetry breaking within the aggregated states. It is also noteworthy that the H-CDs exhibit a large Stokes shift, exceeding 250 nm. Such a shift could be associated with aggregation-induced emission behavior, wherein emission originates from states stabilized through interparticle interactions or suppressed nonradiative decay in the aggregated phase. A closer comparison between the concentration-dependent excitation and absorption spectra (Figures 5c,d) reveals substantial differences in both spectral shape and position, reinforcing the distinct nature of the emitting and absorbing species. For example, the main excitation band was monitored at 450 nm, shifting from 380 nm to 354 nm with increasing concentration, while that was monitored at 530 nm with red-shifts from 327 nm to 332 nm. Concurrently, the relative intensity of the monomer-associated features at longer wavelengths decreases dramatically, indicating a progressive suppression of isolated species and dominance of aggregated states in the photophysical behavior.
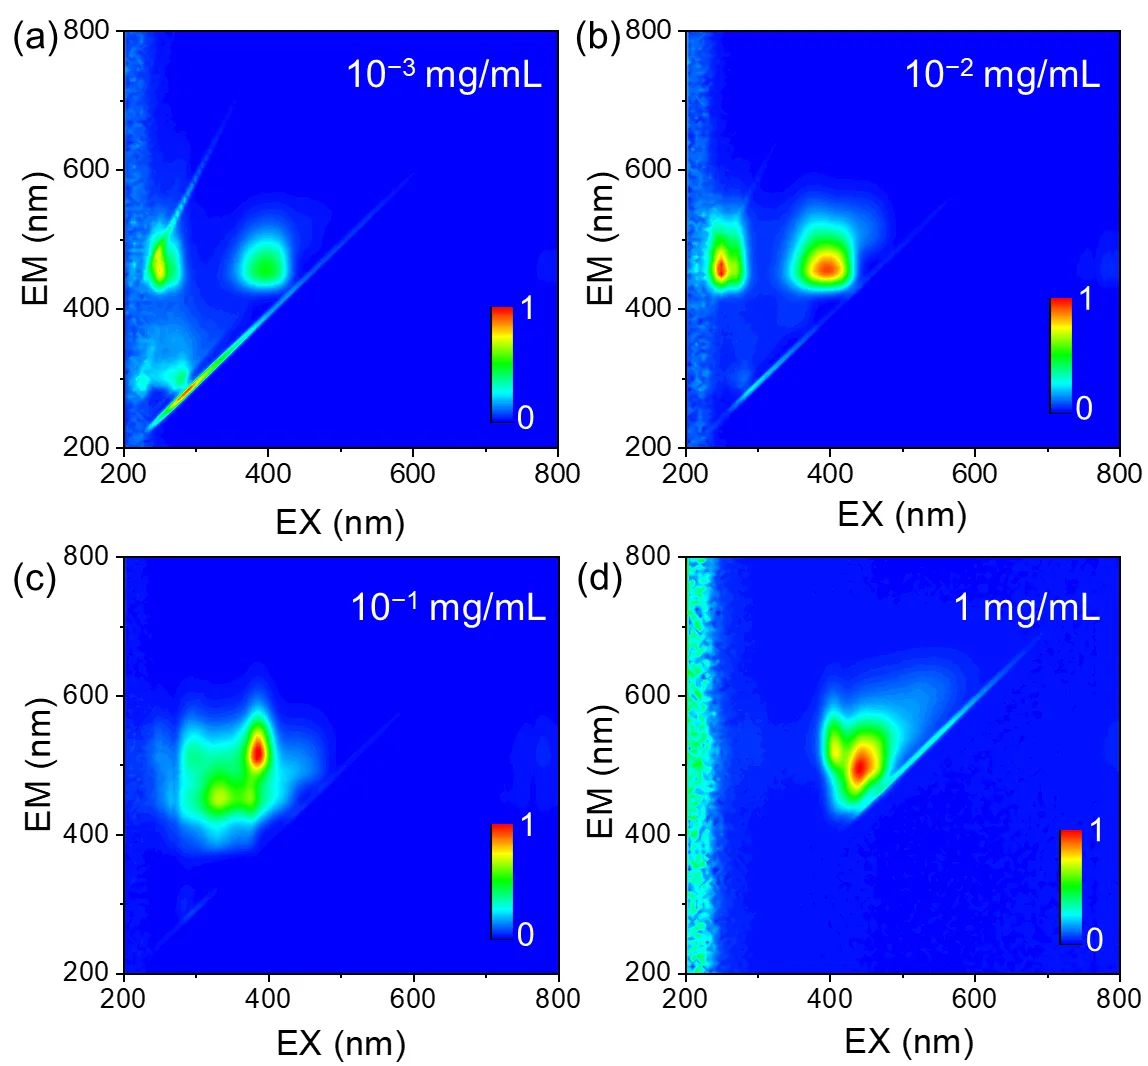
As shown in
, three-dimensional fluorescence spectroscopy was used to investigate the excitation-emission behavior of H-CDs in ethanol across four concentrations ranging from 0.001 to 1 mg/mL. At low concentrations (0.001–0.01 mg/mL,
a,b), the fluorescence spectra exhibit dual emission centers centered around 460 nm when excited at approximately 249 nm and 398 nm, corresponding to emission from well-dispersed individual carbon dots. When the concentration reaches a critical threshold of 0.1 mg/mL (
c), a pronounced red-shift occurs: the dominant emission peak shifts to 517 nm (excited at 385 nm), with a much stronger intensity compared to a weaker residual blue-shifted peak at 455 nm (excited at 334 nm). At the highest concentration studied (1 mg/mL,
d), the dual emission centers further differentiate into peaks at 500 nm (excited at 443 nm) and 520 nm (excited at 410 nm), with the 500 nm peak becoming dominant. These spectral changes clearly demonstrate a concentration-dependent red-shift transition in the dominant emission, progressing from ~460 nm at low concentration (0.001 mg/mL), to 517 nm at the critical concentration (0.1 mg/mL), and a split emission at 500/520 nm at the highest concentration (1 mg/mL). The observed ~57 nm red-shift jump at 0.1 mg/mL marks a critical point in the aggregation behavior of H-CDs. Mechanistically, H-CDs are predominantly dispersed monomer-like species below this critical concentration, emitting characteristic blue fluorescence. As concentration increases, π–π interactions induce face-to-face stacking, leading to the formation of tetrameric H-aggregates. This aggregation modifies the electronic structure by contracting the energy gap, which results in a substantial red-shift in emission wavelength and an intensity redistribution favoring longer wavelengths.
. (<strong>a</strong>) Changes in the UV-vis absorbance spectra of H-CDs with increasing solution concentration. The blue and green dashed arrows indicate the blue-shifted H-band and red-shifted H′-band, respectively. The M denotes the spectral position of the monomeric (dispersed) H-CDs, while H refers to the spectral features arising from interparticle aggregation. (<strong>b</strong>) Concentration-dependent spectral shifts of the H-band and H′-band. (<strong>c</strong>,<strong>d</strong>) Excitation spectra of H-CDs at different concentrations, monitored at emission wavelengths of λ<sub>em</sub> = 450 nm (<strong>c</strong>) and λ<sub>em</sub> = 530 nm (<strong>d</strong>). The PL excitation spectra are carried out to minimize inner filter effects using a low-volume cuvette (1 × 4 mm, 140 µL). All dotted arrows indicate the direction of concentration increasing from 0.01 mg/mL to 1 mg/mL.
. Three-dimensional fluorescence spectra of H-CDs solutions at varying concentrations. (<strong>a</strong>) 10<sup>−3</sup> mg/mL, (<strong>b</strong>) 10<sup>−2</sup> mg/mL, (<strong>c</strong>) 10<sup>−1</sup> mg/mL, (<strong>d</strong>) 1 mg/mL.
As discussed earlier, the diphenol/oxidant-derived H-CDs consist of supramolecular aggregates whose morphology and PL properties strongly influence their aggregation state [
56,
57]. We studied how the PL emission spectra change with solution concentration by diluting a concentrated sample stepwise.
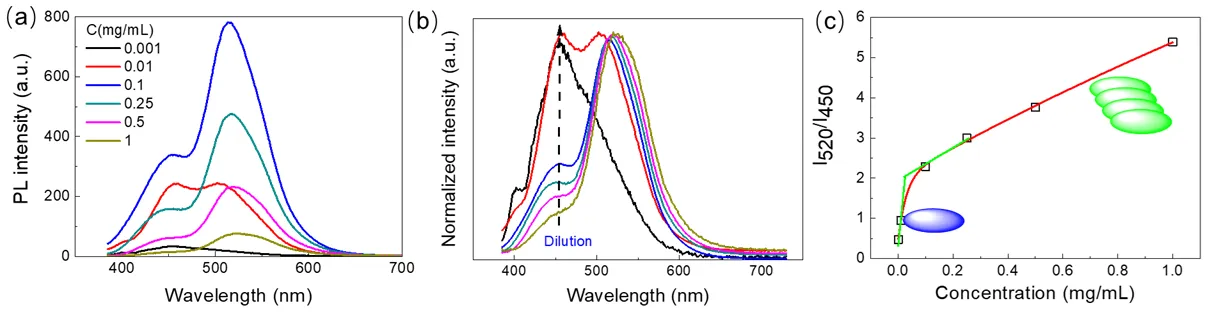
a presents the fluorescence emission spectra at various concentrations, while
b shows the normalized spectra highlighting the evolution of emission peaks. As the H-CD concentration decreases, the dominant emission peak gradually shifts from approximately 520 nm to 450 nm, indicating a transition from aggregated to more dispersed states.
c plots the fluorescence intensity ratio (I
520/I
450) versus concentration, revealing a clear concentration-dependent increase in the relative contribution of the red-shifted emission band. At low concentrations (<0.01 mg/mL), the H-CDs mainly exist as dispersed or loosely associated species, emitting strongly around 450 nm. This emission is attributed to intrinsic electronic transitions of the individual carbon dot units or small oligomers. Above a critical concentration (~0.1 mg/mL), increased molecular packing via face-to-face π-π stacking leads to the formation of ordered H-aggregates, altering the electronic environment and resulting in a dominant emission band near 520 nm. The observed red-shift of emission with aggregation contrasts with classical H-aggregate models that typically predict a blue shift. This discrepancy suggests aggregation induces a rearrangement in molecular packing and electronic coupling within the H-CDs, leading to new emissive states. Thus, the concentration-dependent PL changes reflect a dynamic equilibrium between dispersed and aggregated forms of H-CDs, where supramolecular assembly modulates their optical properties.
. (<strong>a</strong>) Fluorescence emission spectra of H-CDs in ethanol solution at varying concentrations. (<strong>b</strong>) Normalized fluorescence emission spectra of aqueous H-CDs solutions at different dilution levels. The arrows indicate increasing dilution times; the original concentration of pristine H-CDs is approximately 1 mg/mL. (<strong>c</strong>) Plot of the fluorescence intensity ratio (I<sub>520</sub>/I<sub>450</sub>) of H-CDs as a function of concentration, illustrating the concentration-dependent emission shift. Red line: added trend. Green lines: tangents for two concentration ranges, indicating critical aggregation concentration. Blue ellipsoids: individual CDs. Green stacked ellipsoids: aggregated CDs.
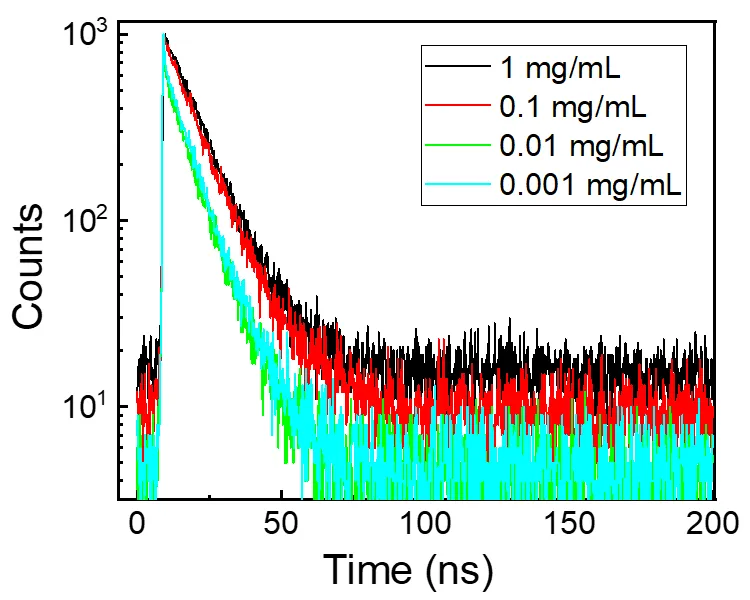
As shown in
, time-resolved fluorescence decay profiles of H-CDs were investigated under 375 nm picosecond pulsed laser excitation across four concentrations (0.001–1 mg/mL). Emission was monitored at 450 nm for dilute samples (0.001 and 0.01 mg/mL, blue emission) and at 525 nm for more concentrated ones (0.1 and 1 mg/mL, green emission). All decay curves were fitted using a biexponential model described by the equation
I(
t) ~
B1exp(−
t/τ
1) +
B2exp(−
t/τ
2), where τ
1 and τ
2 represent the fast and slow lifetime components, respectively, and
B1,
B2 are their amplitude contributions.
As shown in
, the lifetime data strongly support the interpretation of emission origin shifting from monomers to aggregates as concentration increases. At low concentrations (0.001 and 0.01 mg/mL), where emission is centered at 450 nm, the decay behavior is biexponential with a dominant long-lived component (~8.8 ns) and a small fast component (~0.4 ns), reflecting a mixture of monomer-like emissive states and minor aggregation or surface-state contributions. As the concentration increases to 0.1 mg/mL, the emission red-shifts to 525 nm and the decay becomes dominated by the long component (10.73 ns), with the short component nearly vanishing. At 1 mg/mL, the decay is essentially single-exponential with a lifetime of 11.31 ns, indicating a highly uniform emissive environment consistent with compact, ordered aggregates. This excellent agreement between emission wavelength shift and fluorescence lifetime evolution clearly confirms that the concentration-dependent optical properties arise from a well-defined transition from isolated monomeric CDs to emissive aggregates with suppressed nonradiative decay channels [
59,
60,
61].
. Fluorescence decay curve of H-CDs in ethanol solutions at different concentrations.
.
Fluorescence lifetime fitting parameters of H-CDs in ethanol at different concentrations.
| C (mg/mL) |
λem (nm) |
τ1 (ns) |
B1 (%) |
τ2 (ns) |
B2 (%) |
τave (ns) |
χ2 |
| 10−3 |
450 |
0.40 |
38.48 |
8.82 |
61.52 |
8.59 |
0.996 |
| 10−2 |
450 |
0.40 |
38.48 |
8.82 |
61.52 |
8.59 |
0.996 |
| 10−1 |
525 |
0.37 |
4.99 |
10.73 |
95.01 |
10.71 |
0.997 |
| 1 |
525 |
11.31 |
100 |
- |
- |
11.31 |
0.996 |
According to Kasha’s exciton theory [
62], weakly emissive H-aggregates are characterized by a blue-shifted excitation or absorption band, whereas highly emissive J-aggregates exhibit a red-shifted excitation or absorption feature. Based on these classical models, one may reasonably associate blue-shifted excitation/absorption bands with H-aggregates and red-shifted ones with J-aggregates. However, such a binary classification becomes inadequate for more structurally complex aggregates, especially when the excitation/absorption and emission spectra exhibit clear vibronic progressions. To address this complexity, Spano introduced a more refined model based on excitonic coupling strength, providing critical insights into the identification of H- and J-type aggregates [
63,
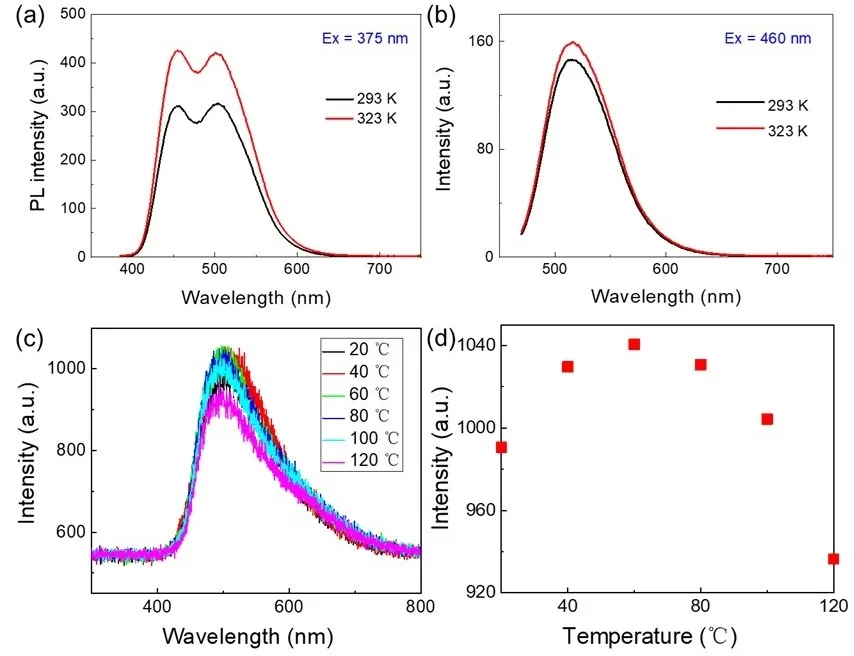
64]. In the present study, by extending Spano’s criteria, we performed temperature-dependent PL measurements at the respective excitation maxima of the blue- and red-shifted bands. The fluorescence intensity increases with temperature for the weakly blue-emissive state, consistent with H-aggregate behavior (
a). One might initially assume a J-aggregate character for the red-shifted excitation associated with green emission, anticipating a pronounced intensity decrease with rising temperature due to exciton-phonon interactions. However, we observe an increase in emission intensity with temperature (
b), a feature more consistent with H-aggregates rather than J-aggregates. Thus, we do not attribute this red-shifted excitation to a J-aggregate but rather assign it to a distorted or weakly coupled H′-aggregate. This anomalous low-energy H′-aggregate excitation likely arises from a combination of weak excitonic coupling and structural disorder, such as increased interparticle distances and suboptimal spatial configurations among the CDs. These structural features relax the otherwise forbidden lower-energy excitonic transitions, giving rise to the red-shifted excitation band.
. (<strong>a</strong>) Effect of increasing temperature on the emission spectra of H-CDs (C = 0.25 mg/mL) measured with excitation wavelengths at 375 nm. (<strong>b</strong>) Effect of increasing temperature on the emission spectra of H-CDs (C = 0.25 mg/mL) was measured with excitation wavelengths of 450 nm. (<strong>c</strong>) Fluorescence emission spectroscopy of H-CDs at different temperatures (20–120 °C). (<strong>d</strong>) The variation of fluorescence intensity of H-CDs with temperature.
As illustrated in
c,d, we systematically evaluated the fluorescence intensity of H-CDs across a temperature range from 20 to 120 °C. The emission intensity initially increased with temperature, peaking before gradually declining. Specifically, the fluorescence intensity gradually increased from room temperature up to 60 °C, reaching its peak at this point. Beyond 60 °C, the intensity steadily declined as the temperature continued to rise, indicating a clear temperature-dependent modulation of fluorescence behavior. This systematic variation confirms that temperature plays a regulatory role in the photophysical behavior of H-CDs, strongly associated with their aggregation state. At lower temperatures, carbon dots exist primarily as monomers with limited intermolecular interactions, where excitation energy is dissipated mainly through nonradiative decay, resulting in relatively weak fluorescence. Increased molecular motion facilitates H-aggregate formation as the temperature rises, enhancing π–π stacking and hydrogen bonding interactions. These interactions constrain intramolecular rotations and vibrations, suppressing nonradiative pathways and promoting radiative emission. The fluorescence reaches its optimum at 60 °C, indicating an ideal aggregation state. Beyond this temperature, thermal agitation disrupts the aggregate’s structural order, weakening intermolecular interactions or introducing enhanced local charge-transfer processes, which leads to fluorescence quenching. Additionally, the formation of H-aggregates is often accompanied by a red shift in emission wavelength, such as the observed transition from blue to green emission. The dynamic modulation of aggregation stability with temperature thus provides a compelling explanation for the initial increase followed by a decrease in fluorescence intensity.
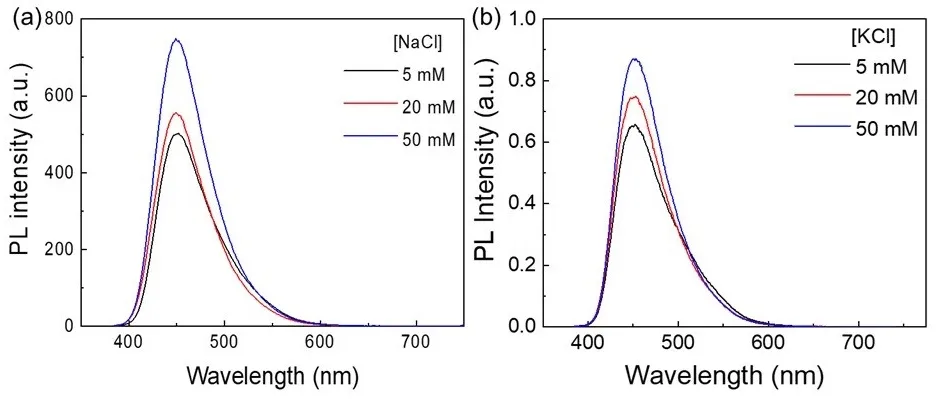
Fluorescence spectra of CD solutions were measured under varying concentrations of sodium chloride (NaCl) and potassium chloride (KCl) at 5, 20, and 50 mmol/L, while keeping all other conditions constant. As shown in
a,b, increasing the concentration of either salt within this low-to-moderate ionic strength range leads to a pronounced enhancement of the CDs’ fluorescence intensity. This effect can be primarily attributed to the electrostatic screening of the negatively charged CD surfaces by Na
+ or K
+ ions. In aqueous media, the surface carboxyl groups (-COOH) ionize to –COO
−, imparting significant negative charge and generating a strong electrostatic field that can disrupt the CDs’ electronic structure or facilitate nonradiative recombination pathways, thus lowering fluorescence quantum yield. The addition of Na
+ or K
+ forms an electrical double layer around the CDs, effectively neutralizing this surface charge and reducing interference with radiative recombination. It is worth noting that although the hydration radii of Na
+ and K
+ are different, the almost identical fluorescence enhancement observed provides strong evidence for this charge screening mechanism, as these two cations have the same charge state and electrostatic function. This screening suppresses nonradiative relaxation channels, thereby enhancing fluorescence emission. Additionally, binding of these cations to surface –COO
− groups diminishes their electron-withdrawing effect, which weakens the intramolecular charge transfer (ICT) between electron-donating groups (such as amino or hydroxyl) and electron-accepting carboxyl groups. This disruption inhibits the nonradiative ICT relaxation pathway, further favoring radiative recombination within the CDs. The elevated ionic strength may also modify the solvation shell around the CDs, restricting molecular vibrations or rotations that typically dissipate energy non-radiatively. Moreover, salt-induced weak interparticle interactions, such as ion bridging, may restrict the motion of surface functional groups, thereby activating weak aggregation-induced emission behavior. It is important to note that this enhancement occurs within a critical ionic concentration window (5–50 mmol/L) where electrostatic screening and weak aggregation dominate; higher ionic strengths could lead to aggregation-caused quenching, reversing the fluorescence enhancement.
. (<strong>a</strong>) Photoluminescence emission spectra of H-CDs excited at 375 nm in the presence of varying concentrations of NaCl. (<strong>b</strong>) Photoluminescence emission spectra of H-CDs excited at 375 nm with different concentrations of KCl.
In summary, nitrogen-doped carbon dots (H-CDs) with green fluorescence were successfully synthesized via a solvothermal approach using a rigid π-conjugated carbon source and a multifunctional oxidant/nitrogen donor. The resulting amorphous supramolecular carbon dots are stabilized primarily by noncovalent interactions, featuring abundant oxygen- and nitrogen-containing surface groups. Hierarchical H-type aggregation strongly influences their photophysical properties, which drives a concentration-dependent transition from blue-emitting monomers to green-emitting supra-CDs, accompanied by significant particle growth and fluorescence lifetime elongation. Temperature- and salt-dependent experiments further elucidate the role of distorted H′-aggregates, electrostatic effects, and molecular dynamics in modulating emission intensity. These findings provide valuable insights into the structure–property relationships of carbon dots and highlight strategies for precise tuning of their emission through supramolecular assembly and environmental control, advancing their potential in optoelectronic and sensing applications.
We thank Dongmao Zhang of the Department of Chemistry at Mississippi State University for helpful discussions and suggestions.
Conceptualization, C.W. and W.Z.; Methodology, C.W., X.Z. and Z.Y.; Validation, W.F.; Formal Analysis, C.W. and M.Z.; Data Curation, Z.Y.; Original Draft Preparation, C.W.; Review & Editing, W.Z.; Visualization, X.Z.; Supervision, Project Administration, and Funding Acquisition, W.Z.
Not applicable.
Not applicable.
All research data related to the paper are accessible and provided by the authors.
This research was funded by [the Key Science and Technology Program of Kaifeng City] grant number [2301002].
The authors declare that they have no known competing financial interests or personal relationships that could have appeared to influence the work reported in this paper.