1. Introduction
Large diameter monopile foundations, due to their advantages such as structural simplicity, ease of design and fabrication, convenient transportation, strong adaptability to geological conditions and loading environments, and minimal requirement for complex construction preparations, have gained increasing popularity [
1,
2,
3,
4] in the construction of wind turbines, long-span bridges, high-rise buildings, transmission towers, and offshore platforms. During the service period, monopiles are often subjected to lateral loads [
5,
6,
7,
8] induced by wind, waves, landslides, vehicle braking, ship collisions, and earthquakes. Therefore, investigating the lateral bearing characteristics and failure mechanisms of large diameter monopiles under lateral loads holds significant theoretical and practical importance.
Research on the lateral loading behavior and failure modes of large-diameter monopiles has revealed some key findings, including: increased pile diameter and embedment depth significantly reduce foundation deformation while enhancing bearing capacity [
9,
10,
11]; flexible piles primarily exhibit single wedge failure mode, semi-rigid piles show wedge failure mode, full flow failure mode and rotation failure mode, and rigid piles develop wedge failure mode and rotation failure mode [
12,
13,
14,
15,
16]. However, there is limited research on how pile diameter changes affect each failure zone’s scope and how different failure modes affect pile-soil interactions. In the theoretical analysis of pile-soil interactions for large-diameter monopile foundations, the
p-y curve method, corresponding to relationship of the lateral load (
p) and deformation (
y), remains the most widely used approach. This method was originally proposed by Reese et al. [
17] and Matlock et al. [
18] based on experimental results of small-diameter flexible piles, and evolved from the Winkler foundation model. It can effectively capture the nonlinear mechanical responses of the pile-soil interaction. Subsequently, the method has been adopted with modifications in API (American Petroleum Institute: Geotechnical and Foundation Design Considerations) [
19] and DNV (Det Norske Veritas: Support Structures for Wind Turbines) [
20]. However, recent studies reveal significant limitations in the API-recommended
p-y curve method when applied to large-diameter monopiles, primarily due to the diameter effect. While researchers [
21,
22,
23,
24,
25,
26,
27] have proposed a series of modifications and enhancements to expand the applicability of the
p-y curve method, a unified consensus on the quantitative impact of the diameter effect remains elusive. For instance, Terzaghi [
28], Randolph [
29], He [
30] argued that the change in pile diameter did not affect the initial stiffness of the
p-y curve, while Wang [
31] and Sørensen [
22] concluded that the initial stiffness of the
p-y curve needed to be corelated to the pile diameter. PISA (Pile-Soil Analysis Project) project [
32,
33], based on results of field tests and 3D finite element analyses, proposed an analytical model for the lateral loading response of the monopile by adding soil springs around the pile that could simultaneously account for the effects of base shear and bending moment, but did not consider the effects of changing failure modes, while Wang et al. [
34] found the effects of base shear and bending moment on the
p-y curve to be negligible for large-diameter piles based on a series of finite element numerical analysis results, and proposed a
p-y curve model that could account for different failure mechanisms. Hence, it is necessary to conduct further research on whether the diameter effect and the change of failure modes resulting from the increase in pile diameter will affect the pile-soil interaction.
On this basis, this study develops a three-dimensional finite element numerical model, which is validated through centrifuge test results [
35], to investigate the influence mechanisms of the diameter effect on the deformation characteristics, bearing capacity, and failure modes for large-diameter monopiles subjected to lateral loading. Furthermore,
p-y curves along the full embedment depth of the monopiles with varying diameters are derived through circumferential integration of stresses in the surrounding soil elements. The effects of pile diameter and failure modes on the ultimate soil resistance and initial stiffness of
p-y curves are systematically analyzed.
2. Details of the Numerical Simulation
The finite element model consists of three components: the monopile, the soil core inside the monopile, and the surrounding soil around the monopile, which are modelled by the solid linear brick elements with eight nodes (C3D8R).
2.1. Relevant Parameters of Soil and Monopile
Due to the fact that horizontally loaded monopile foundations are often used in marine environments (e.g., offshore wind turbines), the sand is analyzed under saturated conditions. Given the primary focus of this study on the influence of pile diameter variations, a specific set of soil parameters was adopted. All soil parameters are within the ranges commonly used in similar studies on horizontally loaded monopile foundations. The soil is modelled with the Mohr-Coulomb constitutive model, with a density of 1800 kg/m
3, an internal friction angle $$\varphi$$ of 33°, a dilation angle of 5°, and a Poisson’s ratio of 0.3. Considering the stress-state dependency of Young’s Modulus for sand, an increasing Young’s Modulus with soil depth, as shown in
Equation (1), is guided by previous researchers [
1,
36,
37]. All soil parameters are summarized in
.
where $$\sigma_{a t}$$ is atmospheric pressure, $$\kappa$$ and $$\lambda$$ are dimensionless coefficients, and $$\sigma_{m}$$ represents the minor principal stress of the soil. The depth-dependent variation of the Young’s Modulus is implemented in Abaqus by defining field variables to modulate material properties spatially.
.
Summary of soil parameters.
Soil
Type |
Internal Friction Angle $$\bm{\varphi}$$ (°) |
Dilation Angle (°) |
Poisson’s Ratio |
Dimensionless Coefficient $$\bm{\kappa}$$ |
Dimensionless Coefficient $$\bm{\lambda}$$ |
Minimal Mesh Size along the Depth (m) |
| Sand |
33° |
5° |
0.3 |
560 |
0.6 |
0.25 |
The monopile is modeled as a linear elastic material with Young’s Modulus of 210 GPa, Poisson’s Ratio of 0.3, and 7850 kg/m
3 density. Although this linear elastic assumption cannot account for material damage and failure mechanisms, it remains justified for large-diameter monopile applications. The deformation at which foundation failure occurs is significantly less than the critical deformation required to induce structural damage in the pile material. Consequently, this simplification aligns with established engineering practice for monopile design under serviceability limit states. This assumption has also been widely used in similar studies [
36,
38]. The pile diameter
D is considered in the range of 2–12 m, effectively covering the pile diameters commonly used in current engineering projects. The horizontal load eccentricity
h, which is defined as the vertical distance from the mudline to the horizontal loading point, as shown in
, is 15 m. The embedment depth
L of the monopile is 40 m, resulting in a slenderness ratio (
L/
D) range of 3.33 to 20. To prevent local buckling of the monopile, the wall thickness
tp is taken as
D/80, which complies with API code. All monopile parameters are summarized in
.
Table 2.
Summary of monopile parameters.
| Pile Diameter D (m) |
Embedment Depth L (m) |
Slenderness Ratio (L/D) |
Wall Thickness tp (mm) |
Diameter-to-Wall Thickness Ratio (D/ tp) |
Horizontal Load Eccentricity (m) |
| 2 |
40 |
20 |
25 |
80 |
15 |
| 4 |
40 |
10 |
50 |
80 |
15 |
| 6 |
40 |
6.67 |
75 |
80 |
15 |
| 8 |
40 |
5 |
100 |
80 |
15 |
| 10 |
40 |
4 |
125 |
80 |
15 |
| 12 |
40 |
3.33 |
150 |
80 |
15 |
The soil-monopile interaction is simulated using small sliding, surface-to-surface master/slave contact elements. The pile surface with higher stiffness is defined as the master surface, while the soil surface is defined as the slave surface. The “hard” contact option is used in the normal direction, and the Coulomb friction model is used in the tangential direction, which is governed by the penalty constraint enforcement with the interface roughness coefficient $$\mu = t a n \left(\varphi_{u}\right)$$, where $$\varphi_{u}$$ is the pile-soil interface friction angle at the critical state. Although this model has certain limitations—for instance, it simplifies the actual progressive failure behavior at the interface into an ideal elastic-plastic model, without considering potential strain softening/hardening or the effects of sand particle crushing during interface shearing—its computational efficiency and physically meaningful parameters (easily calibrated through experiments) have led to its extensive use by numerous scholars in studies analyzing soil-pile interaction [
38,
39,
40]. Given this study’s focus on the influence of increasing pile diameter on the failure mode of large-diameter monopile foundations and soil-pile interaction, this established method is adopted to balance accuracy and computational efficiency. For the monopile, $$\varphi_{u}$$ is usually taken as 0.4$$\varphi$$~0.7$$\varphi$$ [
40,
41,
42,
43]. Considering that the surface of the monopile is often rough in practical application environments, $$\varphi_{u}$$ is set as 0.7$$\varphi$$.
2.2. Finite Element Model and Boundary Conditions
This study employs a “wish-in-place” assumption for the monopile, omitting explicit modelling of the installation process. The simulation follows three steps: generation of the initial geostatic stress field and boundary conditions for the model, activation of the pile and pile-soil interface contact, and application of horizontal loading. This assumption is reasonable because the internal soil plug remains largely intact for large-diameter monopiles with minimal disturbance during penetration [
43,
44]. While the soil adjacent to the pile is highly remoulded, its strength partially regains through pore pressure changes, thixotropy, and consolidation. Furthermore, the stiffness of
p-
y curves is dominated by the soil outside the remoulded zone, and the ultimate bearing capacity can also be corrected by setting the interface roughness coefficient $$\mu$$ in the pile-soil contact model [
45,
46].
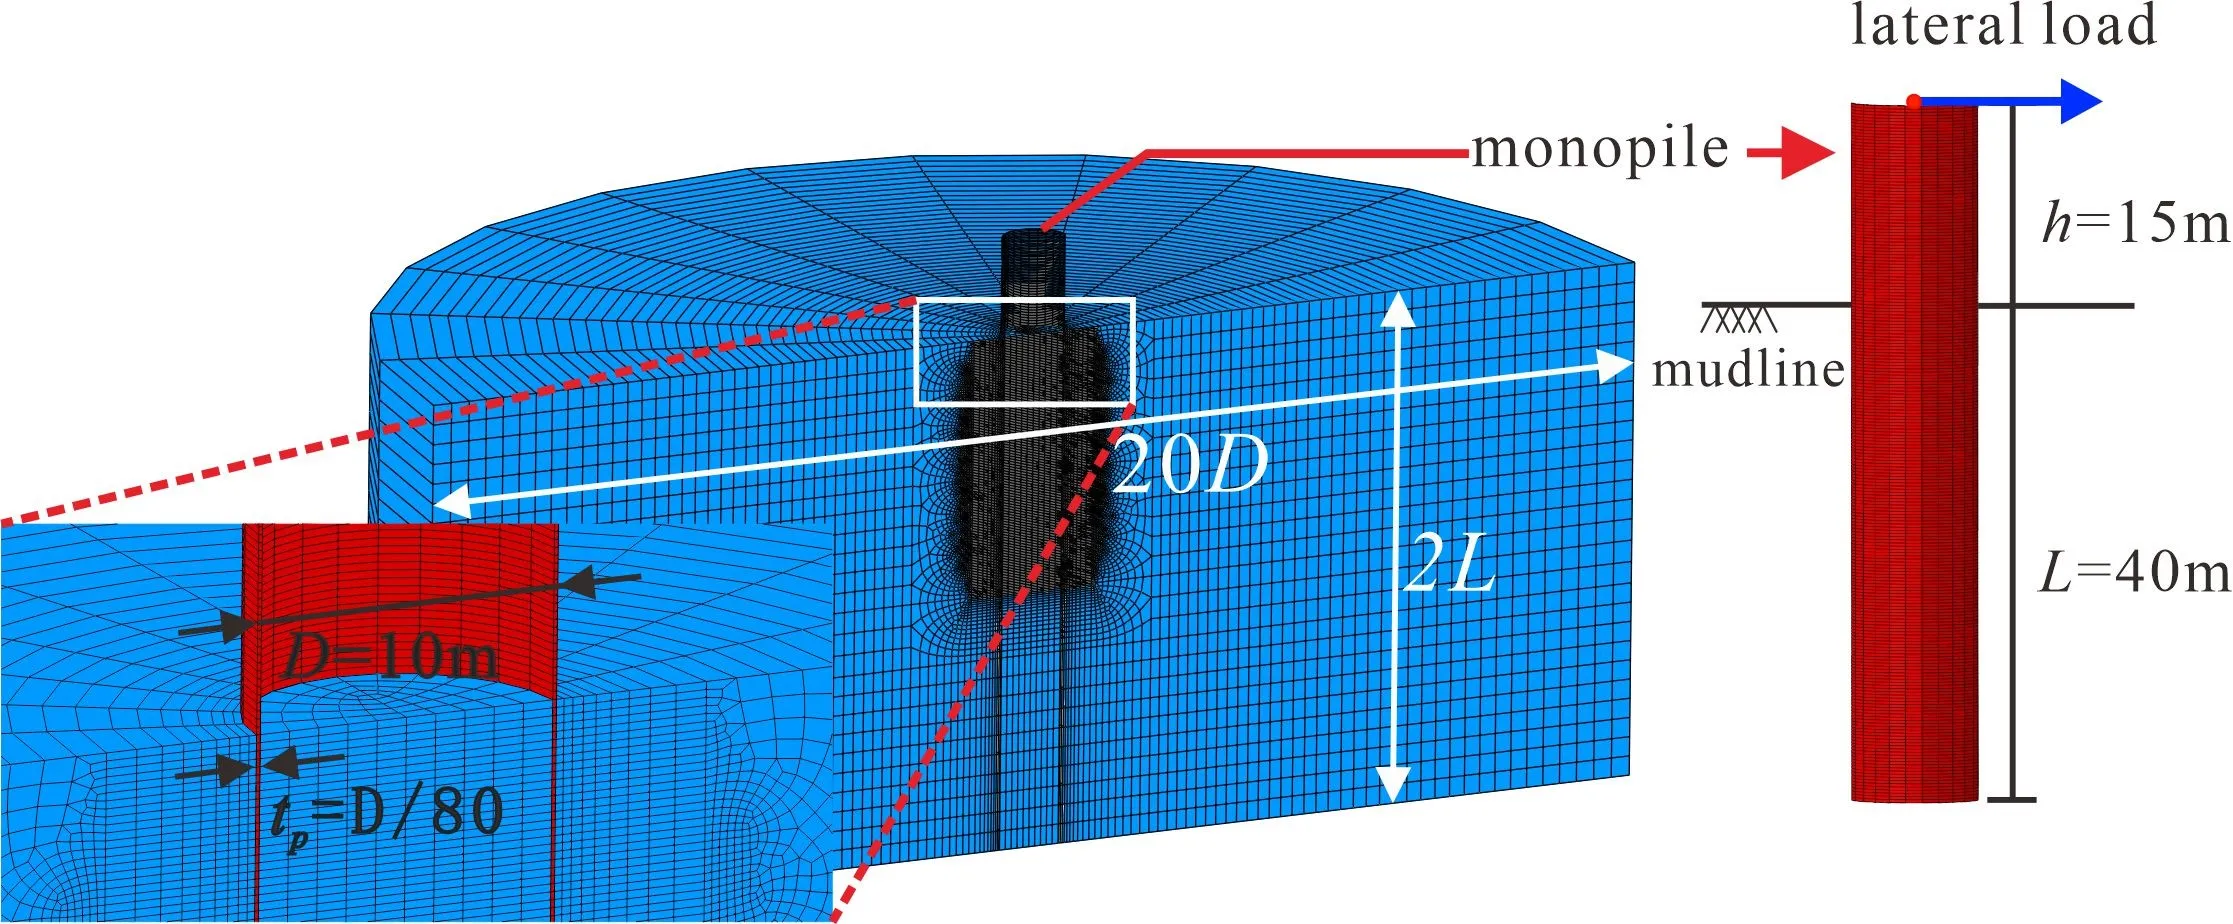
shows the dimensions and mesh division form of the finite element model with the diameter of the pile
D at 10 m, embedment depth
L at 40 m, and the horizontal load eccentricity
h at 15 m,
i.e.,
D = 10 m,
L = 40 m, and
h = 15 m. Due to the symmetry of the pile-soil system under horizontal loading, half of the model along the loading direction is analyzed. The lateral boundaries of each model are constrained by roller supports while the bottom boundary of the model is fixed by pin supports. Therefore, movements normal to the vertical boundaries and in all directions of the base are restrained. Parametric studies show that when the soil domain is larger than 20
D in the horizontal direction and deeper than 2
L in the vertical direction, the boundary effects on pile-soil interactions become negligible. Hence, the soil range is set up at 20
D × 2
L.
. Typical three-dimensional finite element model (<i>D</i> = 10 m, <i>L</i> = 40 m, <i>h</i> = 15 m).
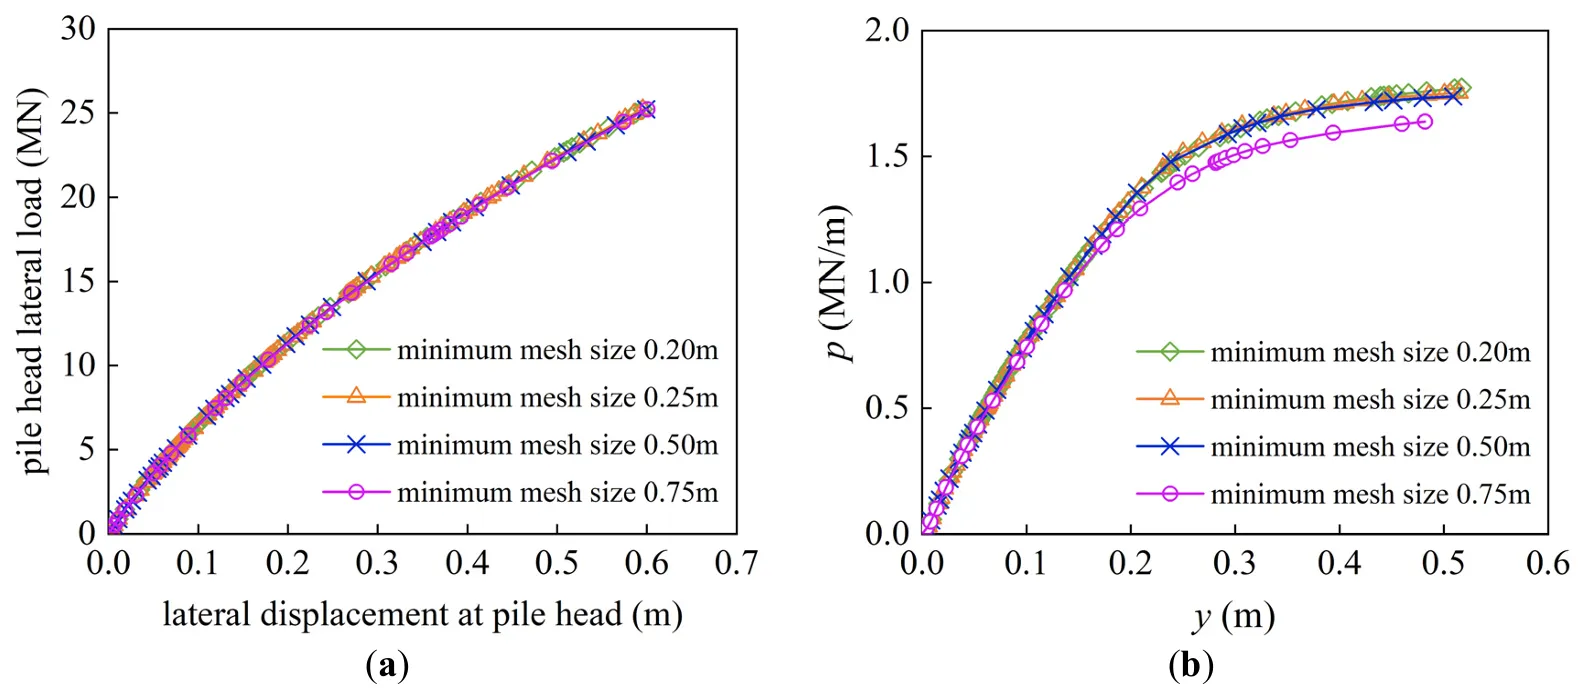
A representative case with
D = 4 m,
L = 40 m, and
h = 15 m was analyzed using four different meshes with minimal mesh sizes along the depth of 0.75 m, 0.5 m, 0.25 m, and 0.2 m, in the soil to investigate the effect of mesh size on the simulation results of laterally loaded piles. It is found that, as shown in
, the mesh size has a negligible influence on the lateral load-displacement response at the pile head. For the
p-y curve at a certain depth in the soil, represented by the depth of 2 m in
, the results converge when the minimum mesh size is less than 0.5 m. Therefore, a minimum mesh size of 0.25 m is adopted for the soil domain to save computational costs.
. Effect of mesh size on the simulation results: (<b>a</b>) lateral load-displacement response at the pile head; (<b>b</b>) <i>p</i>-<i>y</i> curves at depth of 2 m.
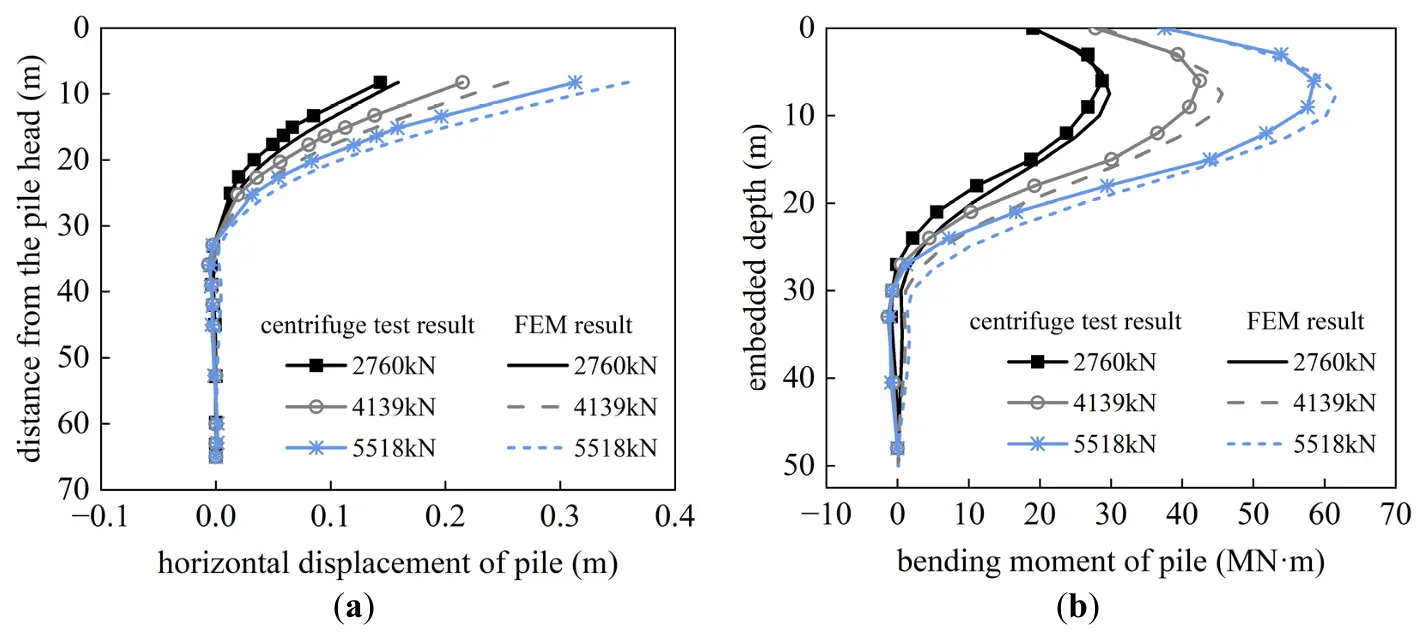
To verify the effectiveness of the finite element model in this paper, the numerical simulation results were compared with the horizontal monotonic loading centrifuge model test results conducted by Zhu et al. [
35] using Zhejiang University ZJU-400 geotechnical centrifuge. The parameters of the FEM (finite element model) are consistent with the test. By comparing the simulated and measured lateral deformation and bending moment of pile in
, it can be concluded that the simulated results are highly consistent with the measured results, thus verifying the applicability of the numerical modeling steps and mesh division method in the study.
. Validation of the numerical model against the centrifuge test: (<b>a</b>) lateral deformation of pile; (<b>b</b>) bending moment of pile.
3. The Effect of Pile Diameter on Lateral Bearing Capacity and Pile Deformation
3.1. Lateral Load Response of Monopiles with Different Diameters
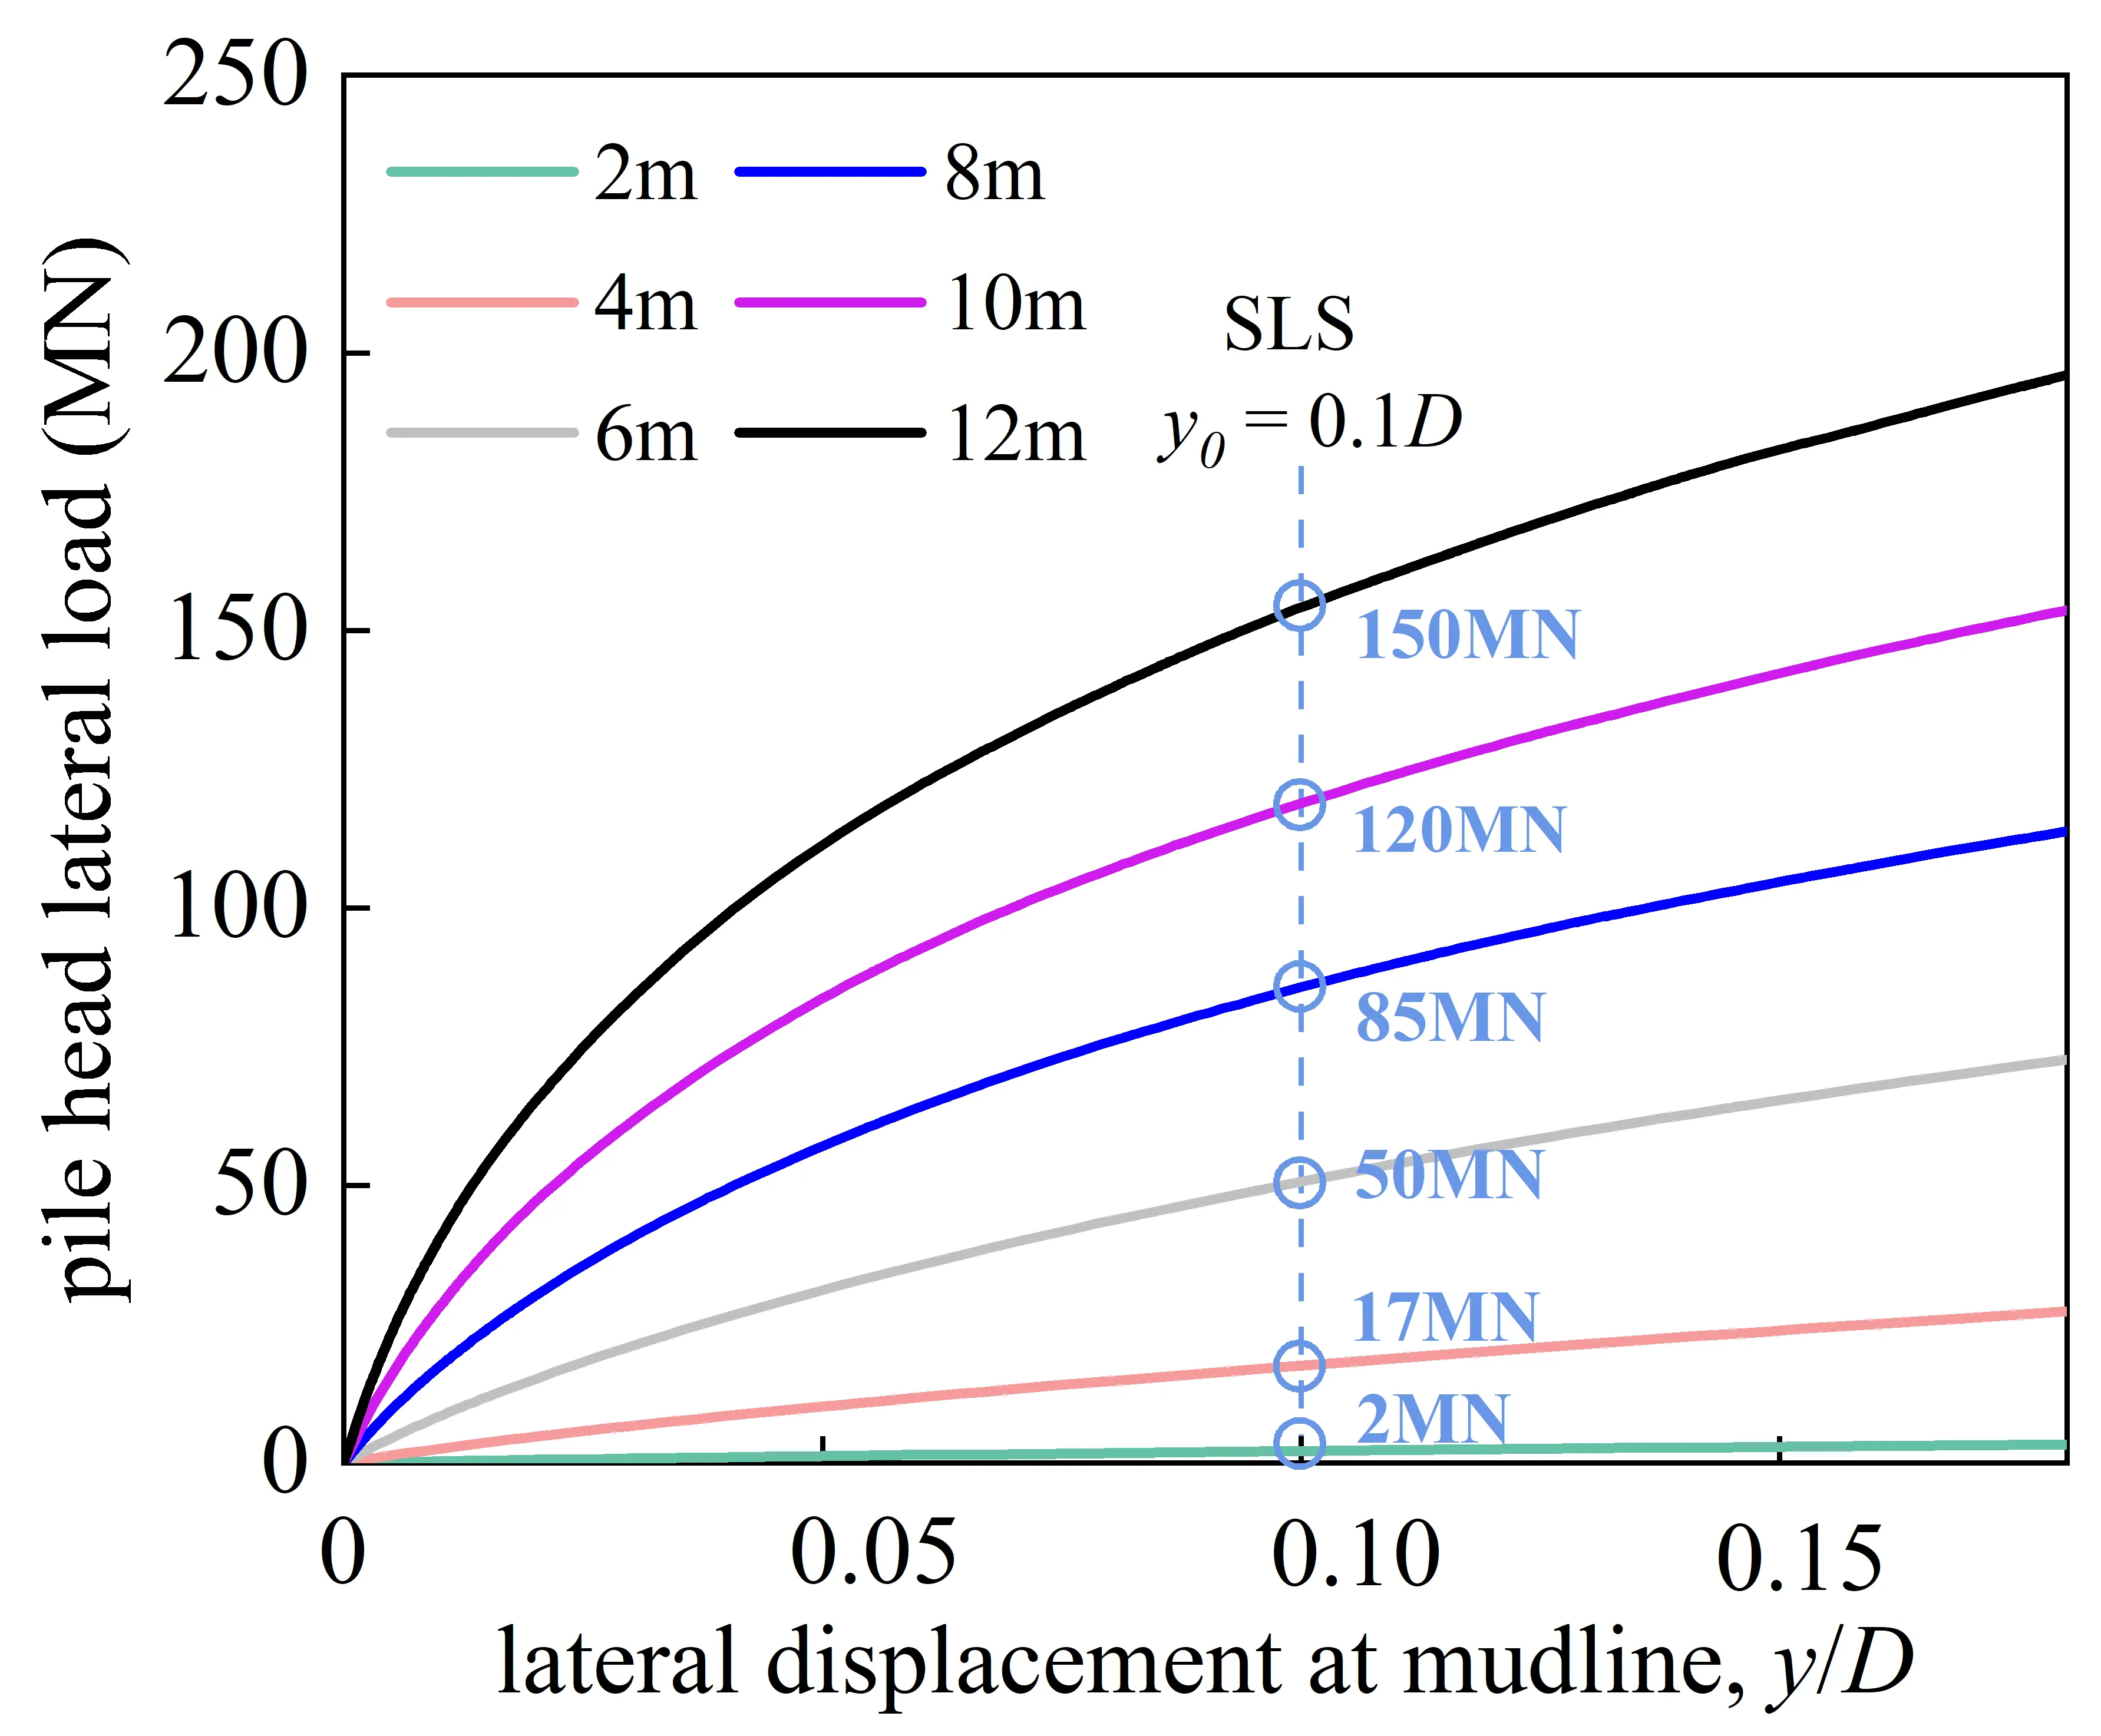
To investigate the influence of pile diameter on the horizontal bearing capacity of monopile,
presents the lateral load and the related horizontal displacement for monopiles with different diameters at mudline under a loading height of 15 m. The horizontal displacement
y is normalized by the pile diameter
D. As shown, the foundation resistance increases continuously with increasing lateral displacement without distinct yield points. Furthermore, as the pile diameter increases, the nonlinear trend of the curve strengthens.
In the design of large-diameter monopile foundations, it is usually necessary to satisfy both the ultimate limit state (ULS) requirement and serviceability limit state (SLS) requirement [
6,
20]. Compared to the ULS, the SLS imposes stricter deformation constraints on the foundation to ensure normal operation of the structure. Therefore, this study primarily investigates the influence of pile diameter on the lateral bearing capacity of monopile foundations under SLS conditions. Some researchers have proposed [
47] that the soil resistance corresponding to a mudline lateral deformation of
y0 = 0.1
D is the bearing capacity at the serviceability limit state
. As shown in
, the bearing capacity of the monopile under SLS conditions increases with the increase in pile diameter. When the diameter increases from 2 m to 12 m, the bearing capacity rises from approximately 2 MN to 150 MN.
. Lateral load-displacement response.
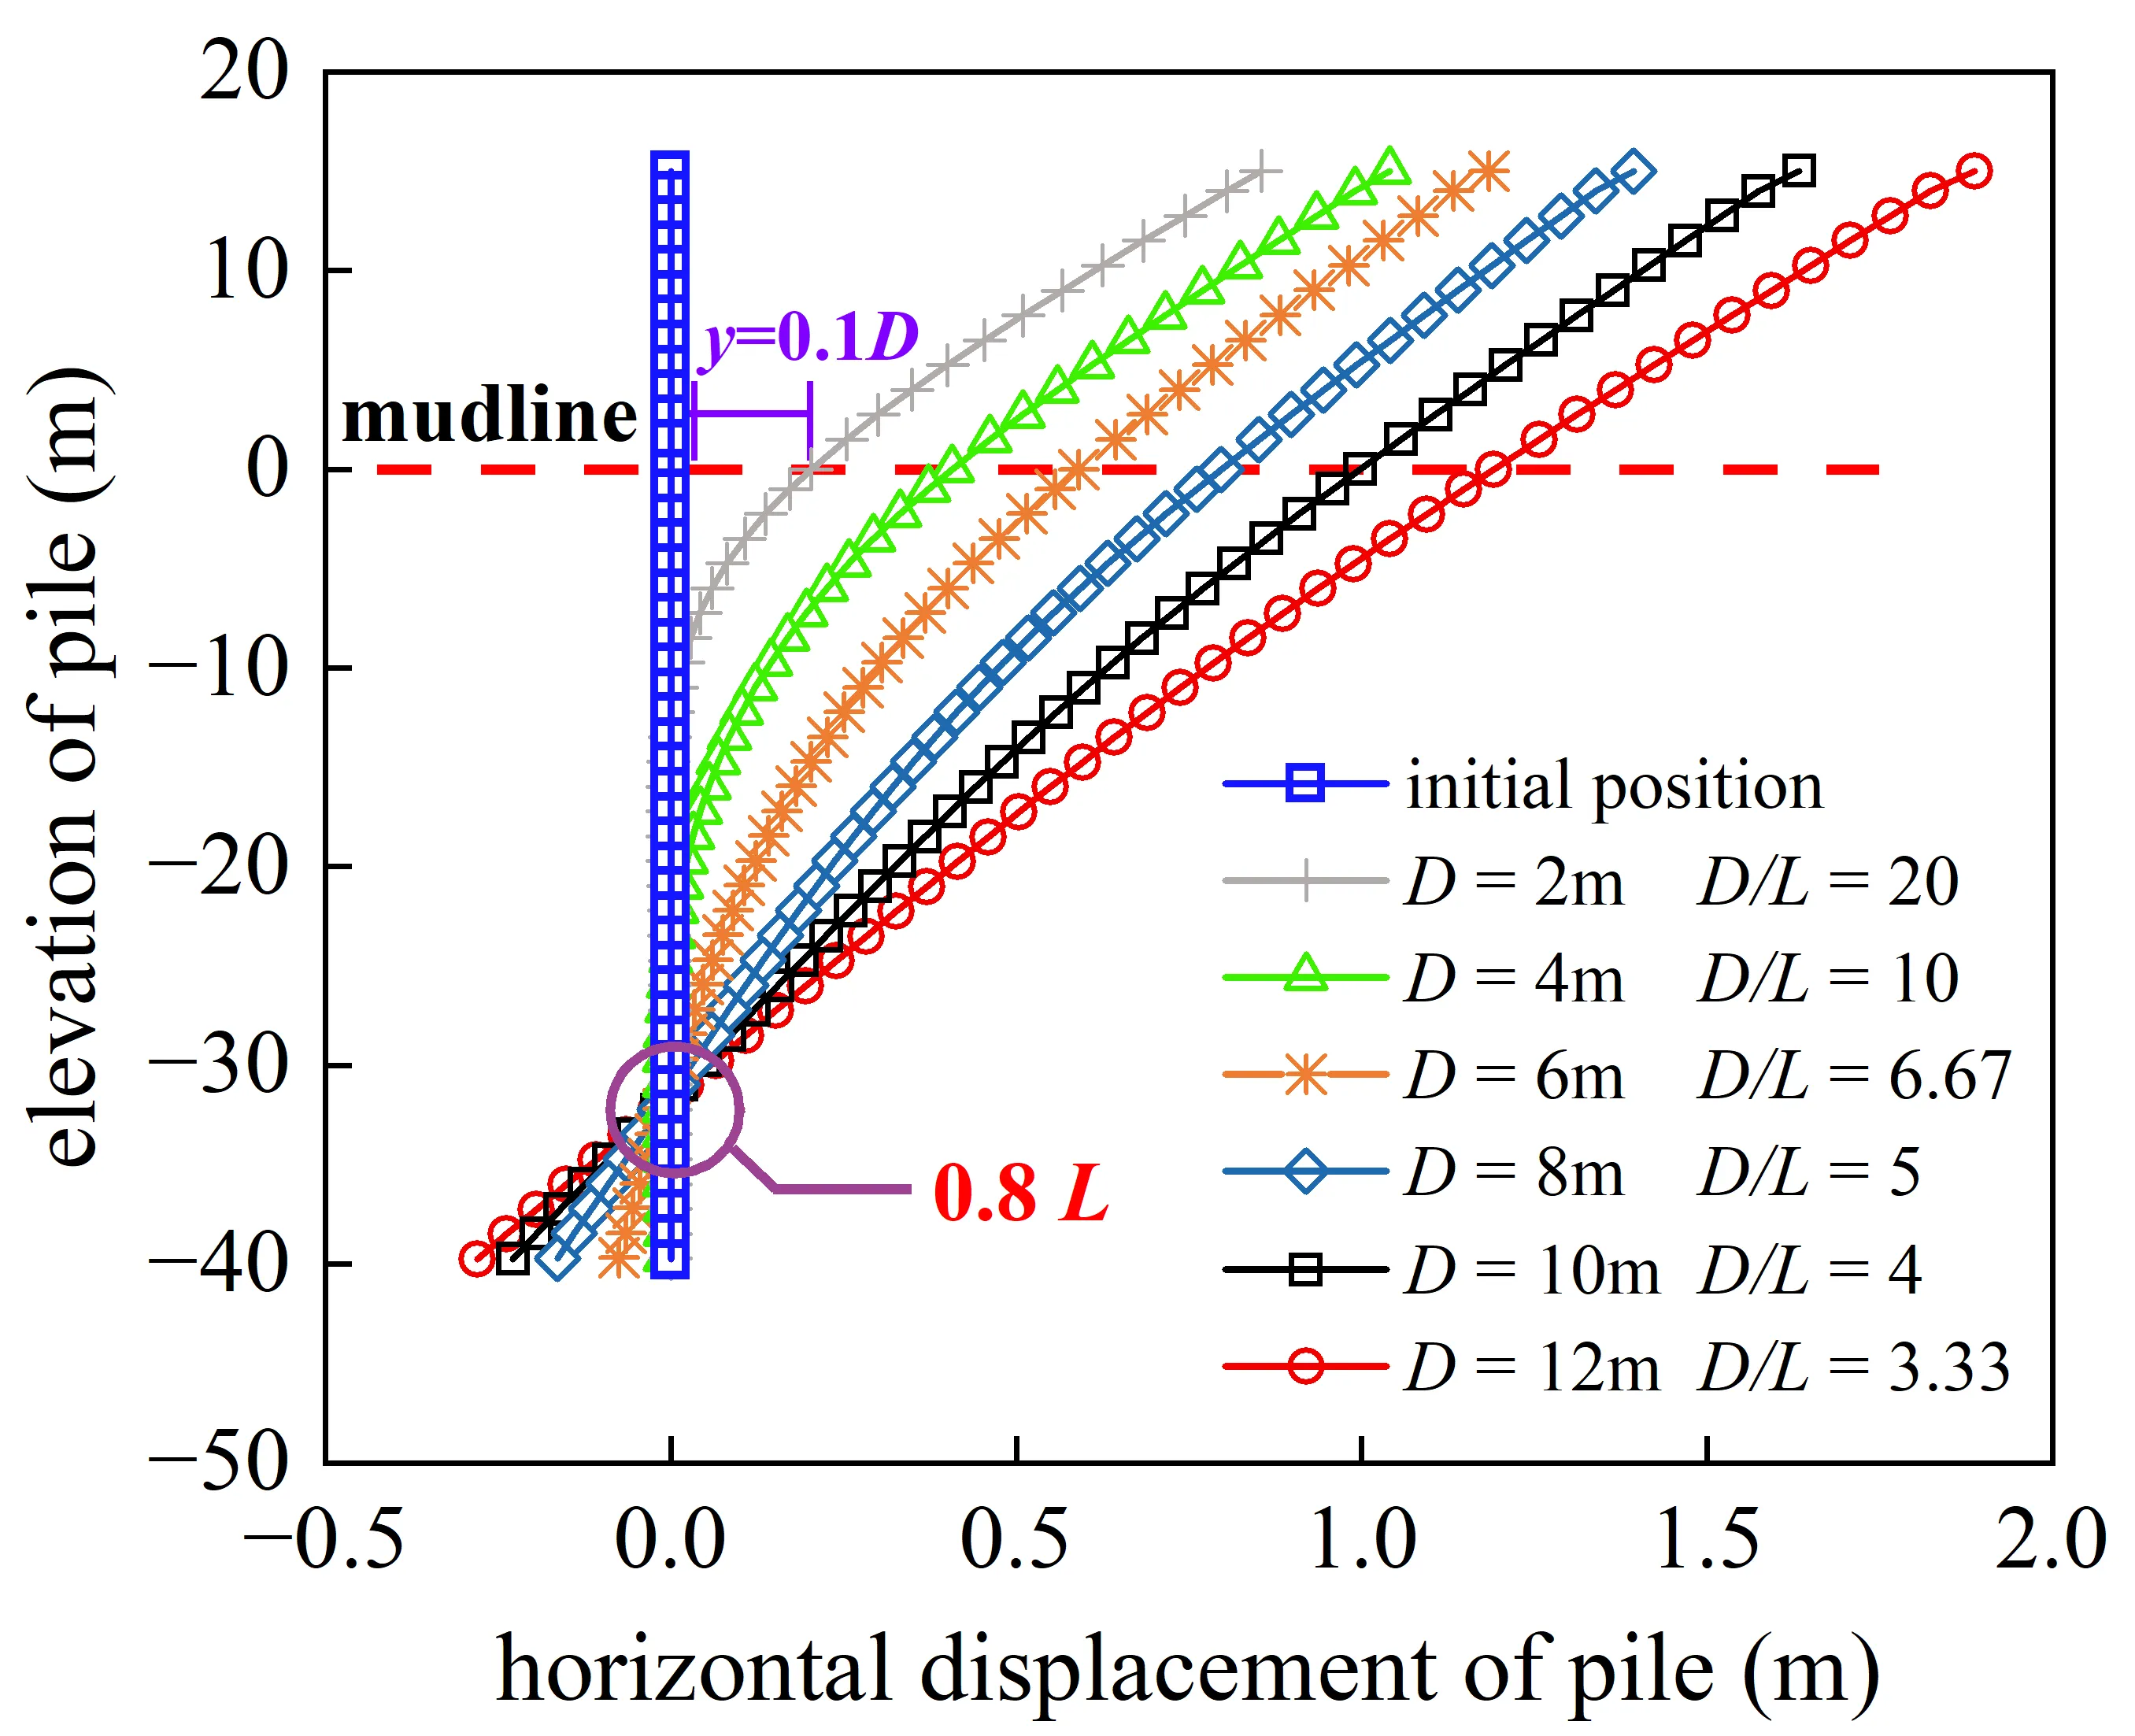
To further investigate the influence of pile diameter on the deformation characteristics of the monopile,
shows the lateral deformation of monopiles with different diameters at
y0 = 0.1
D. It can be seen that for piles with diameters of 2 m and 4 m, due to their low pile-soil relative stiffness, the deformation characteristics behave like the flexible piles; that is, significant bending deformation along the pile and negligible deformation at the pile tip are observed. For piles with diameters of 6 m and 8 m, the increased pile-soil relative stiffness leads to semi-rigid pile deformation characteristics, that is, the pile still has obvious bending deformation, while the pile tip exhibits pronounced “reverse kick”, which results in the entire monopile rotation around one point with no displacement. For piles with diameters of 10 m and 12 m, the rigid pile deformation characteristics are exhibited, that is, there is almost no bending deformation of the pile, the deformation of the pile body is similar to that of semi-rigid piles, rotating around one point with zero displacement.
As the pile diameter increases, the position of the zero displacement point of the flexible pile gradually shifts downwards. When the pile behaves as a semi-rigid or a rigid pile, the position no longer changes with the increase of pile diameter, remains stable at approximately 0.8
L. This indicates that for rigid and semi-rigid piles, the pile diameter (
D) and slenderness ratio (
L/D) have almost no effect on the rotation center position when the loading height (
h) and embedment depth (
L) are identical.
. Lateral deformation of the pile when the pile deflection at the mudline is 0.1<i>D</i>.
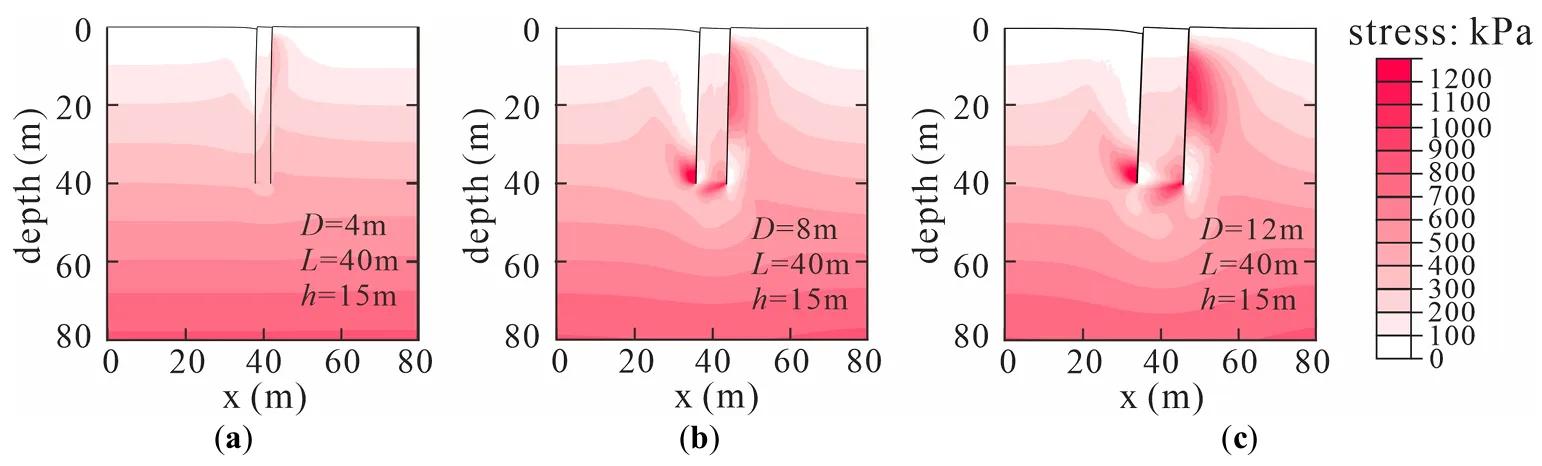
According to the deformation characteristics of the pile, piles with diameters of 4 m, 8 m, and 12 m can represent flexible, semi-rigid, and rigid piles. Therefore, the stress contours and plastic strain distributions of piles with diameters of 4 m, 8 m, and 12 m are compared to investigate the internal stress characteristics of flexible, semi-rigid, and rigid piles. As shown in
, when
y0 = 0.1
D, for flexible piles (
D = 4 m), obvious stress concentration occurs in the soil in front of the pile above the zero-displacement point, while significant stress dissipation develops in the soil behind the pile. The stress level of the soil below the zero-displacement point is not considerably disturbed. Due to the existence of the rotation center points for semi-rigid piles (
D = 8 m) and rigid piles (
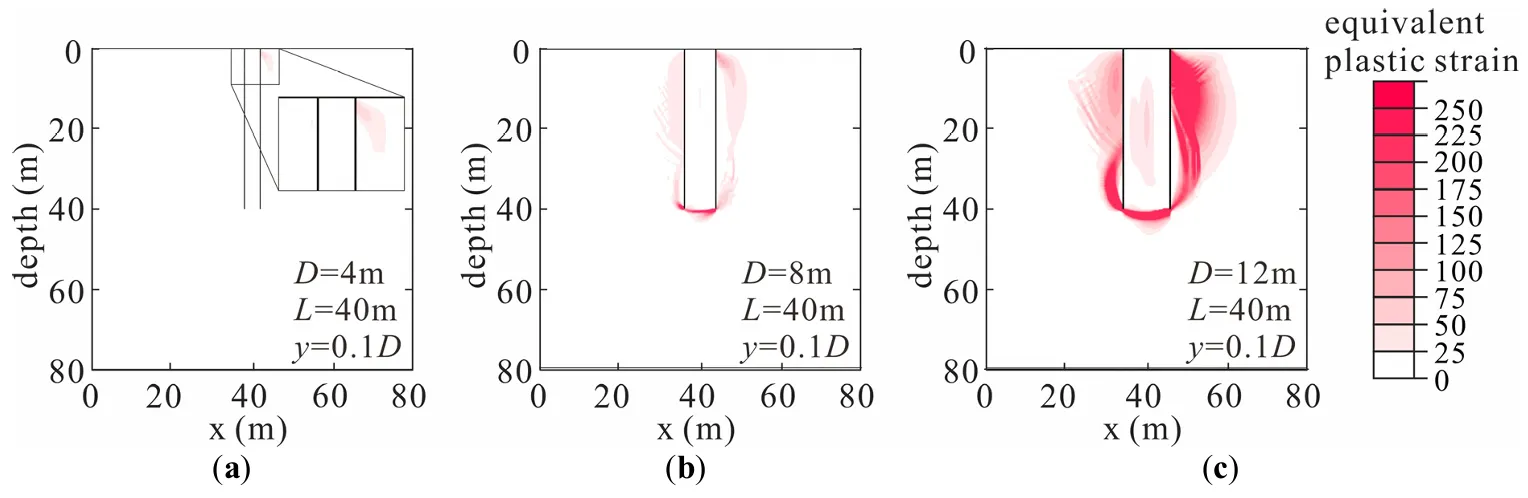
D = 12 m), when horizontal displacement occurs at the pile head, the stress is concentrated in the soil in front of the pile above the rotation center, and the stress behind the pile decreases significantly. Because the pile toe kicks back, the soil below the rotation center experiences stress concentration behind the pile and stress dissipation in front of the pile. Additionally, rigid and semi-rigid piles exhibit pronounced stress concentration zones in the internal soil plug near the pile tip. As shown in
, the arc-shaped equivalent plastic strain zones span the entire base of rigid and semi-rigid piles. This indicates that as the pile rotates, not only does the interaction between the pile and the surrounding sand affect the pile response, but also the interaction between the soil plug inside the pile and the lower sand also provides certain resistance. This mechanism also explains why the load-displacement curves in
exhibit increasingly nonlinear trends with larger pile diameters.
. Contour plots of internal stress in sand corresponding to the <em>y</em><sub>0</sub> = 0.1<em>D</em>: (<strong>a</strong>) <em>D</em> = 4 m; (<strong>b</strong>) <em>D</em> = 8 m; (<strong>c</strong>) <em>D</em> = 12 m.
. Distribution of equivalent plastic strain in sand corresponding to the <em>y<sub>0</sub></em> = 0.1<em>D</em>: (<strong>a</strong>) <em>D</em> = 4 m; (<strong>b</strong>) <em>D</em> = 8 m; (<strong>c</strong>) <em>D</em> = 12 m.
4. Failure Mode and Soil Flow Mechanism of Monopile in Sand
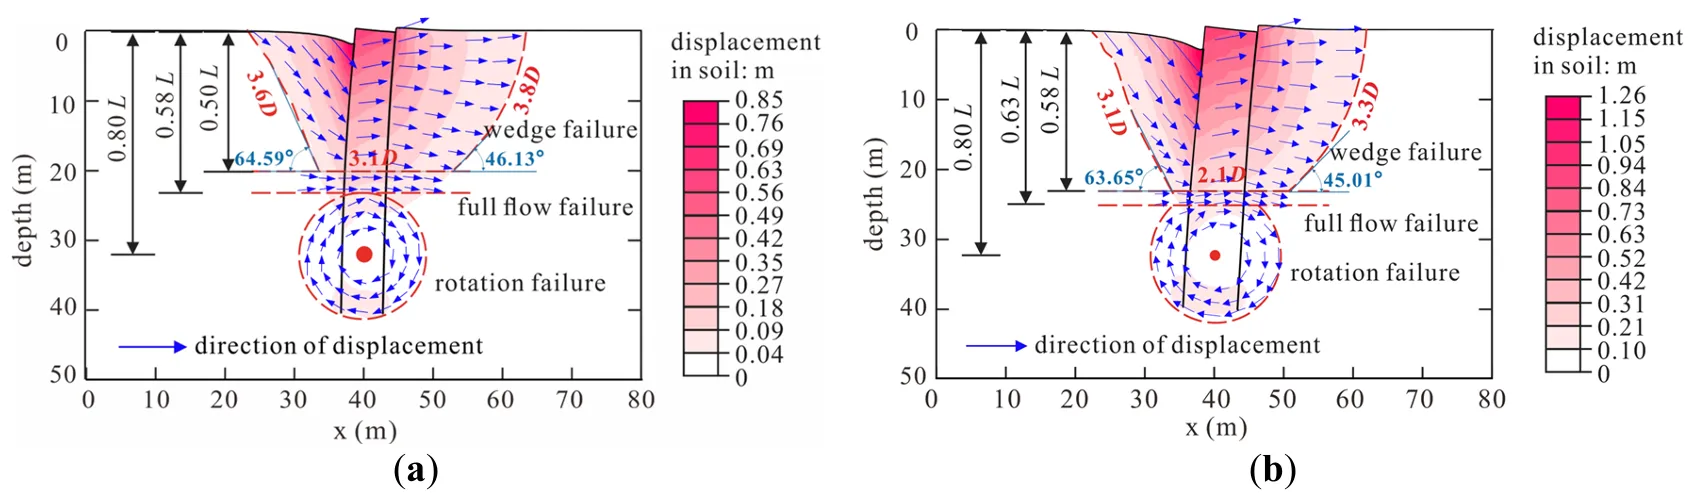
To assess the influence of pile diameter on the failure mechanisms of monopile foundations, displacement contours are comparatively presented in
,
and
for varying pile diameters. The blue arrow in the figures is simplified from the displacement vector field plots of the soil around the pile, which can represent the flow direction of the soil around the pile. In addition, all the figures show the state when the horizontal displacement at the mudline in the passive compression zone in front of the pile reaches 0.1
D
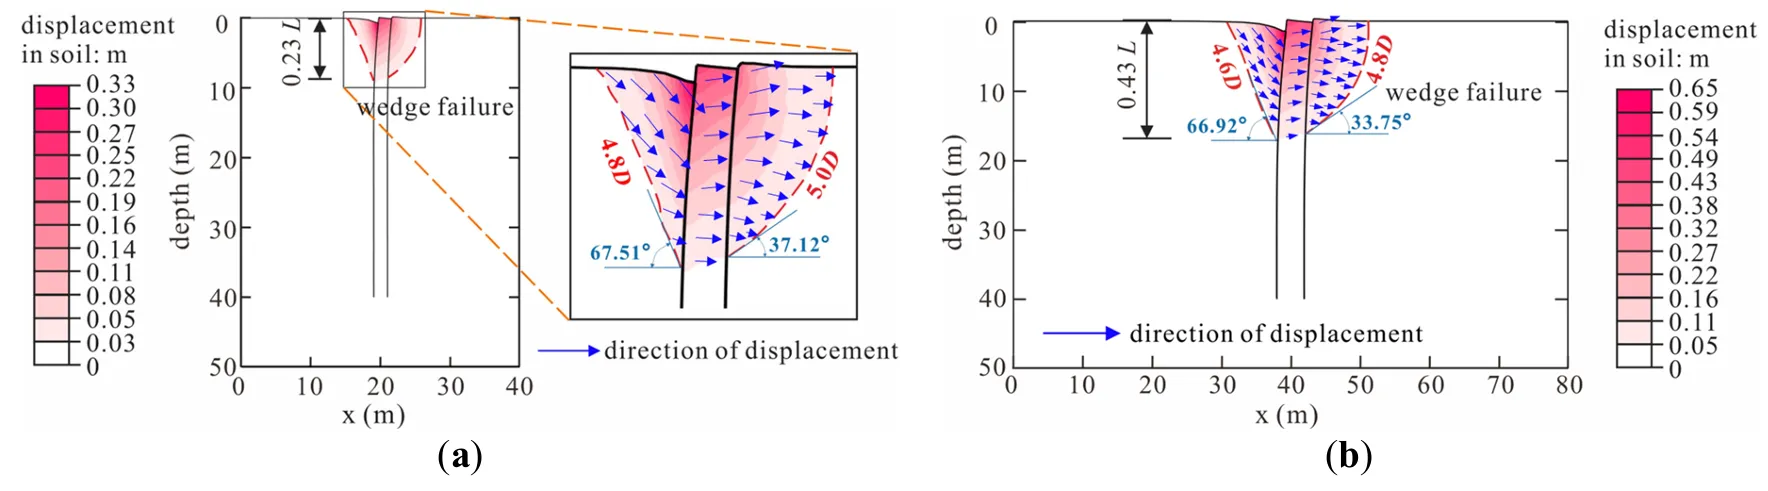
For flexible piles with diameters of 2 m and 4 m (shown in
), the soil around the pile mainly exhibits a single wedge-shaped failure mode. Within a shallow depth below the ground surface, soil in front of the pile flows upward and outward, generating surface heave. Simultaneously, soil separation in the active zone behind the pile induces stress unloading (
) and downward flow toward the pile, causing surface subsidence. The sliding surface angle of the active zone in front of the pile is significantly smaller than that of the passive zone relative to the horizontal direction. With increasing pile diameter, the depth range of the failure zone expands from 0.23
L to 0.43
L, while the total length of the soil slip surface increases from 19.81 m (9.91
D) to 37.88 m (9.47
D). Additionally, the inclination angles of the sliding surfaces in both active and passive zones decrease relative to the horizontal direction.
As the pile diameter increases, when the slenderness ratio (
L/D) decreases to 6.67 (
D = 6 m), the monopile foundation changes from a single zone failure mode to a three-zone failure mode, and the pile exhibits semi-rigid behavior. As shown in
, three distinct failure zones develop: a shallow wedge failure zone, a mid-depth full flow failure zone, and a deep rotational failure zone. This occurs because the soil resistance mobilized solely by bending-induced compression of shallow soil layers becomes insufficient to counteract horizontal loads, necessitating the mobilization of deeper soil layers to provide resistance. And pile bending deformation induces a relatively small transitional full flow failure zone between the wedge and rotational failure zone, characterized by horizontal-dominated soil movement. As the pile diameter increases, the influence range of the wedge failure zone along the depth direction also shows an increasing trend, and the radius of the rotational failure zone remains unchanged, while the range of the full flow failure zone decreases. The rotational and full flow failure zones partially overlap for the pile with a diameter of 8 m (
D = 8 m). This is mainly because when
D = 8 m, the bending deformation of the pile is no longer obvious, approaching the deformation characteristics of a rigid pile. As the pile diameter increases, the trend of change in the inclination angle of the sliding surface is the same as that of flexible piles. The total length of the sliding surface of the soil in the wedge-shaped failure zone changes from 44.63 m (7.4
D) to 51.50 m (6.4
D), and the length of the sliding surface in the full flow failure zone changes from 18.75 m (3.1
D) to 16.75 m (2.1
D)
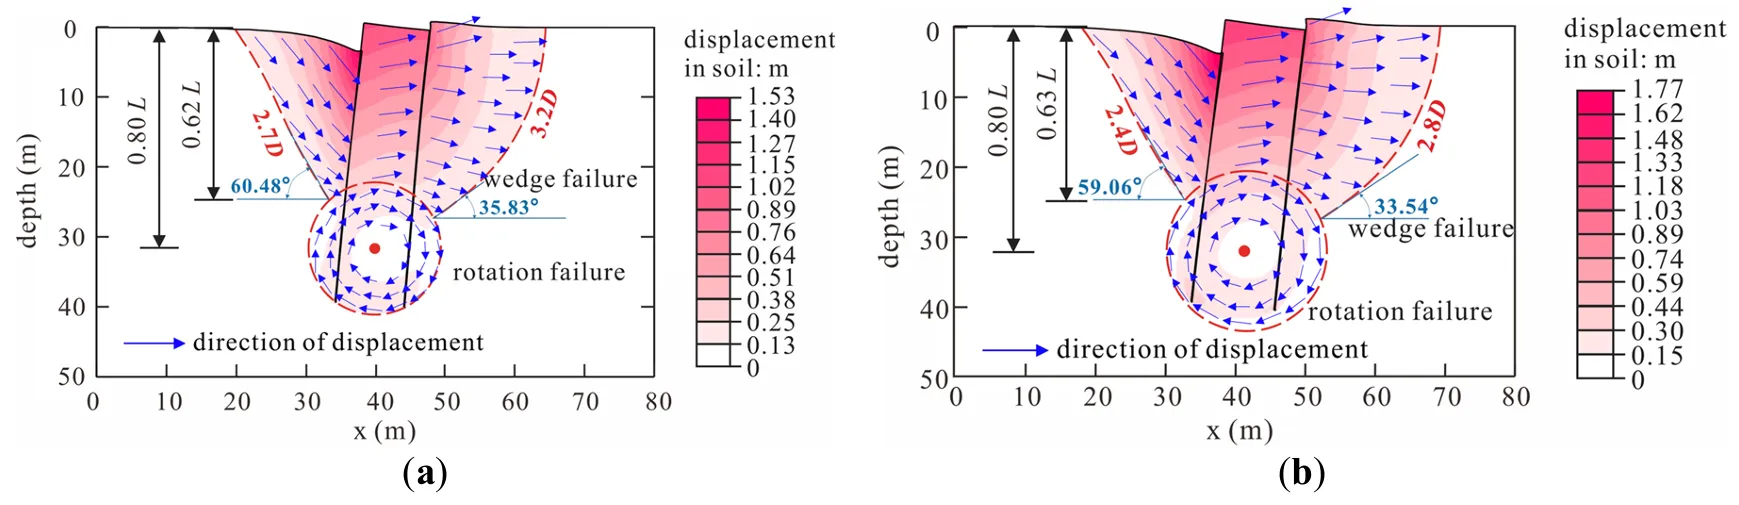
As the pile diameter increases and the slenderness ratio (
L/D) decreases to 4 (
D = 10 m), the monopile foundation exhibits rigid behavior and transitions from a three-zone failure mode to a double-zone failure mode. The full flow failure zone no longer exists, mainly because the rigid piles have almost no bending deformation.
demonstrates that as the pile diameter expands, the influence range of the wedge failure zone along the depth direction basically no longer changes, but the influence radius of the rotational failure zone obviously increases. This is primarily because, under horizontal loading, rigid piles undergo rigid rotation. A plie with a larger diameter requires mobilization of deeper and broader soil regions to restrict pile deformation. And the inclination angle of the slip surface also shows a decreasing trend, with the total length of the slip surface changing from 60.3 m (6.0
D) to 62.26 m (5.2
D).
. Displacement contours and soil flow mechanism of flexible piles: (<strong>a</strong>) <em>D</em> = 2 m; (<strong>b</strong>) <em>D</em> = 4 m.
. Displacement contours and soil flow mechanism of semi-rigid piles: (<strong>a</strong>) <em>D</em> = 6 m; (<strong>b</strong>) <em>D</em> = 8 m.
. Displacement contours and soil flow mechanism of rigid piles: (<strong>a</strong>) <em>D</em> = 10 m; (<strong>b</strong>) <em>D</em> = 12 m.
5. The Effect of Pile Diameter on the p-y Curve
The previous conclusion shows that as the pile diameter increases, the monopile gradually changes from a flexible pile to a rigid pile, and the failure mode also changes. Therefore, the API
p-y curve method, though currently the most widely adopted approach in offshore foundation design, will no longer be applicable as it was proposed based on test results of small-diameter flexible piles. Hence, this section provides a detailed comparison between the results of the API
p-y curve and the FEM
p-y curve to quantitatively analyze the influence of pile diameter effect and failure mode on the
p-y curve.
5.1. Comparison of p-y Curves Calculated by API and Finite Element Simulation
The following is the recommended
p-y curve in API [
19]:
where,
p is the horizontal soil resistance, kN/m;
y is the horizontal displacement, m;
D is the pile diameter, m; $$p_{u}$$ is the ultimate bearing capacity at depth
z, kN/m; $$k$$ is the initial modulus of subgrade reaction, kN/m
3, related to the internal friction angle $$\varphi$$ or relative density of soil;
A is the factor to account for cyclic or static loading conditions; $$C_{1} , C_{2}$$ and $$C_{3}$$ are coefficients that vary with the internal friction angle $$\varphi$$.
Since the soil resistance $$p$$ around the pile is a combined result of radial normal stress and circumferential shear stress at the pile-soil interface, it cannot be directly obtained in Abaqus. Some researchers [
47,
48,
49] have proposed deriving $$p$$ based on beam bending theory, using the relationship between pile horizontal displacement $$y$$, bending moment $$M$$, and soil resistance $$p$$, followed by multiple differentiation. This analytical method is simple and convenient, but multiple differentiation introduces certain errors, especially when the finite element mesh is coarse, reducing the accuracy of $$p$$. Therefore, in this study, $$p$$ is obtained by extracting the stress at gauss integration points of soil elements closest to the pile-soil interface and integrating it circumferentially [
15,
50,
51].
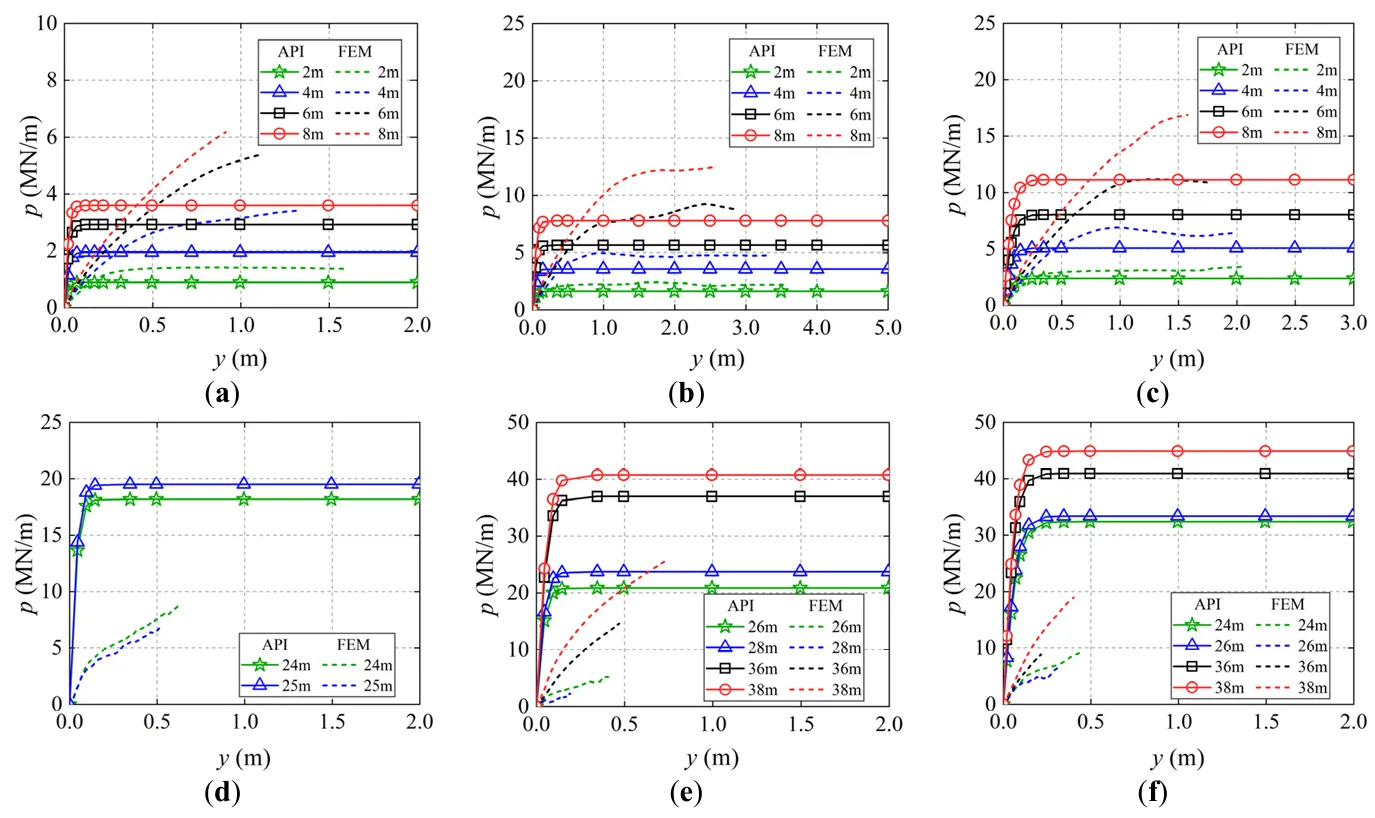
shows the API
p-y curves and FEM
p-y curves at different depths for monopiles with diameters of 4 m, 8 m, and 12 m when the horizontal displacements at the mudline increase to 0.2
D~0.5
D, which exceed the serviceability limit state correcting to 0.1
D. It can be observed that even when the mudline displacement far exceeds 0.1
D, the
p-y curves of deeper soil layers do not reach their ultimate values. For the
p-y curves for plies with the same pile diameters, the ultimate soil resistance has a significant depth dependence, with an increasing trend with depth, mainly related to the higher stress state of deeper soil layers. A big difference is obtained for
p-y curves based on API and finite element simulation. The possible reason is that the
p-y curve model in the API is based on the test results of small-diameter flexible piles [
17,
18], there is a defect of overestimating the initial stiffness and underestimating the ultimate soil resistance when it is used for the analysis of large diameter flexible piles, semi-rigid piles, and rigid piles. Due to the API recommended hyperbolic tangent backbone curves, the ultimate soil resistance is reached at a horizontal displacement of
y = 0.1 m, which is very inconsistent with the actual soil resistance behavior, especially when the horizontal displacement is small.
. <em>p-y</em> curves of monopiles with different pile diameters at different depths: (<strong>a</strong>) $$D = $$4 m, within the depth of wedge failure; (<strong>b</strong>) $$D = $$8 m, within the depth of wedge failure; (<strong>c</strong>) $$D = $$12 m, within the depth of wedge failure; (<strong>d</strong>) $$D = $$8 m, within the depth of full flow failure; (<strong>e</strong>) $$D = $$8 m, within the depth of rotation failure; (<strong>f</strong>) $$D = $$12 m, within the depth of rotation failure.
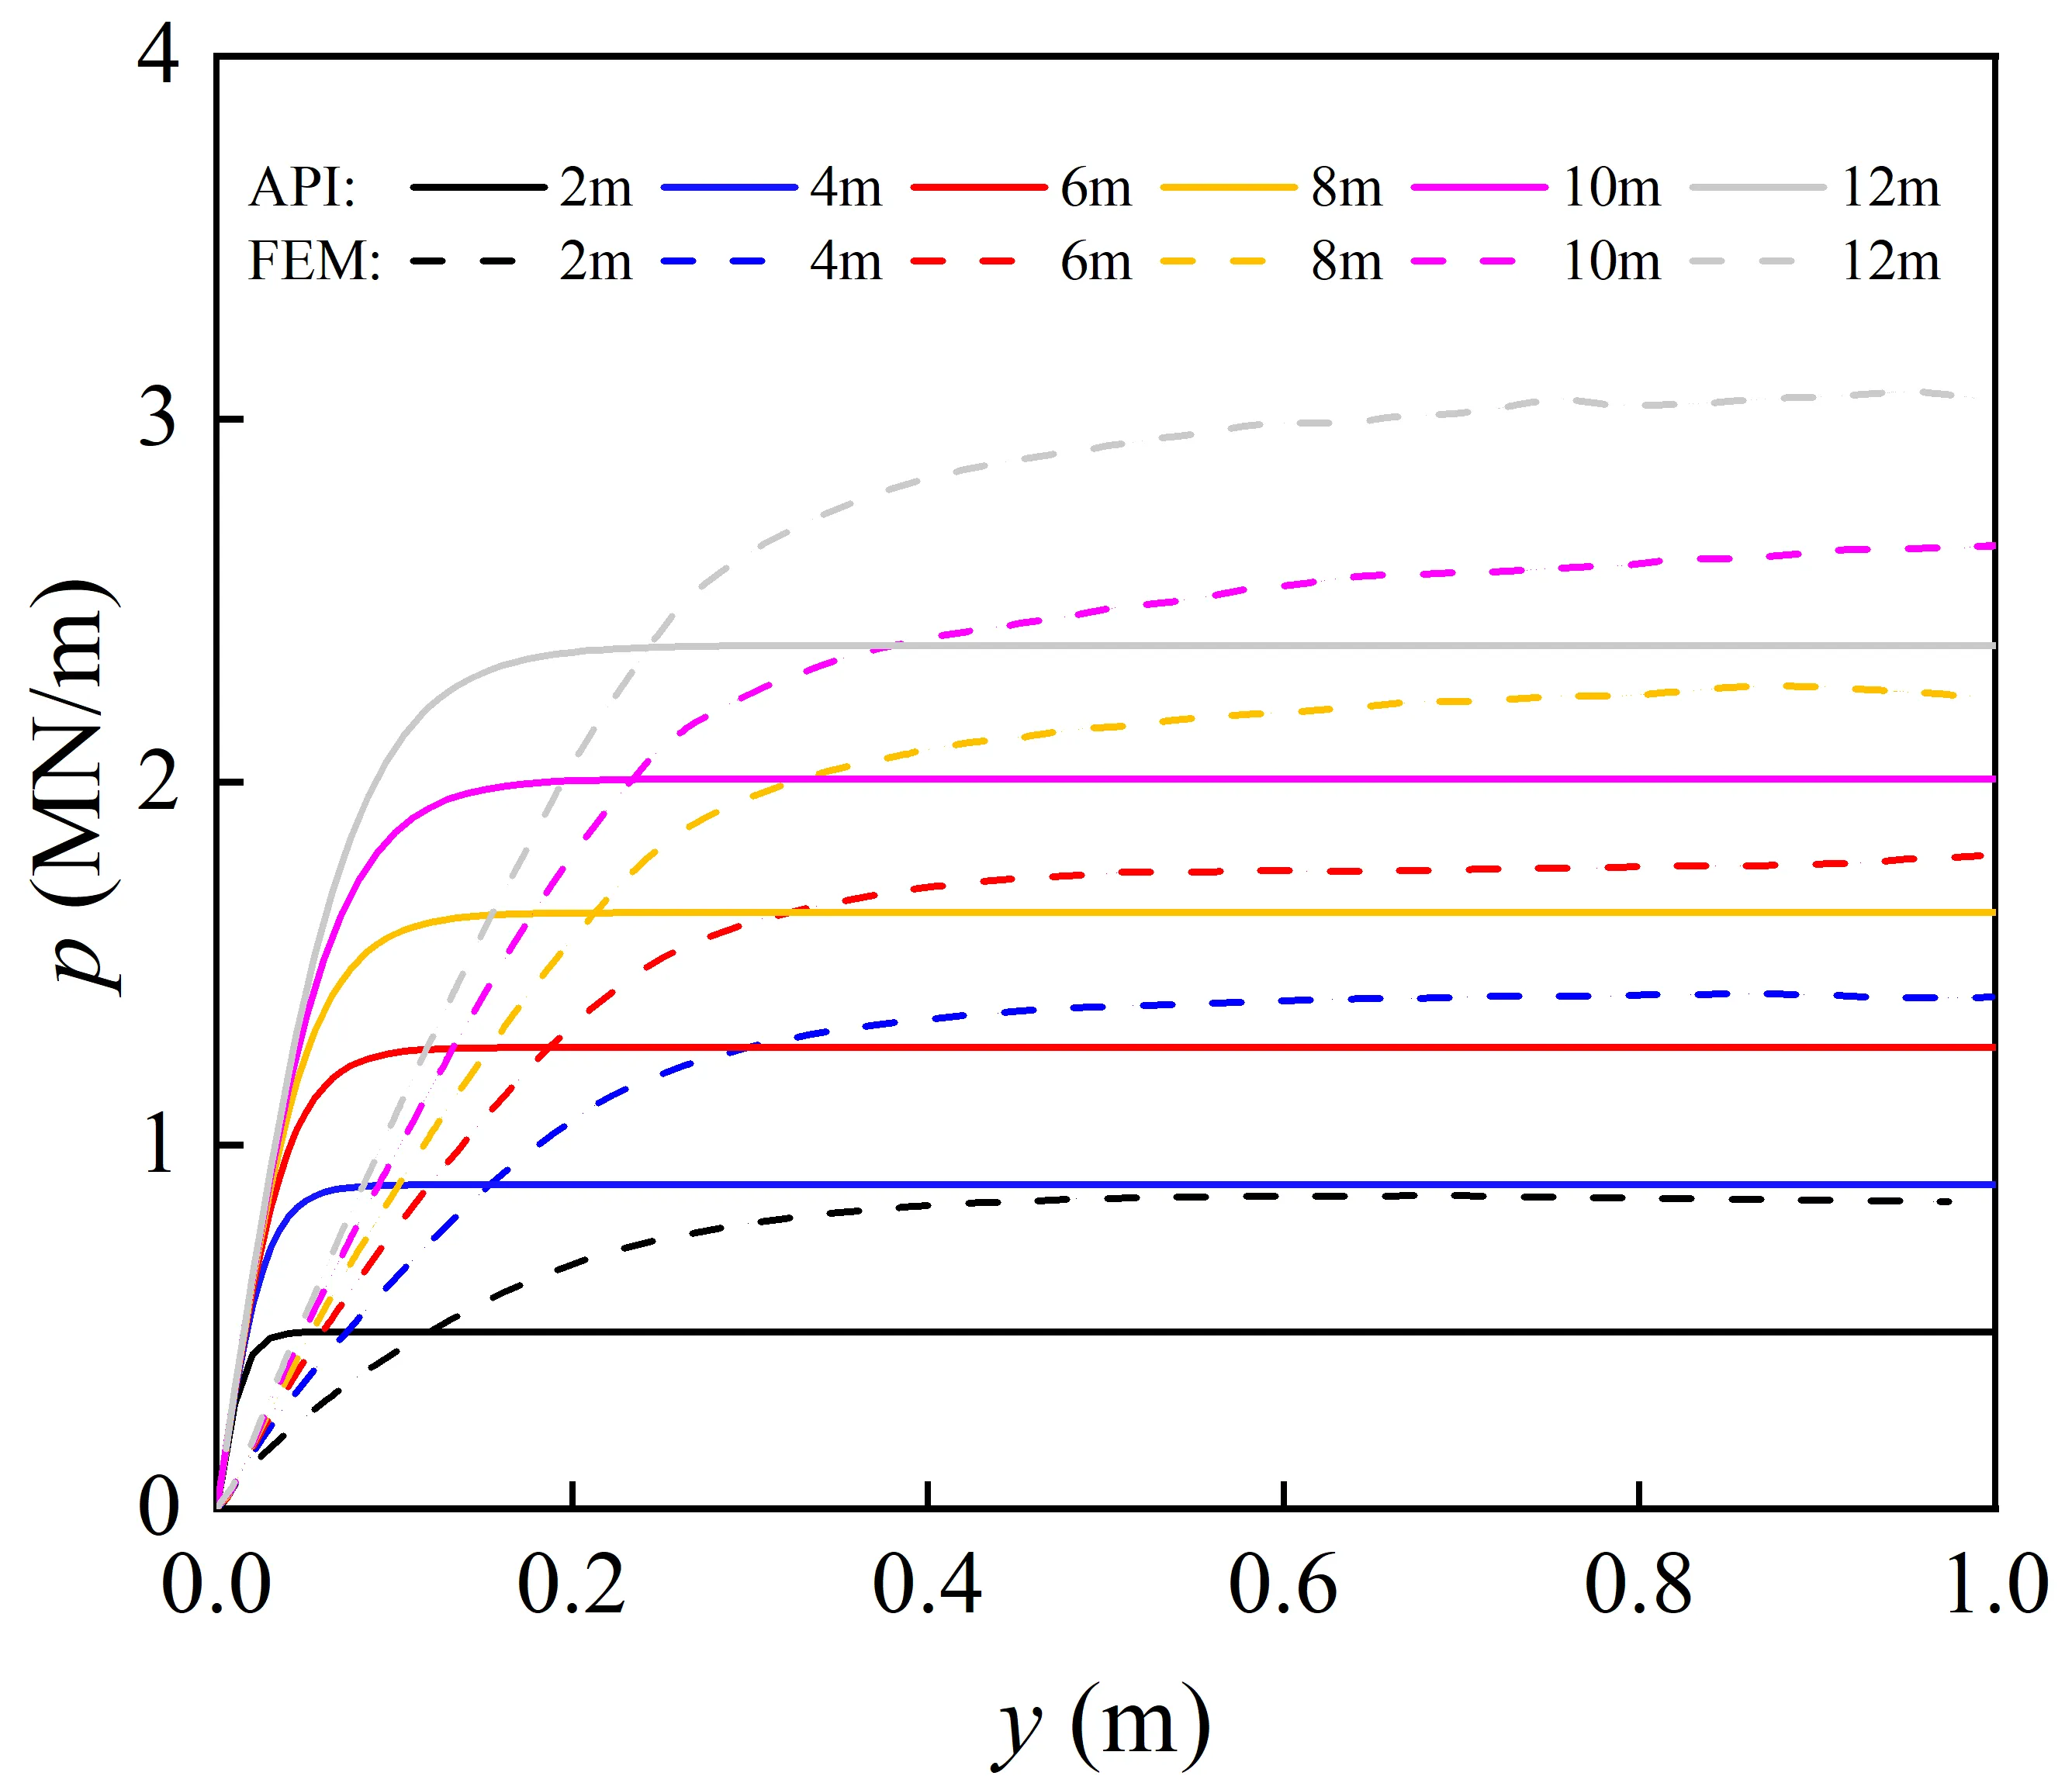
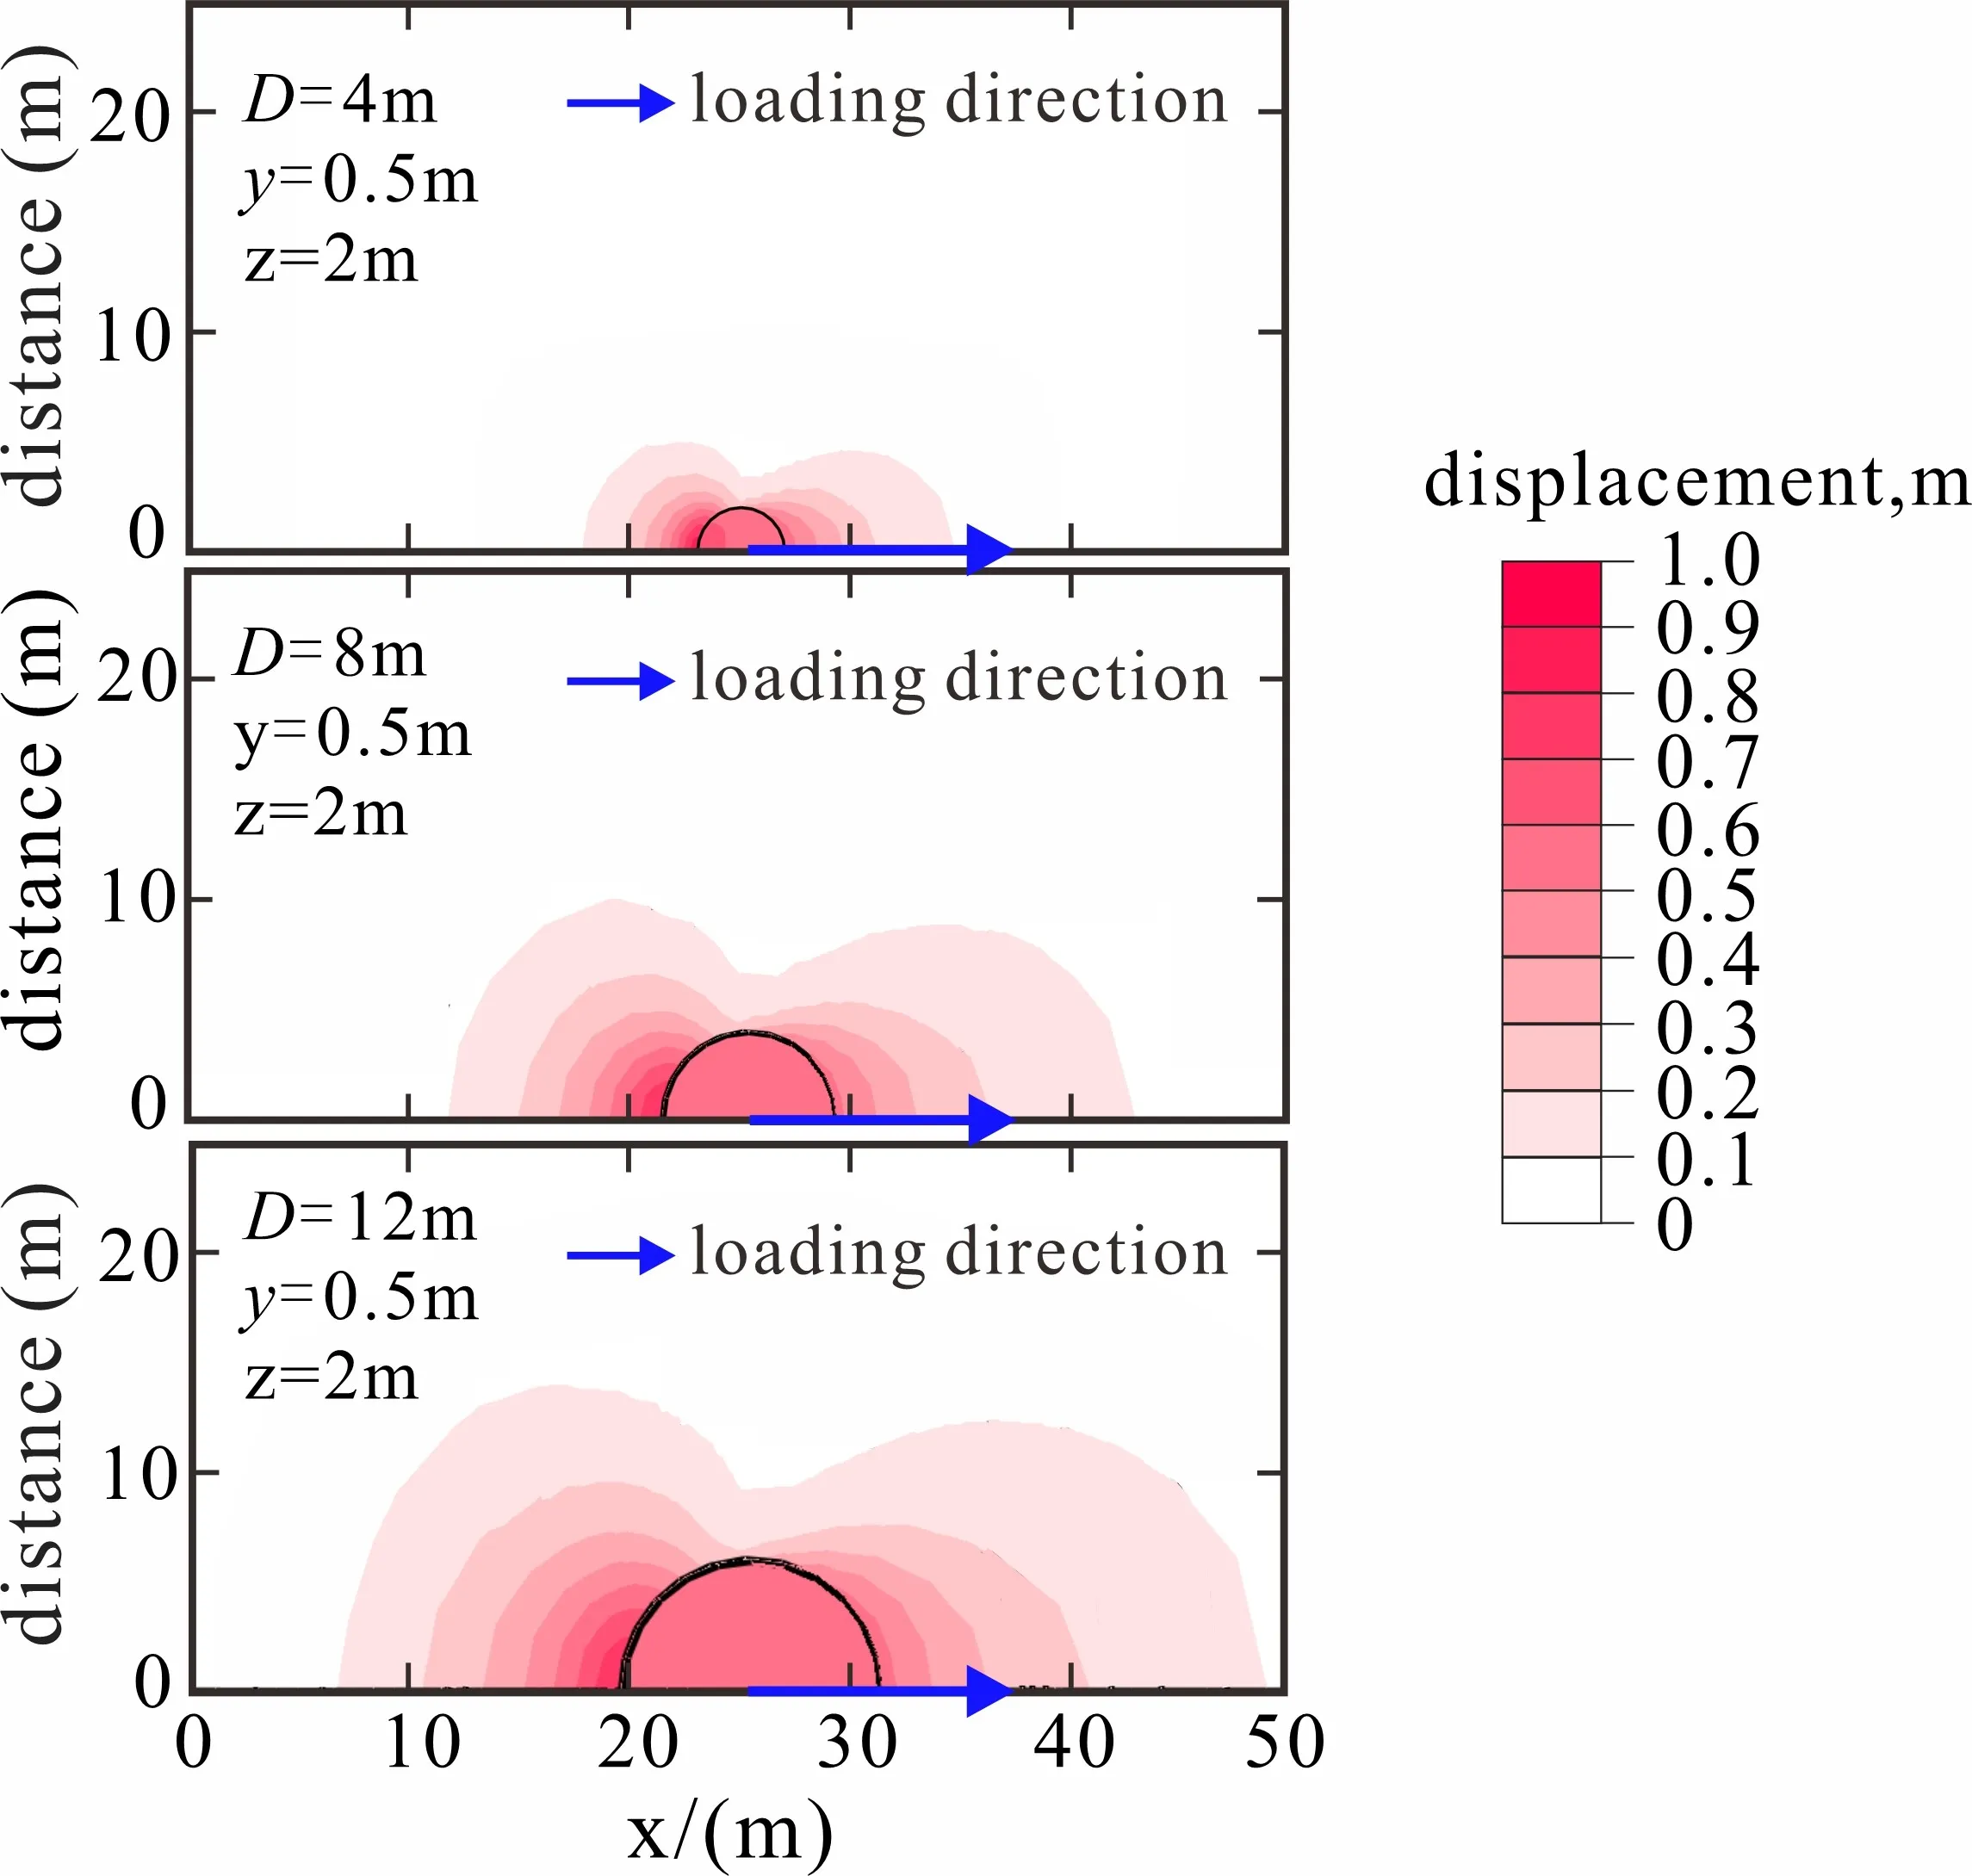
The
p-y curve at z = 2 m, where the
p-y curve is relatively complete and has reached the inflection point, as a representative study to further analysis the influence of pile diameter on the
p-y curve. As shown in
, the inflection point of the
p-y curve is generally reached at about the same horizontal displacement at
y = 0.5 m, and after this the change rapidly decreases. Both the initial stiffness and the ultimate soil resistance increase with pile diameter. This is because, at the same horizontal displacement, a larger-diameter pile can mobilize a greater volume of surrounding soil to provide resistance, as clearly shown in
, where the influence range of the surrounding soil increases with pile diameter.
. API <em>p-y</em> curves and FEM <em>p-y</em> curves for different pile diameters at z = 2 m.
. The displacement contours at z = 2 m when <i>y</i> = 0.5 m.
To further analyze the limitations of API
p-y curve method,
provides detailed calculation results of the ultimate soil resistance obtained from API and FEM. Due to the fact that the
p-
y curve has not reached the ultimate soil resistance value when the depth exceeds 6 m, only the results with z = 2, 4, 6 m are listed in the table. By observing the data, it can be seen that, the underestimation by the API becomes more pronounced as the pile diameter increases. The limitations of the API
p-y curve exhibit obvious diameter dependency. Even in shallow areas, the API underestimates the ultimate soil resistance by at least 20%.
.
Comparison Table of API and FEM ultimate bearing capacity results.
| Pile Diameter (m) |
z = 2 m |
z = 4 m |
z = 6 m |
| API (MN) |
FEM (MN) |
Underestimation (MN) |
API (MN) |
FEM (MN) |
Underestimation (MN) |
API (MN) |
FEM (MN) |
Underestimation (MN) |
| 2 |
0.49 |
0.84 |
0.35 |
0.90 |
1.53 |
0.63 |
1.14 |
1.96 |
0.82 |
| 4 |
0.89 |
1.40 |
0.51 |
1.95 |
3.15 |
1.20 |
2.93 |
5.18 |
2.25 |
| 6 |
1.27 |
1.80 |
0.53 |
2.78 |
3.77 |
0.99 |
4.38 |
6.71 |
2.33 |
| 8 |
1.64 |
2.24 |
0.60 |
3.57 |
4.77 |
1.20 |
5.66 |
8.04 |
2.38 |
| 10 |
2.01 |
2.65 |
0.64 |
4.33 |
5.59 |
1.26 |
6.86 |
9.71 |
2.85 |
| 12 |
2.38 |
3.06 |
0.68 |
5.08 |
6.80 |
1.72 |
8.02 |
11.20 |
3.18 |
5.2. Effect of Failure Mode on Initial Stiffness of p-y Curve
As the pile diameter increases, the failure modes of monopiles evolve, resulting in significantly different flow mechanisms of the surrounding soil along the depth direction. This will inevitably affect the mobilization process of the surrounding soil resistance of the pile. The initial stiffness, as one of the key parameters in the
p-y curve method, plays a significant role in accurately characterizing pile-soil interactions. Therefore, this section further investigates the influence of failure modes on the initial stiffness of
p-y curves.
The API assumes that the initial stiffness
K varies linearly with depth as follows,
where,
z is the depth, and the initial modulus of soil reaction
k is related to the internal friction angle $$\varphi$$ in the API by the following explicit expression [
52],
From the API
p-y formulation, it can be seen that the API does not consider the influence of pile diameter and failure mode on the initial stiffness of the
p-y curve. Based on the
p-y curve extracted at different depths, the secant modulus of the initial segment of the curve is taken as the initial stiffness of the
p-y curve, and the results are shown in
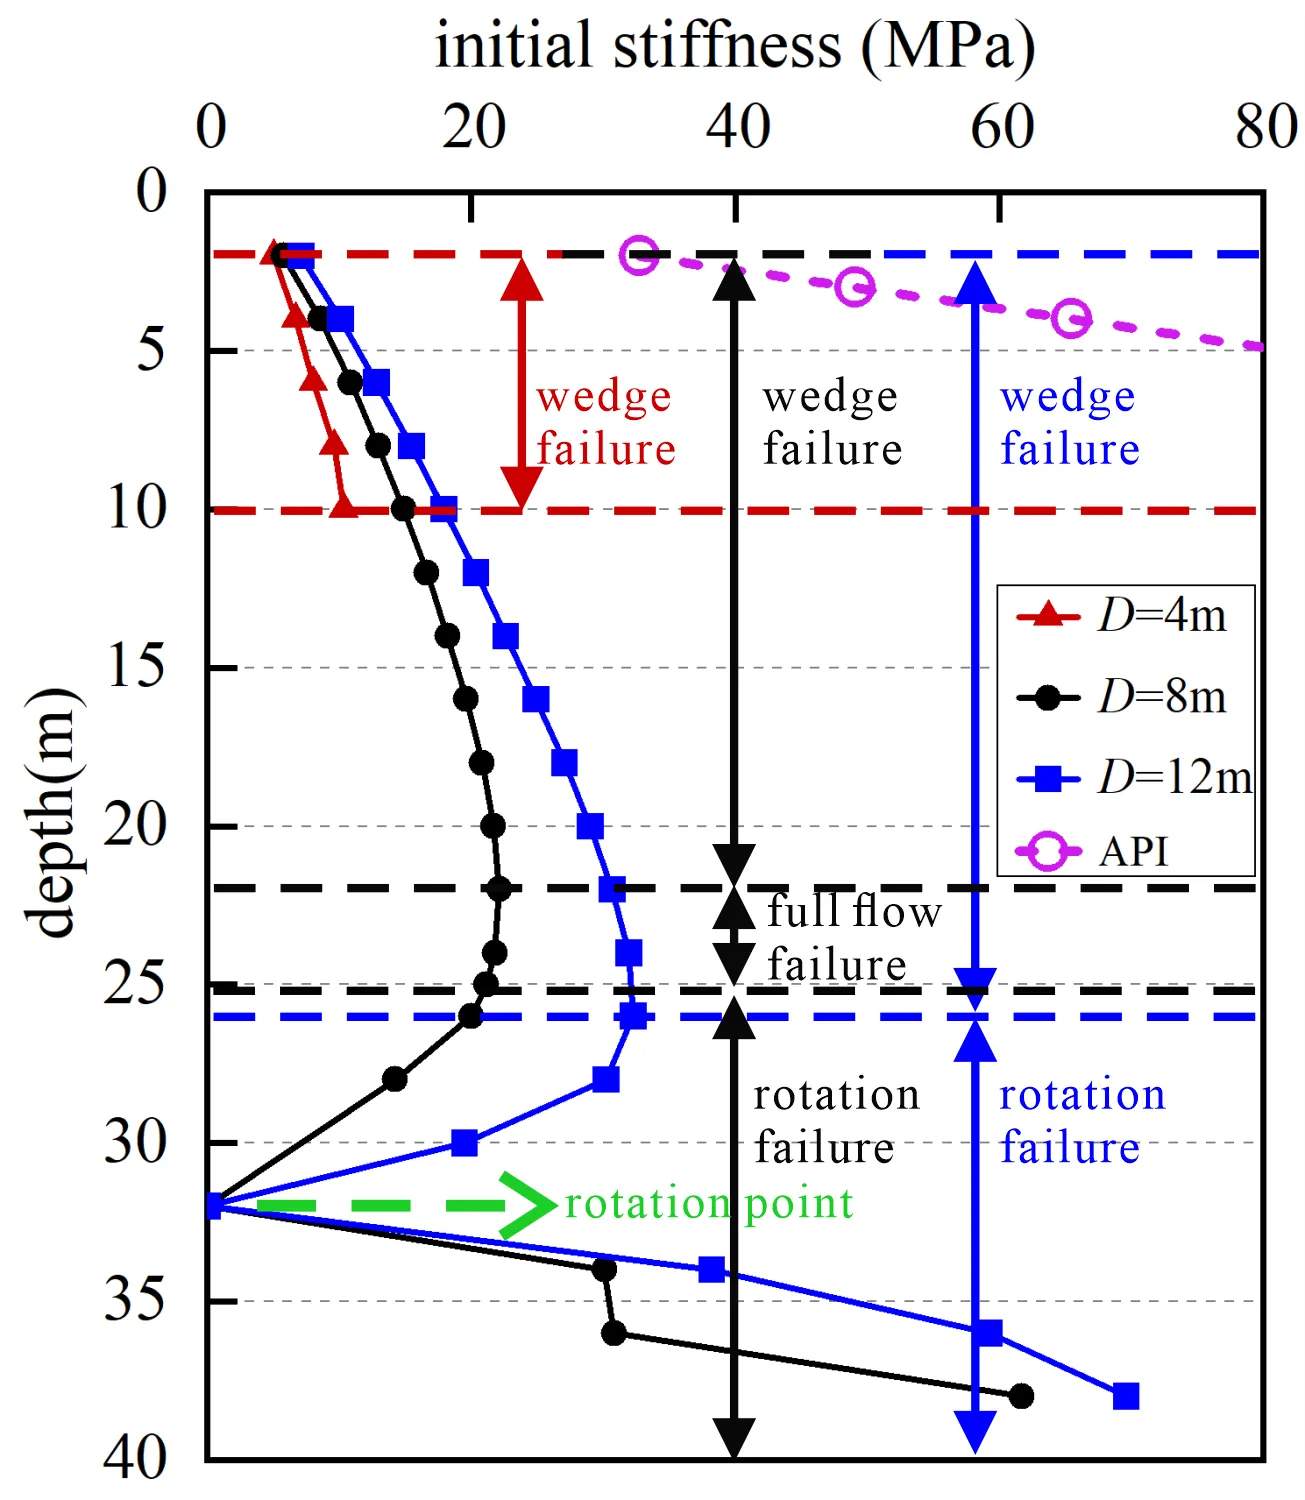
. It can be seen that the initial stiffness has a significant dependence on the pile diameter, that is, the initial stiffness increases with pile diameter, because a larger diameter results in a larger pile-soil contact area and mobilizes a greater volume of surrounding soil. If the initial stiffness calculation method in the API is used, it will overestimate the initial stiffness by more than 5 times, and the overestimation will also increase with depth.
. Initial stiffness of <i>p</i>-<i>y</i> curves at different depths for piles with different diameters.
From the results of FEM, it can be seen that with the increase in the depth, the initial stiffness exhibits an obvious nonlinear variation. Within the depth range of the wedge failure zone, the initial stiffness increases with increasing depth. In the range of the full flow failure zone, the initial stiffness decreases with the increase of the depth, though the amplitude of the change is relatively small. In the rotational failure zone, the initial stiffness shows a distinct two-stage distribution: above the rotation center, the initial stiffness decreases with depth until reaching zero at the rotation center point (assuming
K = 0 since
y = 0 at the rotational center point); below the center of rotation, as the depth increases, the initial stiffness increases approximately linearly and rapidly, with a significantly higher rate of increase than in the shallow wedge failure zone. It can be concluded that the initial stiffness also has a considerable dependence on the failure mode. This is mainly due to the different soil flow mechanisms for different failure modes, and the mobilized ranges of soil are also different, which affects the process of exerting soil resistance around the pile. In summary, the initial stiffness simultaneously exhibits pile diameter dependence, depth dependence, and failure mode dependence.
6. Conclusions
In the study, a three-dimensional finite element model is established to investigate the influence of pile diameter on the failure mode and pile-soil interaction for a large-diameter monopile subjected to lateral load. Although the study did not consider the effects of pore water pressure and cyclic loading, the results can still provide valuable insights for improving the design method of horizontally loaded piles. The main conclusions are as follows.
- (1)
-
As the pile diameter increases, the deformation characteristics of the monopile transits from flexible to semi-rigid and then to rigid piles. When the embedment depth (L) and loading height (h) are the same, the position of the zero displacement point of semi-rigid and rigid piles remains approximately constant at 0.8L.
- (2)
-
Large pile diameter results in the monopile’s great lateral bearing capacity. The deformations of flexible, semi-rigid, and rigid piles lead to significantly different stress distributions in the surrounding soil above and below the zero-displacement point. Due to the interaction between the internal soil plug and the surrounding sand in semi-rigid and rigid piles, an approximately arc-shaped plastic strain zone penetrates the entire foundation base. This also leads to the nonlinear characteristic of the lateral load-displacement response becoming more pronounced as the pile diameter increases.
- (3)
-
The failure modes are changed with increasing pile diameter. The flexible pile in sand with a small pile diameter (D/L = 10–20) shows single wedge failure mode, the semi-rigid pile with relatively large pile diameter (D/L = 5–6.67) presents wedge failure mode, full flow failure mode, and rotation failure mode, and the rigid pile with large pile diameter (D/L = 3.33–4) develops wedge failure mode and rotation failure mode. As the pile diameter increases, the wedge failure zone extends deeper. The extent of the full flow failure zone in semi-rigid piles gradually decreases as the bending deformation of the pile diminishes. For rigid piles, as the pile diameter increases, the depth range of the wedge failure zone remains almost unchanged, but the rotational failure zone mobilizes a larger volume of deeper soil.
- (4)
-
For large-diameter piles, the API p-y curve overestimates the initial stiffness by at least five times. It underestimates the ultimate soil resistance by more than 20%, which is inconsistent with the actual soil resistance behavior. This leads to overly conservative design results and is not conducive to cost savings. The underestimation of ultimate soil resistance becomes more pronounced as the pile diameter increases. The failure mode will significantly affect the initial stiffness of the p-y curve. The initial stiffness simultaneously exhibits pile diameter dependence, depth dependence, and failure mode dependence. It is recommended that future modifications of p-y curves should place particular emphasis on the influence of failure modes.
Author Contributions
Conceptualization, Y.W. and Y.G.; Methodology, Y.W. and Y.G.; Software, Y.W.; Validation, Y.G. and Q.Y.; Formal analysis, Y.W.; Investigation, Y.G.; Resources, Y.G.; Data Curation, Y.W.; Writing—Original Draft Preparation, Y.W.; Writing—Review and Editing, Y.G.; Visualization, Y.W., K.S., Y.J. and L.S.; Supervision, Y.G.; Project Administration, Y.G.; Funding Acquisition, Y.G. All authors have read and agreed to the published version of the manuscript.
Ethics Statement
Not applicable.
Informed Consent Statement
Not applicable.
Data Availability Statement
Data are contained within the article.
Funding
This research was funded by National Key R&D Program of China (2022YFC3005203) and National Natural Science Foundation of China (42072295).
Declaration of Competing Interest
The authors declare that they have no known competing financial interests or personal relationships that could have appeared to influence the work reported in this paper.
References
-
1.
Zhang X, Hu Z, Mu L, Tian W, Zhang Y, Huang P. Nonlinear Investigation of Laterally Loaded Piles in Layered Sand with a Modified Conical Strain Wedge Model.
Ocean Eng. 2023,
272, 113874. doi:10.1016/j.oceaneng.2023.113874.
[Google Scholar]
-
2.
Li T, Liang C, Liu R. Bearing Capacity Profile for Laterally Loaded Piles in Clay.
Ocean Eng. 2025,
318, 120109. doi:10.1016/j.oceaneng.2024.120109.
[Google Scholar]
-
3.
Zhang F, Dai G, Li X, Xu F, Gong W. Numerical Solution for the Laterally Loaded Rigid Piles Considering Resisting Force and Moment under Combined Loadings.
Ocean Eng. 2024,
292, 116225. doi:10.1016/j.oceaneng.2023.116225.
[Google Scholar]
-
4.
Wang L, Wu W, Zhang Y, Li L, Liu H, Naggar MHE. Nonlinear Analysis of Single Pile Settlement Based on Stress Bubble Fictitious Soil Pile Model.
Num. Anal. Meth. Geomech. 2022,
46, 1187–1204. doi:10.1002/nag.3341.
[Google Scholar]
-
5.
Wang L, Liu X, Wu W, El Naggar MH, Mei G, Wen M, et al. Nonlinear Analysis of Laterally Loaded Single Pile in Layered Soil Based on Conical Strain Wedge Model.
Ocean Eng. 2023,
280, 114699. doi:10.1016/j.oceaneng.2023.114699.
[Google Scholar]
-
6.
Gong X, Wang L. Offshore Geotechnical Engineering, 1st ed.; China Architecture and Building Press: Beijing, China, 2022; pp. 245–261.
-
7.
Ai ZY, Wang DS, Zhao YZ, Li PC. Laterally Loaded Piles and Pile Groups Partially Embedded in Transversely Isotropic Fractional Viscoelastic Saturated Soils.
Eng. Anal. Bound. Elem. 2023,
146, 824–837. doi:10.1016/j.enganabound.2022.11.007.
[Google Scholar]
-
8.
Malekjafarian A, Jalilvand S, Doherty P, Igoe D. Foundation Damping for Monopile Supported Offshore Wind Turbines: A Review.
Mar. Struct. 2021,
77, 102937. doi:10.1016/j.marstruc.2021.102937.
[Google Scholar]
-
9.
Sun Y. Experimental and Numerical Studies on a Laterally Loaded Monopile Foundation of Offshore Wind Turbine. Ph.D. Thesis, Zhejiang University, Hangzhou, China, 2016.
-
10.
Li W, Zhu B, Yang M. Static Response of Monopile to Lateral Load in Overconsolidated Dense Sand.
J. Geotech. Geoenviron. Eng. 2017,
143, 04017026. doi:10.1061/(asce)gt.1943-5606.0001698.
[Google Scholar]
-
11.
Ahmed SS, Hawlader B. Numerical Analysis of Large-Diameter Monopiles in Dense Sand Supporting Offshore Wind Turbines.
Int. J. Geomech. 2016,
16, 04016018. doi:10.1061/(asce)gm.1943-5622.0000633.
[Google Scholar]
-
12.
Hajialilue-Bonab M, Sojoudi Y, Puppala AJ. Study of Strain Wedge Parameters for Laterally Loaded Piles.
Int. J. Geomech. 2013,
13, 143–152. doi:10.1061/(asce)gm.1943-5622.0000186.
[Google Scholar]
-
13.
Hong Y, He B, Wang LZ, Wang Z, Ng CWW, Mašín D. Cyclic Lateral Response and Failure Mechanisms of Semi-Rigid Pile in Soft Clay: Centrifuge Tests and Numerical Modelling.
Can. Geotech. J. 2017,
54, 806–824. doi:10.1139/cgj-2016-0356.
[Google Scholar]
-
14.
Wang H, Fraser Bransby M, Lehane BM, Wang L, Hong Y. Numerical Investigation of the Monotonic Drained Lateral Behaviour of Large-Diameter Rigid Piles in Medium-Dense Uniform Sand.
Géotechnique. 2023,
73, 689–700. doi:10.1680/jgeot.21.00149.
[Google Scholar]
-
15.
Dai S, Han B, Wang B, Luo J, He B. Influence of Soil Scour on Lateral Behavior of Large-Diameter Offshore Wind-Turbine Monopile and Corresponding Scour Monitoring Method.
Ocean Eng. 2021,
239, 109809. doi:10.1016/j.oceaneng.2021.109809.
[Google Scholar]
-
16.
Dai S, Han B, Huang G, Gu X, Jian L, Liu S. Failure Mode of Monopile Foundation for Offshore Wind Turbine in Soft Clay under Complex Loads.
Mar. Georesources Geotechnol. 2022,
40, 14–25. doi:10.1080/1064119x.2020.1855682.
[Google Scholar]
-
17.
Reese LC, Cox WR, Koop FD. Analysis of Laterally Loaded Piles in Sand. In Proceedings of the 6th Annual Offshore Technology Conference, Houston, TX, USA, 6–8 May 1974.
-
18.
Matlock H. Correlations for Design of Laterally Loaded Piles in Soft Clay. In Proceedings of the Ⅱ Annual Offshore Technology Conference, Houston, TX, USA, 22–24 April 1970.
-
19.
American Petraleum Institute. Geotechnical and Foundation Design Considerations; API RP 2GEO; American Petroleum Institute: Washington, DC, USA, 2014.
-
20.
DNV GL. Support Structures for Wind Turbines; DNVGL-ST-0126; Det Norske Veritas: Oslo, Norway, 2021.
-
21.
Klinkvort RT. Centrifuge Modelling of Drained Lateral Pile-Soil Response. Ph.D. Thesis, Technical University of Denmark, Kongens Lyngby, Denmark, 2012.
-
22.
Sørensen SPH. Soil-Structure Interaction for Non-Slender, Large-Diameter Offshore Monopiles. Ph.D. Thesis, Aalborg University, Aalborg, Denmark, 2012.
-
23.
Choo YW, Kim D, Park J-H, Kwak K, Kim J-H, Kim D-S. Lateral Response of Large-Diameter Monopiles for Offshore Wind Turbines from Centrifuge Model Tests.
Geotech. Test. J. 2014,
37, 20130081. doi:10.1520/gtj20130081.
[Google Scholar]
-
24.
Amar Bouzid D. Numerical Investigation of Large-Diameter Monopiles in Sands: Critical Review and Evaluation of Both API and Newly Proposed
p-
y Curves.
Int. J. Geomech. 2018,
18. doi:10.1061/(asce)gm.1943-5622.0001204.
[Google Scholar]
-
25.
Georgiadis M, Anagnostopoulos C, Saflekou S. Centrifugal Testing of Laterally Loaded Piles in Sand.
Can. Geotech. J. 1992,
29, 208–216.
[Google Scholar]
-
26.
Wang L, Lai Y, Hong Y, Mašín D. A Unified Lateral Soil Reaction Model for Monopiles in Soft Clay Considering Various Length-to-Diameter (L/D) Ratios.
Ocean Eng. 2020,
212, 107492, doi:10.1016/j.oceaneng.2020.107492.
[Google Scholar]
-
27.
Zhu J, Yu J, Huang M, Shi Z, Shen K. Inclusion of Small-Strain Stiffness in Monotonic p-y Curves for Laterally Loaded Piles in Clay.
Comput. Geoteth. 2022,
150, 104902. doi:10.1016/j.compgeo.2022.104902.
[Google Scholar]
-
28.
Terzaghi K. Evaluation of Coefficients of Subgrade Reaction.
Géotechnique. 1988,
5, 296–326. doi:10.1680/geot.1955.5.4.297.
[Google Scholar]
-
29.
Randolph M, Gourvenec S. Offshore Geotechnical Engineering, 1st ed.; Spon Press: New York, NY, USA, 2011; pp. 273–283.
-
30.
He R, Kaynia AM. Winkler Spring Coefficients for Laterally Loaded Piles.
Comput. Geoteth. 2024,
170, 106264. doi:10.1016/j.compgeo.2024.106264.
[Google Scholar]
-
31.
Wang H. Lateral Behaviour of Offshore Monopile and Bucket Foundations in Sand. Ph.D. Thesis, Zhejiang University, Hangzhou, China, 2020.
-
32.
Byrne BW, Burd HJ, Zdravkovic L, Abadie CN, Houlsby GT, Jardine RJ, et al. PISA Design Methods for Offshore Wind Turbine Monopiles. In Proceedings of the Offshore Technology Conference, Houston, TX, USA, 26 April 2019.
-
33.
Byrne BW, Houlsby GT, Burd HJ, Gavin KG, Igoe DJP, Jardine RJ, et al. PISA Design Model for Monopiles for Offshore Wind Turbines: Application to a Stiff Glacial Clay Till.
Géotechnique. 2020,
70, 1030–1047. doi:10.1680/jgeot.18.p.255.
[Google Scholar]
-
34.
Wang H, Wang LZ, Hong Y, He B, Zhu RH. Quantifying the Influence of Pile Diameter on the Load Transfer Curves of Laterally Loaded Monopile in Sand.
Appl. Ocean Res. 2020,
101, 102196. doi:10.1016/j.apor.2020.102196.
[Google Scholar]
-
35.
Zhu B, Xiong G, Liu J, Sun Y, Chen R. Centrifuge Modelling of a Large-Diameter Single Pile under Lateral Loads in Sand.
Chin. J. Geotech. Eng. 2013,
35, 1807–1815.
[Google Scholar]
-
36.
Zhang X, Zhou R, Xu C. Study on Corrected P-y Curve Model of Pile Foundation of Offshore Wind Turbines.
Acta Energiae Solaris Sin. 2023,
44, 290–297.
[Google Scholar]
-
37.
Achmus M, Kuo Y-S, Abdel-Rahman K. Behavior of Monopile Foundations under Cyclic Lateral Load.
Comput. Geoteth. 2009,
36, 725–735. doi:10.1016/j.compgeo.2008.12.003.
[Google Scholar]
-
38.
Cheng X, Wang T, Zhang J, Liu Z, Cheng W. Finite Element Analysis of Cyclic Lateral Responses for Large Diameter Monopiles in Clays under Different Loading Patterns.
Comput. Geoteth. 2021,
134, 104104. doi:10.1016/j.compgeo.2021.104104.
[Google Scholar]
-
39.
Sun X, Yang H, Li S, Cui X. Stable Node-Based Smoothed Finite Element Method for 3D Contact Problems.
Comput. Mech. 2022,
69, 787–804. doi:10.1007/s00466-021-02114-1.
[Google Scholar]
-
40.
Chen Z, Zhang Z, Li W, Wang T, Zhang J. Numerical Study on the Base Shear Force-Displacement Relationship for Laterally Loaded Monopiles in Dense Sand.
Ocean Eng. 2023,
286, 115527. doi:10.1016/j.oceaneng.2023.115527.
[Google Scholar]
-
41.
Han F, Ganju E, Salgado R, Prezzi M. Effects of Interface Roughness, Particle Geometry, and Gradation on the Sand–Steel Interface Friction Angle.
J. Geotech. Geoenviron. Eng. 2018,
144. doi:10.1061/(asce)gt.1943-5606.0001990.
[Google Scholar]
-
42.
Han F, Ganju E, Prezzi M, Salgado R. Closure to “Effects of Interface Roughness, Particle Geometry, and Gradation on the Sand–Steel Interface Friction Angle” by Fei Han, Eshan Ganju, Rodrigo Salgado, and Monica Prezzi.
J. Geotech. Geoenviron. Eng. 2019,
145. doi:10.1061/(asce)gt.1943-5606.0002172.
[Google Scholar]
-
43.
Hu Q, Han F, Prezzi M, Salgado R, Zhao M. Lateral Load Response of Large-Diameter Monopiles in Sand.
Géotechnique 2022,
72, 1035–1050. doi:10.1680/jgeot.20.00002.
[Google Scholar]
-
44.
Han F, Ganju E, Prezzi M, Salgado R, Zaheer M. Axial Resistance of Open-Ended Pipe Pile Driven in Gravelly Sand.
Géotechnique 2020,
70, 138–152. doi:10.1680/jgeot.18.p.117.
[Google Scholar]
-
45.
Zhang Y, Andersen KH. Soil Reaction Curves for Monopiles in Clay.
Mar. Struct. 2019,
65, 94–113. doi:10.1016/j.marstruc.2018.12.009.
[Google Scholar]
-
46.
Fu D, Zhang Y, Aamodt KK, Yan Y. A Multi-Spring Model for Monopile Analysis in Soft Clays.
Mar. Struct. 2020,
72, 102768. doi:10.1016/j.marstruc.2020.102768.
[Google Scholar]
-
47.
Wang H, Wang L, Hong Y, Mašín D, Li W, He B, et al. Centrifuge Testing on Monotonic and Cyclic Lateral Behavior of Large-Diameter Slender Piles in Sand.
Ocean Eng. 2021,
226, 108299. doi:10.1016/j.oceaneng.2020.108299.
[Google Scholar]
-
48.
Zhu B, Li T, Xiong G, Liu JC. Centrifuge Model Tests on Laterally Loaded Piles in Sand.
Int. J. Phys. Model. Geo. 2016,
16, 160–172. doi:10.1680/jphmg.15.00023.
[Google Scholar]
-
49.
Haiderali AE, Madabhushi G. Evaluation of Curve Fitting Techniques in Deriving p–y Curves for Laterally Loaded Piles.
Geotech. Geol. Eng. 2016,
34, 1453–1473. doi:10.1007/s10706-016-0054-2.
[Google Scholar]
-
50.
Fan C-C, Long JH. Assessment of Existing Methods for Predicting Soil Response of Laterally Loaded Piles in Sand.
Comput. Geoteth. 2005,
32, 274–289. doi:10.1016/j.compgeo.2005.02.004.
[Google Scholar]
-
51.
Nan B. Studies on Modified P-y Curves Method of Monopile Based on the Degradation Stiffness Model of Sand. Master’s Thesis, Zhejiang University, Hangzhou, China, 2019.
-
52.
Augustesen AH, Brødbæk KT, Møller M, Sørensen SPH, Ibsen LB, Pedersen TS, et al. Numerical Modelling of Large-Diameter Steel Piles at Horns Rev. In Proceedings of the Twelfth International Conference on Civil, Structural and Environmental Engineering Computing, Funchal, Madeira, Portugal, 1–4 September 2009.