1. Introduction
Various isoforms of the gamma-aminobutyric acid A (GABA
A) receptor have been identified in the brain [
1], with the GABA
A receptor family comprising at least 19 characterized members. Interestingly, these genes have also been detected in T cells in both humans and animal models [
2]. This discovery is of significant interest, as GABA
A receptors have gained increased attention in pharmacology; their agonists are commonly used as anesthetics [
3]. Previous studies have analyzed the mRNA and protein levels of GABA
A receptors in Jurkat T cells following exposure to various stimuli, including GABA [
4]. Further research has elucidated that GABA
A receptors can mediate the inhibition of T cell response and proliferation [
5]. Supporting this, the role of GABA in immunoregulation suggests the involvement of GABA
A receptor signaling in lymphocytes [
6]. However, despite the well-established roles of GABA and GABA receptors beyond the central nervous system, particularly in modulating T cell function [
7], the specific transcriptomic responses of T cells to anesthetics that bind GABA receptors, as well as the genetic factors induced by such anesthetics to regulate T cell activation, remain unidentified.
Based on the distinct conformational features of GABA
A receptors expressed in immune cells, remimazolam—a subtype-selective benzodiazepine derivative—delineated specific mechanisms underlying its regulatory effects on T cell functionality. Remimazolam primarily exerts its effects through the GABA neurotransmitter system [
8]. As an inhibitory neurotransmitter in the central nervous system, GABA interacts with GABA receptors to stimulate the opening of chloride ion channels, facilitating the influx of chloride ions into nerve cells. This process leads to hyperpolarization of neurons and results in central inhibitory effects. GABA production has also been observed in extracerebral locations such as insulin-producing beta cells [
9], further expanding its influence. Notably, a study found that iTreg and TH17 cells express high levels of glutamate decarboxylase, an enzyme that catalyzes the conversion of glutamate (Glu) to γ-aminobutyric acid [
10]. This enzymatic capacity positions these lymphocytes as putative GABA producers, potentially integrating metabolic and immunological pathways. In this context, Jurkat T cells, an established immortalized human T lymphoblastoid cell line, may also produce and secrete GABA, potentially mediating the effects of anesthetics on T cell function. Remimazolam exerts its pharmacological action as a positive allosteric modulator of the GABA
A receptor [
11]. Upon binding to the receptor’s benzodiazepine site, it potentiates GABAergic neurotransmission through two synergistic mechanisms: (1) increasing the frequency of chloride ion channel opening events, and (2) enhancing receptor affinity for endogenous GABA [
8]. However, the mechanistic basis of benzodiazepine-mediated immunomodulation remains incompletely characterized, with the effects of novel ultra-short-acting agents like remimazolam on T cell signaling pathways representing a critical knowledge gap. This study aims to delineate the molecular mechanisms through which remimazolam modulates Jurkat T cell activation via GABA
A receptor signaling and to characterize its immunomodulatory properties.
This study demonstrated that remimazolam suppresses Jurkat T cell activation while concurrently upregulating
TGFBI expression levels. Utilizing the CRISPR/Cas9 genome editing technology, we investigated the functional role of TGFBI in the modulation of Jurkat T cell activation. Our experimental data demonstrated that targeted genetic ablation of
TGFBI resulted in a partial yet statistically significant reversal of remimazolam-induced suppression of Jurkat T cell activation. These findings elucidate the molecular mechanisms underlying remimazolam-mediated regulation of T cell activation. Considering the widespread clinical application of remimazolam as an anesthetic agent, these results may provide critical insights for optimizing its therapeutic efficacy and safety profile in clinical anesthesia practice.
2. Materials and Methods
2.1. Jurkat T Cell Culture and Stimulation
The Jurkat T cell line, obtained from ATCC, was maintained in RPMI 1640 medium (Gibco, Thermo Fisher Scientific, Grand Island, NY, USA) supplemented with 10% heat-inactivated fetal bovine serum (FBS; Gibco), 100 units/mL penicillin, and 100 µg/mL streptomycin (Gibco). For T cell activation studies, 2 × 10⁶ Jurkat T cells were seeded in 10 cm tissue culture-treated dishes (Corning,Corning, NY, USA) and subjected to experimental treatments for 12 h. The treatment groups consisted of: (1) DMSO, and (2) 81 nM PMA + 1.34 µM ionomycin. Cells were cultured at 37 °C in a humidified atmosphere containing 5% CO2.
2.2. RNA Sequencing and Quantitative Real-Time PCR (qRT-PCR)
Total RNA was isolated from Jurkat T cells using Trizol reagent (Thermo Fisher Scientific) following the manufacturer’s protocol. The extracted RNA was divided into two aliquots: one aliquot was submitted to BGI Genomics Co., Ltd. (Shenzhen, China) for high-throughput RNA sequencing analysis, while the complementary aliquot was retained for qRT-PCR validation. First-strand cDNA synthesis was performed using the RevertAid First Strand cDNA Synthesis Kit (Thermo Fisher Scientific) according to the manufacturer’s instructions. Transcriptional profiling of target genes in Jurkat T cells was conducted using the following primer sequences: TGFBI, forward primer (F): 5′-GAGGGCACGACACTGGAG-3′ and reverse primer (R): 5′-GTAGTGGATCACCCCGTTG-3′, GAPDH was employed as an endogenous control for normalization of qRT-PCR data. The raw RNA sequencing data have been deposited in the NCBI database under BioProject accession number PRJNA990927.
2.3. Jurkat T Cell Activation Analysis
Jurkat T cells were cultured in 6-well plates and subjected to experimental treatments for 4 h. The treatment groups consisted of: (1) DMSO, (2) 81 PMA + 1.34 µM ionomycin, and (3) 81 nM PMA + 1.34 µM ionomycin + 23.4 µM remimazolam (Yichang Humanwell Pharmaceutical Co., Ltd., purity > 99.9%, Yichang, China). Following treatment, cells were harvested and stained with CD69-efluor450 (a T cell activation marker) at 4 °C for 30 min in the dark. Subsequently, cells were washed with 1 mL of FACS buffer and resuspended in Sytox red viability dye for dead cell exclusion. Flow cytometric analysis was performed using a FACS Canto II system (BD Biosciences, San Jose, CA, USA), and data were processed using FlowJo software (version 10.0, BD Biosciences).
2.4. Mass Spectrometry Detection of GABA in Resting and Activated Jurkat T Cells and Culture Medium
Jurkat T cells were cultured in 10 cm plates and treated with or without 15 mL of RPMI1640 medium containing 81 nM PMA and 1.34 µM ionomycin for 12 h. After treatment, cells and culture medium were separately harvested and extracted using 10% formic acid in methanol-water (1:1, v/v). Cells were frozen in liquid nitrogen for 5 min, thawed at room temperature, and sonicated at 55 Hz for 1 min. Both cell and cell medium samples were centrifuged at 12,000 rpm at 4 °C for 10 min. The resulting supernatants were diluted 500-fold for cell extracts and 20-fold for medium samples using 10% formic acid in methanol-water (1:1, v/v). Equal volumes of supernatant and 20 ng/mL Trp-d3 internal standard were mixed and filtered through a 0.22 μm membrane. The filtrate was analyzed by LC-MS.
Samples were separated using EXion LC Liquid chromatography (AB SCIEX, Framingham, MA, USA) with ACQUITY UPLC® BEH C18 Column (2.1 × 100 mm, 1.7 μm, Waters, Milford, MA, USA). A 17.5-min linear gradient was employed with solvent A (0.1% formic acid in 50% methanol/H2O (v/v)) and solvent B (0.1% formic acid in 10% methanol/H2O (v/v)) as follows: 0~6.5 min, 90~70% B; 6.5~7 min, 70~0% B; 7~14 min, 0% B; 14~14.5 min, 0~90% B; 14.5~17.5 min, 90% B. Data was acquired with an AB6500 Plus mass spectrometer (AB SCIEX, Framingham, MA USA) in positive ionization mode. Ion source parameters were set at 500 °C, 5500 V, 6 psi collision gas, 30 psi curtain gas, and 50 psi each for atomizing and auxiliary gases. Multiple Reaction Monitoring (MRM) scans (AB SCIEX, Framingham, MA, USA) were performed. Amino acid concentrations were calculated based on peak areas and standard curves.
2.5. CRISPR/Cas9 Mediated Knockout of TGFBI in Jurkat T Cells
To generate TGFBI−/− Jurkat T cell lines using the CRISPR/Cas9 technique, three distinct sgRNAs (TCAAGATGTGGTTGTTCAGC, CCTCCAGTGTCGTGCCCTCC, and AATGTAGTGGATCACCCCGT) were synthesized and individually cloned into the pX458 vector, which harbors an enhanced green fluorescent protein (EGFP) marker, enabling efficient identification and isolation of transfected cells through fluorescence-activated cell sorting (FACS) at the single-cell level. Jurkat T cells were co-electroporated with CRISPR/Cas9 plasmids (px458-TGFBI-sgRNA1, px458-TGFBI-sgRNA2, and px458-TGFBI-sgRNA3) using the Neon® Transfection System (Thermo Fisher Scientific). Forty-eight hours post-electroporation, single cells were sorted, expanded, and validated for TGFBI knockout through PCR (primers: F: 5′-GTGGTCCCTGAGGTTATCGTG-3′, R: 5′-GAAGTCGCCCAAAGATCTCTGA-3′), qRT-PCR (primers: F: 5′-GAGGGCACGACACTGGAG-3′, R: 5′-GTAGTGGATCACCCCGTTG-3′), and Sanger sequencing, confirming the generation of TGFBI−/− Jurkat T cell lines.
2.6. Western Blotting
To validate the successful knockout of TGFBI in Jurkat T cells, protein lysates were extracted from wild-type (WT) and TGFBI−/− Jurkat T cells using RIPA lysis buffer supplemented with a protease inhibitor cocktail. Following quantification by BCA assay, equal amounts of protein (20 μg per lane) were separated by 10% SDS-PAGE and transferred to PVDF membranes. Immunoblotting was performed using the following primary antibodies: rabbit anti-TGFBI (Proteintech, 60007-1-Ig; 1:1000 dilution, Wuhan, China) and rabbit anti-GAPDH (Abways, AB0037; 1:1000 dilution, Taizhou, China) as a loading control. Membranes were subsequently incubated with species-matched HRP-conjugated secondary antibodies (1:5000 dilution) for 1 h at room temperature. Protein bands were visualized using a chemiluminescent HRP substrate (Millipore) and imaged with a Tanon-5200 automated chemiluminescence imaging system.
2.7. Phospho-ERK Analysis in Jurkat T Cells
Following a 30-min stimulation with either DMSO or a combination of 81 nM PMA and 1.34 μM ionomycin, WT and TGFBI−/− Jurkat T cells were subjected to intracellular signaling analysis. Cellular fixation was performed using 1× BD Phosflow Lyse/Fix Buffer (BD Biosciences) at room temperature for 15 min. After thorough washing with 1× PBS, cells were permeabilized with ice-cold 90% methanol for 30 min. Immunostaining was conducted sequentially, beginning with incubation of phospho-ERK primary antibody (Cell Signaling Technology, 9101S, Danvers, MA, USA) followed by Goat anti-Rabbit IgG (H+L)-APC secondary antibody (Thermo Fisher Scientific, A-10931), each performed at 4 °C for 30 min. Following a final wash with 1 mL FACS buffer, cells were resuspended in fresh FACS buffer and analyzed using a BD FACS Canto II flow cytometer to quantify ERK phosphorylation levels.
2.8. Statistics Analysis
Statistical analysis was performed using an unpaired Student’s t-test in GraphPad Prism (v10.1), with significance levels denoted as: ns (not significant), ∗ p < 0.05, ∗∗ p < 0.01, ∗∗∗ p < 0.001, and ∗∗∗∗ p < 0.0001.
3. Results
3.1. Remimazolam Treatment Inhibits Activation of Human Jurkat T Cells
The pharmacological action of remimazolam involves positive allosteric modulation of GABA
A receptors, enhancing endogenous GABA binding affinity and potentiating receptor-mediated inhibitory signaling [
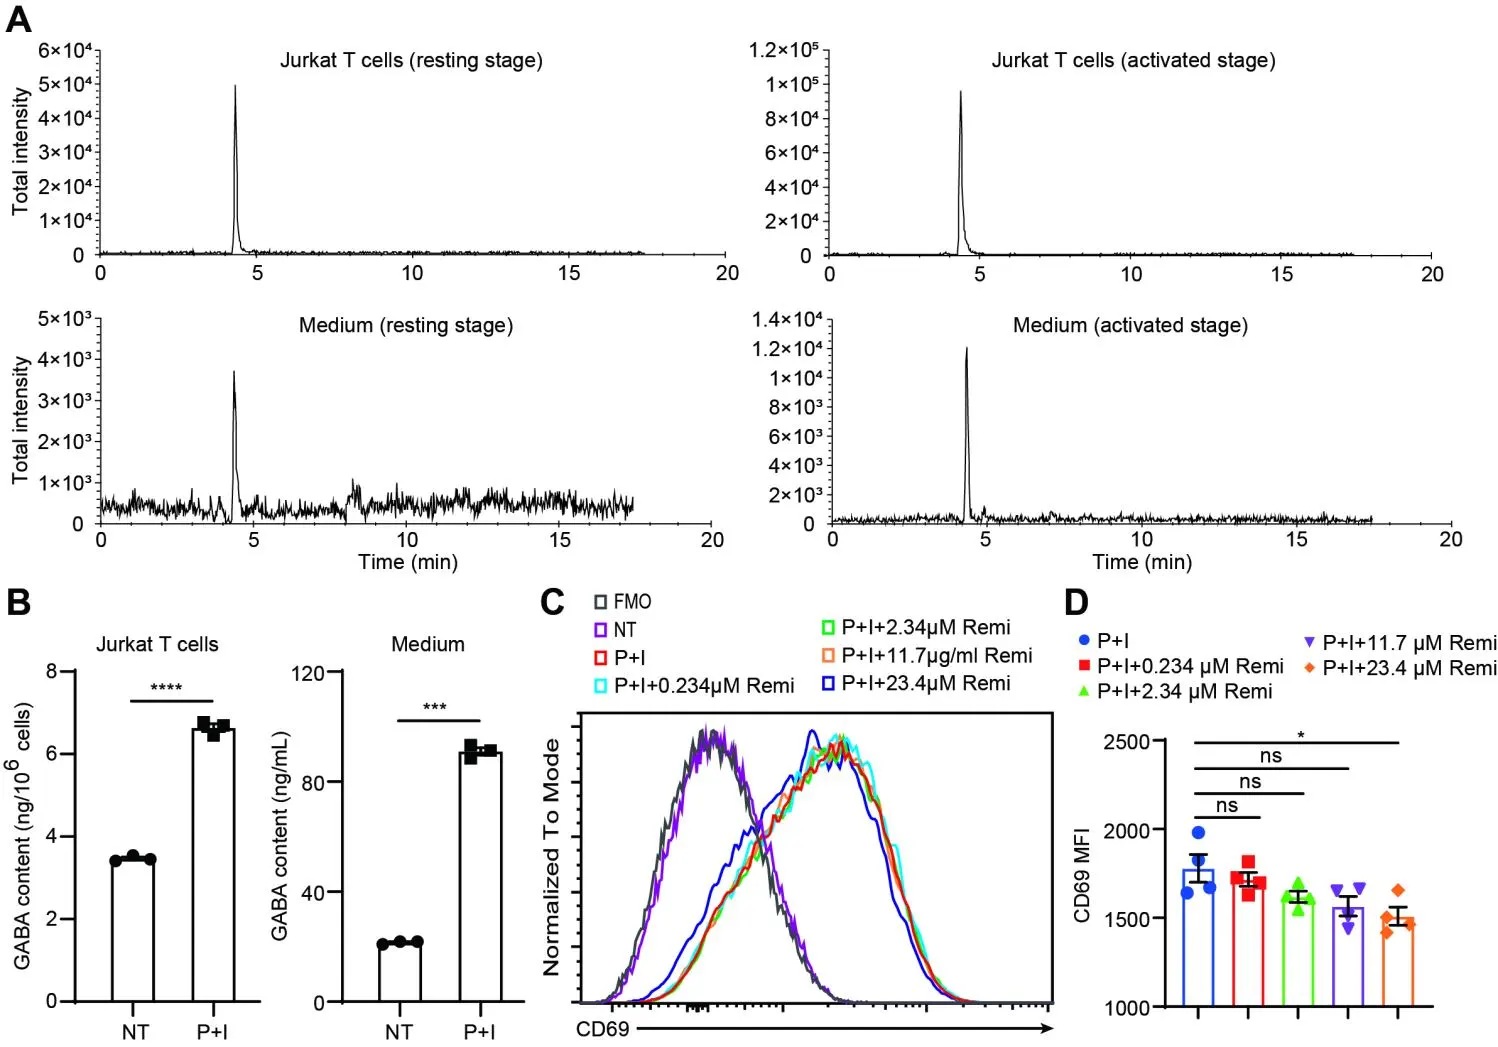
12]. We first quantified endogenous GABA levels using mass spectrometry to evaluate remimazolam’s direct effects on Jurkat T cell function in GABA-autonomous conditions. Baseline measurements revealed constitutive GABA concentrations of 3.47 ± 0.068 ng/10
6 cells (intracellular compartment) and 21.53 ± 0.61 ng/mL (extracellular milieu) in unstimulated cultures. Following P+I stimulation, these values increased significantly to 6.64 ± 0.17 ng/10
6 cells intracellularly and 91.04 ± 2.32 ng/mL extracellularly (
A,B), thereby validating the presence of an intrinsic GABA synthesis pathway within this experimental model that operates independently of exogenous GABA sources.
We performed systematic pharmacological interrogation using remimazolam to investigate GABA receptor-mediated modulation of Jurkat T cell activation. We quantified remimazolam’s immunomodulatory potential by dose-response profiling CD69 surface expression—a canonical early T cell activation marker. While standard clinical administration achieves a therapeutic level of 25 mg in a 70 kg adult, our in vitro system employed 0–23.4 μM remimazolam to encompass both physiological and supraphysiological ranges. Unstimulated Jurkat cells exhibited undetectable CD69 expression (Figure S1A and C). PMA/ionomycin stimulation significantly upregulated CD69 expression within a 4-h post-stimulation period. This effect was attenuated in a concentration-dependent manner, with significant inhibition observed exclusively at the 23.4 μM dose of remimazolam (Figure S1A and C). Mean fluorescence intensity (MFI) analysis confirmed statistically significant suppression at this maximal concentration compared to other treatments (
D), demonstrating dose-responsive suppression of early T cell activation markers by high-dose remimazolam.
. Remimazolam treatment inhibited Jurkat T cell activation. (<strong>A</strong>) Mass spectrometry detection of GABA in Jurkat T cells (up) and culture medium (down). (<strong>B</strong>) GABA levels were quantified in Jurkat T cells and their corresponding culture supernatants following stimulation with or without P+I. (<strong>C</strong>) The expression levels of CD69 on Jurkat T cells treated with P+I or P+I combined with varying concentrations of remimazolam were analyzed by determining the MFI using flow cytometry. (<strong>D</strong>) Histograms show the mean MFI ± SEM of four samples. Statistical significance is denoted as follows: <sup>∗</sup> <em>p</em> < 0.05, <sup>∗∗∗</sup> <em>p</em> < 0.001, <sup>∗∗∗∗</sup> <em>p</em> < 0.0001; ns = not significant. All remimazolam concentration groups were individually compared to the P+I-stimulated control group using unpaired Student’s <em>t</em>-tests.
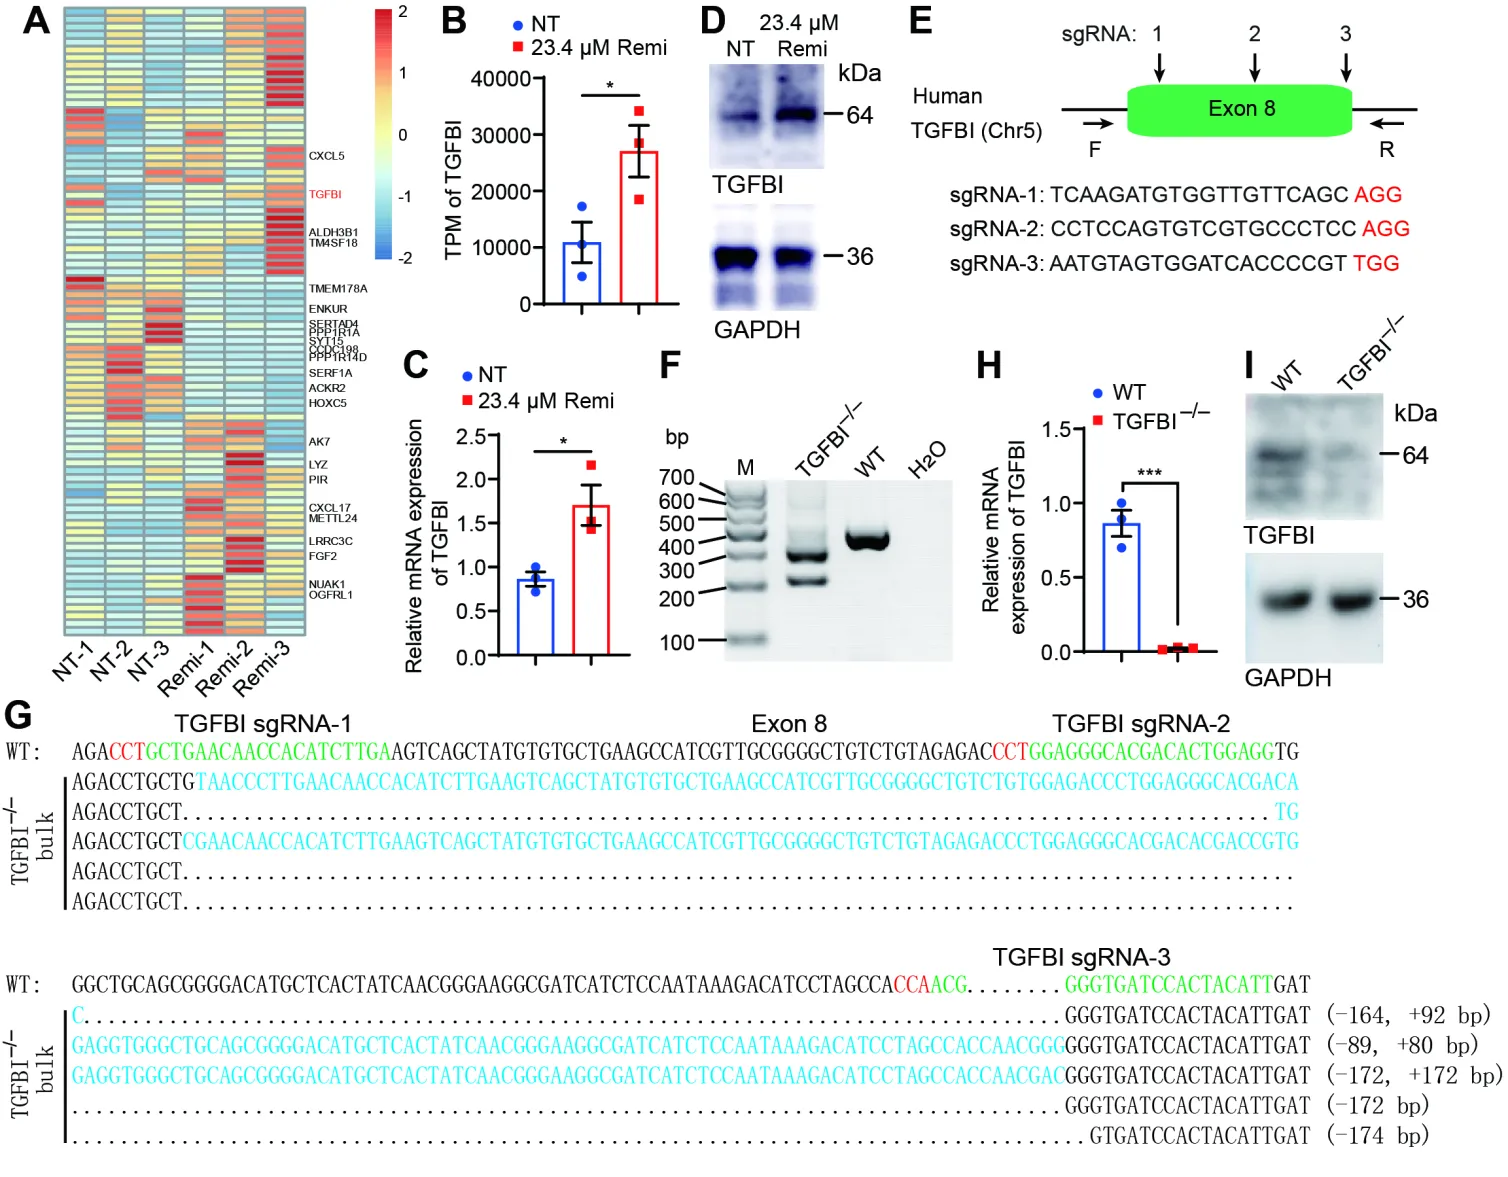
To evaluate the pharmacological effects of remimazolam on Jurkat T cell functionality, we conducted comparative transcriptomic profiling between drug-treated and untreated resting control cells. This analysis identified 82 genes exhibiting significant differential expression following remimazolam exposure in quiescent Jurkat T cells (
A), with
TGFBI demonstrating particularly robust upregulation (
B–D). To investigate the immunoregulatory function of
TGFBI in this experimental paradigm, we employed a CRISPR/Cas9-mediated gene knockout strategy targeting the evolutionarily conserved exon 8 domain through coordinated application of three unique sgRNAs (
E). Successful ablation was confirmed through PCR-based genotyping (
F), qRT-PCR (
H) and Western blot (
I), with representative mutant alleles depicted in
G. Our data demonstrate that remimazolam administration induces
TGFBI overexpression in resting Jurkat T cells.
. Remimazolam treatment leads to the induction of <em>TGFBI</em> in resting Jurkat T cells and the establishment of <em>TGFBI</em><sup>−/−</sup> Jurkat T cell lines. (<strong>A</strong>) RNA sequencing of Jurkat T cells treated with DMSO (NT) or 23.4 μM remimazolam for 12 h. (<strong>B</strong>) TPM of <em>TGFBI</em> in Jurkat T cells treated with DMSO (NT) or 23.4 μM remimazolam for 12 h. (<strong>C</strong>) qRT-PCR validation of <em>TGFBI</em> in Jurkat T cells treated with DMSO (NT) or 23.4 μM remimazolam for 12 h. (<strong>D</strong>) Western blot analysis of TGFBI expression in Jurkat cells treated with DMSO (NT) or 23.4 µM remimazolam for 12 h. (<strong>E</strong>) Schematic diagram of three sgRNAs used to target exon 8 of the <em>TGFBI</em> gene. Protospacer adjacent motifs (PAMs) are shown in red letters. (<strong>F</strong>) Validation of <em>TGFBI</em><sup>−/−</sup> Jurkat T cells by agarose gel electrophoresis. (<strong>G</strong>) Sanger sequencing verification of <em>TGFBI</em><sup>−/−</sup> Jurkat T cells. (<strong>H</strong>,<strong>I</strong>) qRT-PCR and Western blotting detection of TGFBI expression in wildtype (WT) and <em>TGFBI</em><sup>−/−</sup> Jurkat T cells, respectively. Statistical significance is denoted as follows: <sup>∗</sup> <em>p</em> < 0.05, <sup>∗∗∗</sup> <em>p</em> < 0.001, unpaired Student’s <em>t</em>-test.
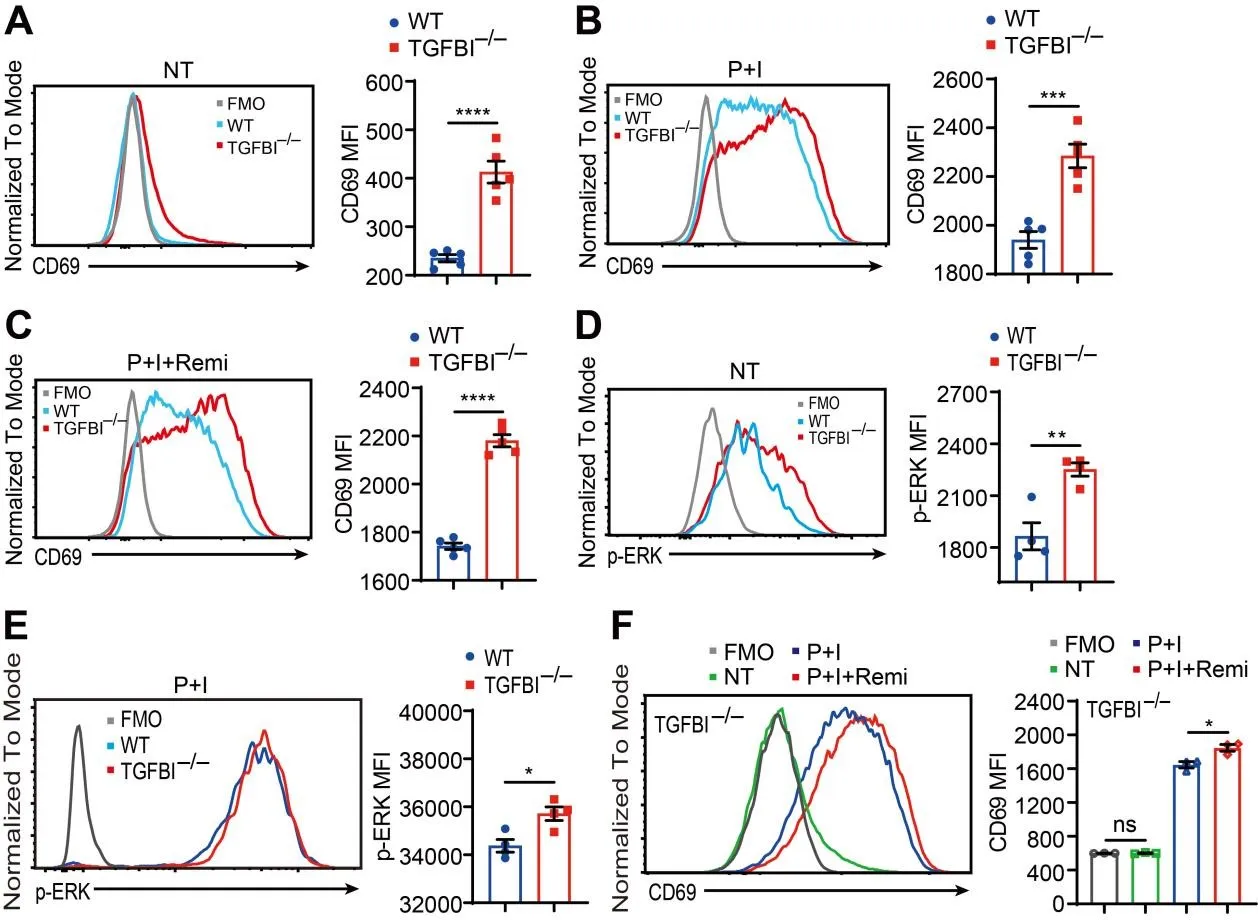
In subsequent experiments, we characterized
TGFBI-deficient Jurkat T cells under both steady-state conditions and PMA/ionomycin stimulation. Mass spectrometry analysis revealed that
TGFBI knockout reduced GABA levels in Jurkat T cells and their culture medium under both steady-state conditions and following PMA/ionomycin stimulation (
Figure S2). We then analyzed the effects of
TGFBI knockout on Jurkat T cell activation. Compared to WT controls,
TGFBI-null Jurkat T cells demonstrated elevated basal CD69 expression and ERK phosphorylation (Figure S1B,E and Figure 3A,D), revealing TGFBI’s constitutive inhibitory role in T cell activation. Functional assessment of PMA/ionomycin-stimulated cells revealed enhanced CD69 upregulation and ERK phosphorylation in
TGFBI-deficient Jurkat T cells compared to WT counterparts (Figure S1C,F and Figure 3B,E). To delineate remimazolam-
TGFBI interactions, we quantified CD69 expression following remimazolam exposure. Notably,
TGFBI-deficient Jurkat T cells maintained significantly higher CD69 levels despite remimazolam treatment (Figure S1D and Figure 3C). Intriguingly,
TGFBI knockout abrogated remimazolam-mediated suppression of Jurkat T cell activation (Figure S1G and Figure 3F). These findings establish that remimazolam upregulates TGFBI expression to suppress Jurkat T cell activation. Crucially,
TGFBI deficiency completely rescued Jurkat T cells from remimazolam-induced activation impairment. Our data demonstrate that TGFBI serves as a critical mediator of remimazolam’s immunomodulatory effects in Jurkat T cells.
. Knockout of <em>TGFBI</em> reverses the inhibition of Jurkat T cell activation caused by remimazolam. (<strong>A</strong>) Expression levels of CD69 on WT and <em>TGFBI</em><sup>−/−</sup> Jurkat T cells in a steady state were quantified using flow cytometry to determine MFI. (<strong>B</strong>) Expression levels of CD69 on WT and <em>TGFBI</em><sup>−/−</sup> Jurkat T cells following P+I stimulation were assessed using flow cytometry to measure MFI. (<strong>C</strong>) Expression levels of CD69 on WT and <em>TGFBI</em><sup>−/−</sup> Jurkat T cells after treatment with 81 nM PMA plus 1.34 μM ionomycin plus 23.4 μM remimazolam (P+I+Remi) were analyzed using flow cytometry to determine MFI. (<strong>D</strong>) Phosphorylation levels of ERK in WT and <em>TGFBI</em><sup>−/−</sup> Jurkat T cells in a steady state were quantified using flow cytometry to measure MFI. (<strong>E</strong>) Phosphorylation levels of ERK in WT and <em>TGFBI</em><sup>−/−</sup> Jurkat T cells following P+I stimulation were assessed using flow cytometry to determine MFI. (<strong>F</strong>) Expression levels of CD69 on <em>TGFBI</em><sup>−/−</sup> Jurkat T cells following P+I or P+I+Remi treatment were analyzed using flow cytometry to measure MFI. <sup>∗</sup> <em>p</em> < 0.05, <sup>∗∗</sup> <em>p</em> < 0.01, <sup>∗∗∗</sup> <em>p</em> < 0.001, <sup>∗∗∗∗</sup> <em>p</em> < 0.0001, ns: not significant, unpaired Student’s <em>t</em>-test.
4. Discussion
The novel drug remimazolam, a positive allosteric modulator that binds to the GABA
A receptor, is recognized for its advantages of rapid onset and quick degradation in clinical settings [
13]. Although the expression of the GABA
A receptor in T cells and its potential roles in T cell activation have been previously reported, the underlying molecular mechanisms remain elusive. More importantly, the effects of the newly approved drug remimazolam on T cells have yet to be characterized. In this study, we observed that a high concentration of remimazolam significantly inhibited CD69 expression and ERK phosphorylation following Jurkat T cell activation, even in the absence of exogenous GABA. Notably, it has been reported that remimazolam, acting as a GABA
A receptor binding agent, exerts its pharmacological effects by enhancing the inhibitory impact of GABA on cells expressing GABA
A receptors [
12]. This suggests that in the absence of exogenous GABA, the inhibitory effect of remimazolam on Jurkat T cell activation may stem from the spontaneous production and secretion of GABA by the activated Jurkat T cells themselves. Our mass spectrometry data corroborate this hypothesis, as we detected GABA in both resting or activated Jurkat T cells and their culture medium. In addition, a published study has demonstrated that GABA is also present in human blood [
14], suggesting that when utilizing remimazolam in clinical practice, it is crucial to consider its potential effects on T cell function.
TGFBI has various functions, with mutations causing corneal dystrophies [
15], disordered bone development [
16], and involvement in cancer progression [
17]. However, its role in T cells is less understood. Our genetic experiments revealed that the loss of
TGFBI in Jurkat T cells reduces the production of GABA and then significantly reverses the inhibition of Jurkat T cell activation by remimazolam. We specifically selected
TGFBI among the gene cluster induced by remimazolam due to its expression pattern in Jurkat T cells. According to the Immgen database (www.immgen.org), TGFBI is known to be inducible by activated T cells in vivo. It is important to highlight that further examination of other genes warrants in-depth genetic analysis.
In addition, within the immune system, TGFBI, which is predominantly secreted by M2-polarized tumor-associated macrophages (TAMs), plays a crucial role in sustaining glioblastoma stem cells (GSCs) and driving the malignant progression of glioblastoma multiforme (GBM) via the integrin αvβ5-Src-Stat3 signaling axis [
18]. Our findings demonstrate that
TGFBI-knockout Jurkat cells retain CD69 expression and ERK phosphorylation upon remimazolam treatment (
A–E), suggesting that TGFBI may negatively regulate T-cell activation by suppressing the ERK/MAPK signaling pathway. Furthermore,
TGFBI and TGF-β signaling exhibit cross-regulation: TGF-β induces TGFBI expression, while TGFBI potentiates TGF-β’s pro-fibrotic effects [
19,
20]. Thus, Remimazolam may suppress T-cell function by upregulating
TGFBI, synergizing with TGF-β signaling. Future studies should employ protein-protein interaction screening (e.g., Co-Immunoprecipitation, Co-IP) to identify TGFBI-binding partners in Jurkat cells and validate whether
TGFBI modulates T-cell activation via the integrin-TGF-β axis. Interestingly, despite the canonical role of TGF-β1 in inducing TGFBI expression, remimazolam treatment did not significantly alter
TGFB1 mRNA levels in our RNA-seq dataset, implying potential TGFB1-independent regulation of
TGFBI in Jurkat cells.
Taken together, our study investigated the significant role of remimazolam in regulating T cell activation. We found that the knockout of the
TGFBI gene, which was induced by remimazolam, reversed the drug’s inhibitory effect on T cell activation. Given that remimazolam is a standard component in clinical anesthesia, the functional insights and mechanistic discoveries from our research can potentially inform and optimize drug prescription practices.
Supplementary Materials
The following supporting information can be found at: https://www.sciepublish.com/article/pii/625.
Figure S1. Gate strategies for the analysis of CD69 expression and p-ERK levels in WT or TGFBI
−/− Jurkat T cells following various treatments. (
A) Gate strategies for the analysis of CD69 expression on Jurkat T cells following various treatments. (
B) Gate strategies for the analysis of CD69 expression on WT and TGFBI
−/− Jurkat T cells in a steady state. (
C) Gate strategies for the analysis of CD69 expression on WT and TGFBI
−/− Jurkat T cells following P+I treatment. (
D) Gate strategies for the analysis of CD69 expression on WT and TGFBI
−/− Jurkat T cells following P+I+Remi treatment. (
E,
F) Gate strategies for the analysis of p-ERK levels in WT and TGFBI
−/− Jurkat T cells following DMSO (NT) or P+I treatments. (
G) Gate strategies for the analysis of CD69 expression on TGFBI
−/− Jurkat T cells following P+I or P+I+Remi treatment.
Figure S2. Knockout of TGFBI reduces GABA production by Jurkat T cells. (
A) Mass spectrometry detection of GABA in WT and TGFBI knockout Jurkat T cells (up) and their corresponding culture medium following stimulation with or without P+I. (
B) Quantification of GABA levels in WT and TGFBI deficiency Jurkat T cells and culture medium following stimulation with or without P+I. Statistical significance is denoted as follows:
∗∗ p < 0.01,
∗∗∗∗ p < 0.0001, unpaired Student’s
t-test.
Author Contributions
Y.L. (Yinming Liang) and H.W. (Hui Wang) contributed conception and design of the study. B.Z. (Binhui Zhou) and Y.L. (Yinming Liang) wrote the manuscript; H.W. (Hao Wang), G.G., H.M., Y.Q., B.Z. (Bowen Zhang), T.L. (Tingting Liu), Y.L. (Yang Liu), T.L. (Tianhan Li), and L.Z. contributed to the experiments. All authors contributed to the manuscript revision, and have read and approved the submitted version.
Ethics Statement
Not applicable.
Informed Consent Statement
Not applicable.
Data Availability Statement
Data will be made available on request.
Funding
This work was supported by The Natural Science Foundation of Henan Province to Yinming Liang (grant number. 222300420015) and the start-up fund from Xinxiang Medical University to Binhui Zhou (grant number. 505483).
Declaration of Competing Interest
The authors declare no commercial or financial conflict of interest.
References
-
1.
Saxena NC, Macdonald RL. Properties of putative cerebellar gamma-aminobutyric acid A receptor isoforms.
Mol. Pharmacol. 1996,
49, 567–579.
[Google Scholar]
-
2.
Mendu SK, Bhandage A, Jin Z, Birnir B. Different subtypes of GABA-A receptors are expressed in human, mouse and rat T lymphocytes.
PLoS ONE 2012,
7, e42959.
[Google Scholar]
-
3.
Garcia PS, Kolesky SE, Jenkins A. General anesthetic actions on GABA(A) receptors.
Curr. Neuropharmacol. 2010,
8, 2–9.
[Google Scholar]
-
4.
Dionisio L, Arias V, Bouzat C, Esandi Mdel C. GABAA receptor plasticity in Jurkat T cells.
Biochimie 2013,
95, 2376–2384.
[Google Scholar]
-
5.
Sparrow EL, James S, Hussain K, Beers SA, Cragg MS, Bogdanov YD. Activation of GABA(A) receptors inhibits T cell proliferation.
PLoS ONE 2021,
16, e0251632.
[Google Scholar]
-
6.
Barragan A, Weidner JM, Jin Z, Korpi ER, Birnir B. GABAergic signalling in the immune system.
Acta Physiol. 2015,
213, 819–827.
[Google Scholar]
-
7.
Watanabe M, Maemura K, Kanbara K, Tamayama T, Hayasaki H. GABA and GABA receptors in the central nervous system and other organs.
Int. Rev. Cytol. 2002,
213, 1–47.
[Google Scholar]
-
8.
Kilpatrick GJ, McIntyre MS, Cox RF, Stafford JA, Pacofsky GJ, Lovell GG, et al. CNS 7056: a novel ultra-short-acting Benzodiazepine.
Anesthesiology 2007,
107, 60–66.
[Google Scholar]
-
9.
Korol SV, Jin Z, Jin Y, Bhandage AK, Tengholm A, Gandasi NR, et al. Functional characterization of native, high-affinity GABAA receptors in human pancreatic β cells.
EBioMedicine 2018,
30, 273–282.
[Google Scholar]
-
10.
Kang S, Liu L, Wang T, Cannon M, Lin P, Fan TWM, et al. GAB functions as a bioenergetic and signalling gatekeeper to control T cell inflammation.
Nat. Metab. 2022,
4, 1322–1335.
[Google Scholar]
-
11.
Lee A, Shirley M. Remimazolam: a review in procedural sedation.
Drugs 2021,
81, 1193–1201.
[Google Scholar]
-
12.
Zhang H, Li H, Zhao S, Bao F. Remimazolam in general anesthesia: A comprehensive review of its applications and clinical efficacy.
Drug Des. Devel. Ther. 2024,
18, 3487–3498.
[Google Scholar]
-
13.
Hu Q, Liu X, Wen C, Li D, Lei X. Remimazolam: an updated review of a new sedative and anaesthetic.
Drug Des. Dev. Ther. 2022,
16, 3957–3974.
[Google Scholar]
-
14.
Wang Z, Bian L, Mo C, Shen H, Zhao LJ, Su K-J, et al. Quantification of aminobutyric acids and their clinical applications as biomarkers for osteoporosis.
Communications Biology 2020,
3, 39.
[Google Scholar]
-
15.
Cai J, Zhu L, Zha Y, Kang Q.
TGFBI gene mutation analysis in chinese families with corneal dystrophies.
Genet. Test. Mol. Biomarkers 2016,
20, 388–392.
[Google Scholar]
-
16.
Yu H, Wergedal JE, Zhao Y, Mohan S. Targeted disruption of
TGFBI in mice reveals its role in regulating bone mass and bone size through periosteal bone formation.
Calcif. Tissue Int. 2012,
91, 81–87.
[Google Scholar]
-
17.
Corona A, Blobe GC. The role of the extracellular matrix protein TGFBI in cancer.
Cell Signal. 2021,
84, 110028.
[Google Scholar]
-
18.
Peng P, Zhu H, Liu D, Chen Z, Zhang X, Guo Z, et al. TGFBI secreted by tumor-associated macrophages promotes glioblastoma stem cell-driven tumor growth via integrin αvβ5-Src-Stat3 signaling.
Theranostics 2022,
12, 4221–4236.
[Google Scholar]
-
19.
Guo S-K, Shen M-F, Yao H-W, Liu Y-S. Enhanced expression of TGFBI promotes the proliferation and migration of glioma cells.
Cell Physiol. Biochem. 2018,
49, 1138–1150.
[Google Scholar]
-
20.
Wu L, Jiang L, Zhou Y, Zheng W, Feng A, Guo H. TGFBI regulates the TGF-β pathway to affect the malignant progression and cisplatin sensitivity in diffuse large B-cell lymphoma.
Ann. Hematol. 2025, 104, 1165–1176.
[Google Scholar]