1. Introduction
d-Mannitol (hereafter denoted as mannitol) is a natural six-carbon sugar alcohol widely used in the food, pharmaceutical, and chemical industries [
1]. The demand for mannitol as a low-calorie sweetener is steadily increasing in response to the rising global prevalence of obesity and diabetes [
2] because it is a non-metabolizable sugar alcohol with about half the sweetness of sucrose [
3]. In the pharmaceutical industry, stable and sweet mannitol is used to mask the off-flavors of drugs as a pharmaceutical formulation [
4]. It is also used as a dehydrating agent and diuretic [
5]. The global market for mannitol was estimated at $451 million in 2024 [
6].
Mannitol can be produced by various approaches, including extraction from plants [
7], chemical synthesis [
8], and bioproduction [
9]. Due to modest reaction conditions and high selectivity, mannitol bioproduction from
d-fructose is of great interest (
). Bioproduction can be classified by its biocatalysts, from (cascade) enzymes, whole cells, to microbial cells. Cells used for microbial fermentation included yeasts, filamentous fungi [
10], and lactic acid bacteria [
11,
12]. However, fermentative by-products and long fermentation time (typically exceeding 24 h) hindered its wide industrial biomanufacturing. Alternatively, mannitol can be produced from
d-fructose via the hydrogenation catalyzed by mannitol dehydrogenase (MDH) with NADH (
a,b), which can be regenerated from formate catalyzed by formate dehydrogenase (FDH) [
3,
13,
14]. However, this enzymatic conversion suffers from the addition of costly NAD and the use of costly purified enzymes. To address the above weaknesses of the two-enzyme cocktail, the whole-cell biocatalysts that contained two redox enzymes have been developed, where the coenzyme NAD was recycled between two enzymes, and NADH can be generated from another substrate formate [
15,
16,
17] or
d-glucose [
18].
Biomanufacturing catalyzed by cell–enzyme tandem systems [
19] received less attention in the literature. Kaup et al. proposed a recombinant
E. coli strain co-expressing MDH and FDH to produce mannitol from glucose and an enzyme glucose isomerase (GI) [
20]. Mannitol titer reached 150 g/L after 40 h with a productivity of 4.55 g/L/h at 37 °C. However, this method was based on using mesophilic enzymes; the instability and low activity of mesophilic FDH, and other
E. coli enzymes limited its large-scale application.
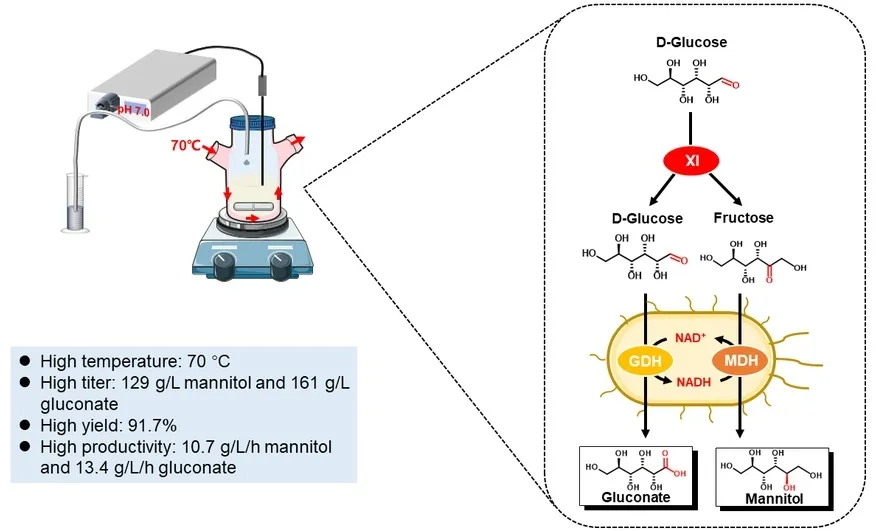
In this study, we developed a cell–enzyme system consisted of an
E. coli strain co-expressing hyperthermophilic MDH (EC 1.1.1.67) from
Thermotoga maritima and glucose dehydrogenase (GDH, EC 1.1.1.47) from
Sulfolobus solfataricus as well as the hyperthermophilic enzyme xylose isomerase (XI, EC 5.3.1.5) from
Thermus thermophilus, which can coproduce high titers of mannitol and gluconate from
d-glucose (
c). Notably, this biotransformation was operated at high temperatures without externally-added NAD. This biotransformation could be a promising method for the industrial co-production of mannitol and gluconate.
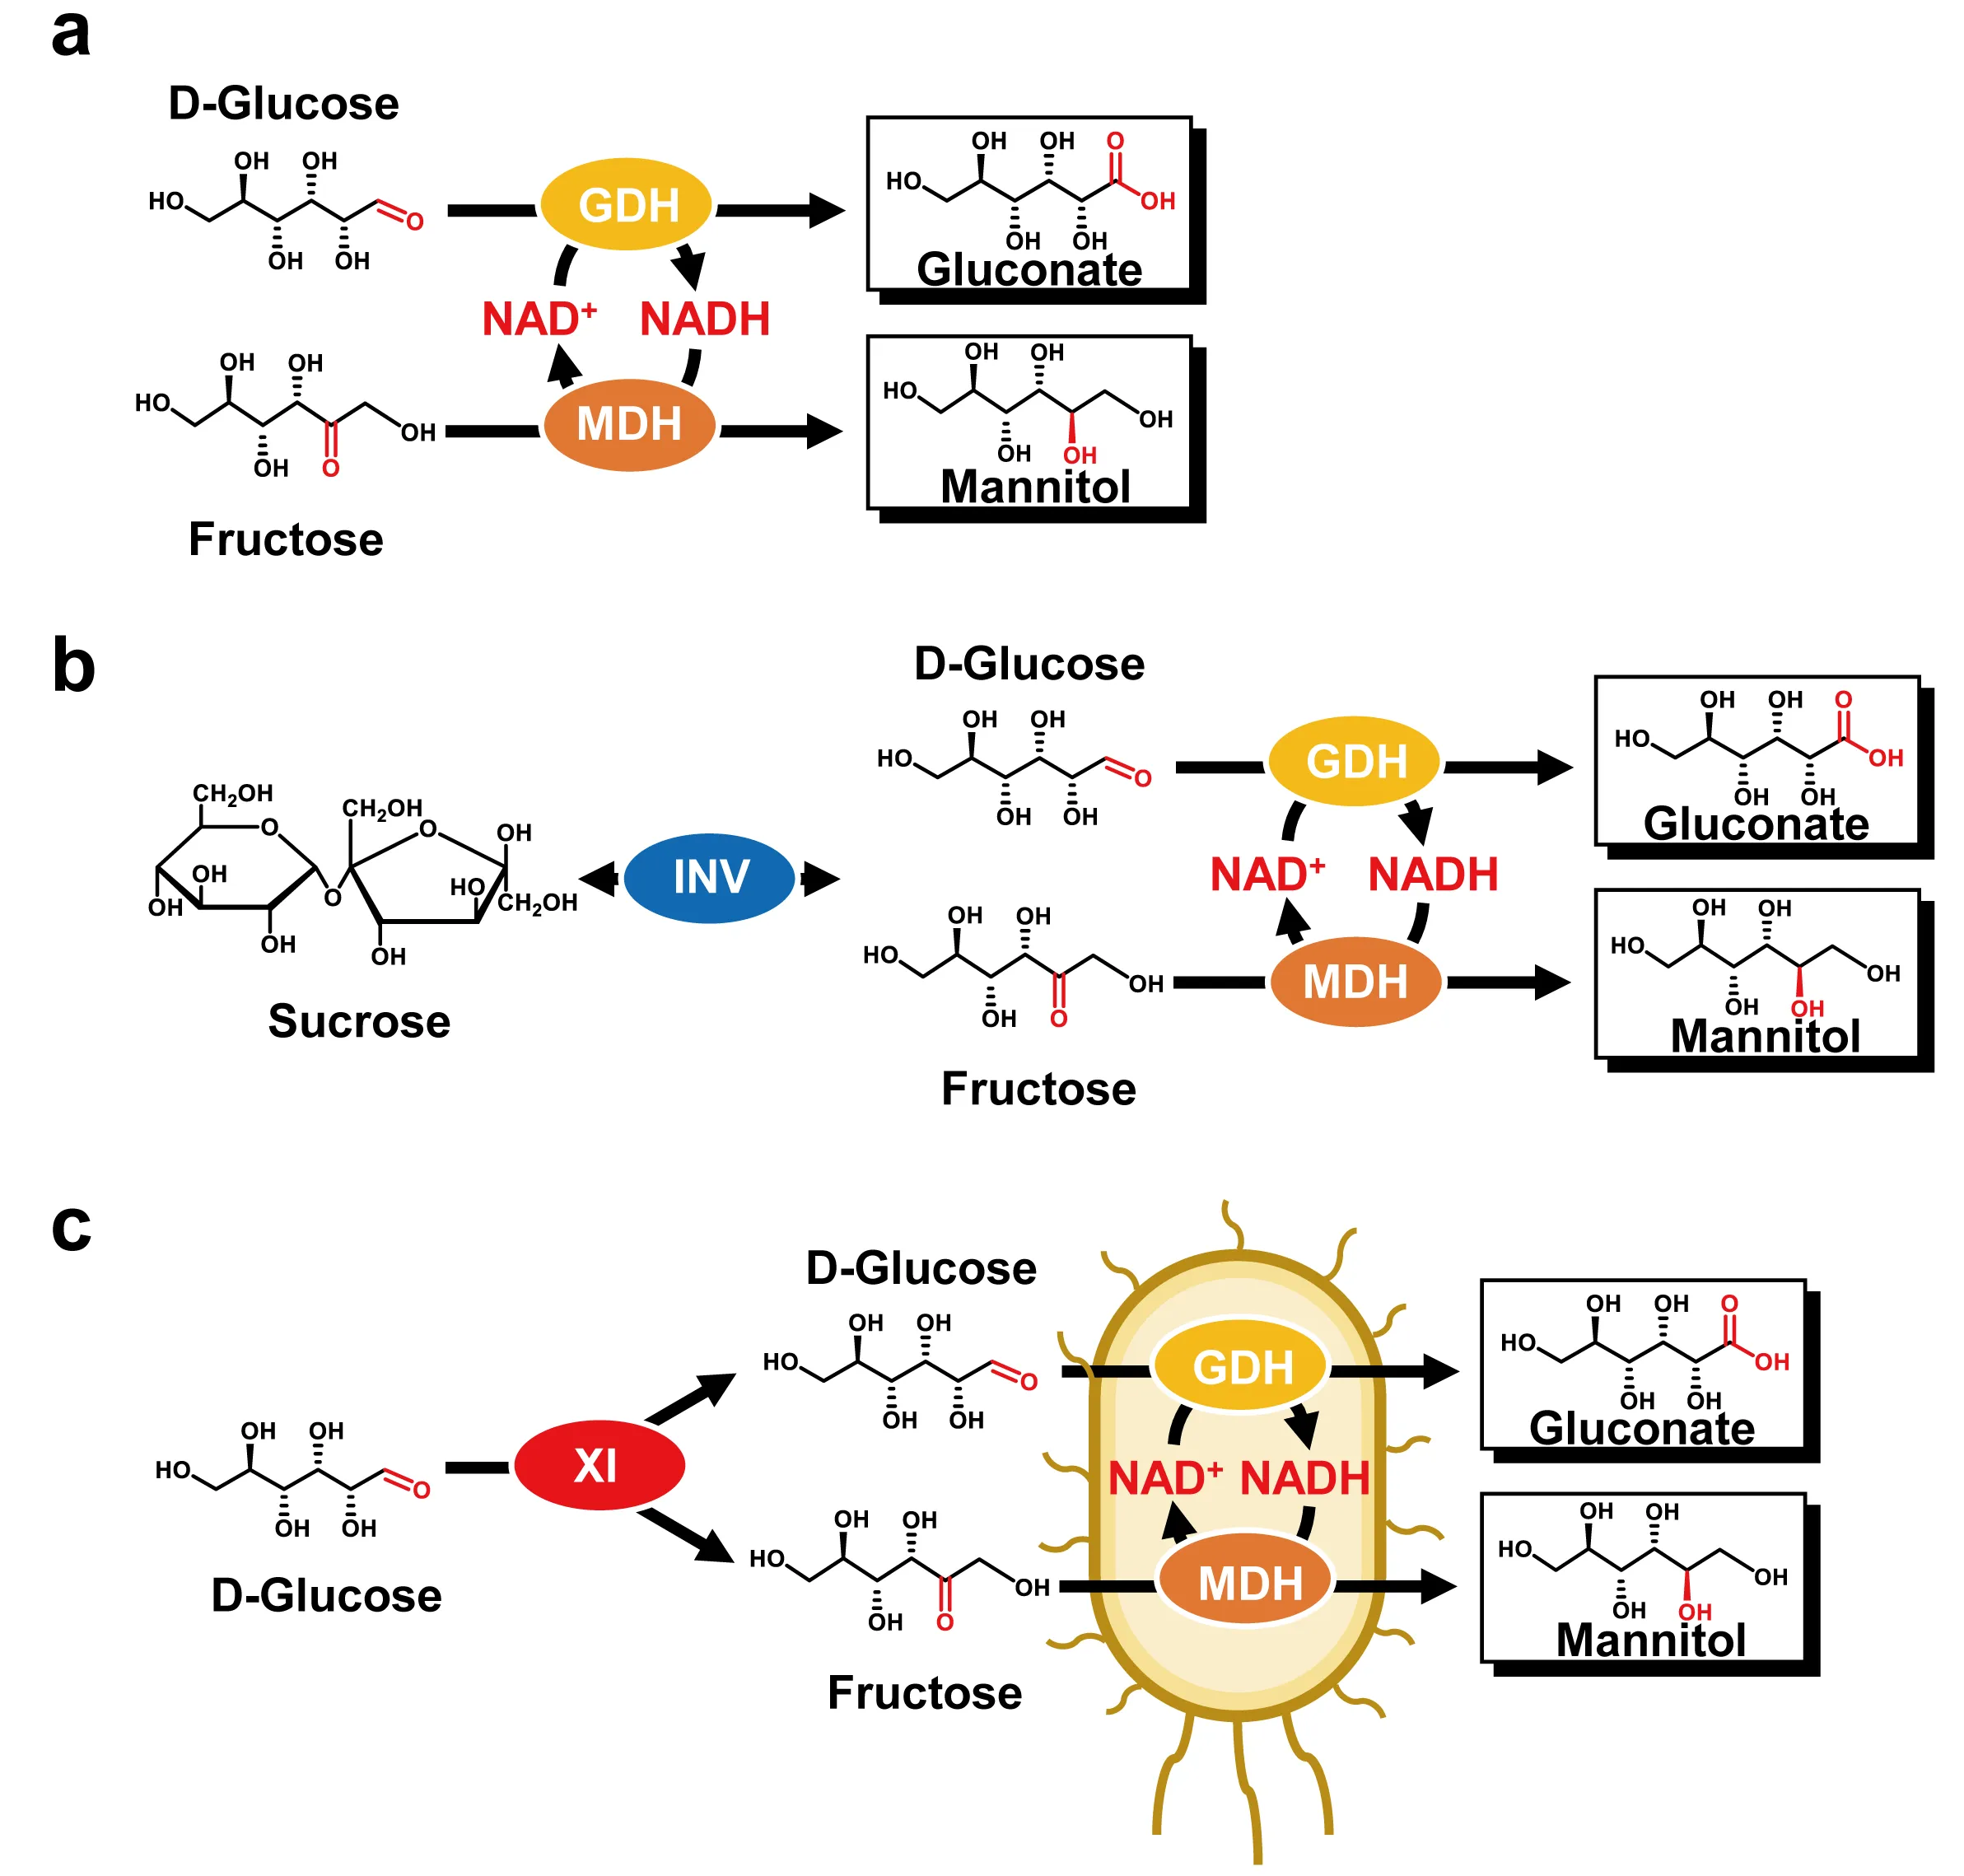
. Schematic presentation of the co-production of mannitol and gluconate. (<strong>a</strong>) Two-enzyme biocatalysis based on GDH and MDH. (<strong>b</strong>) Three-enzyme biocatalysis based on GDH, MDH, and invertase (INV). (<strong>c</strong>) Consolidated biocatalysis based on the whole cell expressing GDH, MDH, and XI.
.
Biotransformation strategies used for the production of d-mannitol.
| Biocatalytic System |
Strategy |
Substrates |
Temperature (°C) |
Time (h) |
Titer (g/L) |
Productivity (g/(L·h)) |
Yield (%) |
References |
| Lactobacillus fermentum CRL 573 |
Fermentation |
Glucose, Fructose |
37 |
24 |
56.8 |
2.40 |
94.5 |
[21] |
| Candida parapsilosis SK26.001 |
Fermentation |
Glucose |
30 |
120 |
97.1 |
0.81 |
34.2 |
[22] |
| Penicillium sp. T2-M10 |
Fermentation |
Glucose |
28 |
168 |
1.26 |
0.75 × 10⁻² |
5.25 |
[23] |
| MDH, XI |
Enzymes |
Glucose, NADH |
60 |
5 |
3.46 |
21.9 |
10.7 |
[24] |
| MDH, FDH |
Enzymes |
Fructose, Formate |
25 |
48 |
72.0 |
2.25 |
80.0 |
[13] |
| MDH, FDH |
Enzymes |
Fructose, Formate |
70 |
40 |
58.3 |
4.37 |
80.0 |
[14] |
IA, αGP, PGM, PGI, M1PDH,
M1Pase, FDH, 4GT, PPGK |
Enzymes |
Maltodextrin, NAD+ |
- |
48 |
39.0 |
- |
87.0 |
[3] |
| MDH, FDH |
Whole cell E. coli |
Fructose, Formate |
30 |
8 |
65.9 |
12.3 |
72.0 |
[15] |
| MDH, FDH |
Whole cell B. megaterium |
Fructose, Formate |
- |
48 |
39.3 |
- |
43.7 |
[17] |
| MDH, FDH |
Whole cell C. glutamicum |
Fructose, Formate |
30 |
24 |
87.0 |
3.48 |
95.0 |
[16] |
| MDH, GDH |
Whole cell E. coli |
Fructose, Glucose |
30 |
24 |
81.9 |
10 |
81.0 |
[18] |
| MDH, FDH, GI |
Whole cell E. coli, GI |
Glucose, Formate, NAD+ |
37 |
40 |
150 |
4.55 |
82.0 |
[20] |
| MDH, GDH, XI |
Whole cell E. coli, XI |
Glucose |
70 |
12 |
129 |
10.7 |
91.7 |
This work |
2. Materials and Methods
2.1. Chemicals, Strains, and Media
All chemicals were reagent grade or higher purity, purchased from Sigma-Aldrich (St. Louis, MO, USA), Sinopharm (Shanghai, China), or Aladdin (Shanghai, China), unless otherwise noted. PrimeSTAR Max DNA Polymerase from Takara (Tokyo, Japan) was used for the PCR reactions; other enzymes for molecular biology experiments were purchased from New England Biolabs (NEB, Ipswich, MA, USA).
E. coli Top10 was used for general molecular cloning, and
E. coli BL21(DE3) was used for recombinant protein expression.
E. coli strains were cultivated in a Luria-Bertani (LB) medium at 37 °C. Kanamycin (50 μg/mL) or ampicillin (100 μg/mL) were antibiotics in the LB media.
2.2. Plasmid Construction
The plasmids are summarized in
. The sequences of all PCR primers are listed in
. Primers were synthesized by GENEWIZ (Suzhou, China). All of the plasmid sequences were validated by DNA sequencing.
The plasmid pET28a-MDH contained the
mdh gene (GenBank no. AAD35386.1) that was amplified from the genomic DNA of
Thermotoga maritima MSB8 by a primer pair of pET28a-MDH-IF and pET28a-MDH-IR. The pET28a vector backbone was amplified with a primer pair of pET28a-MDH-VF and pET28a-MDH-VR. The plasmid pET28a-MDH, based on two DNA fragments, was obtained using Simple Cloning [
25].
For Case One, plasmid pET28a.1-GDH-MDH contained an expression cassette containing the genes
gdh and
mdh. The two genes have RBS and share one T7 promoter and T7 terminator. The
mdh gene with its RBS and T7 terminator was amplified from pET28a-MDH with a primer pair of pET28a.1-GDH-MDH-IF and pET28a.1-GDH-MDH-IR fused with the restriction sequence of
HindIII and
BamHI. The
gdh gene with its T7 promoter, RBS, and pET28a vector backbone was amplified from pET28a-GDH with a primer pair of pET28a.1-GDH-MDH-VF and pET28a.1-GDH-MDH-VR fused with the restriction sequence of
HindIII and
BamHI. The corresponding restriction enzyme digested two DNA fragments and then ligated them to generate the two-gene co-expression plasmid pET28a.1-GDH-MDH.
For Case Two, plasmid pET28a.R1-MDH-GDH contained an expression cassette containing the genes
mdh and
gdh. The two genes have RBS and share one T7 promoter and T7 terminator. The
gdh gene with its RBS and T7 terminator was amplified from pET28a-GDH with a primer pair of pET28a.R1-MDH-GDH-IF and pET28a.R1-MDH-GDH-IR, fused with the restriction sequence of
HindIII and
BamHI. The
mdh gene with its T7 promoter, RBS, and pET28a vector backbone was amplified from pET28a-MDH with a primer pair of pET28a.R1-MDH-GDH-VF and pET28a.R1-MDH-GDH-VR fused with the restriction sequence of
HindIII and
BamHI. The corresponding restriction enzyme digested two DNA fragments and then ligated them to generate the two-gene co-expression plasmid pET28a.R1-MDH-GDH.
For Case Three, plasmid pET28a.2-GDH-MDH contained an expression cassette containing the genes
gdh and
mdh. The two genes have their own T7 promoter, RBS, and T7 terminator. The
mdh gene with its T7 promoter, RBS, and T7 terminator was amplified from pET28a-MDH with a primer pair of pET28a.2-GDH-MDH-IF and pET28a.2-GDH-MDH-IR fused with the restriction sequence of
HindIII and
BamHI. The
gdh gene with its T7 promoter, RBS, T7 terminator, and pET28a vector backbone was amplified from pET28a-GDH with a primer pair of pET28a.2-GDH-MDH-VF and pET28a.2-GDH-MDH-VR fused with the restriction sequence of
HindIII and
BamHI. The corresponding restriction enzyme digested two DNA fragments and then ligated them to generate the two-gene co-expression plasmid pET28a.2-GDH-MDH.
For Case Four, plasmid pET28a.R2-MDH-GDH contained an expression cassette containing the genes
mdh and
gdh. The two genes have their own T7 promoter, RBS, and T7 terminator. The
gdh gene with its T7 promoter, RBS, and T7 terminator was amplified from pET28a-GDH with a primer pair of pET28a.R2-MDH-GDH-IF and pET28a.R2-MDH-GDH-IR, fused with the restriction sequence of
HindIII and
BamHI. The
mdh gene with its T7 promoter, RBS, T7 terminator, and pET28a vector backbone was amplified from pET28a-MDH with a primer pair of pET28a.R2-MDH-GDH-VF and pET28a.R2-MDH-GDH-VR fused with the restriction sequence of
HindIII and
BamHI. The corresponding restriction enzyme digested two DNA fragments and then ligated them to generate the two-gene co-expression plasmid pET28a.R2-MDH-GDH.
.
Plasmids used in this study.
| Plasmids |
Characteristics |
Reference |
| pET28a-GDH |
KanR, an expression cassette containing the GDH protein cloned from Sulfolobus solfataricus |
[26] |
| pET28a-MDH |
KanR, an expression cassette containing the MDH protein cloned from Thermotoga maritima |
This work |
| pET20b-XI |
AmpR, an expression cassette containing the XI protein cloned from Thermus thermophilus |
[27] |
| pET28a.1-GDH-MDH |
KanR, the genes of GDH and MDH have their own RBS; the two genes share one T7 promoter and T7 terminator |
This work |
| pET28a.R1-MDH-GDH |
KanR, the order of GDH and MDH was reversed based on pET28a. 1-GDH-MDH |
This work |
| pET28a.2-GDH-MDH |
KanR, the genes of GDH and MDH have their own T7 promoter, RBS, and T7 terminator. |
This work |
| pET28a.R2-MDH-GDH |
KanR, the order of GDH and MDH was reversed based on pET28a. 2-GDH-MDH |
This work |
.
Primers used in this study.
| Primer |
Primer Sequence (5′-3′) a |
Restriction Site |
| pET28a-MDH-IF |
GTTTAACTTTAAGAAGGAGATATACCAT
GAAAGTACTTTTGATAGAAAAACCCGG |
|
| pET28a-MDH-IR |
GATCTCAGTGGTGGTGGTGGTGGTG
AGAAAAAATTCCCTTCATCAATGCC |
|
| pET-28a-MDH-VF |
CATTGATGAAGGGAATTTTTTCTCACC
ACCACCACCACCACTGAGATCCGGCTG |
|
| pET-28a-MDH-VR |
CAACACTCGCAACACCGGGTTTTTCTATCAAAAG
TACTTTCATGGTATATCTCCTTCTTAAAGTTAAAC |
|
| pET28a.1-GDH-MDH-IF |
CCCAAGCTTAAGAAGGAGATAT
ACATATGAAAGTACTTTTGATAG |
HindIII |
| pET28a.1-GDH-MDH-IR |
CGCGGATCCCGGATATAGTTCCTCCTTTCAGC |
BamHI |
| pET28a.1-GDH-MDH-VF |
CGCGGATCCATTGGCGAATGGGACGCG |
BamHI |
| pET28a.1-GDH-MDH-VR |
CCCAAGCTTGTTAGCAGCCGGATCTCAGTGG |
HindIII |
| pET28a.R1-MDH-GDH-IF |
CCCAAGCTTAAGAAGGAGATATACCATGGGCAG |
HindIII |
| pET28a.R1-MDH-GDH-IR |
CGCGGATCCCGGATATAGTTCCTCCTTTCAGC |
BamHI |
| pET28a.R1-MDH-GDH-VF |
CGCGGATCCATTGGCGAATGGGACGCG |
BamHI |
| pET28a.R1-MDH-GDH-VR |
CCCAAGCTTGTTAGCAGCCGGATCTCAGTGG |
HindIII |
| pET28a.2-GDH-MDH-IF |
CCCAAGCTTCTCGATCCCGCGAAATTAATACG |
HindIII |
| pET28a.2-GDH-MDH-IR |
CGCGGATCCCGGATATAGTTCCTCCTTTCAGC |
BamHI |
| pET28a.2-GDH-MDH-VF |
CGCGGATCCATTGGCGAATGGGACGC |
BamHI |
| pET28a.2-GDH-MDH-VR |
CCCAAGCTTCGGATATAGTTCCTCCTTTCAGC |
HindIII |
| pET28a.R2-MDH-GDH-IF |
CCCAAGCTTCTCGATCCCGCGAAATTAATACG |
HindIII |
| pET28a.R2-MDH-GDH-IR |
CGCGGATCCCGGATATAGTTCCTCCTTTCAGC |
BamHI |
| pET28a.R2-MDH-GDH-VF |
CGCGGATCCATTGGCGAATGGGACGC |
BamHI |
| pET28a.R2-MDH-GDH-VR |
CCCAAGCTTCGGATATAGTTCCTCCTTTCAGC |
HindIII |
2.3. Preparation of Whole Cells and Enzymes
The plasmids were transformed into
E. coli BL21 (DE3) for enzyme expression. Cells transformed with the plasmid were grown on LB agar plates with the appropriate antibiotic at 37 °C overnight. Colonies were chosen for inoculation in 5 mL of LB medium at 37 °C until the absorbance at 600 nm reached about 0.6–0.8. Then 100 μM isopropyl-β-
d-thiogalactopyranoside (IPTG) was added to induce protein expression at 16 °C for 18 h. Fermentation broth was centrifuged at 6000×
g for 10 min, and the cell pellets were washed twice using 0.9% sodium chloride solution. Recombinant cells containing MDH and GDH were harvested and suspended in 50 mM 4-(2-hydroxyethyl)-1-piperazineethanesulfonic acid (HEPES) buffer (pH 7.0) for further use. The protein expression levels of each recombinant
E. coli were evaluated using SDS-PAGE after ultrasonication with the MIULAB UC-650 (Hangzhou, China; 2 s pulse, total 600 s, at 70% amplitude). The cell lysate containing XI was treated in a water bath at 70 °C for 30 min after centrifugation. After centrifugation at 12,000×
g for 5 min, nearly pure XI was obtained in the supernatant. Protein concentration was measured using the Thermo Scientific Pierce Bradford method with bovine serum albumin as a reference protein.
2.4. Comparison of Biocatalytic Efficiency among Four Whole-Cell Cases
Whole-cell reactions were performed in 3 mL of 200 mM HEPES buffer (pH 7.0) containing 20 mM glucose, 20 mM fructose, and 20 OD whole-cells harboring plasmid cases One to Four at 80 °C. Reaction samples were withdrawn at different times. The reactions were terminated by boiling for 10 min. After centrifugation, supernatants were used to quantify intermediates, substrate, and products.
2.5. One-Step Biotransformation from Glucose
The one-step experiment was conducted in a 100 mL pH-controlled bioreactor with a reaction volume of 40 mL, the reaction medium containing 50 g/L glucose, 0.5 g/L XI, five mM MnCl
2, and 25 OD whole cells (Case Four) was performed at 80 °C with stirring at 350 rpm. The pH of the reaction mixture was maintained at pH 7.0 by using 2 M NaOH with a pH controller. Reaction temperatures of 60, 70, 80, and 90 °C were tested to determine the optimal temperature. High substrate concentration of
d-glucose (300 g/L) was conducted at 70 °C with a stirring rate of 350 rpm. The cell–enzyme system contained 3 g/L XI, 150 OD whole cells (Case Four) and 5 mM MnCl
2.
2.6. Two-Step Biotransformation from Glucose
The first-step biotransformation containing 300 g/L glucose, 3 g/L XI, and 5 mM MnCl
2 was conducted at 70 °C. When nearly half of the glucose was converted to fructose, the second-step biotransformation was conducted by adding 150 OD of whole cells (Case Four). The pH of the reaction mixture was maintained at pH 7.0 by using 2 M NaOH with a pH controller.
2.7. Analysis
The concentrations of glucose, fructose, mannitol, and gluconate were determined using HPLC (Shimadzu, Kyoto, Japan) equipped with a Waters Sugar-Pak column (Milford, MA, USA) and a refractive index detector. The column set at 80 °C was eluted at 0.5 mL·min
−1 with a mobile phase of deionized water. Samples were initially diluted in water, followed by filtration through a 0.22 μm hydrophilic poly-(tetrafluoroethylene) syringe filter (Anpel, Shanghai, China). Finally, ten μL of the sample was applied to the column. The data were analyzed and processed using LabSolutions LCGC software (Shimadzu, Kyoto, Japan).
Yields of mannitol, gluconate, and their lumped yield were calculated as following
Equation (1),
Equation (2) and
Equation (3):
3. Results
3.1. The Design of A Biocatalyst Cocktail
The goal of this study was the production of mannitol from glucose, along with the coproduction of gluconate. MDH (EC 1.1.1.67) can convert
d-fructose to mannitol via the hydrogenation from NADH, which can be regenerated from
d-glucose catalyzed by GDH (EC 1.1.1.47). To avoid the addition of costly NAD and simplify the purification of MDH and GDH, it was designed that the co-expression of MDH and GDH in one host facilitated the NAD self-sufficient coupled reactions without NAD (
c). This whole-cell biocatalyst can convert equal amounts of
d-fructose and
d-glucose to mannitol and gluconate. Furthermore, using XI enabled the interconversion of
d-glucose and
d-fructose to reach an equilibrium. As a result, the MDH- and GDH-expressed whole-cell and a purified XI can make both mannitol and gluconate from glucose.
Due to the numerous advantages of hyperthermophilic enzymes in industrial biomanufacturing [
28,
29,
30,
31], we carefully chose MDH from
T. maritima [
24], GDH from
S. solfataricus [
32], and XI from
T. thermophilus [
27] by considering their optimum temperatures, specific activities, and functional expression levels in
E. coli BL21(DE3).
3.2. Optimization of Four Whole-Cell Systems Co-Expressing MDH and GDH
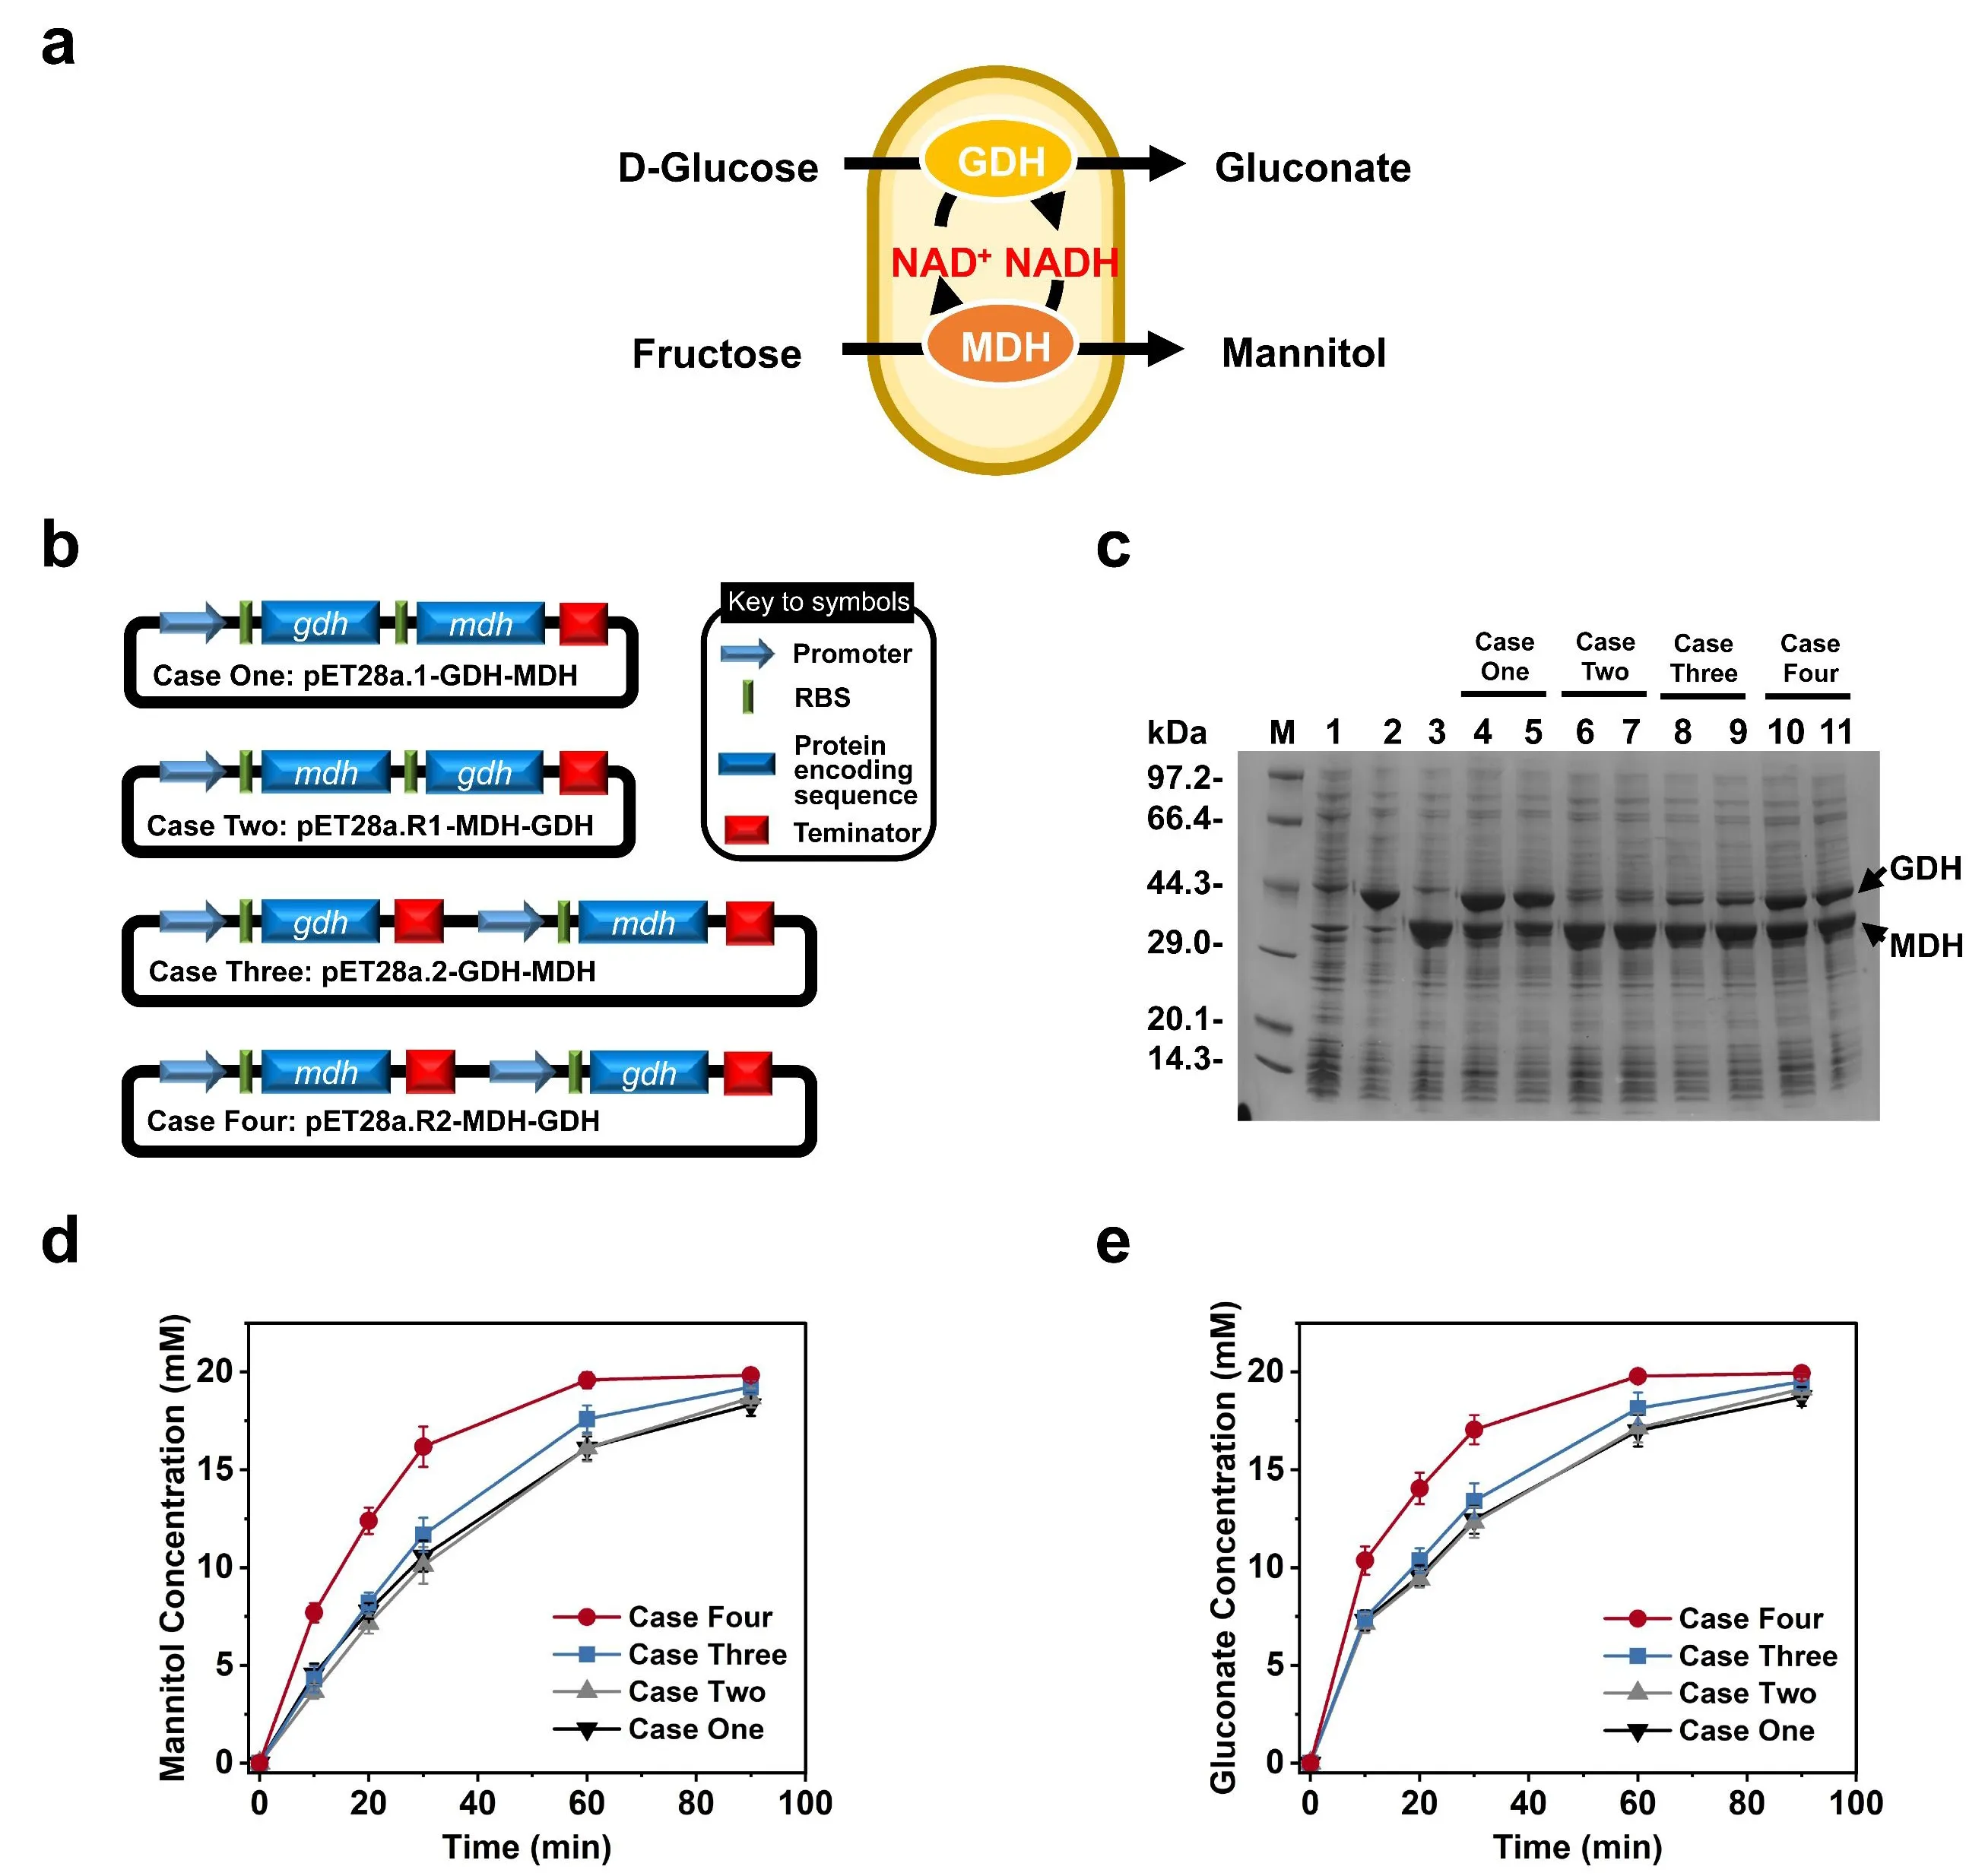
To precisely control MDH and GDH expression levels to balance redox catalytic steps, we constructed four plasmids co-expressing these two genes in different configurations (
b). Four cases were compared to investigate the effects of the organization of the T7 promoter, T7 terminator, and two-gene order in one vector. In Case One, the
gdh and
mdh genes were assembled as a gene cluster, with the
gdh gene upstream of
mdh. In Case Two, the order of the two genes was reversed compared to that of Case One. In Case Three, the
gdh and
mdh genes were controlled by their own T7 promoter and T7 terminator, and the
gdh gene was upstream of the
mdh. In Case Four, the order of the
gdh and
mdh genes was reversed compared to Case Three. As shown in
c, both GDH and MDH were expressed solubly when they were expressed in
E. coli individually (
c, lanes 1–3), and these two enzymes also were co-expressed as soluble proteins in four strains containing Case One (
c, lanes 4 and 5), Case Two (
c, lanes 6 and 7), Case Three (
c, lanes 8 and 9) and Case Four (
c, lanes 10 and 11), the expression levels of GDH and MDH showed significant different among the four strains.
. Construction and comparison of four whole-cell systems. (<strong>a</strong>) Schematic representation of the co-production of mannitol and gluconate using a whole-cell biocatalysis system expressing GDH and MDH. (<strong>b</strong>) Plasmid maps of four cases for co-expression of <em>gdh</em> and <em>mdh</em>: Case One, two genes were assembled as a gene cluster; Case Two, the order of the <em>gdh</em> and <em>mdh</em> genes was reversed based on Case One; Case Three, each gene was controlled by its own T7 promoter and T7 terminator; Case Four, the order of the <em>gdh</em> and <em>mdh</em> genes was reversed from Case Three. (<strong>c</strong>) SDS-PAGE analysis of the <em>E. coli</em> cell extract of four cases. Lane M, protein marker; Lane 1, total proteins of <em>E. coli</em>/pET28a; Lane 2, supernatant of <em>E. coli</em>/pET28a-GDH; Lane 3, supernatant of <em>E. coli</em>/pET28a-MDH; Lane 4 and 5 are the total proteins and supernatant of Case One, respectively; Lane 6 and 7 are the total proteins and supernatant of Case Two, respectively; Lane 8 and 9 are the total proteins and supernatant of Case Three, respectively; Lane 10 and 11 are the total proteins and supernatant of Case Four, respectively. The arrows indicate the expressed GDH and MDH in <em>E. coli</em>—comparison of the production of (<strong>d</strong>) mannitol and (<strong>e</strong>) gluconate by four co-expression whole cell cases.
In Case One and Case Two, two genes were expressed as a cluster, but the order of the genes was reversed. In Case One, the expression level of GDH was higher than that of MDH, while in Case Two, the opposite was observed. A comparison between Case One and Two suggested that upstream genes typically exhibit higher expression levels than downstream genes. For Case Three and Case Four, each gene was controlled by its own T7 promoter and T7 terminator, making the expression of each gene independent of the other. The expression level of MDH was higher in Case Three than in Case One, and the expression level of GDH was higher in Case Four than in Case Two. Comparisons between Case One and Case Three, as well as Case Two and Case Four, indicated that including a T7 terminator behind each gene helps to enhance the expression of the following gene. These findings suggest that the organization of the T7 promoter, T7 terminator, and the order of genes in a vector may influence the expression levels of the two enzymes. Therefore, the plasmid configuration should be carefully considered when co-expressing enzymes in a single plasmid.
The four whole cell systems co-expressing MDH and GDH were used to convert fructose and glucose into the respective mannitol and gluconate at pH 7.0. The concentrations of mannitol and gluconate increased rapidly during the first thirty minutes, and the reactions leveled off over the next sixty minutes (
d,e). In all four cases, substrates were converted entirely to products at the end of the reactions. However, when whole cells from Case Four were used as catalysts, the productivities of mannitol (
d) and gluconate (
e) were highest, probably owing to the similar expression levels of MDH and GDH in Case Four. Thus, the Case Four strain was chosen to produce mannitol and gluconate for the following experiments.
3.3. Coproduction of Mannitol and Gluconate from Glucose
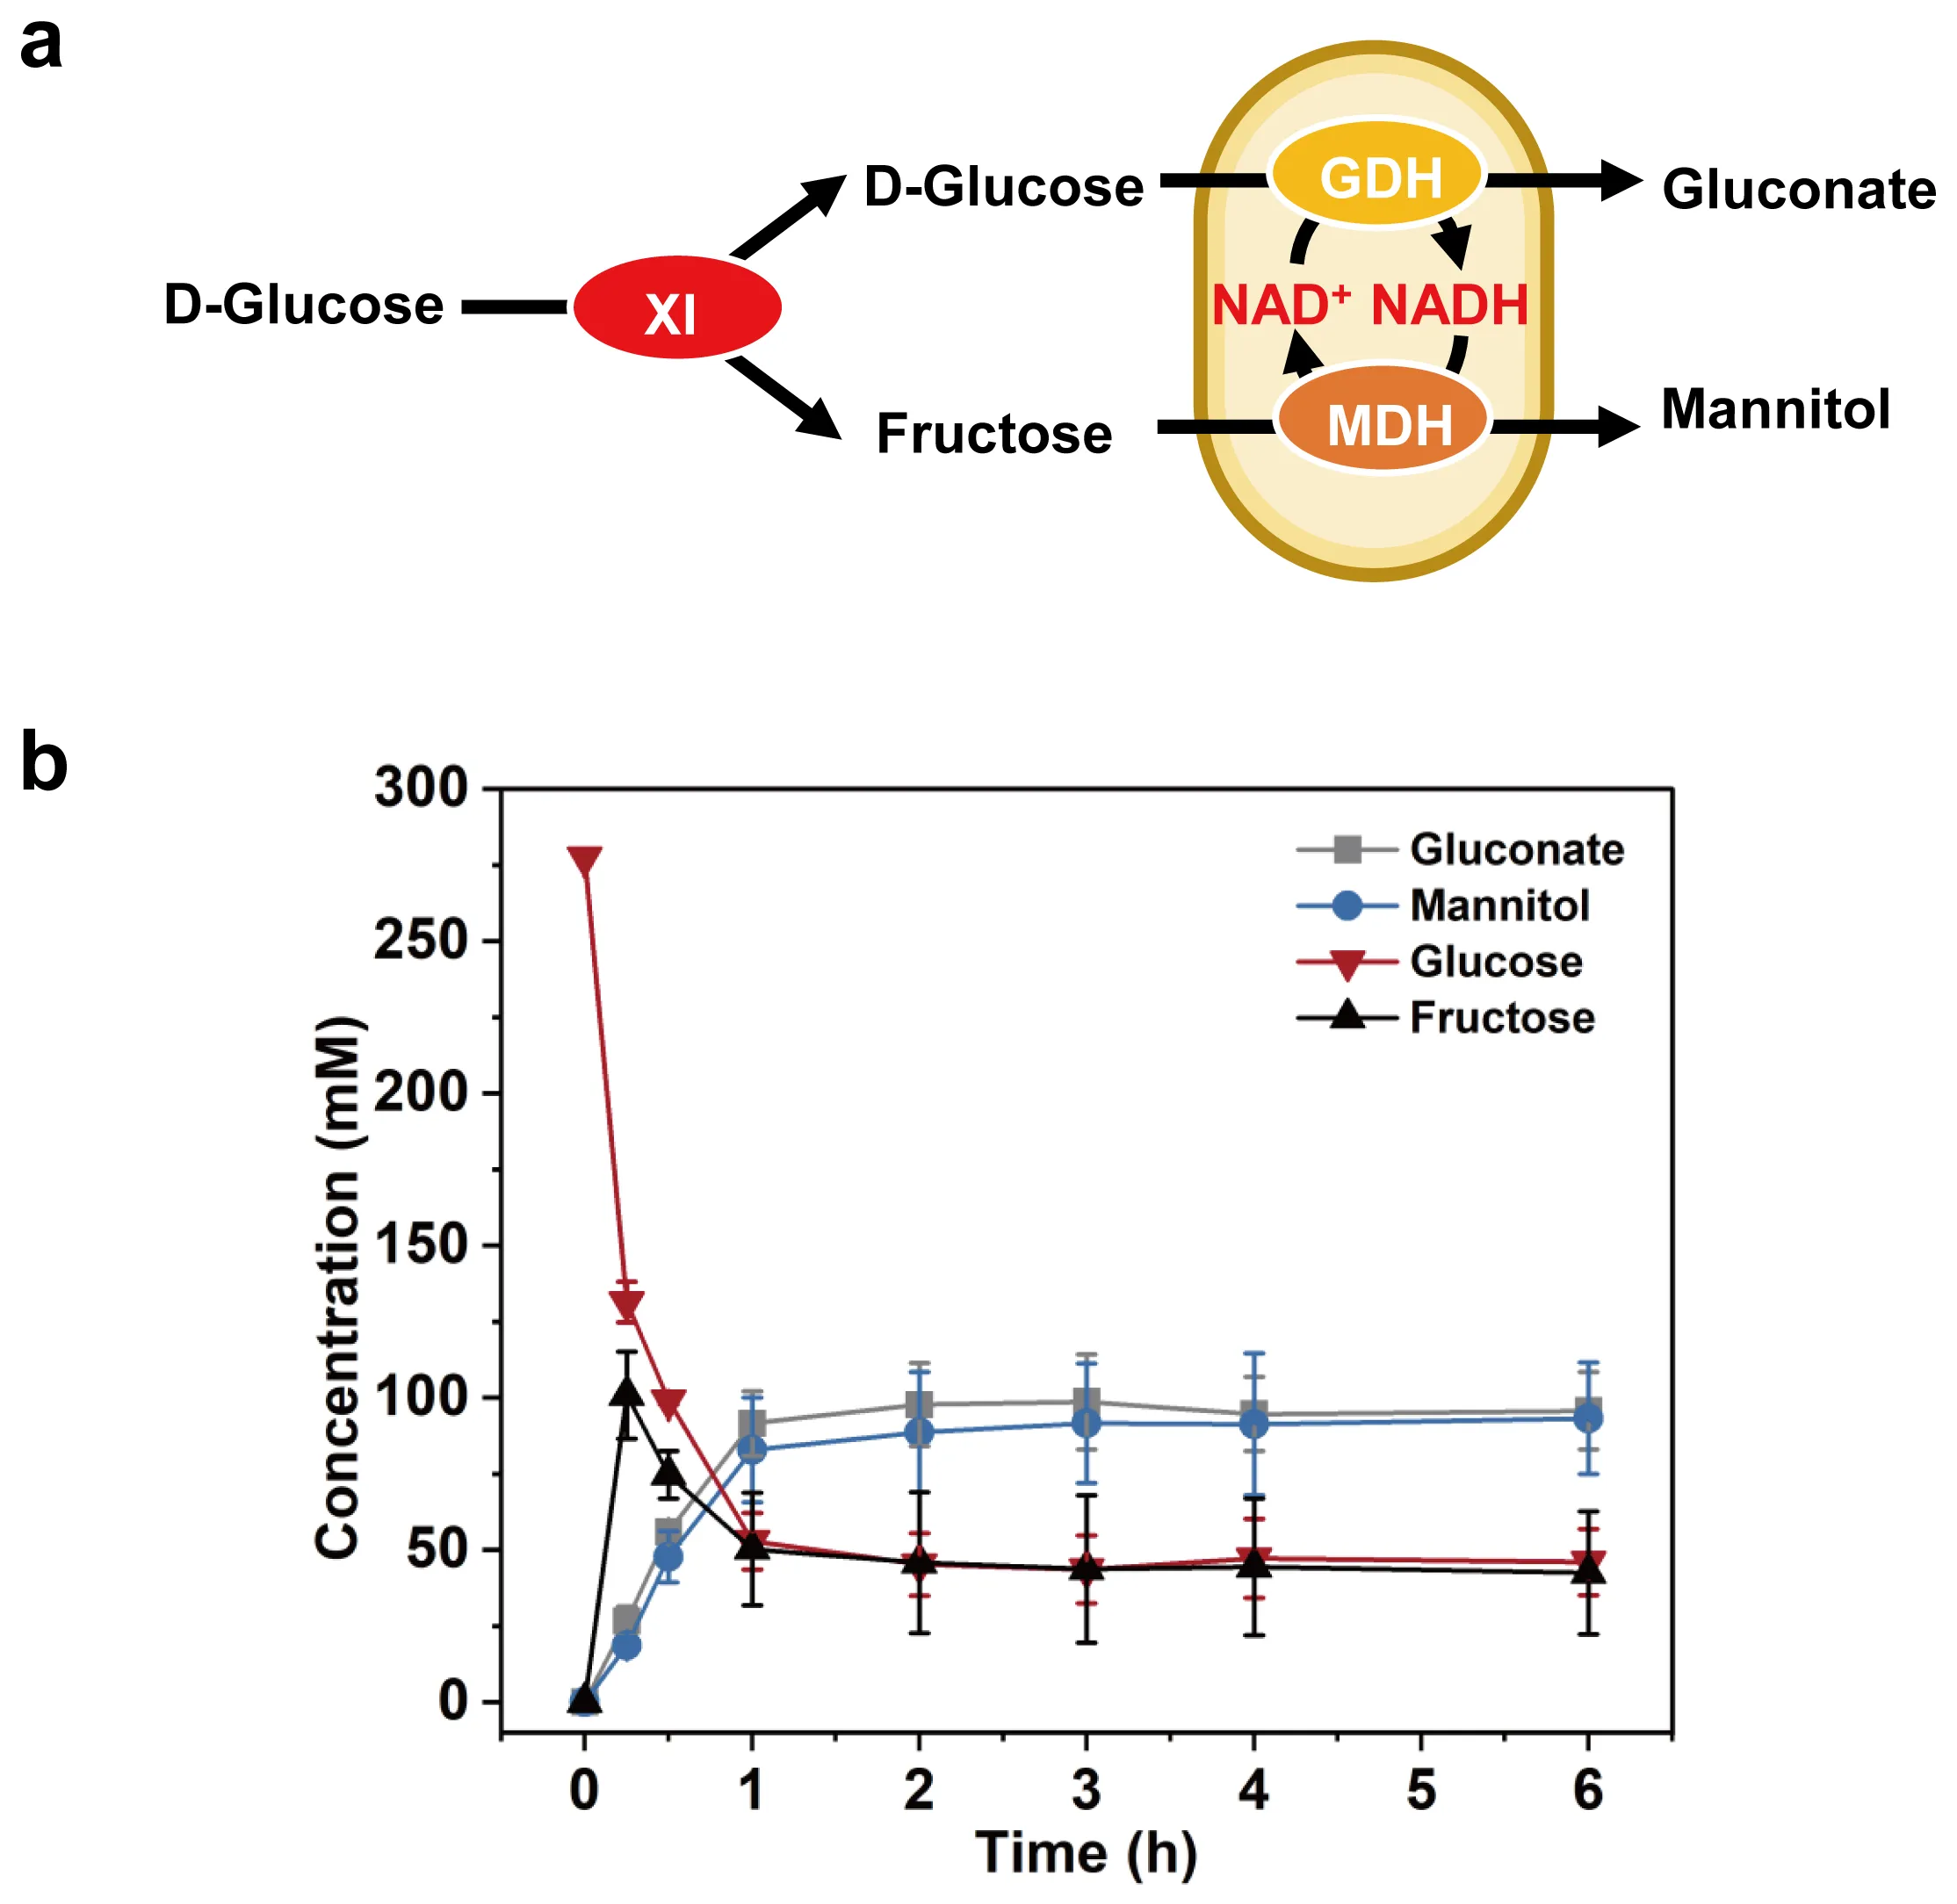
To coproduce mannitol and gluconate from glucose, we added the purified XI to the whole cell system (
a). The
E. coli strain expressed Hyperthermophilic XI, and its cell lysate was heat-treated to obtain a purified XI (
Figure S1). The reaction was conducted in a 100-mL bioreactor at 80 °C for 6 h. When 50 g/L glucose was used as substrate, there was a fructose peak at 0.25 h; at this point, 20.0 g/L fructose had been generated. Subsequently, the concentration of fructose decreased in parallel with glucose. Mannitol and gluconate were produced quickly during the first 1 h, followed by a slowing down. At 6 h, the biocatalyst cocktail made 17.0 g/L mannitol and 18.8 g/L gluconate, corresponding to a lumped product yield of 68.1% (
b). These results showed the feasibility of the cell–enzyme (tandem) system. However, the yield was relatively low, necessitating further optimization.
. Proof-of-concept experiments for the co-production of mannitol and gluconate from glucose. (<strong>a</strong>) Schematic representation of co-production of mannitol and gluconate from glucose using the whole cell and XI. (<strong>b</strong>) Time profile of co-production of mannitol and gluconate by the whole-cell (Case Four) from 50 g/L glucose at 80 °C. Values shown are means of triplicate determinations.
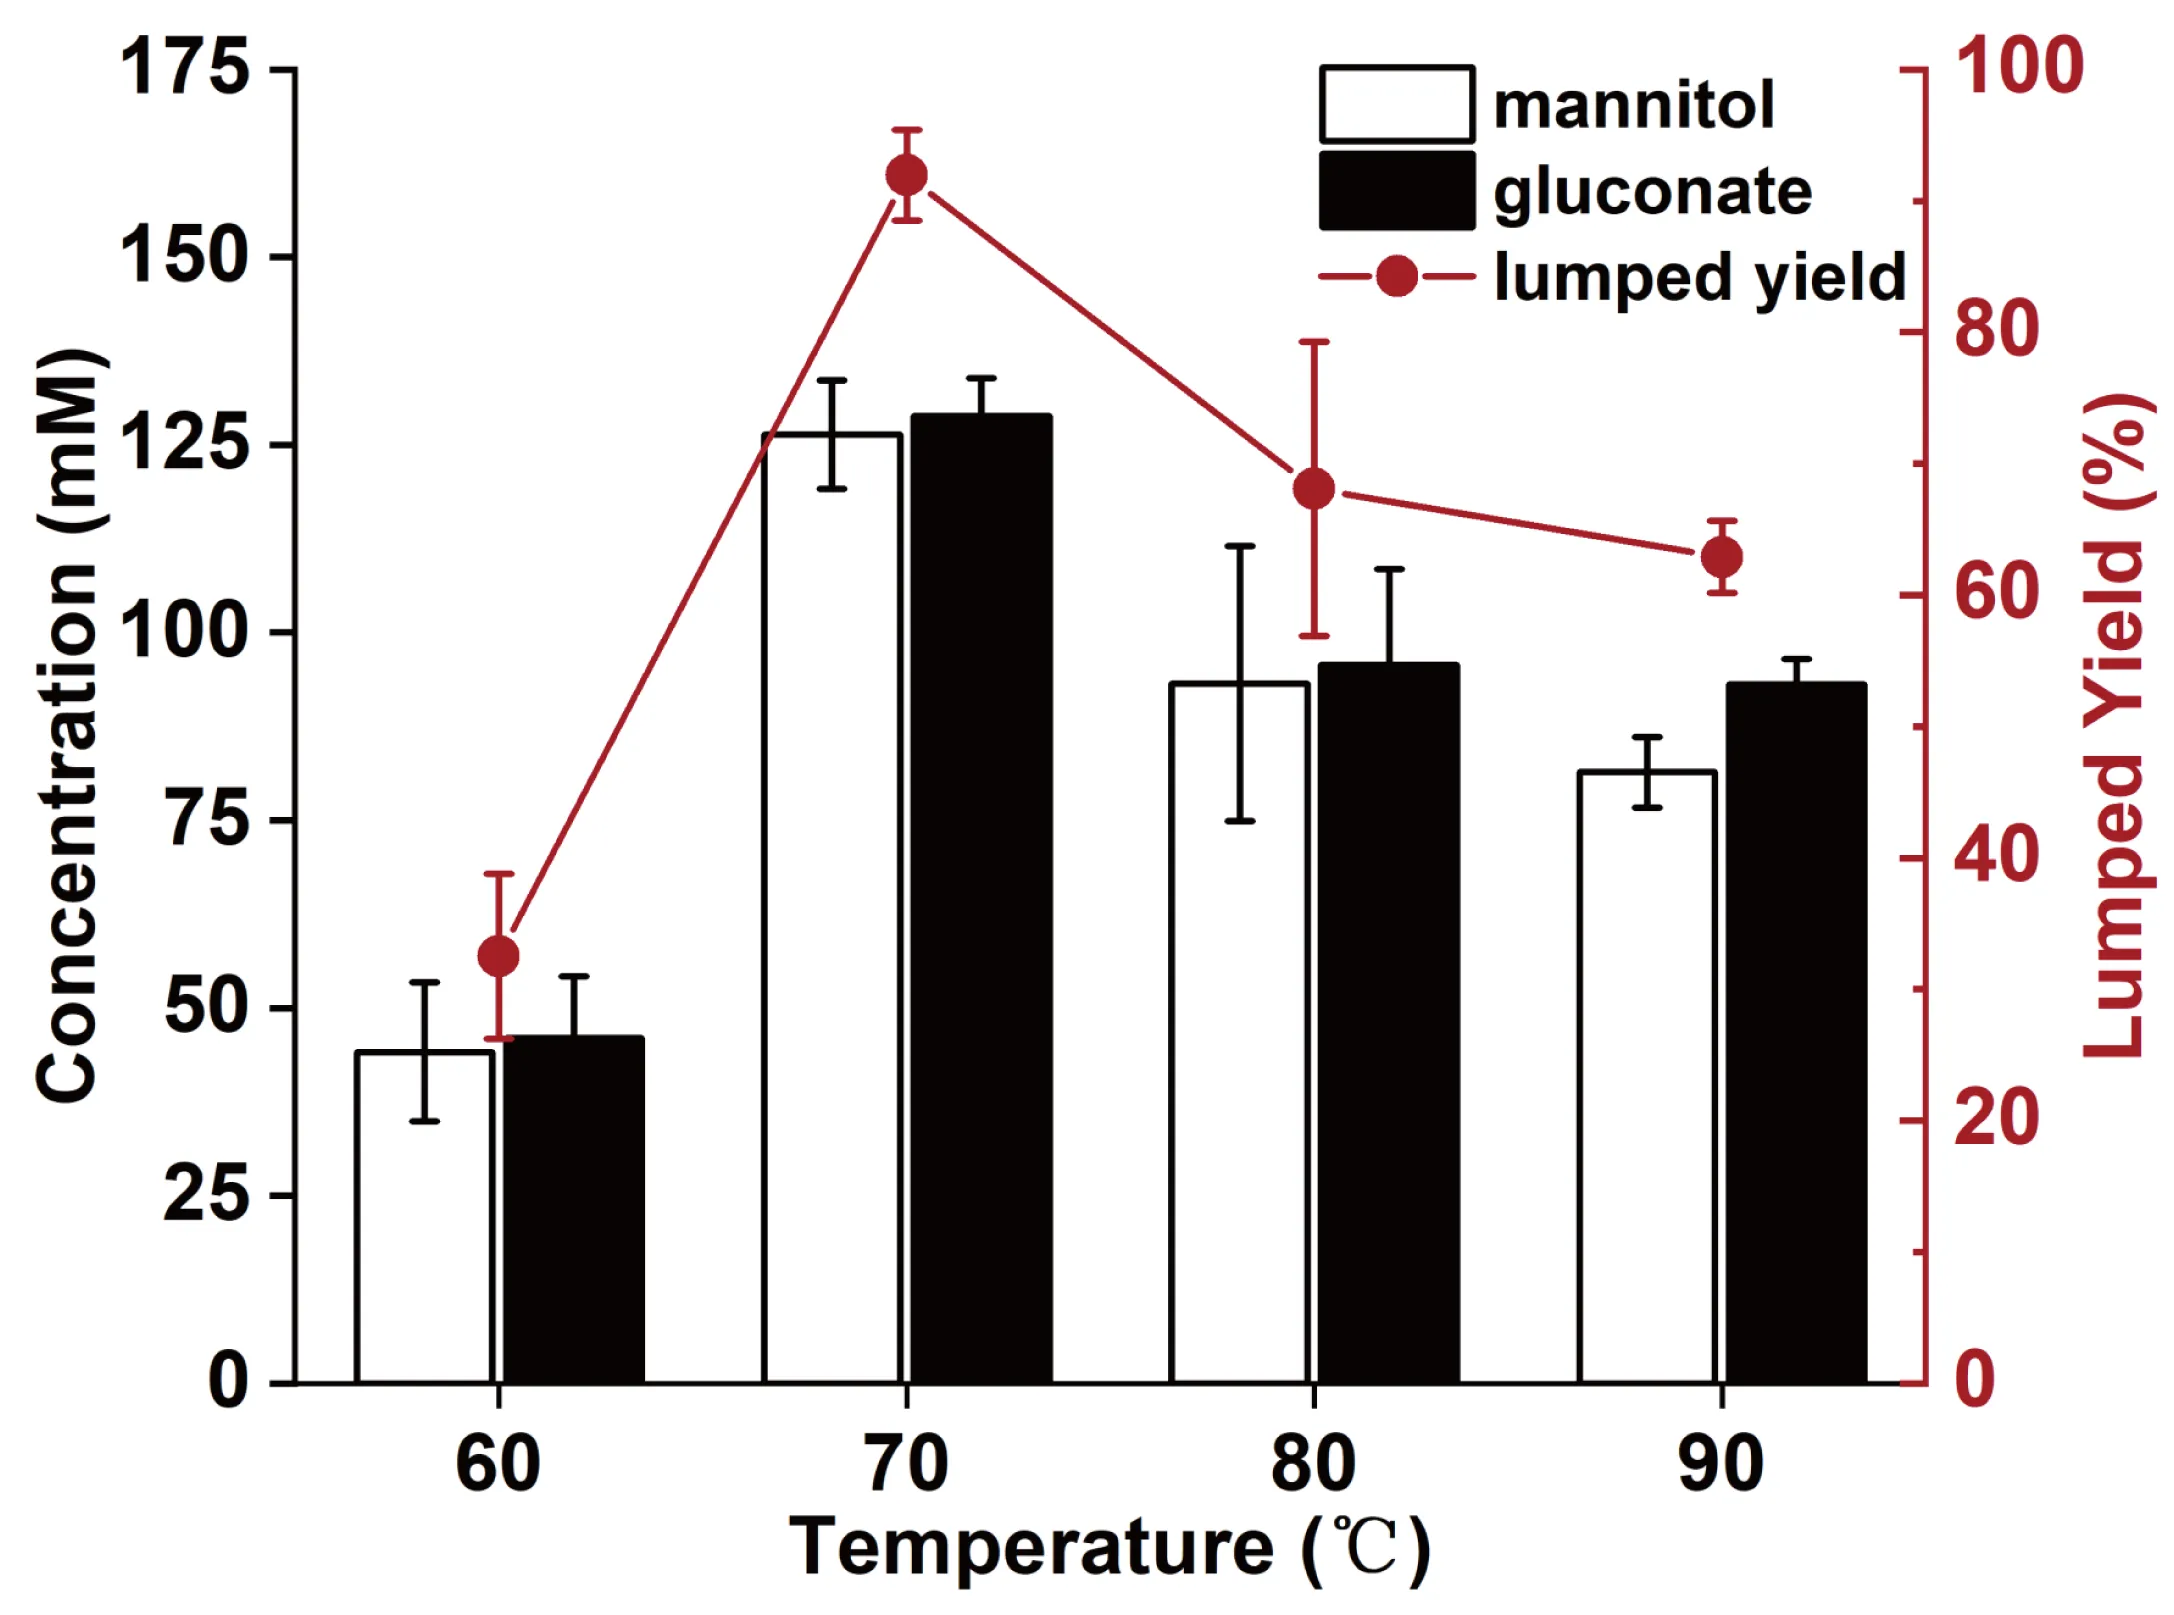
The reaction temperature was optimized from 60 to 90 °C (
) because it influenced the specific activities of enzymes, cellular membrane intactness, and substrate/product diffusion. The concentrations of mannitol and gluconate were almost equal at 60–80 °C, while the concentration of gluconate was 14.4% higher than that of mannitol at 90 °C. At 60 °C, the lumped yield was lowest. When the reaction temperature was elevated to 70 °C, two products were mildly increased, probably owing to low enzyme activities at 60 °C for all three enzymes. When the reaction temperature was further increased to 80 and 90 °C, the yields significantly decreased, probably due to the thermal deactivation of enzymes. It was found that the optimal reaction temperature was 70 °C, and the lumped yield was enhanced from 68.1% at 80 °C to 92.0% at 70 °C.
. Effects of reaction temperature of <i>E. coli</i>/pET28a.R2-MDH-GDH whole cell (Case Four).
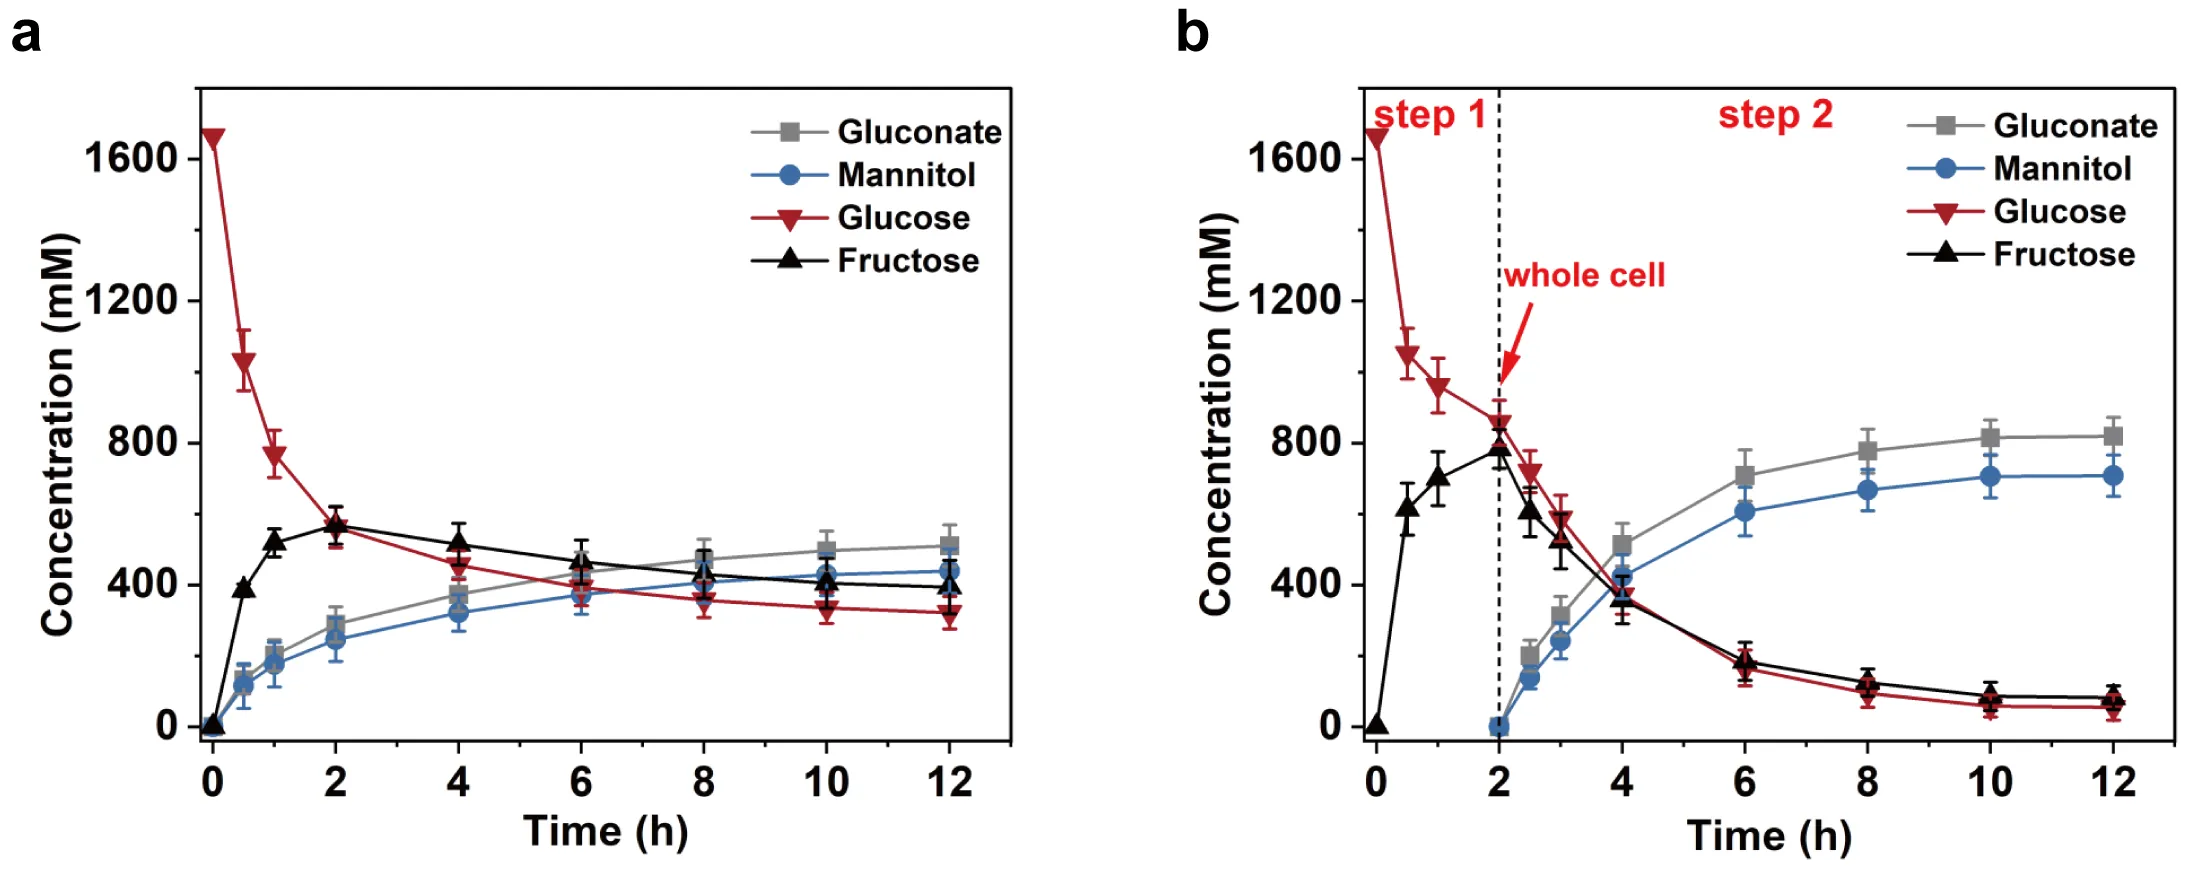
The glucose concentration was increased to 300 g/L, and the enzyme and cell loadings were also increased by six-fold. As the glucose concentration increased, it took longer to reach the steady state. One-step bioprocess that simultaneously added XI and whole cells was proposed (
a). During the first 2 h of the reaction, the glucose concentration decreased sharply, while the intermediate fructose concentration increased significantly; the concentration of fructose remained consistently much lower than that of glucose. A peak in fructose concentration was observed at 2 h, with 102 g/L of fructose produced. After this point, both glucose and fructose decreased slowly and synchronously. The reaction reached equilibrium around 12 h, yielding 80 g/L of mannitol and 100 g/L of gluconate, corresponding to productivities of 6.67 g/L/h for mannitol and 8.34 g/L/h for gluconate. However, the lumped yield was only 57.0%. The rationale for a switch from a one-step to a two-step process was the kinetic mismatch between MDH on fructose and GDH on glucose. When XI loading was small, the ratio of glucose to fructose was far higher than one, resulting in a mismatch of activities between MDH and GDH. When XI loading was sufficient, resulting in nearly equal molar ratios of glucose to fructose, the matching activities of MDH and GDH led to fast synthesis rates for both MDH and GDH.
A two-step bioprocess was proposed to match the rates of MDH and GDH (
b). XI was added to transform half of the glucose into fructose at the first step, and then the
E. coli cells were added to the reactor at the second step. During the first 2 h of the reaction, glucose was sharply isomerized to fructose. 155 g/L Fructose had been produced at 2 h, while the glucose concentration decreased to 141 g/L. With the addition of whole cells, the concentration of mannitol and gluconate in the reaction system quickly increases to 110 and 139 g/L from the consumption of 98 g/L fructose and 134 g/L glucose, respectively, in the first 4 h. The productivity of mannitol was sped up from 6.67 g/L/h to 10.7 g/L/h relative to
a upon optimization, as equilibrium was reached at 12 h. It was observed that the reaction solution was browning throughout the experiments. At equilibrium, the final mannitol and gluconate concentrations increased to 129 and 161 g/L, respectively, with a lumped yield of 91.7%, significantly higher than the product yield of 57.0% in the one-step experiment.
. Time profiles of mannitol and gluconate biotransformation from 300 g/L glucose catalyzed by a combined biocatalyst containing the whole cell and XI in two operative modes: (<strong>a</strong>) one-step and (<strong>b</strong>) two-step.
4. Discussion
We combined the whole-cell co-expressing MDH and GDH and a purified XI to coproduce high titers of mannitol and gluconate from glucose at high temperatures. The use of thermostable enzymes XI, GDH, and MDH, the optimization of the two-enzyme expression, the use of NAD internally-regeneration in whole cells, and the employment of the two-step operation mode enabled the production of approximately 129 g/L mannitol and 161 g/L gluconate from 300 g/L glucose. As compared to the previous reports of mannitol production, this method features many advantages: (i) the use of the three hyper-thermophilic enzymes, facilitating high reaction temperature with such features as low viscosity, easy preparation of enzymes [
33], deactivation of
E. coli inherent enzymes [
34], low contamination risks; (ii) the use of glucose as a single substrate, rather than a mixed substrate containing both
d-fructose and
d-glucose; and (iii) high titers, high yields, and productivity (
).
In this study, we employed a combination of whole cell and a purified enzyme. Whole-cell biocatalysts not only avoid the addition of costly NAD, but also the cell membrane enables to two adjacent MDH and GDH to recycle NAD rapidly [
35]. Initially, we attempted to co-express three enzymes in one host by constructing the pACYCduet-XI plasmid and co-expressing it with the plasmid co-expressing MDH and GDH in
E. coli BL21. The low expression level of XI resulted in a very slow initial reaction rate (data not shown). Therefore, we added a purified XI to the whole cells. The loading of XI can be optimized easily to match the enzyme and the whole cells.
The coproduction of gluconate and mannitol could be operative because the latter has a much lower water solubility than gluconate (
i.e., 130 g/L for mannitol compared to 620 g/L for gluconate) [
36]. After simple crystallization, sodium gluconate in the supernatant could be used directly as a concrete set retarder. The market size of gluconate is far larger than that of mannitol, especially sodium gluconate, which functions primarily as a concrete set retarder, slowing down the initial setting and hardening of the cement paste [
37,
38].
To further implement the industrial applicability of this biocatalyst cocktail, several issues need to be addressed to decrease biocatalyst costs involving both whole cells and XI. First, coating cells with a protective shell, such as metal−organic frameworks [
39], mineralized oxides [
29], and polyphenols [
40] could be applied to prolong the lifetime of whole cells and restrict more efficiency of NAD self-sufficient recycling. Second, XI could be immobilized [
41] or displayed on the surface of whole cells [
42] to prolong the lifetime. Third, all of these three enzymes could be engineered for better thermostability and more activity [
43,
44]. The browning was developing in the scaled-up reaction with high substrate concentrations, possibly due to the Maillard reaction. The reducing sugar reacts with the amino acid groups of enzymes in the Maillard reaction, impairing enzyme activity [
45,
46]. To minimize the potential impact of the Maillard reaction, it could be controlled by lowering the pH [
47], reducing the temperature [
48], and decreasing the oxygen levels [
45].
In conclusion, we demonstrated that mannitol and gluconate can be produced from glucose in a pH-controlled bioreactor using a cell–enzyme tandem system at 70 °C. This biotransformation that did not need the addition of NAD produced approximately 129 g/L mannitol and 161 g/L gluconate from 300 g/L glucose. It had high product titers, yields, and productivity (
). The use of hyperthermophilic enzymes, regardless of the form in which they are used, in the form of whole cells, purified enzymes, or their combination, could greatly facilitate the industrial biomanufacturing of numerous biocommodities [
28,
41].
Supplementary Materials
The following supporting information can be found at: https://www.sciepublish.com/article/pii/611.
Figure S1. SDS-PAGE analysis of XI. Lane M, protein marker; Lane T, total proteins of
E. coli/ pET20b-XI; Lane S, supernatant of
E. coli/ pET20b-XI; Lane H, heat-treated supernatant of
E. coli/ pET20b-XI.
Author Contributions
Y.-H.P.J.Z. conceived the synthetic pathway. X.L. and Y.-H.P.J.Z. designed the experiments, analyzed the data, and wrote the manuscript. P.H. conducted experiments, X.L. performed the experiments. All authors read and approved the manuscript.
Ethical Statement
This article does not contain any studies with human participants or animals performed by any of the authors.
Informed Consent Statement
Not applicable.
Data Availability Statement
The datasets generated during and/or analyzed during the current study are available from the corresponding author on reasonable request.
Funding
This research was funded by the National Key Research and Development Program of China, grant number 2022YFA0912000.
Declaration of Competing Interest
The authors declare that they have no conflict of interest.
References
-
1.
Chen M, Zhang W, Wu H, Guang C, Mu W. Mannitol: Physiological functionalities, determination methods, biotechnological production, and applications.
Appl. Microbiol. Biotechnol. 2020,
104, 6941–6951. doi:10.1007/s00253-020-10757-y.
[Google Scholar]
-
2.
Livesey G. Health potential of polyols as sugar replacers, with emphasis on low glycaemic properties.
Nutr. Res. Rev. 2003,
16, 163–191. doi:10.1079/nrr200371.
[Google Scholar]
-
3.
Wei X, Li Q, Hu C, You C. An ATP-free in vitro synthetic enzymatic biosystem facilitating one-pot stoichiometric conversion of starch to mannitol.
Appl. Microbiol. Biotechnol. 2021,
105, 1913–1924. doi:10.1007/s00253-021-11154-9.
[Google Scholar]
-
4.
Patra F, Tomar SK, Arora S. Technological and functional applications of low-calorie sweeteners from lactic acid bacteria.
J. Food. Sci. 2009,
74, R16–R23. doi:10.1111/j.1750-3841.2008.01005.x.
[Google Scholar]
-
5.
Rapoport SI. Advances in osmotic opening of the blood-brain barrier to enhance CNS chemotherapy.
Expert. Opin. Investig. Drugs. 2001,
10, 1809–1818. doi:10.1517/13543784.10.10.1809.
[Google Scholar]
-
6.
Research GV. Mannitol Market Size, Share & Trends Analysis Report by Application (Food Additive, Pharmaceuticals, Industrial, Surfactants), by Region (North America, Europe, Asia Pacific, Latin America, MEA), and Segment Forecasts, 2025–2030. Available online: https://www.grandviewresearch.com/industry-analysis/mannitol-market (accessed on 24 February 2025).
-
7.
Jacobsen JH, Frigaard N-U. Engineering of photosynthetic mannitol biosynthesis from CO
2 in a
cyanobacterium.
Metab. Eng. 2014,
21, 60–70. doi:10.1016/j.ymben.2013.11.004.
[Google Scholar]
-
8.
Song SH, Vieille C. Recent advances in the biological production of mannitol.
Appl. Microbiol. Biotechnol. 2009,
84, 55–62. doi:10.1007/s00253-009-2086-5.
[Google Scholar]
-
9.
Saha BC, Racine FM. Biotechnological production of mannitol and its applications.
Appl. Microbiol. Biotechnol. 2011,
89, 879–891. doi:10.1007/s00253-010-2979-3.
[Google Scholar]
-
10.
Hendriksen HV, Mathiasen TE, Adlernissen J, Frisvad JC, Emborg C. Production of mannitol by
penicillium strains.
J. Chem. Technol. Biotechnol. 1988,
43, 223–228. doi:10.1002/jctb.280430308.
[Google Scholar]
-
11.
Saha BC, Nakamura LK. Production of mannitol and lactic acid by fermentation with
Lactobacillus intermedius NRRL B-3693.
Biotechnol. Bioeng. 2003,
82, 864–871. doi:10.1002/bit.10638.
[Google Scholar]
-
12.
Wisselink HW, Weusthuis RA, Eggink G, Hugenholtz J, Grobben GJ. Mannitol production by lactic acid bacteria: A review.
Int. Dairy. J. 2002,
12, 151–161. doi:10.1016/s0958-6946(01)00153-4.
[Google Scholar]
-
13.
Slatner M, Nagl G, Haltrich D, Kulbe KD, Nidetzky B. Enzymatic production of pure
d-mannitol at high productivity.
Biocatal. Biotransform. 1998,
16, 351–363. doi:10.3109/10242429809003628.
[Google Scholar]
-
14.
Xu W, Lu F, Wu H, Zhang W, Guang C. Identification of a highly thermostable mannitol 2-dehydrogenase from
Caldicellulosiruptor morganii Rt8.B8 and its application for the preparation of
d-mannitol.
Process. Biochem. 2020,
96, 194–201. doi:10.1016/j.procbio.2020.05.014.
[Google Scholar]
-
15.
Kaup B, Bringer-Meyer S, Sahm H. Metabolic engineering of
Escherichia coli: Construction of an efficient biocatalyst for
d-mannitol formation in a whole-cell biotransformation.
Appl. Microbiol. Biotechnol. 2004,
64, 333–339. doi:10.1007/s00253-003-1470-9.
[Google Scholar]
-
16.
Baeumchen C, Bringer-Meyer S. Expression of
glf Z.m. increases
d-mannitol formation in whole cell biotransformation with resting cells of
Corynebacterium glutamicum.
Appl. Microbiol. Biotechnol. 2007,
76, 545–552. doi:10.1007/s00253-007-0987-8.
[Google Scholar]
-
17.
Baumchen C, Roth AHFJ, Biedendieck R, Malten M, Follmann M, Sahm H, et al.
d-Mannitol production by resting state whole cell biotrans-formation of
d-fructose by heterologous mannitol and formate dehydrogenase gene expression in
Bacillus megaterium.
Biotechnol. J. 2007,
2, 1408–1416. doi:10.1002/biot.200700055.
[Google Scholar]
-
18.
Pan S, Hu M, Pan X, Lyu Q, Zhu R, Zhang X, et al. Efficient biosynthesis of
d-mannitol by coordinated expression of a two-enzyme cascade.
Chin. J. Biotechnol. 2022,
38, 2549–2565. doi:10.13345/j.cjb.220059.
[Google Scholar]
-
19.
Betancor L, López-Gallego F. Cell–enzyme tandem systems for sustainable chemistry.
Curr. Opin. Green. Sustain. Chem. 2022,
34, 100600. doi:10.1016/j.cogsc.2022.100600.
[Google Scholar]
-
20.
Kaup B, Bringer-Meyer S, Sahm H.
d-Mannitol formation from
d-glucose in a whole-cell biotransformation with recombinant
Escherichia coli.
Appl. Microbiol. Biotechnol. 2005,
69, 397–403. doi:10.1007/s00253-005-1996-0.
[Google Scholar]
-
21.
Rodriguez C, Rimaux T, Jose Fornaguera M, Vrancken G, Font de Valdez G, De Vuyst L, et al. Mannitol production by heterofermentative
Lactobacillus reuteri CRL 1101 and
Lactobacillus fermentum CRL 573 in free and controlled pH batch fermentations.
Appl. Microbiol. Biotechnol. 2012,
93, 2519–2527. doi:10.1007/s00253-011-3617-4.
[Google Scholar]
-
22.
Meng Q, Zhang T, Wei W, Mu W, Miao M. Production of mannitol from a high concentration of glucose by
Candida parapsilosis SK26.001.
Appl. Biochem. Biotechnol. 2017,
181, 391–406. doi:10.1007/s12010-016-2219-0.
[Google Scholar]
-
23.
Duan R, Li H, Li H, Tang L, Zhou H, Yang X, et al. Enhancing the production of
d-mannitol by an artificial mutant of
Penicillium sp T2-M10.
Appl. Microbiol. Biotechnol. 2018,
186, 990–998. doi:10.1007/s12010-018-2791-6.
[Google Scholar]
-
24.
Song SH, Ahluwalia N, Leduc Y, Delbaere LTJ, Vieille C.
Thermotoga maritima TM0298 is a highly thermostable mannitol dehydrogenase. Appl. Microbiol. Biotechnol. 2008,
81, 485–495. doi:10.1007/s00253-008-1633-9.
[Google Scholar]
-
25.
You C, Zhang X, Zhang Y-HPJ. Simple cloning via direct transformation of PCR product (DNA multimer) to
Escherichia coli and
Bacillus subtilis.
Appl. Environ. Microbiol. 2012,
78, 1593–1595. doi:10.1128/aem.07105-11.
[Google Scholar]
-
26.
Guterl JK, Garbe D, Carsten J, Steffler F, Sommer B, Reiße S, et al. Cell-free metabolic engineering: Production of chemicals by minimized reaction cascades.
ChemSusChem. 2012,
5, 2165–2172. doi:10.1002/cssc.201200365.
[Google Scholar]
-
27.
Lönn A, Gárdonyi M, van Zyl W, Hahn-Hägerdal B, Otero RC. Cold adaptation of xylose isomerase from
Thermus thermophilus through random PCR mutagenesis: Gene cloning and protein characterization.
Eur. J. Biochem. 2002,
269, 157–163. doi:10.1046/j.0014-2956.2002.02631.x.
[Google Scholar]
-
28.
You C, Shi T, Li Y, Han P, Zhou X, Zhang Y-HPJ. An in vitro synthetic biology platform for the industrial biomanufacturing of myo-inositol from starch.
Biotechnol. Bioeng. 2017,
114, 1855–1864. doi:10.1002/bit.26314.
[Google Scholar]
-
29.
Han P, Wang X, Li Y, Wu H, Shi T, Shi J. Synthesis of a healthy sweetener
d-tagatose from starch catalyzed by semiartificial cell factories.
J. Agric. Food. Chem. 2023,
71, 3813–3820. doi:10.1021/acs.jafc.2c08400.
[Google Scholar]
-
30.
Li Y, Shi T, Han P, You C. Thermodynamics-driven production of value-added
d-allulose from inexpensive starch by an in vitro enzymatic synthetic biosystem.
ACS. Catal. 2021,
11, 5088–5099. doi:10.1021/acscatal.0c05718.
[Google Scholar]
-
31.
Tian C, Yang J, Li Y, Zhang T, Li J, Ren C, et al. Artificially designed routes for the conversion of starch to value-added mannosyl compounds through coupling in vitro and in vivo metabolic engineering strategies.
Metab. Eng. 2020,
61, 215–224. doi:10.1016/j.ymben.2020.06.008.
[Google Scholar]
-
32.
Giardina P, de Biasi MG, de Rosa M, Gambacorta A, Buonocore V. Glucose dehydrogenase from the thermoacidophilic archaebacterium
Sulfolobus solfataricus.
Biochem. J. 1986,
239, 517–522. doi:10.1042/bj2390517.
[Google Scholar]
-
33.
Wang Y, Zhang Y-HPJ. Overexpression and simple purification of the
Thermotoga maritima 6-phosphogluconate dehydrogenase in
Escherichia coli and its application for NADPH regeneration.
Microb. Cell. Fact. 2009,
8, 30. doi:10.1186/1475-2859-8-30.
[Google Scholar]
-
34.
Ninh PH, Honda K, Sakai T, Okano K, Ohtake H. Assembly and multiple gene expression of thermophilic enzymes in
Escherichia coli for in vitro metabolic engineering.
Biotechnol. Bioeng. 2015,
112, 189–196. doi:10.1002/bit.25338.
[Google Scholar]
-
35.
Lin B, Tao Y. Whole-cell biocatalysts by design.
Microb. Cell. Fact. 2017,
16, 106. doi:10.1186/s12934-017-0724-7.
[Google Scholar]
-
36.
Kulbe KD, Schwab U, Howaldt M. Conjugated NAD (H)-dependent dehydrogenases for the continuous production of mannitol and gluconic acid from glucose-fructose mixtures in a membrane reactor.
Ann. N. Y. Acad. Sci. 1987,
501, 216–223. doi:10.1111/j.1749-6632.1987.tb45712.x.
[Google Scholar]
-
37.
Research GV. Sodium Gluconate Market Size, Share & Trends Analysis Report by End-Use (Construction, Food & Beverage, Textiles, Pharmaceutical), by Region, and Segment Forecasts, 2023–2030. Available online: https://www.grandviewresearch.com/industry-analysis/sodium-gluconate-market-report (accessed on 10 July 2023).
-
38.
Ma S, Li W, Zhang S, Ge D, Yu J, Shen X. Influence of sodium gluconate on the performance and hydration of Portland cement.
Constr. Build. Mater. 2015,
91, 138–144. doi:10.1016/j.conbuildmat.2015.05.068.
[Google Scholar]
-
39.
Liang K, Ricco R, Doherty CM, Styles MJ, Bell S, Kirby N, et al. Biomimetic mineralization of metal-organic frameworks as protective coatings for biomacromolecules.
Nat. Commun. 2015,
6, 7240. doi:10.1038/ncomms8240.
[Google Scholar]
-
40.
Lee H, Park J, Han SY, Han S, Youn W, Choi H, et al. Ascorbic acid-mediated reductive disassembly of Fe
3+-tannic acid shells in degradable single-cell nanoencapsulation.
Chem. Commun. 2020,
56, 13748–13751. doi:10.1039/d0cc05856d.
[Google Scholar]
-
41.
Zhang Y-HPJ, Zhu Z, You C, Zhang L, Liu K. In vitro BioTransformation (ivBT): Definitions, opportunities, and challenges.
Synth. Biol. Eng. 2023,
1, 1–37. doi:10.35534/sbe.2023.10013.
[Google Scholar]
-
42.
Schüürmann J, Quehl P, Festel G, Jose J. Bacterial whole-cell biocatalysts by surface display of enzymes: Toward industrial application.
Appl. Microbiol. Biotechnol. 2014,
98, 8031–8046. doi:10.1007/s00253-014-5897-y.
[Google Scholar]
-
43.
Shi T, Han P, You C, Zhang Y-HPJ. An in vitro synthetic biology platform for emerging industrial biomanufacturing: Bottom-up pathway design.
Synth. Syst. Biotechnol. 2018,
3, 186–195. doi:10.1016/j.synbio.2018.05.002.
[Google Scholar]
-
44.
Zhou W, Huang R, Zhu Z, Zhang Y-HPJ. Coevolution of both thermostability and activity of polyphosphate glucokinase from
Thermobifida fusca YX.
Appl. Environ. Microbiol. 2018,
84, 01224–01218. doi:10.1128/aem.01224-18.
[Google Scholar]
-
45.
Cheng K, Zheng W, Chen H, Zhang Y-HPJ. Upgrade of wood sugar
d-xylose to a value-added nutraceutical by
in vitro metabolic engineering.
Metab. Eng. 2019,
52, 1–8. doi:10.1016/j.ymben.2018.10.007.
[Google Scholar]
-
46.
Schumacher D, Kroh LW. The influence of Maillard reaction products on enzyme reactions.
Z. Ernahrungswiss. 1996,
35, 213–225.
[Google Scholar]
-
47.
Mikami Y, Murata M. Effects of sugar and buffer types, and pH on formation of maillard pigments in the lysine model system.
Food. Sci. Technol. Res. 2015,
21, 813–819. doi:10.3136/fstr.21.813.
[Google Scholar]
-
48.
Ajandouz EH, Desseaux V, Tazi S, Puigserver A. Effects of temperature and pH on the kinetics of caramelisation, protein cross-linking and Maillard reactions in aqueous model systems.
Food. Chem. 2008,
107, 1244–1252. doi:10.1016/j.foodchem.2007.09.062.
[Google Scholar]