1. Introduction
Among renewable energy sources, solar energy is the most promising due to its advantages, such as a huge total amount, easy development, and environmental friendliness [
1,
2,
3]. Offshore solar photovoltaics offer relatively high power generation efficiency [
4]. Additionally, offshore solar installations can be deployed on a large scale. Offshore Floating Photovoltaic (OFPV) structures have become a focus of renewable energy research. At present, the standard floating box type floating structures applied in inland water bodies cannot meet the load requirements of the marine environment [
5]. It is urgent to develop an OFPV suitable for the marine environment. Environmental factors such as wind, waves, and currents significantly influence the motion response of offshore floating structures. This paper provides a comprehensive review of OFPV systems, focusing on their hydrodynamic behavior and connection structure characteristics.
At present, the hydrodynamic studies of OFPV include two methods: numerical simulation and physical experiments. In terms of numerical simulation research, Cazzaniga et al. [
6] proposed a modular raft platform reinforced with steel cylinders. The steel pipes not only served as compression energy storage tanks but also as buoyancy structures to ensure the safety of OFPV. Magkouris et al. [
7] proposed a novel hydrodynamic analysis model for floating double-shell structures based on the Boundary element Method (BEM), which was designed to study wave responses and their influence on power generation performance, but the analysis was restricted to two spatial dimensions. Choi et al. [
8] used Computational fluid dynamics (CFD) software (ANSYS CFX 19.0) for numerical simulations to explore the motion conditions of frame-type floating photovoltaic bodies and photovoltaic modules under different wind and wave load conditions. By analyzing the stress distribution under different wind directions and wave conditions, the part with the maximum stress in the system was determined, providing an important basis for the design and improvement of the floating photovoltaic body. Furthermore, in the research on array-type floating photovoltaic structures. Xiao et al. [
9] conducted a systematic study on the overall wind, wave, and current loads of the floating photovoltaic power station array for the first time through SESAM (v3.6.3) software. The variation law of the wave load on the floating box array with the position of the rows and columns was revealed, and it was found that the wave load exhibited a linear relationship with the number of square array columns. Ikhennicheu et al. [
10] employed OrcaFlex (11.4a) software to construct a numerical model of a 3×3 array of floating bodies and proposed a modeling method for the motion constraint chain between the floating bodies. The feasibility of this method was verified in terms of the calculation results and calculation time. However, it is a simulation of specific environmental conditions and lacks the dynamics of float interactions. Liu et al. [
11] conducted a hydrodynamic performance analysis of a hybrid modular floating structure system using Advanced Quantitative Wave Analysis (AQWA 2020R2) . The results indicated that the outer modules serve effectively as floating breakwaters, thereby mitigating the motion response of the inner modules. Li et al. [
12] studied the influence of the number of hinge connections and incident wave conditions on the bending moment and vertical deflection of the structure, and obtained the hydroelastic response of the floating structure. Shi et al. [
13] also proposed a frequency-domain hydroelastic analysis method. This method extends the discrete-module-beam hydroelastic approach to a discrete-module-finite-element hydroelastic approach, addressing the limitation of the beam model. The non-uniform wind load and the combined effects of wind and waves were fully considered, and the motion response of the photovoltaic structure was calculated more accurately
In terms of physical experiment research, Dai et al. [
14] conducted experimental studies on Singapore’s first floating box modular floating photovoltaic structure, and the structural performance of both the floating modules and their connecting components was assessed. In addition, Kong et al. [
15] proposed a 2.5D calculation method, conducted numerical studies on the wind load and flow load of the floating array, and carried out scaled wind tunnel tests, thereby obtaining the distribution law of the flow load. Sree et al. [
16] calculated the stress and displacement of the floating photovoltaic floating box array structure by using COMSOL Multiphysics, and carried out the wave water tank test for verification. Lee et al. [
17] conducted a numerical analysis of the motion response of the floating semi-submersible photovoltaic structure through CFD numerical simulation (STARCCM+) and water tank tests. The research finds that the vertical and longitudinal swaying movements of floating bodies are the most dominant. Delacroix et al. [
18] performed the water- tank test on floating box array structures. It was observed that when the wavelength was approximately twice the length of the floating box, the load at the connection of the floating box increased, and the floating box array had a shielding effect on short waves. Ou et al. [
19] employed CFD software (STAR-CCM+ 19.04.007) to perform hydrodynamic simulations and water-tank experiments on FPV systems with barge float and double-boat float configurations under regular wave conditions. The study analyzed the motion response characteristics of the floating structures without considering the motion responses of the floating body structure under irregular waves, large wave heights, and other configurations. It provided the quantitative guidance for the selection of floating body configuration and the design of spacing.
The mechanical characteristics of the connection between the floating bodies in OFPV influence both motion response and structural safety. Scholars adopted various methods to analyze the influence of connection methods on the dynamic response of floating structures under different sea conditions. At present, the connection structure of offshore floating structures are mainly divided into two types: rigid connections and elastic connections. Rigid connections primarily include rigid support beams, steel tubular connectors, fixed connectors, and welded connections. Elastic connections generally consist of elastic ropes, flexible rubber joints, adjustable spring devices, and telescopic connectors. Rigid connections mainly ensure the stability of the structure through fixation and support, while elastic connections reduce the relative motion between floating bodies by absorbing the energy brought by waves and wind, thereby enhancing the adaptability and durability of the OFPV. When choosing a connection structure, the stability of the structure, its motion response, and safety should be comprehensively considered. In the research of rigid connections, Kim et al. [
20] introduced rotational constraints to design the connection structure of the floating body and explored the influence of the rotational stiffness of the connection structure on the dynamic response of the floating body. Gao et al. [
21] adopted the modal expansion method to solve the fluid-structure coupling problem, and combined the boundary element method and the finite element method to study the effects of connection position and stiffness on the dynamic behavior of floating bodies, but the situation of multiple connections was not considered. The research found that hinges and semi-rigid connections reduced the water elastic response and stress of the floating body. Otto et al. [
22] found via simulation that horizontal loads on the connectors increase as the floater draft becomes deeper. Moreover, Zhang et al. [
23] used AQWA to calculate the influence of different sea conditions on the loads of the connection of the four-module offshore floating structure, which indicated that the longitudinal load amplitude was relatively large. In the research of elastic connections in OFPV, Kim et al. [
24] designed a fiber-reinforced polymer connection structure and explored its failure modes. For large-scale floating structures, Shi et al. [
25] studied the influence of the stiffness of the hinged parts of the flexible base on the load of the connection and the response of the floating body, and calculated the optimal stiffness value. Wu et al. [
26] reduced the hydrodynamic response caused by extreme sea conditions by adjusting the stiffness of the flexible connection appropriately. Lu et al. [
27] proposed a super-large modular floating platform system in which different components adopt different connection methods to suppress the oscillation of the floating platform. They also introduced an optimization method for the connection stiffness configuration that considers both the connector load and the response amplitude simultaneously. Xia et al. [
28] also proposed an adjustable stiffness connector to achieve vibration control of multi-module floating bodies, thereby reducing the motion response of the floating body and the load of the connections. Importantly, this control method can eliminate the resonant response by changing the system stiffness. Claus et al. [
29] used AQWA to calculate the hydrodynamic responses of rigid connection and hinged high-density polyethylene (HDPE) OFPV under different environmental loads such as wind, waves, and currents. They found that the hinged connection could reduce the yaw motion, but the pitch motion increased. Jiang et al. [
30] designed an OFPV with elastic connections. It was found that the response differences among each module of the floating photovoltaic structure were small through OrcaFlex simulation. Building on the study [
30], Saitov et al. [
31] further carried out physical experiments on scale reduction. Through detailed comparison with the numerical results, they found that rope stiffness had minimal influence on the modal frequencies of the FPV array. An increase in rope stiffness caused the tension of the rope to increase during peak and off-peak periods. It revealed the influence of rope stiffness on dynamic response, providing a new perspective for the design of FPV systems. Zheng et al. [
32] evaluated the motion characteristics and power generation capacity of OFPV arrays based on potential flow theory. They innovatively studied the influence of the relationship between wavelength and structural length on the motion response and connectors, and effectively suppressed the floating body motion by optimizing the hinge system. The actual marine environment has not been fully considered, such as the impact of ocean currents and other factors. Wang et al. [
33] proposed a new type of tensioned floating island photovoltaic system. They adopted AQWA to comprehensively consider the influence of waves and connector parameters on the dynamic response of the system, and studied the tension distribution and cooperative response mechanism of the connection between floating bodies and the mooring system. The length of the flexible connector influenced the tension in the connector. Ding et al. [
34] analyzed the influence of three different configurations of flexible spring connectors on the load of the connectors and the motion response of the floating body through the water tank test. Ji et al. [
35] designed three types of connections for a multi-module semi-submersible OFPV. They used AQWA to analyze three key metrics: motion response, mooring line tension, and inter-panel spacing. Based on these results, the optimal connector parameters were identified. The above research focuses on the design and performance optimization of connectors for floating structures at sea, laying the foundation for the application of this technology.
The technology of OFPV remains in an early exploratory stage. The motion responses of OFPV with different structural types and connection structures vary under marine conditions. Firstly, based on the traditional HDPE floating blocks PV structure, we propose a novel OFPV with elastic connection and the modularity HDPE float blocks. Then, based on the Navier–Stokes (N-S) equation, the numerical water tank is constructed by using the turbulence model in FLOW-3D. Next, the dynamic responses of the floating structures with rigid and elastic connections were simulated and calculated by using the Generalized Mode-Order (GMO). The analysis examined the displacement, velocity, and mooring force variations of the structures under different wave conditions for OFPV with different types of connection. Finally, a comparative analysis of the motion responses of the OFPV with two types of connectors is conducted. The content arrangement of the paper is as follows: Section 2 describes the geometric configuration and theoretical modeling of the OFPV. Section 3 presents simulation validation and analyzes the dynamic behavior of OFPV with different connection types. Section 4 summarizes the conclusions.
2. Theoretical and Model Setup
2.1. Geometric and Structural Parameters
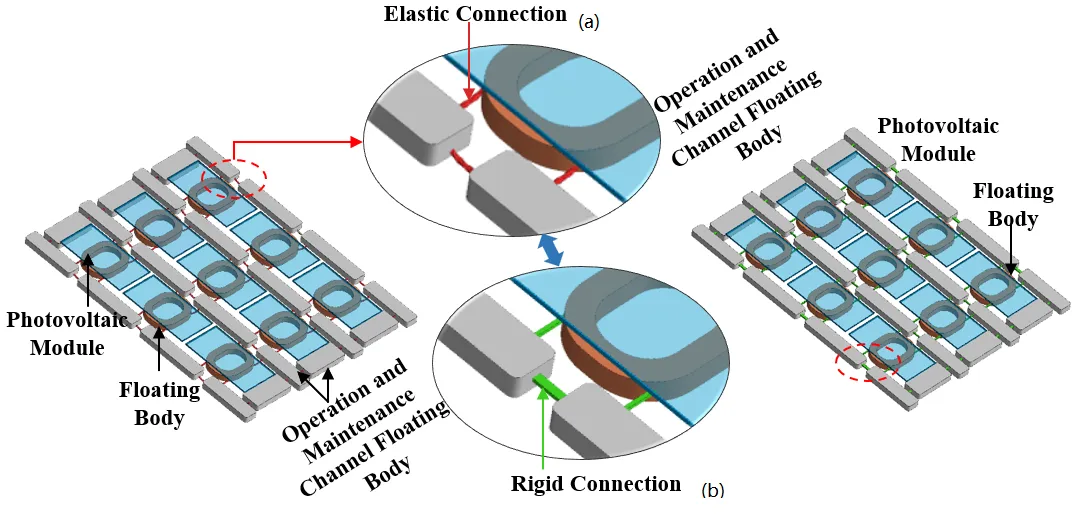
The novel OFPV with the elastic connection and the HDPE float blocks is proposed in a. It is composed of the floating body of the operation and maintenance channel, load-bearing floaters for PV modules, and the elastic connection structure of the floating body. b is the OFPV with a rigid connection structure for comparison, with the floating blocks connected by steel structures. The overall structure is 8 m long and 6 m wide, and it supports 9 photovoltaic panels.
. OFPV with elastic and rigid connections. (<b>a</b>) Elastic connection, (<b>b</b>) rigid connection.
There are two sizes of operation and maintenance channel floating blocks in the OFPV. Both are hexahedral floating bodies with rounded corners and a thickness of 0.4 m. Among them, one is 1.7 m in length and 0.4 m in width, and the other is 1.3 m in length and 0.6 m in width. The floating body, which supports the photovoltaic modules, is ring-shaped. Its external contour is a rectangle with dimensions of 1.3 m in length and 1.05 m in width. At each of the four corners of the rectangle, the cutting radius is 0.45 m. The floater cross-section is a square with a side length of 0.2 m. In this paper, the internal steel frame structure of the OFPV is replaced by an elastic cable, which is located at the four corners of the internal floating block. The stiffness and strength requirements of the elastic cable ensure that the elastic deformation state is maintained under the design load without damage. The two types of OFPV in a,b only differ in the connection method of the HDPE float blocks, while the rest of the structures are the same.
The new floating body structure proposed in this study uses HDPE as the main material of the floating body and adopts a catenary mooring system. The relevant parameters of the structure are detailed in .
.
Key design parameters of the OFPV structure.
|
Parameter |
Numerical Value |
| HDPE |
Material Density (kg/m3) |
945 |
| Elastic Modulus (Pa) |
8.4 × 10⁸ |
| Poisson’s Ratio |
0.38 |
| Yield Strength (MPa) |
15 |
| Catenary Mooring System |
Unstretched Length (m) |
30 |
| Axial Stiffness per Unit Length |
1.41 × 10⁷ |
| Diameter (m) |
0.014 |
| Normal Drag Coefficient |
1 |
| Tangential Drag Coefficient |
0.5 |
| Linear Mass Density (kg/m) |
2 |
| Net Material Density (kg/m3) |
6825 |
| Tensile Strength (kg/mm2) |
163 |
| Resilient Connector |
Unstretched Length (m) |
0.21 |
| Compressed Length (m) |
0.021 |
| Elastic Stiffness (kg/s2) |
6000 |
| Damping Coefficient (N·s/m) |
170.6 |
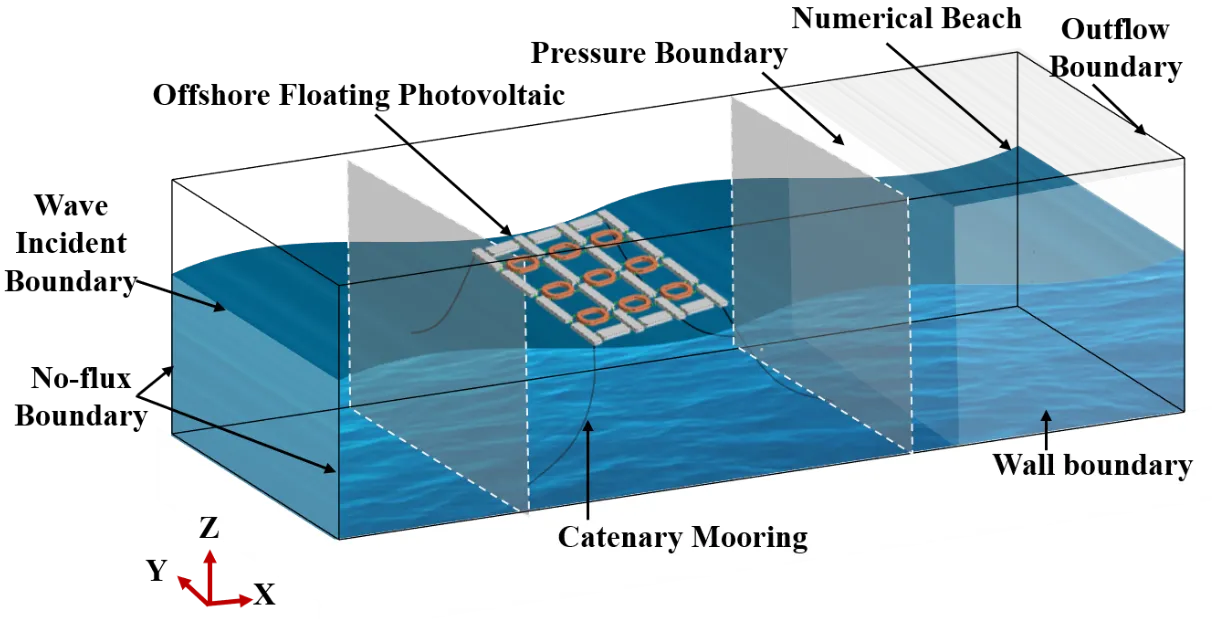
A numerical pool model was constructed based on the aforementioned parameters. The dimensions of the pool are 28 m in length, 10 m in width, and 9 m in height. The boundary conditions are set as
. The wave entrance X
Min adopts the wave incident boundary. The incident wave is simulated based on the fifth-order stokes wave, and the parameters of average water depth, wave height, and wave period are input. The wave exit X
Max is defined as the free Outflow boundary. The length of the numerical beach should be set to at least two wavelengths to prevent the occurrence of reflected waves. The numerical beach technology is adopted for wave dissipation. Given the extended length of the numerical wave tank, the bottom boundary Z
Min is defined as a symmetry boundary. This setting reduces wave height attenuation caused by bottom friction. The top boundary Z
Max is set as the specified pressure boundary, and the pressure value of the free water surface is 0. Both the Y
Min and Y
Max of the front and rear walls adopt Symmetry boundaries. It is assumed that fluid is present on both sides of the symmetry boundaries during the simulation process.
. Numerical simulation of the OFPV.
The wave characteristics of the central Bohai Sea are summarized in [
36] as follows: Moderate waves, with heights ranging from 1.25 to 2.5 m, have an annual probability of occurrence of 7.1%. Waves with a period of 4 to 5 s have a 16.5% probability of occurrence, while for waves with a period between 5 and 6 s, the occurrence probability is 7%. Although, the combined working condition of the above-mentioned wave height and wave period is a low-occurrence event. Its occurrence probability is relatively high within the category of extreme wave working conditions. Therefore, wave conditions with similar parameters are selected for numerical simulation in this study.
An orthogonal experimental design approach is employed to investigate the hydrodynamic behavior of OFPV with different types of connections under varying wave conditions. Wave height parameters range from 1 m to 2 m in 0.2-meter increments, and wave periods are 4 s, 5 s, and 6 s. The analysis focuses on the motion responses and mooring force characteristics of the floating structures. Comparative analysis is conducted between the OFPV with elastic and rigid connection structures under different wave conditions. The orthogonal design experiment () includes a total of 36 working conditions, with each working condition lasting for 60 s. Detailed working conditions refer to .
.
Orthogonal Test Condition Matrix.
| Structural Configuration |
Wave Height |
1.0 m |
1.2 m |
1.4 m |
1.6 m |
1.8m |
2.0 m |
| OFPV with Rigid Connection |
Wave Period |
4 s |
| 5 s |
| 6 s |
| OFPV with elastic Connection |
Wave Period |
4 s |
| 5 s |
| 6 s |
| Total Number of Test Conditions |
|
36 |
2.3. Theoretical Basis for Numerical Modeling
CFD simulation has the advantages of short computation time and saves research costs. Moreover, it allows for iterative model design, analysis, and optimization. The Multi-Block Grid technology is adopted to encrypt the local grids of the computing area. Based on the complete discrete N-S equation, the Volume of Fluid (VOF) method has advantages when dealing with problems such as multi-valued free surfaces, rollover, and wave fragmentation. It is characterized by high computational efficiency and minimal memory requirements. This study employs FLOW-3D to perform numerical simulations of the coupled interaction between the floater and wave dynamics. The governing Navier–Stokes equations are:
where [
37]
VF is the fractional volume of open flow;
ρ is the fluid density; P is the pressure of the fluid; the area fractions are
Ax,
Ay and
Az;
v is the velocity vector, with
u,
v and
w are its components in the X, Y and Z directions.
G is the gravitational acceleration vector, with directional components
Gx, Gy, Gz in the X, Y, and Z directions.
f is the viscous acceleration vector, with components
fx, fy, fz in the respective directions.
The VOF method consists of three primary components: the fluid volume fraction
F, mechanisms to maintain the interface clear during advection, and boundary conditions of the free surface. The
F represents the ratio of fluid volume to the total volume of a computational cell at a specific time and location. When a computing unit is completely filled by the fluid, the value is 1; If there is no fluid in the unit, the
F value is 0. When
F takes a value between 0 and 1, it indicates the presence of a free surface within the cell, and at least one of its neighboring cells must have a value of
F = 0. The fluid volume fraction
F satisfies the following transport equation:
The governing equation describing the complex evolution of the free surface in the VOF method is:
In the study of the kinematics and dynamics of floating bodies in this paper, floating bodies are treated as rigid bodies. Standard analysis indicates that the motion equations of any rigid body can be decomposed into the motion equation of the center of mass and the independent dynamic equation of rotation around the center of mass is:
where $$V_{C M}^{'}$$ denotes the velocity of the rigid body’s center of mass relative to the inertial reference frame;
M is the total mass of the rigid body; $$F_{e}^{'}$$, $$F_{c}^{'}$$ and, $$F_{f}^{'}$$ represent the environmental, control, and hydrodynamic forces applied in the model, respectively; $$F_{g}^{'}$$ is the force produced by the action of gravity.
Since the research object of this paper is a multi-floating structure and mainly analyzes the hydrodynamic response characteristics of the floating structure. Therefore, the GMO model, which supports the independent control of multiple moving objects, is adopted for numerical simulation. When the floating body experiences six degrees of freedom (6-DOF) motion, the origin of the floating coordinate system is defined at the position of the object’s center of mass. This coordinate system is fixed on the moving object and performs translational and rotational motion synchronously. The coordinate transformation relationship between the spatial coordinate system and the floating coordinate system is as follows:
where:
In the formula,
xs and
xb are respectively the position vectors of a certain point in the spatial and random coordinate systems;
xG is the position vector of the object’s center of mass in the global coordinate system;
R is the orthogonal transformation (rotation) matrix;
RijRjk = Ꟙik,
Ꟙik denotes the Kronecker delta symbol. The matrix
R is equal to both its inverse and its transpose. For a spatial vector
A, the transformation between the global coordinate system and the body-fixed coordinate system is expressed as follows:
where
As and
Ab respectively represent the vector of
A in the spatial coordinate system and the floating coordinate system, respectively.
The mathematical formulation for computing
R is:
where:
where Ω
x, Ω
y, and Ω
z denote the angular velocity components of the object along the x-, y-, and z-axes in the spatial coordinate system, respectively.
In kinematics, the motion of a rigid body can generally be divided into translational motion and rotational motion. The speed of any point on a rigid body is equal to the speed of any selected base point on the object plus the rotational speed around that base point. For objects with six degrees of freedom, the center of mass is commonly adopted as the reference point for motion analysis. The velocity of any point
P on the rigid body can be expressed in terms of the center of mass velocity
VG and the angular velocity
ω as follows:
where [
37]
rP/G represents the displacement vector from the center of mass
G to point
P;
VG indicates the translational motion of the center of mass; $$\omega$$ denotes the rotational of the center of mass. Ω is an attribute of a moving object and has nothing to do with the choice of the base point. The equations of motion controlling two independent motions are:
and
where [
37]
F denotes the total external force acting on the rigid body;
m is the mass of the rigid body;
TG represents the total torque with respect to point
G, [
J] is the inertia tensor in the rigid body coordinate system.
where [
37] the elements
J11,
J22, and
J33 are the moments of inertia, while the other elements are the products of the moments of inertia.
3. Results
Numerical simulations of novel OFPV with elastic and rigid connections were conducted using FLOW-3D (v11.2) software. The influence of wave parameters on the pressure and elastic connection force of the floating structure of the supporting component was analyzed. Then, the floating body displacement and mooring force of the OFPV with two different connection methods were compared.
3.1. Verification
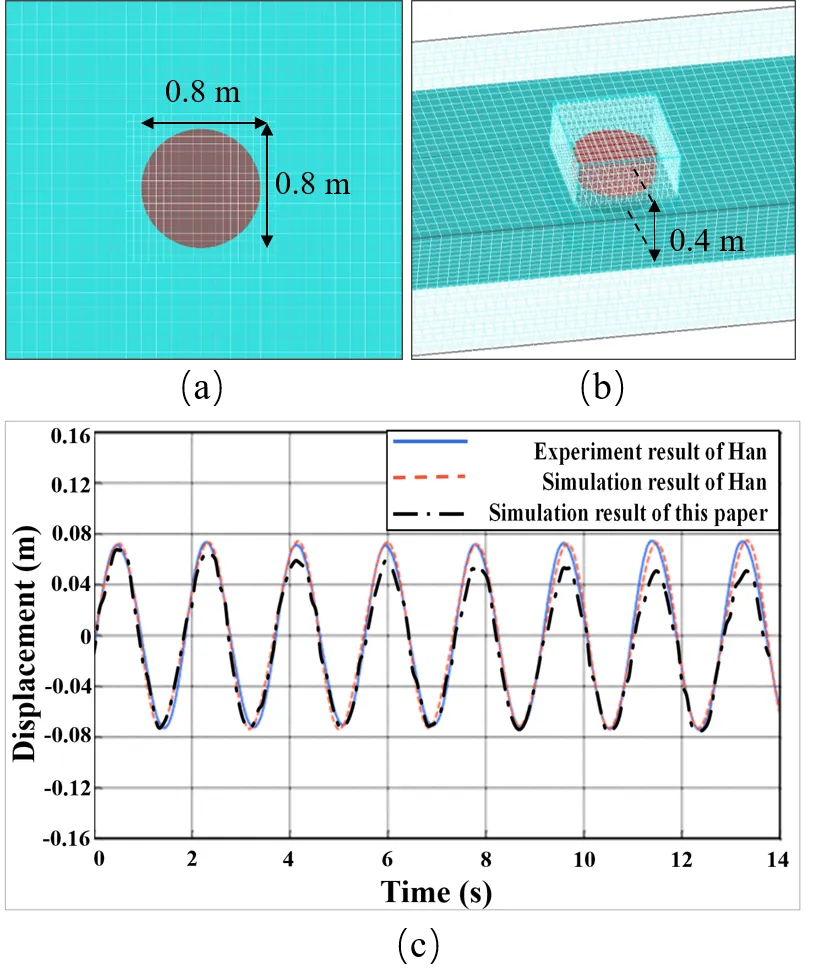
To verify the reliability and accuracy of the calculation results of the numerical method, numerical simulations were carried out using the floater model proposed by Han et al. [
38], and the simulation outcomes were compared with both experimental and numerical results by Han et al. [
38]. The verification numerical model is shown in
, the numerical wave tank is 3 m wide, 1.4 m high, and 60 m long, with a water depth of 0.8 m. The floater model is in a cylindrical structure, with a height of 0.4 m and a diameter of 0.8 m. Place the float model at a position more than three times the wavelength from the wave boundary and more than six times the wavelength from the outflow boundary to reduce the boundary interference received by the model. The wave height of the incident wave is set at 0.154 m, and the period is 1.83 s.
. Model configuration and comparison of heave amplitude response. (<b>a</b>) Top view of the computational mesh of the numerical wave tank and the floater structure; (<b>b</b>) Side view of the mesh of the numerical wave tank and the floater structure; (<b>c</b>) Comparative of floater heave displacement responses.
Regarding the boundary condition settings, the pressure limit at the top boundary of the numerical wave tank is set to standard atmospheric pressure; the bottom is defined as the boundary of the no-slip wall, and this setting conforms to the basic law of fluid motion near the wall surface in fluid mechanics. Both sides are set as symmetrical boundaries, and zero-gradient and zero-velocity conditions are applied at this boundary to simulate the real symmetrical flow environment. In addition, the absorbing layer with a length of 20 m was set before the outlet boundary. By applying an artificial linear damping force, this absorbing layer can dissipate the energy of wave motion.
The comparison of the displacement data of the cylindrical float is shown in c, which is consistent with the experimental and numerical simulation results of Han et al. [
38]. The displacement results of the first four periods of motion were highly consistent. After that, the maximum value of the Z-direction displacement was slightly smaller than the experimental data, showing a slight deviation within a reasonable range. This deviation can be attributed to two main factors: (1) The wave height of the numerical wave slightly decreased during its forward movement under the action of the viscous force of the liquid. (2) Although the absorbing layer has a good effect, it cannot completely eliminate the reflected waves, and it reduces the displacement. Overall, the numerical results exhibit good agreement with both the experimental data and the numerical results of previous studies, thereby confirming the feasibility of applying the present numerical approach to investigate the hydrodynamic behavior of OFPV.
3.2. Effect of Wave Parameters on Pressure and Connection Forces in the OFPV
Firstly, Section 3.2 fixes the wave period and wave height parameters and calculates the dynamic response of the OFPV with elastic connection under different wave parameters. Then, the changes in pressure, displacement, and mooring force of the photovoltaic support structure of the OFPV with an elastic connection were explored under different wave conditions. Finally, the differences in motion responses of the floating body with two types of connections were analyzed from the perspectives of displacement, velocity, and mooring force.
3.2.1. Effect of Wave Parameters on Pressure
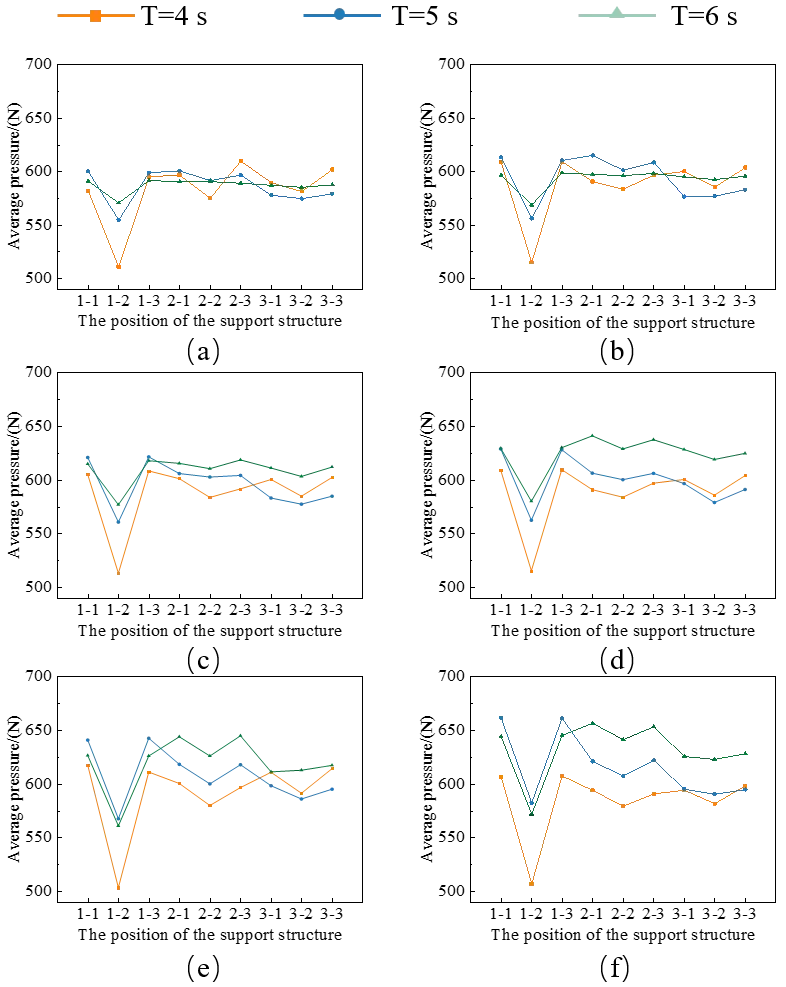
For marine structures, the average pressure can estimate the overall effects of wave loads or hydrostatic pressure, providing a basis for designing structural strength. shows the variation in average pressure on the photovoltaic support structure under different wave parameters.
Firstly, the average pressure of the photovoltaic support structure is positively correlated with the wave height; with an increase in wave height, the average pressure value of the photovoltaic support structure gradually increases. Among them, the average pressure on the floating body in the second column of the first row was always the smallest, with the minimum value being 503 N, which occurred under the working conditions of a wave height of 2 m and a period of 4 s. Secondly, the wave period had a notable impact on the magnitude of the mean pressure. Except for the working condition with a wave height of 1 m, the greater larger wave periods led to an increase of average pressure on supporting structures in rows 2 and 3. At a wave height of 2 m and a wave period of 6 s, the mean pressure reached its peak value of 661.4 N, which occurred at the location of row 1, column 3. Within the wave height range of 1 to 1.4 m, the average pressure difference between row 2 and row 3 was relatively small. In the wave height range of 1.6–2.0 m, the gap between the two widen significantly, and the average pressure on the second row of support structures was always less than that on both sides of the support structures.
. Average pressure distribution on the supporting structure of OFPV under varying wave conditions. (<b>a</b>) Wave height of 1 m; (<b>b</b>) Wave height of 1.2 m; (<b>c</b>) Wave height of 1.4 m; (<b>d</b>) Wave height of 1.6 m; (<b>e</b>) Wave height of 1.8 m; (<b>f</b>) Wave height of 2 m.
3.2.2. Effect of Wave Parameters on Connection Forces
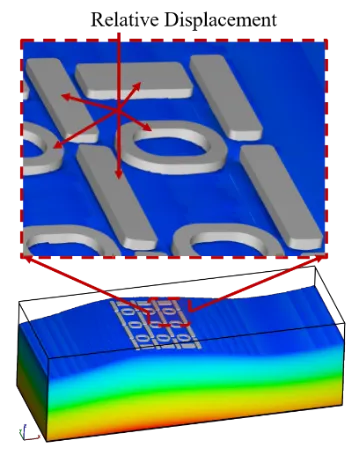
Under the action of wave loads, the multi-floating body system with elastic connections had obvious relative displacements among the floating bodies (). As the relative displacement increased beyond a certain threshold, the tension in the elastic connectors increased correspondingly, and these locations were subjected to sustained cyclic loading over time, which led to fatigue-induced damage in the elastic cables. Therefore, it was necessary to conduct a systematic analysis of the elastic cable tension between the floating bodies of the OFPV.
. Three-dimensional view of the floater structure of the OFPV at the instant of wave crest.
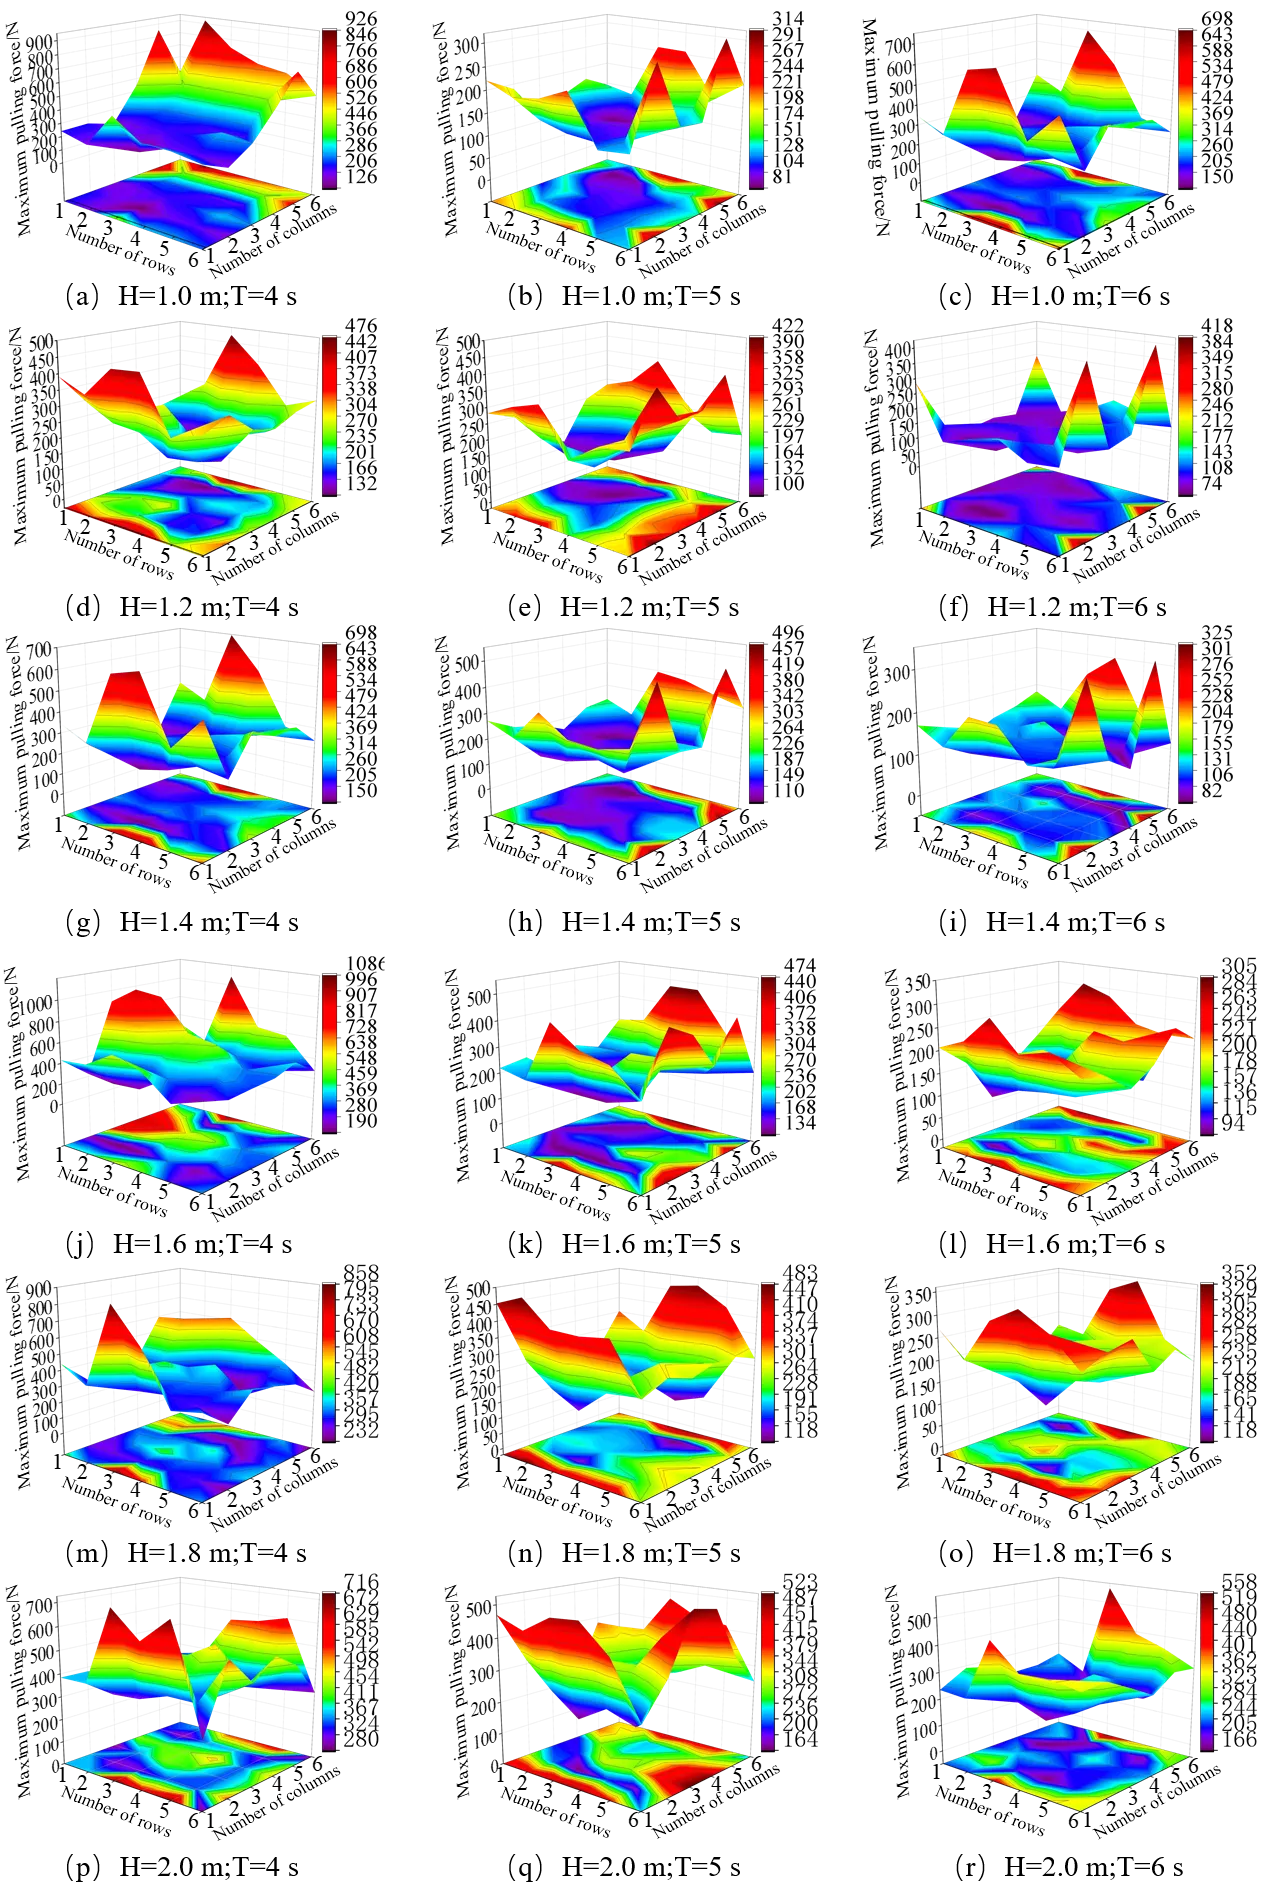
shows the distribution cloud diagrams and their projections of the maximum tensile force of the elastic connection of 9 photovoltaic support structures under different wave parameters. The maximum tensile force of the elastic cable on the outermost side of the OFPV was relatively high. Among them, the maximum value reached 1085 N, which occurred at the sixth column of the elastic cable in the third row under the working condition of wave height 1.6 m and period 4 s. Regardless of the wave height, the maximum tensile force in the elastic cables decreased with increasing wave period. For instance, under a wave height of 1.6 m, the maximum tensile force reached 1085 N at a wave period of 4 s, decreased to 473 N at 5 s, and further dropped to 304 N at 6 s. At a wave period of 4 s, the maximum tensile force of the elastic cables is concentrated in the central connectors of rows 1 and 6. When the wave period increases to 5 or 6 s, the peak values remain in columns 1 and 6, but also emerge in the central region of the last row (row 6) facing the incoming waves. The blue and purple regions indicated that the maximum tensile force of the elastic cable was relatively low, and these regions were distributed in the center of the structure. It was indicated that the wave force acting on the elastic cable of the middle floating body was small, and its mechanical structure enabled the tensile force of the elastic cable to be better dispersed. Under the working conditions of a wave height of 2 m and a period of 4 s, the minimum tensile force of the elastic cable in the middle area was 280 N, which was notably higher than the corresponding minimum values observed under other wave conditions. The tensile force of the elastic cable in the middle area under this wave condition needed to be further analyzed.
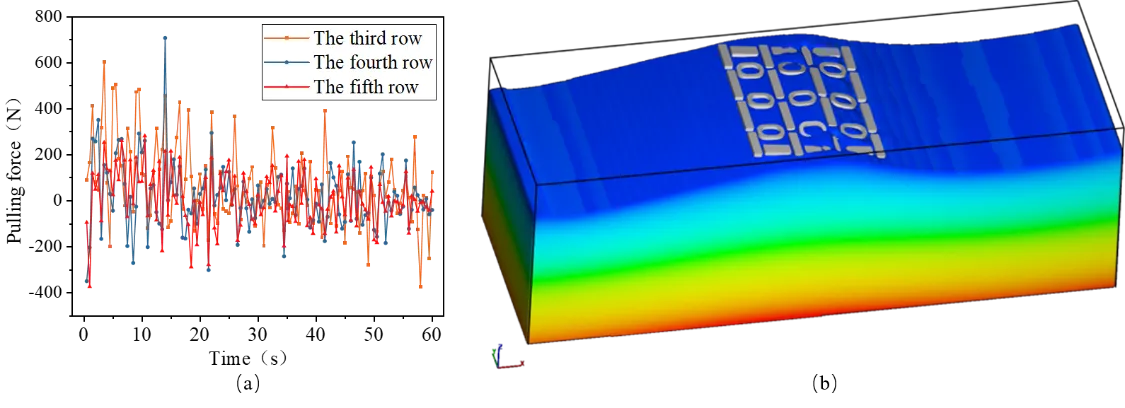
The extreme working condition with a wave height of 2 m and a wave period of 4 s was selected. The elastic cables in rows 3, 4, and 5 of the first column were analyzed to explore the time-domain response characteristics of the tensile force of the elastic cables under extreme wave conditions, and to analyze the reasons for the maximum values at these points. A shorter wave period indicates a higher frequency of wave motion, which caused multiple successive impacts on the OFPV supporting structure over a short period of time.
. Contour plots of peak tensile forces in elastic cables under various wave conditions. (<strong>a</strong>) H = 1.0 m, T = 4 s; (<strong>b</strong>) H = 1.0 m, T = 5 s; (<strong>c</strong>) H = 1.0 m, T = 6 s; (<strong>d</strong>) H = 1.2 m, T = 4 s; (<strong>e</strong>) H = 1.2 m, T = 5 s; (<strong>f</strong>) H = 1.2 m, T = 6 s; (<strong>g</strong>) H = 1.4 m, T = 4 s; (<strong>h</strong>) H = 1.4 m, T = 5 s; (<strong>i</strong>) H = 1.4 m, T = 6 s; (<strong>j</strong>) H = 1.6 m, T = 4 s; (<strong>k</strong>) H = 1.6 m, T = 5 s; (<strong>l</strong>) H = 1.6 m, T = 6 s; (<strong>m</strong>) H = 1.8 m, T = 4 s; (<strong>n</strong>) H = 1.8 m, T = 5 s; (<strong>o</strong>) H = 1.8 m, T = 6 s; (<strong>p</strong>) H = 2.0 m, T = 4 s; (<strong>q</strong>) H = 2.0 m, T = 5 s; (<strong>r</strong>) H = 2.0 m, T = 6 s.
In , each floating body of the OFPV continuously adjusted its force states under the action of high-frequency external forces, causing the connection force of the elastic cable to change frequently and thus resulting in oscillation. The time-domain graph revealed that the tensile force of the elastic cables fluctuates periodically with the wave, and the fluctuation range of the tensile force values of the elastic cable at different positions varied greatly. The tensile force of the elastic cable in the fourth row of the first column reached the maximum value at about 14 s, and the maximum value was 707 N. When the floating body was at the crest position, it was lifted by the upward force of the wave. During this process, changes in floater positions caused relative displacements among the elastic connections of the OFPV support structure. As a result of this relative displacement between adjacent floaters, the elastic cables linking the structural components undergo increased tension, and the tensile force in the elastic cables reaches its peak at that time. This tensile force distribution had a critical effect on the stability and durability of the OFPV supporting system. The tensile force of the weak parts of the structure was greater. Long-term exposure to high tensile force may lead to problems such as fatigue and damage to the elastic cable. These critical locations should receive particular attention during both the structural design and maintenance phases, with targeted reinforcement measures implemented to enhance their strength and reliability.
. Time-domain variation of elastic cable tension and the numerical model. (<b>a</b>) Time-domain variation of elastic cable tension at the central location; (<b>b</b>) Transient numerical model snapshot at the moment of peak tensile force.
Section 3.3 focused on a comparative analysis of the effect caused by different types of connections. Firstly, the influence of different forms of connection parts was compared on the floating body velocity. Then, the influence on the floating body displacement and mooring force was analyzed, and the influence of different connection forms on different response values was summarized.
3.3.1. Comparative Analysis of Floater Velocity
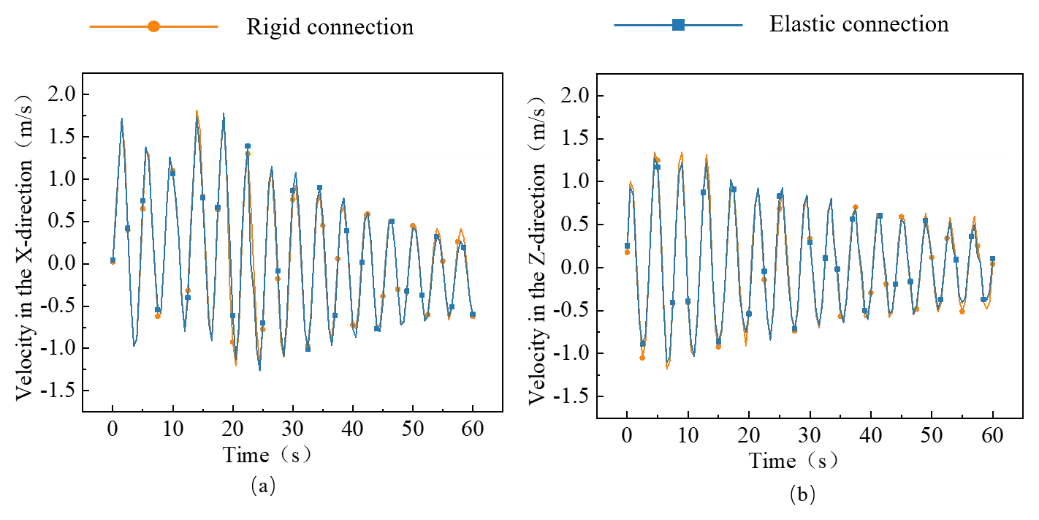
presents a comparison of floater velocity between the two connection types under a wave height of 1.8 m and a wave period of 4 s. a illustrates the velocity in the X-direction, while b presents the velocity in the Z-direction. Both the x-direction and Z-direction velocities of the two structures show periodic changes with the waves. At the beginning, the speed of the floating body movement is slightly larger. The mooring cable gradually tenses with the action of the wave, and the speeds in the X and Z directions gradually decrease. The period of speed change was consistent with the wave. The maximum X-direction velocity of both was 1.75 m/s, and then stabilized at about 0.5 m/s; The maximum Z-direction velocity was 1.3 m/s, and the rear floating body was stable at about 0.5 m/s. Overall, there was no significant difference in the velocity response of the lower floating body under the two different connection forms.
. Velocity comparison under a wave height of 1.8 m. (<b>a</b>) X component of velocity; (<b>b</b>) Z component of velocity.
3.3.2. Comparative Analysis of Floater Displacement
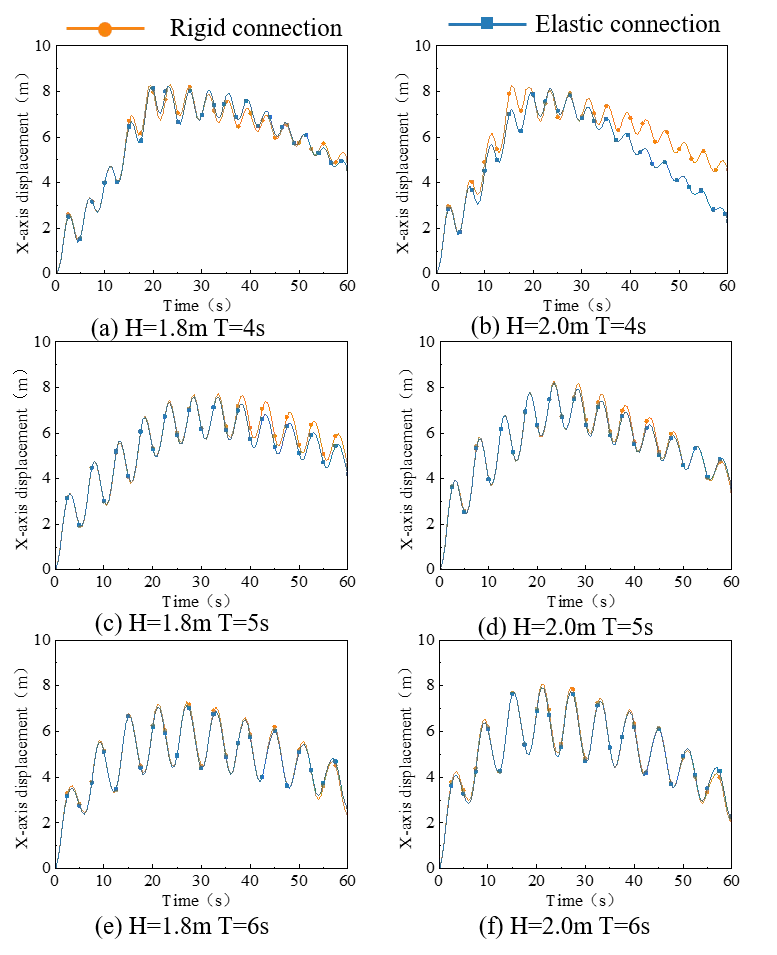
compares the X-direction displacement characteristics of OFPV with elastic and rigid connections under various wave conditions. The X-direction displacements of the floating structures with two different forms of connectors are different. Under the same wave height with shorter wave periods, the structure with elastic connections exhibited smaller X-direction displacement than that with rigid connections. However, as the wave period increased, the X-direction displacements of the two gradually tended to be consistent. For example, under wave conditions of 2 m in height and 4 s in period, the elastic connection structure exhibited a maximum X-direction displacement of 8.15 m and an average value of 5.13 m, whereas the rigid connection structure reached a maximum of 8.25 m and an average displacement of 5.81 m. When the wave period increased to 6 s, the maximum X-direction displacement and the average value of the elastic connection structure were 7.92 m and 5.03 m. The rigid connection structure reached a maximum X-direction displacement of 8.07 m and an average value of 5.09 m, indicating that the displacement differences between the two structures diminished with increasing wave period.
There was a phenomenon where the wave period was increased with the increase in wavelength, and the wave resistance effect of the elastic connection declined. The matching degree between the low-frequency energy carried by long-period waves and the dynamic response characteristics of the elastic connection structure decreased. Elastic connections had a more effective energy absorption and buffering effect on high-frequency waves. However, when facing long-period waves, the deformation adjustment ability of elastic connections was difficult to fully adapt to the low-frequency variation of wave loads, resulting in a decrease in the wave dissipation effect. In the working condition with a shorter wave period, the elastic connection structure improved the wave-following performance of the floating body relying on the elastic deformation mechanism.
. Comparison of X-direction displacement under different connection configurations.
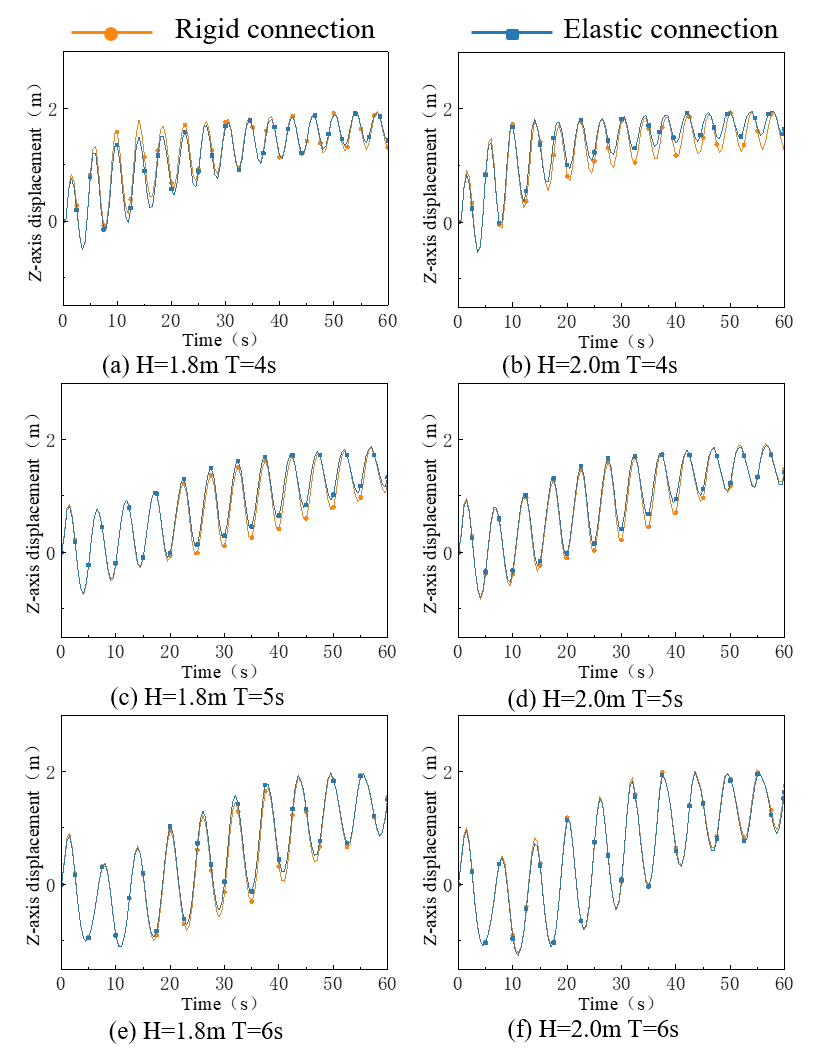
presents a comparative analysis of the Z-direction displacement of floating structures with elastic and rigid connections. Under wave conditions with a height of 2 m and a period of 4 s, the maximum Z-direction displacement and the average value of the floating body structure with elastic connections were 1.89 m and 0.94 m. The maximum Z-direction displacement and the average value of the rigidly connected floating structure were 1.93 m and 0.88 m. The Z-direction displacement of the elastic connection structure was slightly greater than that of the rigid connection floating structure. Both structures showed periodic fluctuations around the zero point, and obviously shifted towards the positive direction. The Z-direction motion displacement increased with the increase of the wave height. With the increase of the wave period, the number of wave actions per unit time decreased, and the Z-direction displacement wave frequencies of the two structures decreased.
. Comparison of Z-direction displacement under different connection configurations.
Under wave trough conditions, the displacement of the floating structure with elastic connections was smaller than that of the structure with rigid connections, which also indicated that the motion amplitude of the OFPV with elastic connections was smaller than that of the OFPV with rigid connections. Because the elastic connection structure absorbed the wave force. This trend is strongly influenced by the wave period, with a difference in motion amplitude observed under short-period wave conditions. The difference in the motion amplitudes of the two gradually decreased with the increase of the wave period, which also indicated that the OFPV with elastic connection had more obvious advantages over the OFPV with rigid connection under the condition of a short wave period.
3.3.3. Comparative Analysis of Mooring Forces
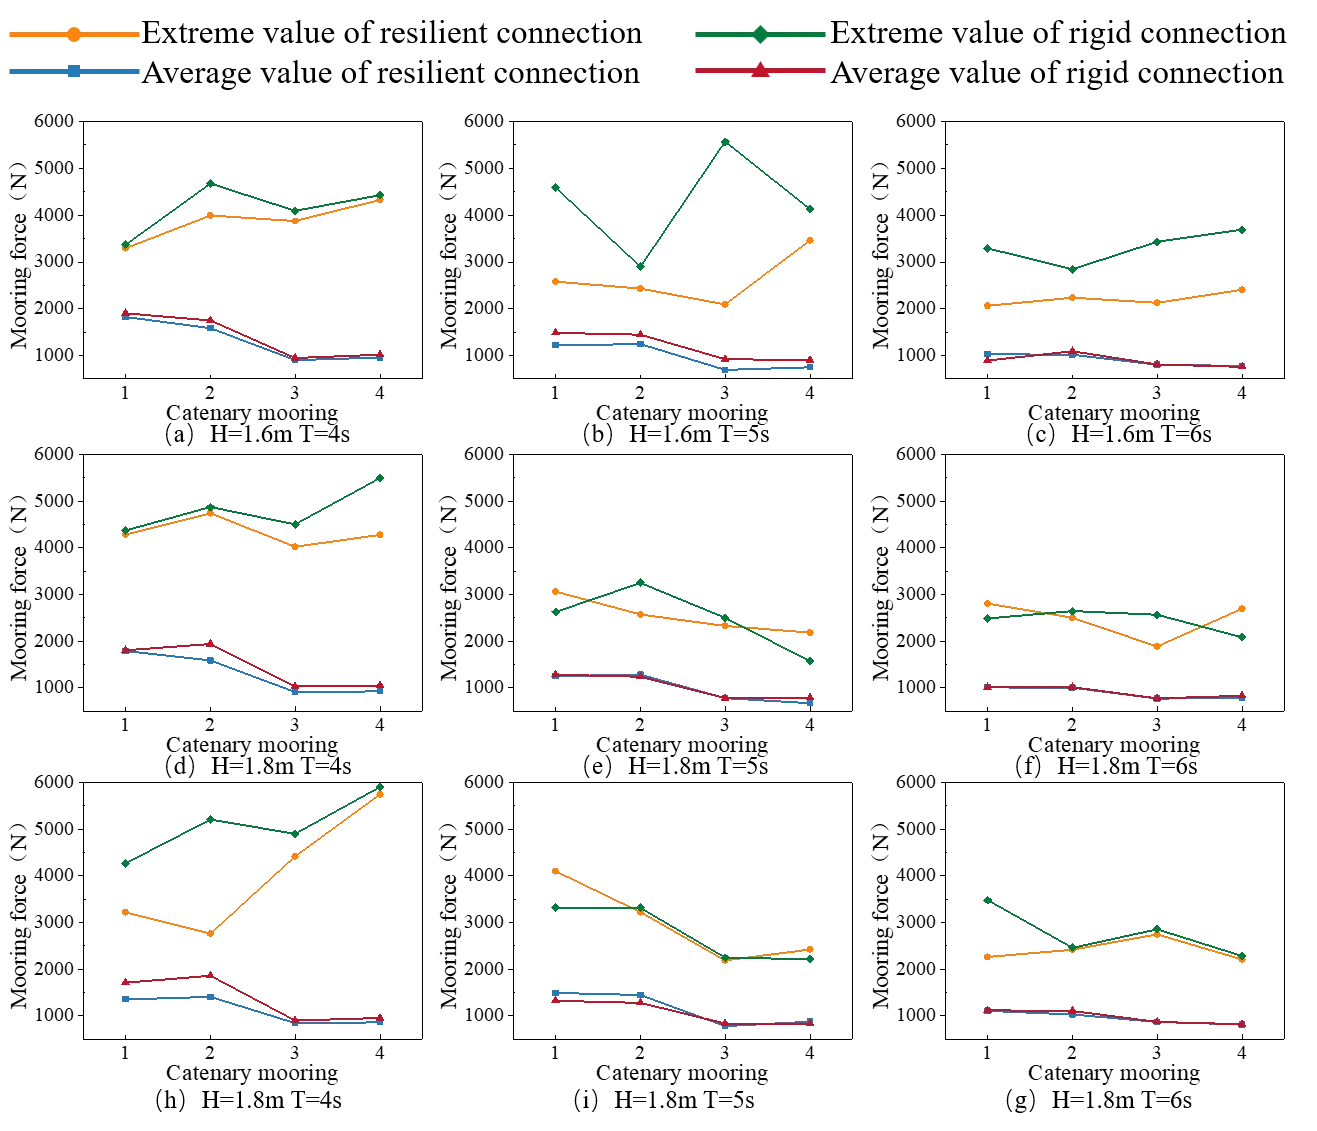
Given the substantial volume of simulation data, representative working conditions with wave heights of 1.6, 1.8, and 2.0 m were selected to analyze the maximum and average mooring forces for the two connection configurations under different wave periods.
In , under identical catenary mooring configurations and wave period conditions, both the elastic and rigid connection structures exhibited an overall increasing trend in mooring force as the wave height increased from 1.6 to 2 m. From the comparison of mooring force values, in most cases, the maximum and average mooring forces of the elastic connection structure were lower than those of the rigid connection structure. Furthermore, when the wave period was small, the mooring force of the OFPV with elastic connection was significantly smaller than that of the OFPV with rigid connection. As the wave period increased, the difference between the average mooring forces of the two gradually decreased. The flexibility of the connection system enabled it to deform and respond more flexibly under wave action, thereby enhancing the wave-following performance of the OFPV, allowing it to dissipate wave energy effectively. However, the maximum mooring force of the elastic connection structure was not consistently lower than that of the rigid structure. For example, when the wave height was 2.0 m and the wave period was 5 s, the maximum mooning force of the elastic connection structure at catenary 1 reached 4098.55 N, while that of the rigid connection structure was 3320.84 N. This indicated that under specific combinations of wave parameters, the mooring forces of some catenary lines of the elastic combination of wave parameters, the mooring forces of some catenary line of the elastic connection structure were higher than those of the rigid connection structure.
. Comparison of mooring forces under elastic and rigid connection configurations.
For the design of elastic connection structure, it is necessary to focus on the characteristics of large mooring force fluctuations, and equip mooring cables with higher elasticity and adaptability to cope with dynamic changes in load. For the design of rigid connection structures, emphasis should be placed on optimizing the mooring layout to improve the overall stability of the structure.
4. Conclusions
This study proposes a novel OFPV with elastic connection and modularizable HDPE float blocks. The numerical wave tank is constructed by using the turbulence model in FLOE-3D, and the dynamic responses of the floating structures with elastic and rigid connections are calculated by using the GMO method. The motion characteristics of the two connection types are compared in terms of displacement, velocity, and mooring force, and the conclusions are summarized as follows:
- (1)
-
The mean pressure acting on the OFPV supporting structure with elastic connections shows a positive correlation with wave height. Except under the 1 m wave height condition, the mean pressure increases with longer wave periods.
- (2)
-
The maximum tensile force of the elastic cable varies significantly in the structural space distribution. The maximum tensile force of the outermost elastic cable is relatively high and shows a decreasing trend with the increase of the wave period. The elastic cables connected to central floaters experience relatively lower tensile forces, indicating that the wave-induced loads on the central floaters are relatively minor. The OFPV system achieves effective force distribution through its elastic cable arrangement.
- (3)
-
The X-direction displacement of the elastic connection structure is smaller than that of the rigid connection structure, but as the wave period increases, the displacement responses of the two structures gradually converge. In terms of Z-direction displacement, the OFPV with elastic connection exhibits a smaller motion amplitude than with the rigid connection structure. Under the short-wave period, the difference in the motion amplitudes of the two is obvious. However, as the wave period increases, the difference in the motion amplitudes of the two gradually decreases.
- (4)
-
The elastic connection structure exhibits lower maximum and average mooring forces compared with the rigid connection structure, and the difference is more obvious when the wave period is small. However, under specific parameter conditions, the mooring force of the elastic connection structure is greater than that of the rigid connection structure, because the mooring force is comprehensively affected by wave parameters, structural forms, and mooring system parameters. In summary, the OFPV with elastic connection structure demonstrates more pronounced advantages under extreme wave conditions.
Besides, Subsequent research can be carried out from multiple aspects: Optimizing the design of the connector and mooring line to enhance the stability of the system further; The complex marine environmental factors, wind, waves, and currents, will be considered. This study investigated the hydrodynamic responses of OFPV with elastic and rigid connections under various wave conditions. It reveals the regularity of floater motion and mooring forces with different connection configurations. It provides theoretical guidance for the design and engineering application of OFPV.
Acknowledgments
We gratefully acknowledged the support of the National Key R&D Program of China (Grant No. 2022YFB4200700).
Author Contributions
Conceptualization, Y.Y., X.R. and X.Y.; Methodology, X.Z., Z.D. and J.S.; Software, X.R.; Validation, Y.Y. and Z.D.; Formal Analysis, Y.Y., X.Z. and Z.D.; Writing—Original Draft Preparation, X.Z., X.Y. and Z.D.; Writing—Review & Editing, Y.Y., Z.D. and J.S.; Supervision, Y.Y. and Z.D.; Project Administration, Y.Y. and Z.D.; Funding Acquisition, Y.Y.
Ethics Statement
Not applicable.
Informed Consent Statement
Not applicable.
Data Availability Statement
The datasets generated during and/or analysed during the current study are available from the corresponding author on request.
Funding
The research was funded by the National Key Research and Development Program of China (Grant NO 2022YFB4200700), the Tianjin Science and Technology Plan Project (Grant NO:24JCYBJC00870) and the National Science Foundation of Tianjin Science and Technology Plan Project (Grant NO: 23ZYQYGX00140).
Declaration of Competing Interest
The authors declare that they have no known competing financial interests or personal relationships that could have appeared to influence the work reported in this paper.
References
-
1.
Ram JP, Babu TS, Rajasekar N. A comprehensive review on solar PV maximum power point tracking techniques.
Renew. Sustain. Energy Rev. 2017,
67, 826–847. doi:10.1016/j.rser.2016.09.076.
[Google Scholar]
-
2.
Sangwongwanich A, Yang Y, Blaabjerg F. High-Performance Constant Power Generation in Grid-Connected PV Systems.
IEEE Trans. Power Electron. 2016,
31, 1822–1825. doi:10.1109/TPEL.2015.2465151.
[Google Scholar]
-
3.
Cai W, Li X, Maleki A, Pourfayaz F, Rosen MA, Alhuyi Nazari M, et al. Optimal sizing and location based on economic parameters for an off-grid application of a hybrid system with photovoltaic, battery and diesel technology.
Energy 2020,
201, 117480. doi:10.1016/j.energy.2020.117480.
[Google Scholar]
-
4.
K A, K V. A comparative study of floating and ground-mounted photovoltaic power generation in Indian contexts.
Clean. Energy Syst. 2024,
9, 100140. doi:10.1016/j.cles.2024.100140.
[Google Scholar]
-
5.
Oliveira-Pinto S, Stokkermans J. Marine floating solar plants: An overview of potential, challenges and feasibility.
Proc. Inst. Civ. Eng. -Marit. Eng. 2020,
173, 120–135. doi:10.1680/jmaen.2020.10.
[Google Scholar]
-
6.
Cazzaniga R, Cicu M, Rosa-Clot M, Rosa-Clot P, Tina GM, Ventura C. Compressed air energy storage integrated with floating photovoltaic plant.
J. Energy Storage 2017,
13, 48–57. doi:10.1016/j.est.2017.06.006.
[Google Scholar]
-
7.
Magkouris A, Belibassakis K, Rusu E. Hydrodynamic analysis of twin-hull structures supporting floating pv systems in offshore and coastal regions.
Energies 2021,
14, 5979.doi:10.3390/en14185979.
[Google Scholar]
-
8.
Choi SM, Park CD, Cho SH, Lim B-J. Effects of various inlet angle of wind and wave loads on floating photovoltaic system considering stress distributions.
J. Clean Prod. 2023,
387, 135876. doi:10.1016/j.jclepro.2023.135876.
[Google Scholar]
-
9.
Xiao FQ, Chen ZG, Dai Y, Song XF, Guo J, Yu DH, et al. Numerical method study on environmental loads of floating photovoltaic power array.
Gongcheng Lixue/Eng. Mech. 2020,
37, 245–256. doi:10.6052/j.issn.1000-4750.2019.04.0230.
[Google Scholar]
-
10.
Ikhennicheu M, Blanc A, Danglade B, Gilloteaux J-C. OrcaFlex Modelling of a Multi-Body Floating Solar Island Subjected to Waves.
Energies 2022,
15, 9260. doi:10.3390/en15239260.
[Google Scholar]
-
11.
Liu Y, Ren N, Ou J. Hydrodynamic analysis of a hybrid modular floating structure system and its expansibility.
Ships Offshore Struct. 2022,
17, 2367–2377. doi:10.1080/17445302.2021.1996110.
[Google Scholar]
-
12.
Li Z, Chen D, Feng X, Chen JF. Hydroelastic analysis and structural design of a modular floating structure applying ultra-high performance fiber-reinforced concrete.
Ocean Eng. 2023,
277, 114266. doi:10.1016/j.oceaneng.2023.114266.
[Google Scholar]
-
13.
Shi Y, Wei Y, Chen K, Xin C, Tay ZY, Chen Z. Frequency-domain approach of hydroelastic response for flexible offshore floating photovoltaic under combined wind and wave loads.
Ocean. Eng. 2025,
323, 120565. doi:10.1016/j.oceaneng.2025.120565.
[Google Scholar]
-
14.
Dai J, Zhang C, Lim HV, Ang KK, Qian X, Wong JLH, et al. Design and construction of floating modular photovoltaic system for water reservoirs.
Energy 2020,
191, 116549. doi:10.1016/j.energy.2019.116549.
[Google Scholar]
-
15.
Kong YH, Xiao FQ, Chen ZG, Song XF, Wu H. Numerical research on current load of floating square array in floating PV power station.
Shuidonglixue Yanjiu Yu Jinzhan/Chin. J. Hydrodyn. Ser A 2019,
34, 218–223. doi:10.16076/j.cnki.cjhd.2019.02.010.
[Google Scholar]
-
16.
Sree DKK, Law AW-K, Pang DSC, Tan ST, Wang CL, Kew JH, et al. Fluid-structural analysis of modular floating solar farms under wave motion.
Sol. Energy 2022,
233, 161–181. doi:10.1016/j.solener.2022.01.017.
[Google Scholar]
-
17.
Lee JH, Paik KJ, Lee S-H, Hwangbo J, Ha T-H. Experimental and Numerical Study on the Characteristics of Motion and Load for a Floating Solar Power Farm under Regular Waves.
J. Mar. Sci. Eng. 2022,
10, 565. doi:10.3390/jmse10050565.
[Google Scholar]
-
18.
Delacroix S, Bourdier S, Soulard T, Elzaabalawy H, Vasilenko P. Experimental Modelling of a Floating Solar Power Plant Array under Wave Forcing.
Energies 2023,
16, 5198. doi:10.3390/en16135198.
[Google Scholar]
-
19.
Ou B, Cerik BC, Huang L. Seakeeping analysis of catamaran and barge floats for floating solar arrays: A CFD study with experimental validation.
Ocean. Eng. 2025,
326, 120970. doi:10.1016/j.oceaneng.2025.120970.
[Google Scholar]
-
20.
Kim BW, Young Hong S, Kyoung JH, Kyu Cho S. Evaluation of bending moments and shear forces at unit connections of very large floating structures using hydroelastic and rigid body analyses.
Ocean. Eng. 2007,
34, 1668–1679. doi:10.1016/j.oceaneng.2006.10.018.
[Google Scholar]
-
21.
Gao RP, Tay ZY, Wang CM, Koh CG. Hydroelastic response of very large floating structure with a flexible line connection.
Ocean. Eng. 2011,
38, 1957–1966. doi:10.1016/j.oceaneng.2011.09.021.
[Google Scholar]
-
22.
Otto WJ, Waals OJ, Bunnik THJ, Cresp J. Optimization of wave induced motions and forces on a floating island. In Proceedings of the 29th International Ocean and Polar Engineering Conference, Honolulu, HI, USA, 16 June 2019.
-
23.
Zhang X, Wang J, Li L, Sun S, Wang Z. Load Analysis of Connectors for Floating Structures at Sea.
Front. Comput. Intell. Syst. 2023,
5, 95–99. doi:10.54097/fcis.v5i1.11956.
[Google Scholar]
-
24.
Kim SH, Yoon SJ, Choi W. Design and Construction of 1 MW Class Floating PV Generation Structural System Using FRP Members.
Energies 2017,
10, 1142. doi:10.3390/en10081142.
[Google Scholar]
-
25.
Shi QJ, Xu DL, Zhang HC, Zhao H, Wu YS. Optimized stiffness combination of a flexible-base hinged connector for very large floating structures.
Mar. Struct. 2018,
60, 151–164. doi:10.1016/j.marstruc.2018.03.014.
[Google Scholar]
-
26.
Wu L, Wang Y, Wang Y, Chen J, Li Y, Li Q, et al. Optimal Stiffness for Flexible Connectors on A Mobile Offshore Base at Rough Sea States.
China Ocean. Eng. 2018,
32, 683–695. doi:10.1007/s13344-018-0070-5.
[Google Scholar]
-
27.
Lu Y, Zhang H, Chen Y, Shi Q, Zhou Y. A new type connection with optimum stiffness configuration for very large floating platforms.
Proc. Inst. Mech. Eng. Part M J. Eng. Marit. Environ. 2022,
236, 764–778. doi:10.1177/14750902211056225.
[Google Scholar]
-
28.
Xia S, Yu W, Xu D, Zhang H. Vibration Control of Multi-Modular VLFS in Random Sea Based on Stiffness-Adjustable Connectors.
Appl. Sci. 2022,
12, 1117. doi:10.3390/app12031117.
[Google Scholar]
-
29.
Claus R, López M. A methodology to assess the dynamic response and the structural performance of floating photovoltaic systems.
Sol. Energy 2023,
262, 111826. doi:10.1016/j.solener.2023.111826.
[Google Scholar]
-
30.
Jiang Z, Dai J, Saettone S, Tørå G, He Z, Bashir M, et al. Design and model test of a soft-connected lattice-structured floating solar photovoltaic concept for harsh offshore conditions.
Mar. Struct. 2023, 90.
doi:10.1016/j.marstruc.2023.103426.
[Google Scholar]
-
31.
Saitov K, Jiang Z. Advancing offshore solar energy generation: Numerical modelling and calibration of a floating solar array against model tests.
Sol. Energy 2025,
288, 113225. doi:10.1016/j.solener.2024.113225.
[Google Scholar]
-
32.
Zheng Z, Jin P, Huang Q, Zhou B, Xiang R, Zhou Z, et al. Motion response and energy harvesting of multi-module floating photovoltaics in seas.
Ocean. Eng. 2024,
310, 118760. doi:10.1016/j.oceaneng.2024.118760.
[Google Scholar]
-
33.
Wang B, Li Y, Huang L, Yao Y, Qin Y. Dynamic analysis of a novel star-type floating photovoltaic system with flexible connectors.
Ocean. Eng. 2024,
304, 117854. doi:10.1016/j.oceaneng.2024.117854.
[Google Scholar]
-
34.
Ding R, Zhang H, Liu C, Xu D, Shi Q, Liu J, et al. Connector configuration effect on the dynamic characteristics of multi-modular floating structure.
J. Ocean. Eng. Sci. 2024,
9, 517–527. doi:10.1016/j.joes.2022.08.003.
[Google Scholar]
-
35.
Ji C, Gao X, Xu S. Study on the influence of connector designs on the hydrodynamic performance of an offshore floating photovoltaic.
Ocean. Eng. 2024,
308, 118298. doi:10.1016/j.oceaneng.2024.118298.
[Google Scholar]
-
36.
Li X, Qi XZYS. Analysis of Wave Characteristics in the Central Part of the Bohai Bay.
J. Waterw. Harb. 2018,
39, 288.
[Google Scholar]
-
37.
Wang P, Ji C, Sun X, Xu D, Ying C. Development and test of FDEM–FLOW-3D—A CFD–DEM model for the fluid–structure interaction of AccropodeTM blocks under wave loads.
Ocean. Eng. 2024,
303, 117735. doi:10.1016/j.oceaneng.2024.117735.
[Google Scholar]
-
38.
Han Z, Cao F, Shi H. Numerical Simulation on the energy capture spectrum of heaving buoy wave energy converter.
Ocean. Eng. 2023,
280, 114475. doi:10.1016/j.oceaneng.2023.114475.
[Google Scholar]