1. Introduction
Cylindrical structures involved in offshore energy production systems are subjected to various solicitations, including hydrodynamic currents, surface waves, and interaction with the seabed. Understanding these interactions is essential for ensuring the stability and longevity of offshore installations, such as wind turbines, oil platforms, and marine infrastructure. Such rapid changes in the bedforms of bathymetry can expose and damage these offshore installations. Conversely, the turbulence generated behind pile foundations can alter the morphology of crossing bedforms and subsequently impact the environment, benthic habitats, and engineering.
While extensive research has been conducted on wave-seabed and current-seabed interactions independently, a significant gap remains in understanding their combined effects, particularly on sediment transport, scour development, and structural stability (see, for example, [
1,
2,
3,
4,
5,
6]). It was found that the wave leads to an increase in the depth of scour at large Kolegan–Carpenter numbers. Note that usually, the study of the combined effects of waves and currents does not consider the fact that the waves can change the characteristics of the vortexes arising around a cylinder. In [
7,
8,
9,
10,
11], it has been shown that the vortex shedding regimes appearing in the vicinity of the cylinder can be qualitatively changed under the influence of surface waves. If the frequency of the waves is close to twice the frequency of vortex shedding, it may occur in a sub-harmonic frequency lock-in mode: under the influence of surface waves, the frequency of vortex shedding is equal to half the surface wave frequency. The intensity of the velocity fluctuations in the vortexes can significantly increase [
8]. At large amplitudes of surface waves, instead of sub-harmonic frequency lock-in regime in which the vortex shedding occurs at a frequency of surface waves arise. In this mode, there is a substantial restructuring of the vortex wake structure [
7,
8,
9,
10,
11]. At large amplitudes of the surface waves, the vortex shedding can be completely suppressed. Obviously, the impact of waves on the vortexes can lead to changes in particle transport on a sandy bottom.
Addressing these knowledge gaps has direct practical implications for the design and maintenance of offshore structures. A more comprehensive understanding of wave-current-seabed interactions can improve predictive models, optimize foundation designs, and mitigate the risks of seabed instability, which may lead to structural failure. This study aims to provide new insights into these interactions by investigating the hydrodynamic forces, sediment response, and scour mechanisms around cylindrical offshore structures subjected to combined wave and current forces. We investigate in a laboratory experiment how much particle transport on the sandy bottom in the vicinity of a vertical cylinder can change due to the modification of vortex characteristics by surface waves.
The paper is organized as follows. In Section 2, we describe the experimental scheme and acquisition procedure. In Section 3, we present the results of the evolution of the sandy bottom profile in the vicinity of the cylinder under the combined action of surface waves and current. Section 4 is focused on the theoretical approach. The theoretical results are compared to those obtained experimentally. Finally, conclusions are presented in Section 5.
2. Experimental Setup and Acquisition Procedure
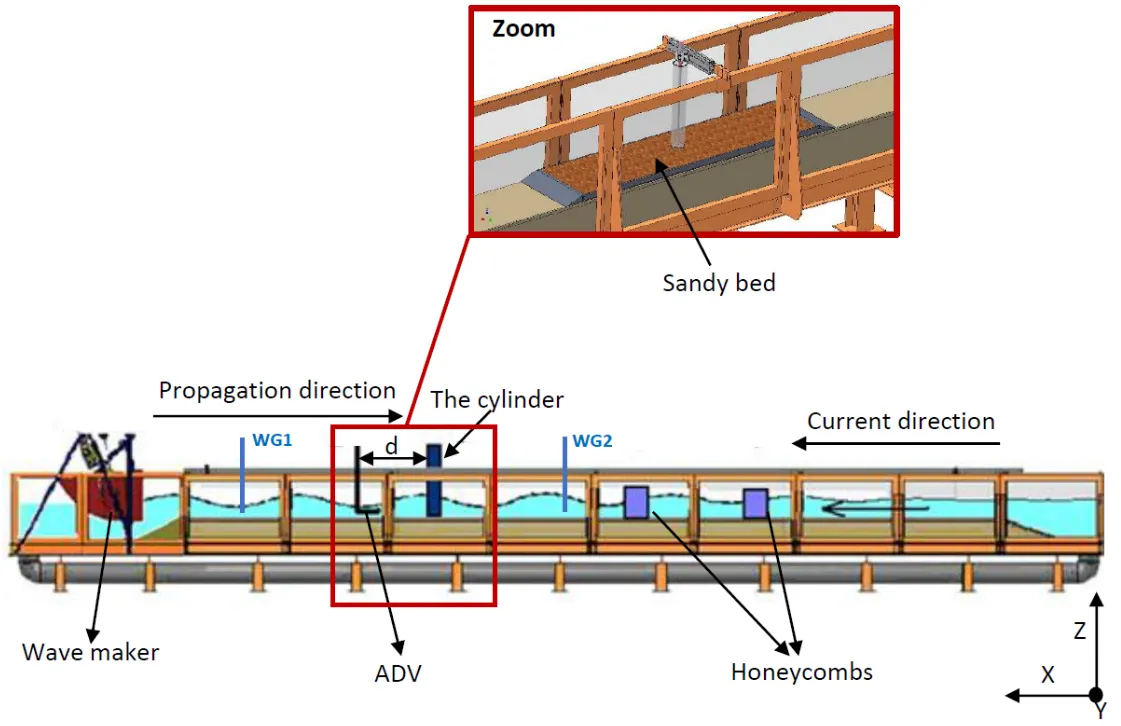
Experiments were carried out in the wave flume at the Continental and Coastal Morphodynamics laboratory at Caen University. The flume measures 17 m in length, 0.5 m in width and has a usable height ranging from 25 cm to 40 cm. the wave flume is equipped with computer-controlled wave maker (). Harmonic waves can be generated in the wave flume with varying frequencies and amplitudes. The facility is also equipped with a pump and a recirculation system that enables the creation of a steady flow U. Waves are introduced at the end of the wave flume by a wave maker and propagate upstream (from left to right, as shown in ).
. A schematic of the wave flume showing the wave propagation direction from left to right and the direction of current propagation from right to left. ADV to measure at a point the three components of the flow velocity. WG1 and WG2 are wave gauge 1 and wave gauge 2 to measure free surface displacement.
To mitigate turbulent fluctuations induced by the pump, a set of honeycombs, each approximately 10 cm thick, is used. These honeycombs are positioned beneath an inclined beach made of porous material (see ). The experiments are conducted with traveling waves, as the honeycombs and the inclined porous beach significantly reduce the amplitude of the reflected waves.
Experiments were carried out with a cylinder with a diameter D of 0.04 m, set vertically at equal distances from the channel side walls; the velocity of hydrodynamic flow is U = 0.16 m/s. Behind the cylinder, turbulent van Karman Street occurs because Reynolds number Re = UD/ν (ν is for kinematic viscosity of water) is sufficiently high Re = 6400.
To investigate characteristics of hydrodynamic fields, an Acoustic Doppler Velocimeter (ADV) and wave gauge are used in experiments. ADV allows us to obtain point measurements in the vicinity of the cylinder for the three components of the flow velocity: Vx (longitudinal velocity), Vy (transverse velocity), and Vz (vertical velocity), as shown in . These velocity components result from different mechanisms: vortices formed behind the cylinder (hydrodynamic mode) and surface waves. Two-dimensional surface waves propagate along the wave flume, contributing to the Vx and Vz components. Assuming that the vortices behind the cylinder have only a vertical vorticity component, they primarily influence Vx and Vy. However, at the high Reynolds numbers reached in the experiments, turbulent vortices develop in the wake of the cylinder. As a result, the hydrodynamic mode does affect Vz, though its influence is significantly weaker compared to its impact on Vx and Vy.
Mean velocity profiles and velocity fluctuation profiles are measured up and downstream from the cylinder when the scoring depth is deemed to be equilibrium. Wave gauges are used to measure free surface displacement caused by surface waves.
Two methods of data acquisition are used in the experiment. Measurement values by different equipment (free surface displacement by wave gauge and velocity components by ADV) and synchronized measurement when data from probes and ADV have joint time. Both types of measurements have the same frequency of acquisition of 200 Hz.
For experiments on the transport of sand around the cylinder, a 0.05 m thick layer of sand was placed on the floor of the channel (). The length of the sand layer was 2.6 m. Sand is held in a limited region by a box with walls that have a height equal to the thickness of the sand layer (0.05 m). The side walls of the box, located below and upstream from the cylinder, have a wedge-shaped design. The wedge angle is approximately 10 degrees. Such a form of the side walls eliminates the turbulent disturbances on the edges of the box and prevents the transport of sand in these areas.
The grain size distribution of the sand used in the experiments is presented in , with a mean grain size of d
50 = 0.153 mm.
. The grain size distribution characteristics of the sand (d<sub>50</sub> = 0.153 mm).
The influence of hydrodynamic flow and waves on sand may be characterized by the Shield number:
where
τ0 is the bed shear stress,
ρs is the sediment density,
ρw is the fluid density, and g is the acceleration due to gravity.
Under experimental conditions, a flat interface between a sandy bottom and water is stable, and relatively generation of sand ripples far from the cylinder. It means that Shields number
Θ in this area is less than
Θc,
Θc is the critical value corresponding to the threshold of instability. Using the empirical formula [
12]:
where$$ s = \rho_{s} / \rho_{w}$$, for the present tests, the critical Shields number $$\varTheta_{с}$$ can be estimated, $$\varTheta_{с} = 0 . 057$$, and the critical value of the shear velocity at the bed $$\overset{-}{u}_{∗ c} = \sqrt{\tau_{0 c} / \rho} = 0 . 0492 $$ m/s for the incipient sediment motion, with
τ0c being the corresponding critical value of
τ0. The value of the Reynolds number $$R e_{∗} = \frac{\overset{-}{u}_{∗ c} k_{s}}{\nu} = 18 . 5$$, where $$k_{s} = 2 . 5 d_{50} $$ [
13] is the roughness length of the bed, lies in the transition region since $$5 < R e_{∗} < 70$$ [
14], and the roughness length scale on a flat bottom
z0 may be estimated by [
14]
In the transition regime, where $$5 < R e_{∗} < 70$$, the following equation is used [
14]
Using
Equation (2),
Equation (4) and
Equation (5), we estimate the critical value of the depth-averaged current velocity $$ \overset{-}{U}$$ for the onset of sediment motion to be 0.54 m/s. This result is in good agreement with the experimentally determined value of $$ 0 . 6 $$ m/s. As indicated in
Table 1, the current tests were conducted with $$\overset{-}{U} < 0 . 54 $$ m/s, which corresponds to $$\varTheta < \varTheta_{с}$$.
.
Test conditions for mobile bed cases, with wave parameters presented without a scale factor.
| Test No. |
Wave Height (m) |
Wave Period (s) |
Wave Frequency (Hz) |
Current |
Unidirectional Current Velocity (m/s) |
| Current only |
- |
- |
- |
Yes |
0.16 |
| Regular waves: Sub-harmonic Frequency lock-in |
0.05 |
0.8 |
1.25 |
Yes |
0.16 |
| Regular waves: Frequency lock-in |
0.02 |
0.67 |
1.5 |
Yes |
0.16 |
3. Evolution of Bottom Profile under the Action of Surface Waves and Current
To investigate the flow around a cylinder caused by the combined effects of waves and currents and to understand its impact on the bed, several tests were conducted with a water depth of 0.25 m.
Three comprehensive mobile bed experiments were performed to examine the development of scour around a cylinder, with specific conditions detailed in
.
To investigate the evolution of bottom profiles, a special image acquisition procedure is used. A vertical light sheet, perpendicular to the longitudinal axis of the wave flume, is generated using a cylindrical lens and a semiconductor laser. This light sheet creates a light line on the sandy bed, which is then recorded by a camera. The semiconductor laser and camera are fixed at a frame that can move along a rail (see
). The frame is moved by a step motor that is controlled by a PC. The bottom profile acquisition is performed in a step-like mode: the frame with the semiconductor laser and the camera is moved by a prescribed number of steps, then a pause occurs for a prescribed time, and the bottom light line is captured, after which the frame is moved again. This system is used to obtain 1620 images 1024 × 768 pixels each, with a pause time of 0.8 s.
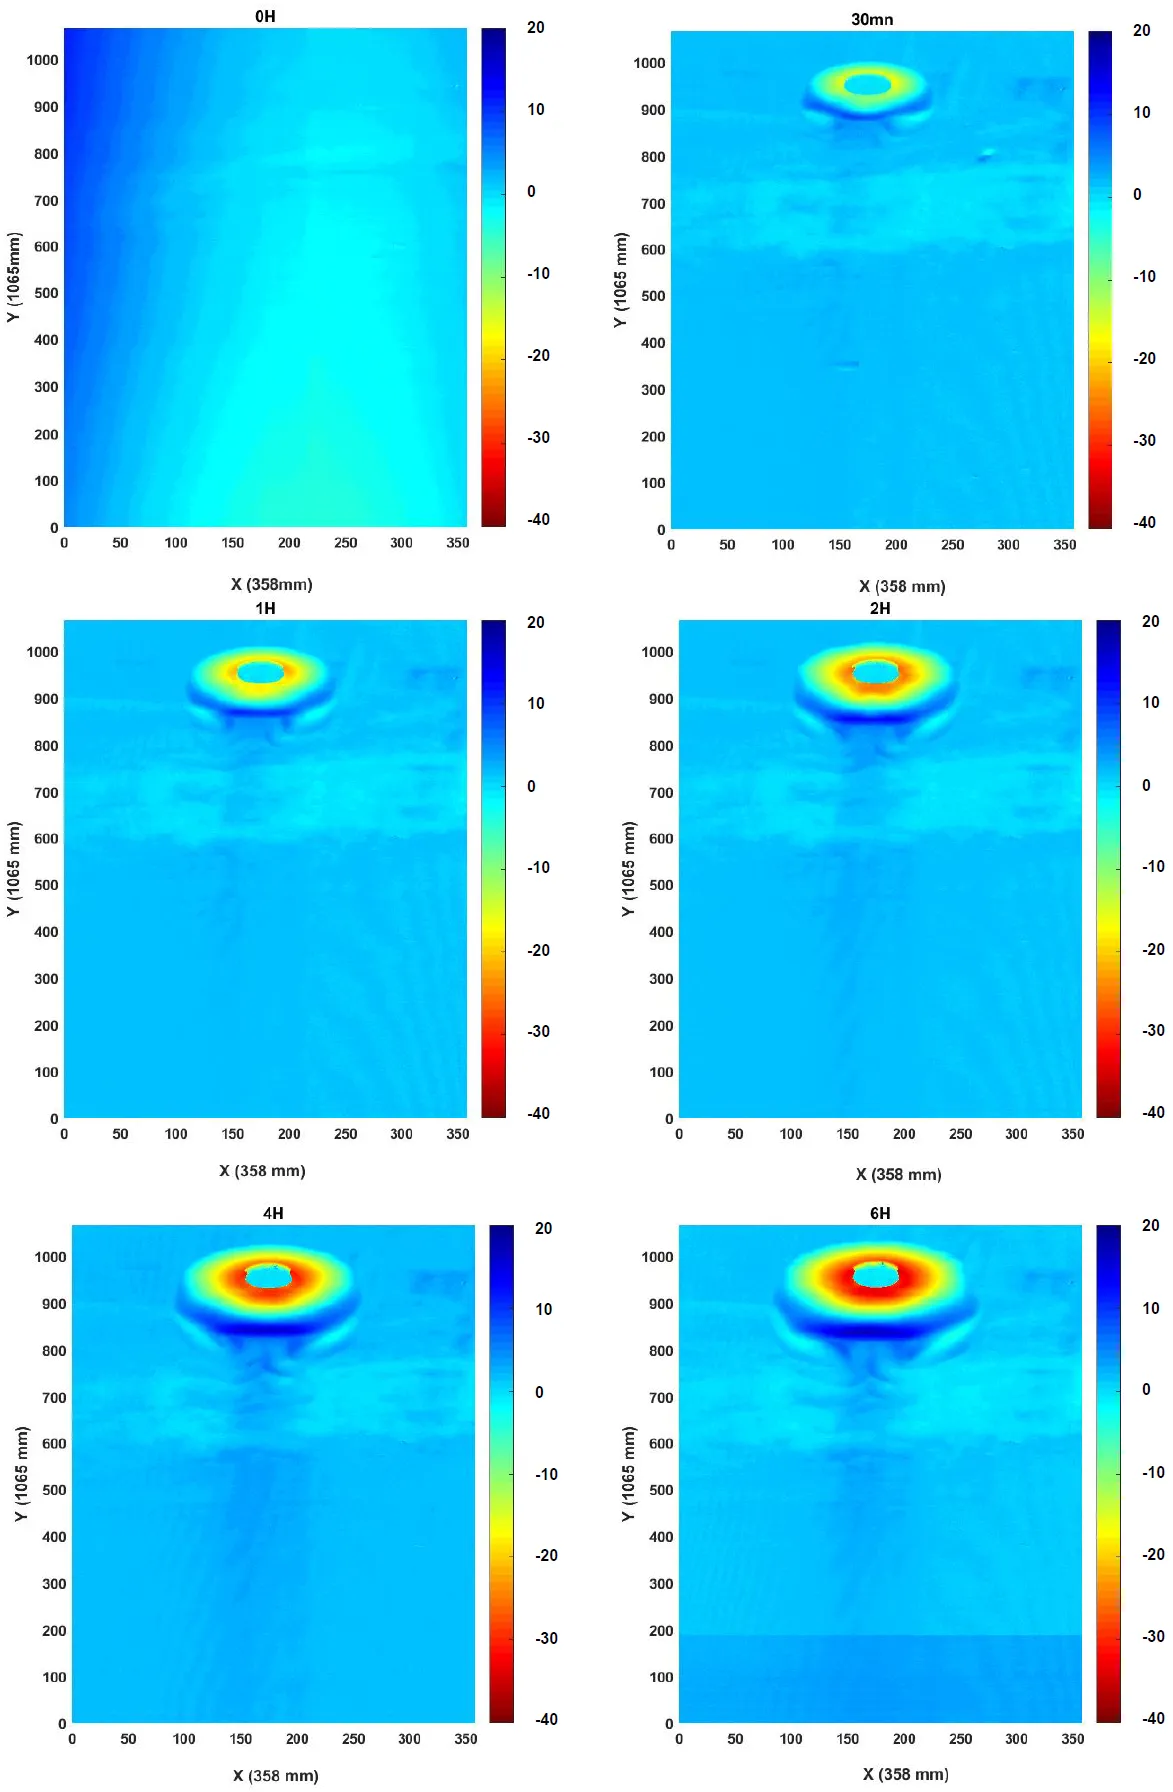
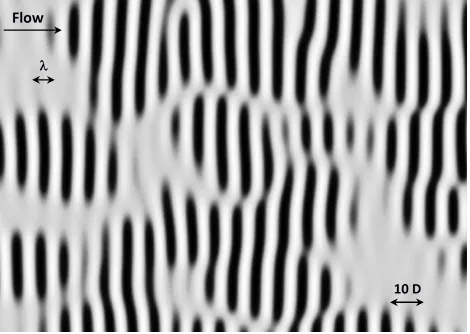
In experiments, the bottom profiles are recorded in the region of approximately 0.358 m × 1.065 m around the cylinder. Results on bottom morphology for different regimes of vortex shedding appearing under the action of surface wave are demonstrated in
,
and
. The coordinate origins, x and y, are set at the center of the cylinder. Distinct sand patterns are visible, with bedforms developing downstream of the cylinder due to vortex formation. Upstream sediment movement was minimal, except in the immediate vicinity of the cylinder, where scour was observed.
. Absence of surface waves.
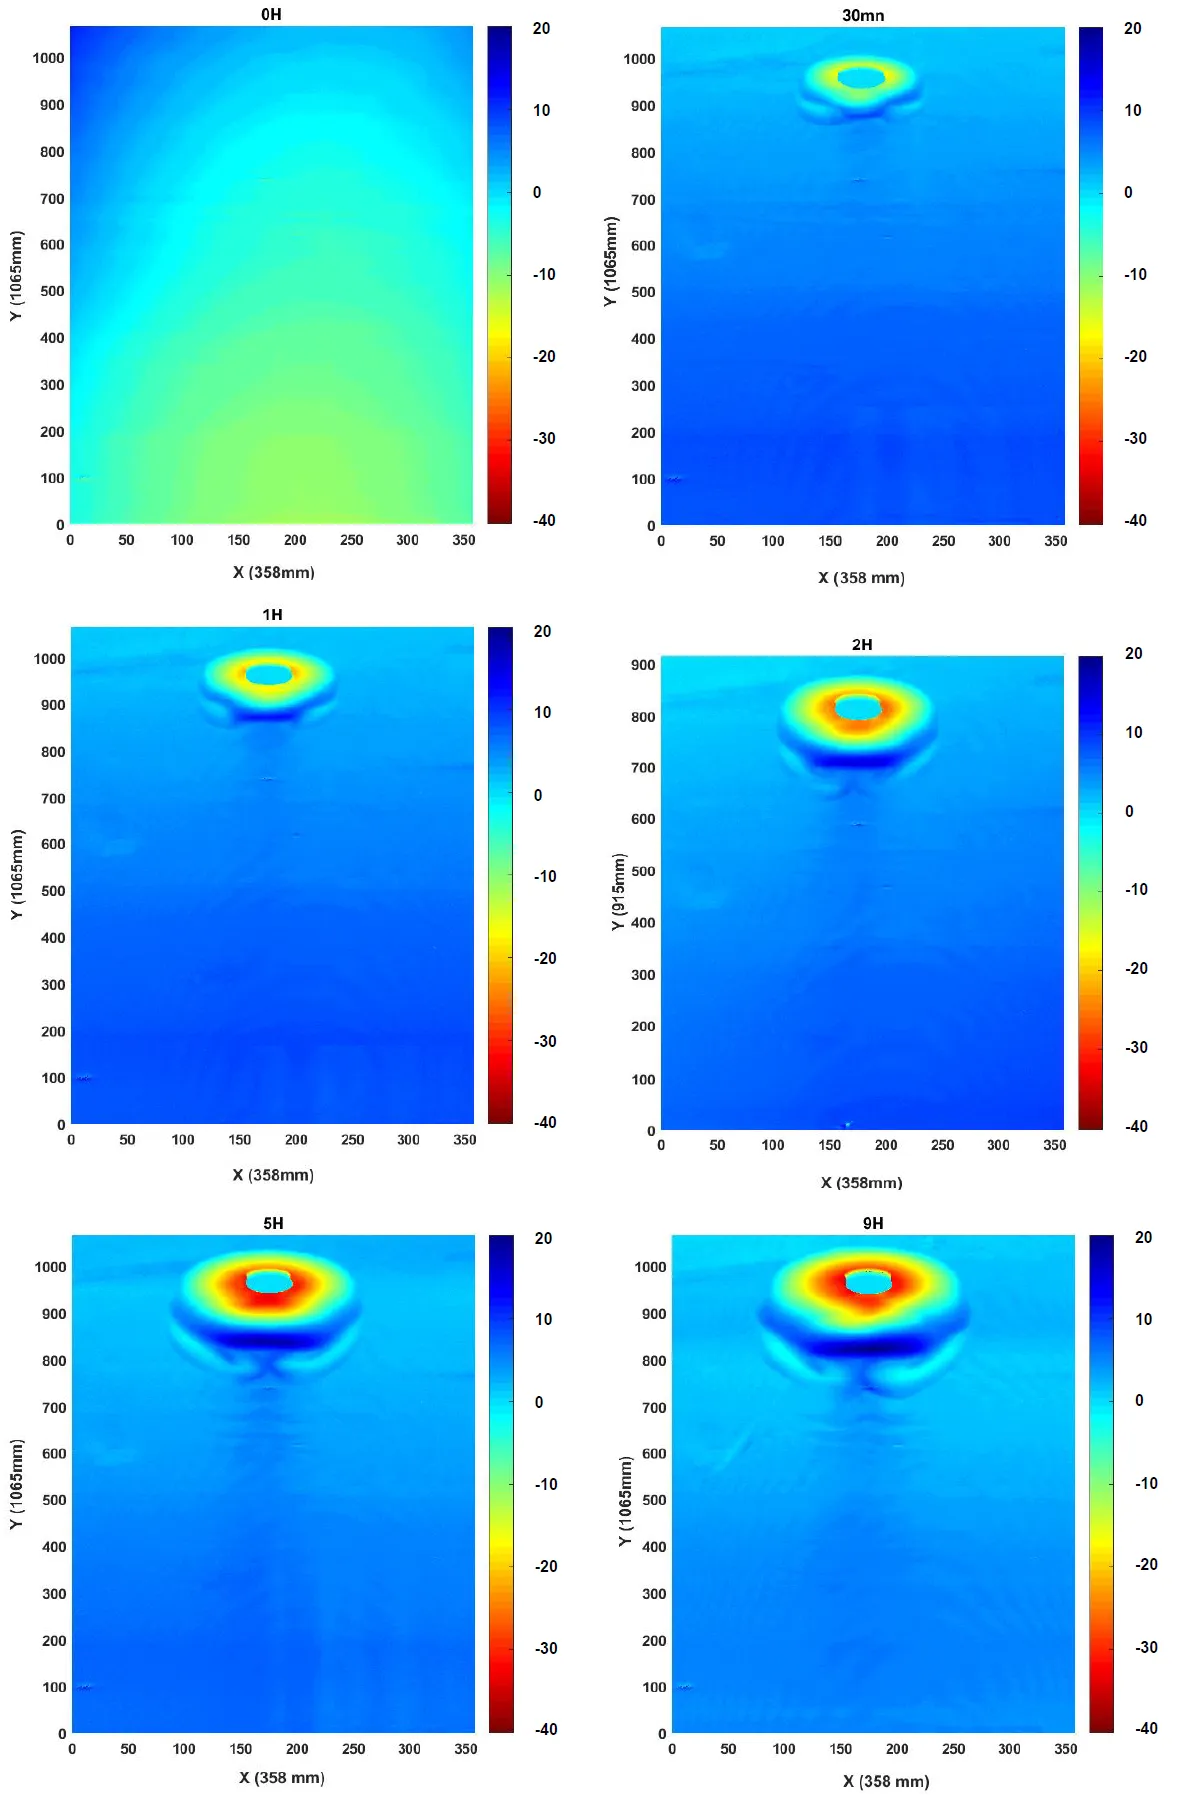
. Sub-harmonic frequency lock-in.
. Comparison of steady sand patterns appearing on the bottom for different regimes.
Experiments on sediment transport behind a circular cylinder under the combined action of surface waves and currents were conducted in a wave flume for three different regimes (
). The temporal evolution of the sediment bed was reproduced and studied after flow durations of 30 min, 1 h, 2 h, 4 h, 6 h, 8 h and 9 h. The resulting morphologies were used to characterize the evolution of scour around the vertical cylinder and the ripples generated in the sand just downstream of the cylinder.
The obtained morphologies were used to characterize the evolution of scour around the vertical cylinder and the ripples generated in the sand immediately downstream of the cylinder.
shows the temporal evolution of the bed morphology in the absence of surface waves during the first six hours.
shows the temporal evolution of the bed morphology in the presence of surface waves (sub-harmonic frequency lock-in) during the first nine hours. The largest significant impact of the mast on sediment transport and bed structure appears when t = 540 min. A strong scour around the mast is observed, which results in erosion and collapse of the ripple crest upstream of the mast, and the sediments made available are deposited downstream in the form of a 2 cm high sand mound (
and
).
shows the bed morphology after nine hours for the three different regimes: current-only regime, subharmonic frequency-locking regime, and harmonic frequency-locking regime. In the experimental conditions, sediment transport is absent far from the cylinder vortex wake. This means that far from the cylinder, the Shield number is below the critical value. In the subharmonic frequency-locking regime, only minor changes are observed, mainly concerning the regularization of the sand pattern behind the cylinder. In the harmonic frequency-locking regime, a spatially periodic sediment structure is generated behind the cylinder. This effect is due to the significant transformations of the vortex wake behind the cylinder under the action of surface waves.
illustrate the temporal evolution of scouring depth for various flow types studied in the conducted experiments.
Regarding regular waves, the scouring and depth are more pronounced in the case of regular waves sub-harmonic Frequency lock-in, where the waves have a frequency of 1.25 Hz. There is thus, a significant reduction in the hydrodynamic effect when transitioning from a flow of regular waves to a flow without waves. Finally, we can observe that after 9 h of flow, the order of magnitude concerning the depth and volume of scouring is similar for both the current-only case and the regular wave frequency lock-in regime.
These observations align with findings from various studies on sediment transport and scouring mechanisms. For instance, research by Sumer and Fredsøe (2006) highlights the impact of wave regularity on scouring processes, noting that regular waves tend to induce more substantial scouring compared to irregular waves due to the consistent and predictable hydrodynamic forces they generate. Additionally, the temporal evolution of scouring depth and volume has been extensively documented in studies such as those by [
15,
16,
17], which emphasize the importance of flow duration and wave characteristics in determining scouring patterns around cylindrical structures.
These figures and the accompanying analysis highlight the crucial role of wave frequency and regularity in scouring processes, offering valuable insights into the hydrodynamic interactions and sediment transport mechanisms in coastal and offshore environments.
It is found that the development path of scouring depth growth exhibits the same general trend regardless of the hydrodynamic conditions. Once the equilibrium stage is achieved, the temporal evolution shows a typical asymptomatic increase, and the scouring depth fluctuates around their equilibrium values. Non-linear fits for various flow types studied in the conducted experiments are shown, respectively, by red, blue, and black lines. These correlations were obtained using Equations (6)
where $$\left(\frac{S}{D}\right)_{e q}$$ the equilibrium scour ratio and
k (h
−1) the growth-rate constant.
In the absence of waves, scour develops in the classic pattern. Non-linear fits imply that about 63% of the final scour is achieved in roughly 1.5 h, consistent with the “initial rapid” phase seen in [
18]. Physically, the flow creates a strong horseshoe vortex and contraction around the cylinder that quickly excavates sediment. As time passes and the scour hole deepens, the shear on the bed reduces, allowing backfilling to occur, which in turn slows further deepening. The asymptotic value $$\left(S / D\right)_{e q}$$ indicates a moderate scour intensity (the hole depth is about 0.89 times the cylinder diameter). This level is in line with laboratory values for sand beds under clear-water currents [
18].
With regular surface waves that frequency lock-in at the fundamental (1:1) frequency, we find a slightly different trend. The growth constant is higher than in the current-only scenario, meaning scour initially builds up even faster. In other words, the waves accelerate the scour but limit the ultimate depth. One interpretation is that the imposed wave motion periodically lifts and mixes the bed material, enhancing early erosion but also causing more sediment re-deposition or limiting hole formation in the long term. In this harmonic lock-in regime, the vortex shedding frequency matches the wave frequency [
8,
10,
11], resulting in a synchronized, steady wake pattern. That regular wake may excavate sediment efficiently at first but settle into a somewhat shallower equilibrium hole. Overall, the scour intensity under harmonic lock-in is comparable to that under current-only conditions despite the faster response.
Finally, under subharmonic forcing (where the wave frequency is roughly twice the natural shedding frequency), the scour behavior contrasts strongly. The fitted growth rate is the lowest of the three, indicating the slowest approach: about 1.6 h to reach 63% of equilibrium. This means subharmonic waves produce the deepest scour hole, but it takes longer to develop. Physically, subharmonic lock-in implies that every other wave cycle strongly reinforces a Kármán vortex. Such intermittent forcing can inject bursts of energy into the wake on a longer time scale, gradually excavating more sediment. The net result is higher scour intensity and a protracted erosion process.
. Time history of scour depth at the most upstream point of the cylinder surface for different flow conditions.
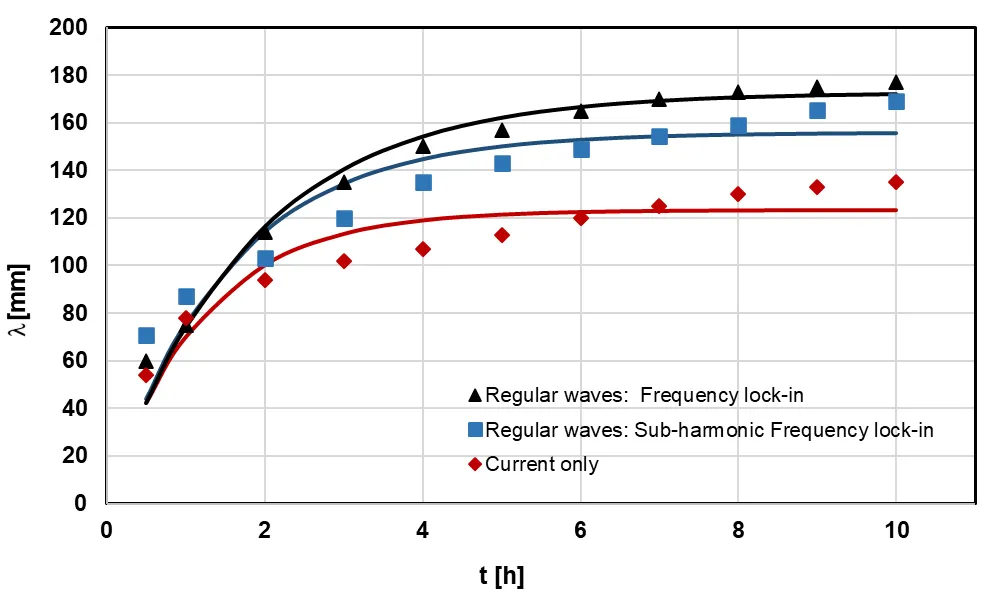
summarizes the temporal evolution of the ripple wavelength for all studied cases. It is found that the development path of bedform growth exhibits the same general trend regardless of the hydrodynamic conditions. Once the equilibrium stage is achieved, the temporal evolution shows a typical asymptotic increase, and the wavelength λ fluctuates around its equilibrium value. Non-linear fits for (a) Current only, (b) Regular waves: Sub-harmonic Frequency lock-in, and (c) Regular waves: Frequency lock-in are shown, respectively, by red, blue, and black lines. These correlations were obtained using
Equation (7)
where $$\lambda_{e q}$$ the equilibrium wavelength and
k (h
−1) the growth-rate constant.
. Time history of ripple wavelength for different flow conditions.
4. Theoretical Approach
This last part is devoted to modeling the impact of the cylinder on the sedimentary bottom. Let’s use the Swif-Hohenberg equation [
9], a dimensionless phenomenological equation used to describe pattern formation in various physical (Rayleigh-Benard convection), chemical, and biological systems [
15,
19,
20,
21]. It is given by:
where $$u$$ is the field variable, $$\vec{\nabla} = \vec{\mathrm{X} } \frac{\partial}{\partial \mathrm{X}} + \vec{\mathrm{Y} } \frac{\partial}{\partial \mathrm{Y}}$$, X, and Y are dimensionless distances in the horizontal plane,
T is dimensionless time, $$N \left(u\right) = q u^{2} - u^{3} $$ represents nonlinearity terms,
q is the coefficient for quadratic nonlinearity and $$\epsilon = \left( \theta - \theta_{c} \right) / \theta$$ the linear instability of the system. If
ε < 0, linear instability is absent, but Instability occurs if
ε > 0 This is confirmed by
, representing results from
Equation (9) for ε = 0.01 (
). The instability occurs for
q > 0 if the initial perturbations are sufficiently large. It is the so-called subcritical instability.
In our study, the system is anisotropic in the $$\left(\overset{\rightarrow}{\mathrm{X}} , \overset{\rightarrow}{\mathrm{Y}}\right)$$ plane, and in order to model sedimentary patterns in the context of unidirectional flow, the Swift-Hohenberg equation (
Equation (8)) must be modified to account for the instability of infinitesimal perturbations with wave numbers oriented along the X-direction.
where $$ k_{0} = \frac{2 \pi}{\lambda} $$ is the wave number depending on the wavelength $$\lambda$$ of the experimental patterns,
D is the cylinder diameter, and $$D_{y}$$ is a diffusion coefficient lateral, estimated from our experiments with the following equation:
where $$l $$ represents half of the lateral extension of the sand pattern in the Y direction at equilibrium, $$t_{∗}$$ is the characteristic time scale of the scour process at time
t and $$t_{e q}$$ is the time required to reach equilibrium. In this study, experiments are conducted in the subcritical regime (
ε < 0), where pattern formation occurs only in the cylinder’s wake. Velocity and pressure perturbations trigger instability due to quadratic nonlinearity, leading to this phenomenon. These perturbations are considered by adding a force
f (X, Y) representing the time-averaged pressure forces acting on the sand-water interface, which is added to the right-hand side of
Equation (9) [
21]:
. Theoretical results (Equation (9)) for $$\epsilon = 0 . 01 ; k_{0} D = 1 ; D_{y} = 1 ; q = 1 . 6 ; d t = 20$$.
Let’s compare the numerical results to those obtained experimentally, at the equilibrium state. The coefficient q is set to 1.6, and the diameter is considered to be unitary. Thus, the values that will be modified are $$k_{0} D$$ as well as $$D_{y}$$ the values of $$\lambda,$$
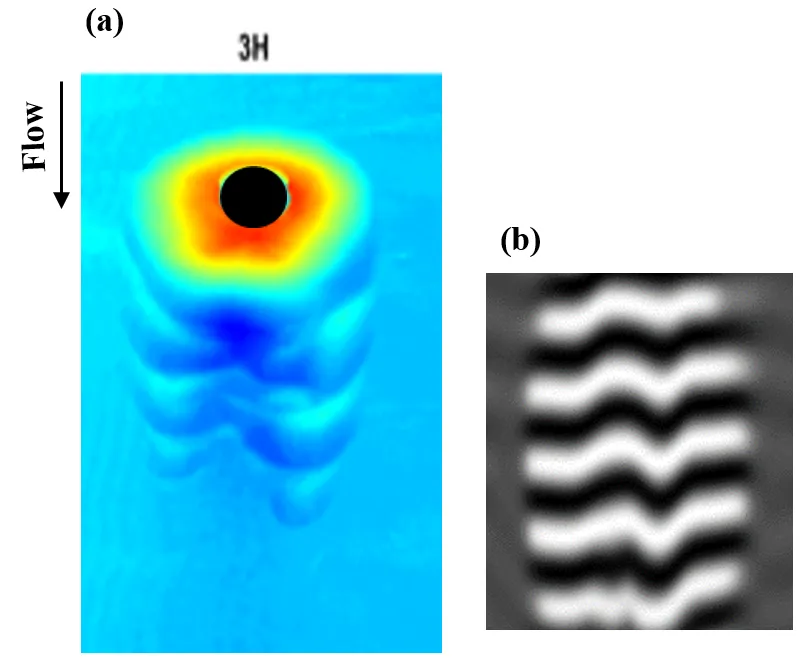
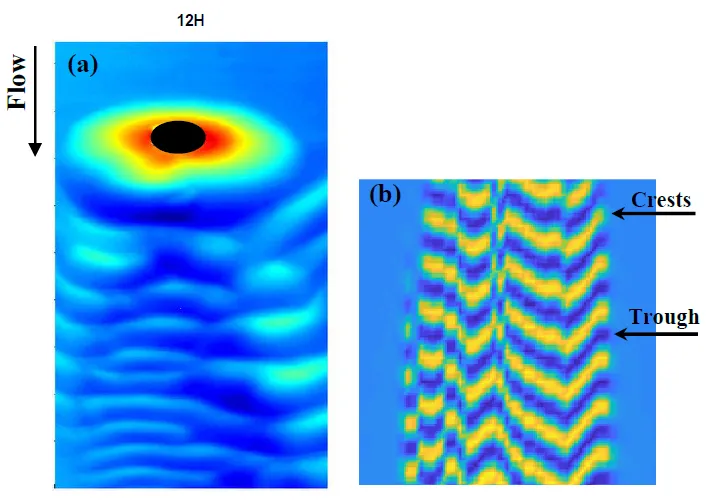
l, $$t_{*}$$, and $$t_{e q} $$ being obtained experimentally. The following figures present the results for the tests with parameters: $$\epsilon = - 0 . 175 ; k_{0} D = 0 . 5 ; D_{y} = 0 . 3 ; d t = 15$$ (
) and $$\epsilon = - 0 . 0089 ; k_{0} D = 0 . 75 ; D_{y} = 0 . 03 ; d t = 25$$ (
). A reasonable agreement is observed between the experimental and theoretical results (
and
).
. Comparison between (a) experimental results and (b) theoretical predictions (Equation (11)) after 3 h of experiment, with parameters: $$ \epsilon = - 0 . 175 ; k_{0} D = 0 . 5 ; D_{y} = 0 . 3 ; d t = 15$$.
. Comparison between (a) experimental results and (b) theoretical predictions (Equation (11)) at the equilibrium state, with parameters: $$\epsilon = - 0 . 0089 ; k_{0} D = 0 . 75 ; D_{y} = 0 . 03 ; d t = 25$$.
5. Conclusions
This paper presents an experimental and theoretical analysis of the formation of localized sand patterns around monopiles, representative of offshore wind turbine foundations, under the combined action of surface waves and current. In order to characterize the flow around a cylinder under the action of surface waves and current, tests carried out in a hydrodynamic flume depict the generation of patterns resulting from a subcritical instability of the water-sand interface. The tests were conducted for three different regimes: the current-only regime, the sub-harmonic frequency lock-in regime, and the harmonic frequency lock-in regime. After a flow duration of 9 h, the sediment transport is almost absent far from the vortex wake of the cylinder. In the sub-harmonic frequency lock-in regime, only minor modifications are observed. On the other hand, in the harmonic frequency lock-in regime, we observe that the bed becomes unstable, and ripples form around irregularities on the sediment surface behind the cylinder. The number of generated ripples increases with the flow duration. The present results show that the sand patterns generated downstream of a vertical cylinder in a subcritical regime can be numerically obtained using the Swift-Hohenberg dimensionless phenomenological equation [
9], by adding an experimental term taking into account the velocity fluctuations in the wake of the cylinder. The numerical model superimposes well with the results obtained experimentally.
To further understand the scour around monopiles, representative of offshore wind turbine foundations, we propose to experimentally study the impact of monopile vibration, soil densification, and subsidence on foundation scour.
Acknowledgments
The authors wish to thank the M2C UMR 6143 laboratory for providing research facilities.
Author Contributions
Conceptualization, N.A. and I.A.; Methodology, N.A.; Software, N.A. and Z.L.-A.; Validation, N.A.; Formal Analysis, R.M.; Investigation, N.A. and Z.L.-A.; Resources, N.A.; Data Curation, N.A.; Writing—Original Draft Preparation, N.A. and Z.L.-A.; Writing—Review & Editing, N.A. and R.M.; Visualization, N.A.; Supervision, N.A.; Project Administration, N.A.; Funding Acquisition, N.A.
Ethics Statement
Not applicable.
Informed Consent Statement
Not applicable.
Data Availability Statement
Data will be made available on request.
Funding
This research received no external funding.
Declaration of Competing Interest
The authors declare that they have no known competing financial interests or personal relationships that could have appeared to influence the work reported in this paper.
References
-
1.
Sumer BM, Fredsoe J. Scour around pile in combined waves and current.
J. Hydraul. Eng. 2001,
127, 403–411.
[Google Scholar]
-
2.
Chen HH. Experimental study of scour around monopile and jacket-type offshore wind turbine foundations.
J. Mar. Sci. Technol. 2019,
27, 2.
[Google Scholar]
-
3.
Larsen BE, Arbøll LK, Kristoffersen SF, Carstensen S, Fuhrman DR. Experimental study of tsunami-induced scour around a monopile foundation.
Coast. Eng. 2018,
138, 9–21.
[Google Scholar]
-
4.
Zhang Q, Tang G, Lu L, Yang F. Scour protections of collar around a monopile foundation in steady current.
Appl. Ocean. Res. 2021,
112, 102718.
[Google Scholar]
-
5.
Yang B, Wei K, Yang W, Li T, Qin B. A feasibility study of reducing scour around monopile foundation using a tidal current turbine.
Ocean. Eng. 2021,
220, 108396.
[Google Scholar]
-
6.
Qin B, Xie Y, Yang W, Qu R, Geng F. A further study on the scour around the monopile foundation of offshore wind turbines.
Sustain. Energy Technol. Assess. 2023,
57, 103198.
[Google Scholar]
-
7.
Gunnoo H, Abcha N, Mouazé D, Ezersky A, García-Hermosa MI. Laboratory simulation of resonance amplification of the hydrodynamic fields in the vicinity of wind farm masts. In Proceedings of the 1st International Conference on Renewable Energies Offshore, Lisbon, Portugal, 24–26 November 2014.
-
8.
Gunnoo H, Abcha N, Ezersky A. Frequency lock-in and phase synchronization of vortex shedding behind circular cylinder due to surface waves.
Phys. Lett. A 2016,
380, 863–868.
[Google Scholar]
-
9.
Swift J, Hohenberg PC. Hydrodynamic fluctuations at the convective instability.
Phys. Rev. A 1977,
15, 319.
[Google Scholar]
-
10.
Abroug I, Abcha N. Frequency and phase lock-in behind circular cylinder in the presence of random irregular waves.
Phys. Rev. Fluids 2022,
7, 064801.
[Google Scholar]
-
11.
Abroug I, Abcha N, Mejri F, Turki EI, Ojeda E. The Hydrodynamic Behavior of Vortex Shedding behind Circular Cylinder in the Presence of Group Focused Waves.
Fluids 2022,
7, 4.
[Google Scholar]
-
12.
Soulsby RL, Whitehouse RJS. Dynamics of Marine Sands; Thomas Telford Publishing: London, UK, 1997.
-
13.
Nielsen P. Coastal and Estuarine Processes; World Scientific Publishing Company: Singapore, 2009; Volume 29.
-
14.
Sleath JFA. Sea Bed Mechanics; Wiley: New York, NY,USA, 1984.
-
15.
Kozyreff G, Tlidi M. Nonvariational real Swift-Hohenberg equation for biological, chemical, and optical systems. Chaos: An Interdisciplinary.
J. Nonlinear Sci. 2007,
17, 037103.
[Google Scholar]
-
16.
Hartvig PT, Thomsen JM, Frigaard P, Andersen TL. Full Erratum for “Experimental study of the development of scour and backfilling”. In DCE Technical Memoranda No. 12; Department of Civil Engineering, Aalborg University: Aalborg, Denmark, 2011. ISSN 1901-7278
-
17.
Link O, Pfleger F, Zanke U. Characteristics of developing scour-holes at a sand-embedded cylinder.
Int. J. Sediment Res. 2008,
23, 258–266.
[Google Scholar]
-
18.
Umeda S, Yamazaki T, Ishida H. Time evolution of scour and deposition around a cylindrical pier in steady flow. In Proceedings of the International Conference on Scour and Erosion, Tokyo, Japan, 5–7 November 2008; pp. 5–7.
-
19.
Lloyd DJ, Sandstede B, Avitabile D, Champneys AR. Localized hexagon patterns of the planar Swift–Hohenberg equation.
SIAM J. Appl. Dyn.Syst. 2008,
7, 1049–1100.
[Google Scholar]
-
20.
M’F H, Métens S, Borckmans P, Dewel G. Pattern selection in the generalized Swift-Hohenberg model.
Phys. Rev. E 1995,
51, 2046.
[Google Scholar]
-
21.
Auzerais A, Jarno A, Ezersky A, Marin F. Formation of localized sand patterns downstream from a vertical cylinder under steady flows: Experimental and theoretical study.
Phys. Rev. E 2016,
94, 052903.
[Google Scholar]