Ocean wave energy is a clean and renewable resource with vast exploitable potential. Characterized by broad spatial distribution and long effective operational periods [
1], the global theoretical reserve of wave energy is estimated to be between 8000 and 80,000 TWh [
2]. The power density of wave energy converters (WECs) can reach 2–3 kW/m2, surpassing that of solar and wind energy systems [
2], making it a highly promising area for future development.
To harness this energy, researchers worldwide have developed various types of WECs, such as oscillating water columns [
3], point absorbers [
4], overtopping devices [
5], and hybrid systems [
6]. For instance, Sheng et al. [
7] developed a large-scale, eagle-shaped floating WEC with a total system efficiency exceeding 20% under design wave conditions. Zhang et al. [
8] introduced a hybrid point absorber that demonstrated improved energy conversion performance.
The eccentric rotating wave energy converter (ERWEC) employs a fully enclosed floating structure [
9], housing the power take-off (PTO) system within the hull to prevent corrosion and biofouling, thereby enhancing reliability and service life. Based on this concept, the Finnish company Wello developed the “Penguin” ERWEC in 2014, which underwent long-term sea trials at the European Marine Energy Centre (EMEC) [
10]. In 2020, Zhang et al. [
11] proposed an eccentric pendulum-type WEC and conducted hydrodynamic analyses, identifying the influence of pendulum mass and load damping on energy capture efficiency. Chai et al. [
12] integrated a pendulum-type WEC into an ocean monitoring buoy for multifunctional marine applications.
In terms of floater motion response, Jahangir et al. [
13] identified the role of synchronized excitation and time-varying damping in generating irregular displacements under regular wave conditions. Tya et al. [
14] found that wave-induced pressure was greater on the leeward side of the floater bottom, which is critical for structural reliability design. Homayoun et al. [
15] observed that inward-curved floaters captured more energy in a monopile-based offshore wind-WEC hybrid. Li et al. [
16] demonstrated that pitch resonance in hinged dual-floater WECs depended on floater radius and draft, with floater length affecting the phase difference in pitch motion. Zang et al. [
17] showed that reduced incident wave height or increased PTO damping amplified nonlinearity in motion response. Capture width under irregular waves was 5–40% higher than under regular waves, and sharp-bottomed floaters suffered greater viscous losses. Liu et al. [
18] studied a hybrid point absorber and found that shorter wave periods intensified wave-structure interaction, with phase differences between floaters depending on spacing.
Regarding the ERWEC’s mooring and motion response, Boren et al. [
19] analyzed the influence of mooring line number, wave direction, pendulum mass, and load torque on average power output, identifying torque as the most critical factor. Chen et al. [
20] reported that hydrodynamic damping is essential to ERWEC performance, with shorter natural motion periods enhancing power output while excessive damping reduced efficiency. In further studies, Chen et al. [
21] found that cylindrical floaters experienced greater wave excitation forces than hemispherical ones for the same submerged area, with greater improvements in RAO, wave force, and efficiency as area increased. Duan et al. [
22] employed frequency- and time-domain analyses to study the influence of floater diameter on RAO and instantaneous capture power of spherical-body WECs (SBWEC), deriving an average conversion efficiency of up to 54.44% in low-energy sea states, offering useful reference for evaluating ERWEC performance.
Despite these advances, a clear research gap remains: most ERWECs are based on large-volume, monolithic floaters with limited adaptability to mild wave environments such as semi-enclosed seas or nearshore regions. Furthermore, their structural and dynamic complexity often leads to reduced efficiency under low wave conditions. To address this gap, the present study proposes a novel ERWEC, featuring a pair of semi-ellipsoidal floaters and an internal eccentric rotor connected to a hydraulic PTO system. The design allows for compact form factors and a more sensitive response to moderate wave excitation, making it potentially more suitable for deployment in low-energy sea states.
Previous hydrodynamic studies on floater configurations offer a critical understanding of added mass, damping, excitation forces, and resonance behavior-factors that influence the motion and efficiency of devices such as the ERWEC. Likewise, the influence of mooring systems, damping control, and floater geometry in ERWECs provides important guidance for evaluating the proposed design.
In this study, the hydrodynamic performance and energy capture characteristics of the ERWEC are analyzed through both frequency-domain and time-domain simulations, supported by experimental validation. The results aim to clarify the dynamic response behavior and power generation potential of the proposed system, particularly under low to moderate wave conditions, offering insight into its viability for broader application in coastal or nearshore wave energy development.
2.1. Summary of the Specified Model
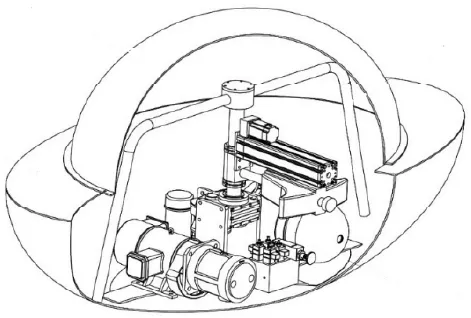
This study investigates a floating WEC incorporating an internal eccentric rotor, as shown in . The device was proposed by Xue and Liu et al. from Shandong University [
10,
23,
24]. The device consists of three main subsystems: a floating platform that captures wave-induced motion, an internal rotor that converts this motion into rotational energy, and a hydraulic PTO system for energy extraction. The rotor is housed within a sealed enclosure formed by upper and lower casings, effectively isolating critical components from seawater corrosion. The hydraulic PTO is mounted within a central frame, and its installation height is adjusted to lower the system’s center of gravity, thereby improving stability. The WEC operates based on gravity-induced rotational dynamics. When subjected to wave excitation, the floating structure undergoes oscillatory motion, causing the internal rotor to shift from its equilibrium position. Gravitational torque then induces rotation around the rotor axis, which in turn drives the hydraulic PTO to produce electricity.
. Sketch of the floating inner rotor WEC.
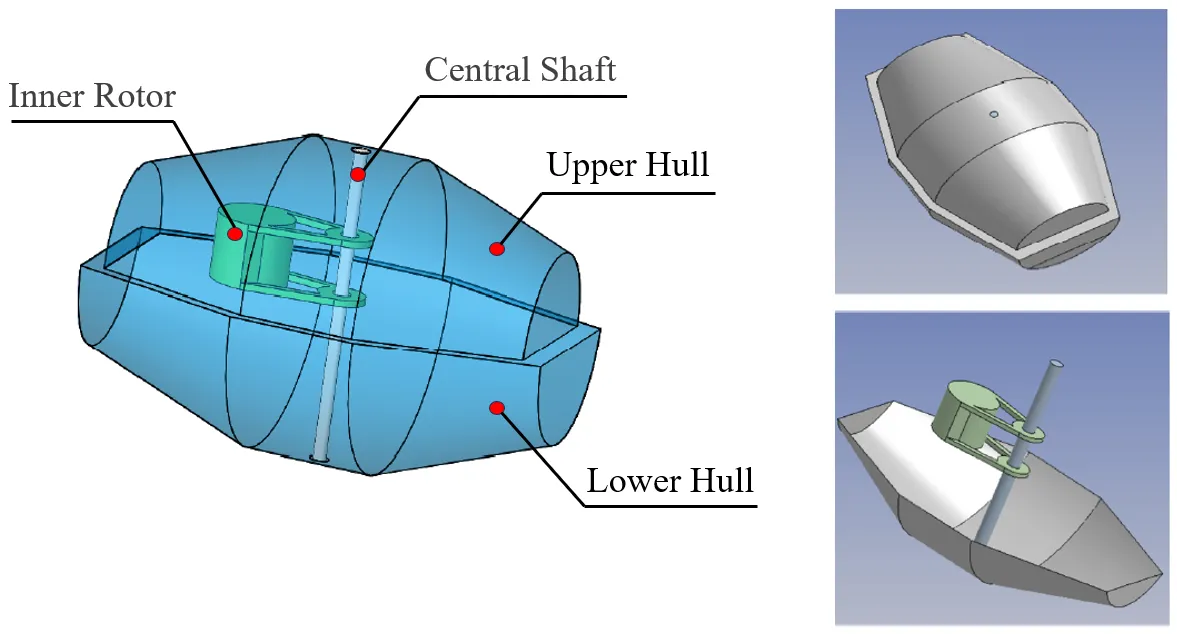
To assess the hydrodynamic and energy capture performance, a numerical model of the proposed device was developed using ANSYS AQWA. shows the numerical model built in ANSYS AQWA. The model is based on a 1:5 geometric scale of the physical prototype. Due to AQWA’s coupling limitations (maximum of three bodies), the floating platform was simplified to an ellipsoidal geometry. The internal rotor was modeled as a single degree-of-freedom rotational body hinged to the central shaft, with energy extraction represented by a linear damping coefficient corresponding to the PTO resistance. A time-domain analysis was carried out using the established numerical model to simulate the device’s dynamic response under various regular wave conditions. A three-point taut mooring system was implemented in the model, maintaining geometric and tension similarity with the experimental setup.
. Numerical model developed in ANSYS AQWA.
Using AQWA potential flow theory to calculate the interaction between waves and floating structures, in a homogeneous and incompressible flow field, the continuity equation and Euler’s equations of motion can be rewritten using vector relationships [
25].
Under the assumption of small amplitude waves, the kinematic and dynamic boundary conditions at the free surface can be linearized and transferred to the still water plane
z = 0 using a Taylor series expansion. This simplification leads to the basic equations and boundary conditions for two-dimensional linear wave motion. Using the small-amplitude wave theory, the wave surface equation can be written as:
The total velocity potential in the flow field can be considered as the superposition of the incident wave potential, the diffraction potential, and the radiation potential. The incident wave potential is the velocity potential of the incoming wave without considering the presence of the object. The diffraction potential represents the disturbance caused by the object to the flow field when the object is stationary. The radiation potential represents the disturbance caused by the object to the flow field when the object is moving and the flow field is initially at rest. The first-order incident wave potential equation can be expressed as:
The primary loads acting on marine floating structures are first-order wave forces. One is the Froude-Krylov force due to the incident wave unaffected by the structure, and the other is the diffraction force caused by the structure itself. To calculate the first-order wave forces acting on a floating structure, the Bernoulli equation is applied over the wetted surface of the structure. The total wave force and moment can be obtained by integrating the pressure distribution over the wetted surface area.
where:
s is the area of the wetted surface of the object;
n is the normal vector to the object’s surface;
r is the position vector from a certain point on the surface to the center of rotation;$$F = F e^{i \omega t}$$ is a function of time
t.
The radiation wave force can be expressed as:
where: $$\bar{\xi_{i}} \overset{. .}{x}$$ is the acceleration of the
i-th mode; $$\bar{\xi_{i}} \overset{.}{x}$$ is the velocity of the
i-th mode; $$\lambda_{j i}$$ is the added mass coefficient; $$\mu_{j i}$$ is the added damping coefficient.
The total energy of ocean waves consists of both kinetic and potential components. The kinetic energy arises from the motion of individual water particles, while the potential energy results from their vertical displacement from the mean water level. For small-amplitude waves, the total energy per unit surface area is expressed as:
where
Ek and
Ep denote the wave’s kinetic and potential energy, respectively,
H is the wave height, and
Lw is the wavelength. The corresponding wave energy flux, or wave power per unit crest length, is given by:
where
ω is the circular frequency,
k is the wave number,
d is the water depth, and for floating bodies, the incident wave power
Pl within the crest line width is:
Wave energy is absorbed by the oscillating float and subsequently transmitted to the generator via a hydraulic PTO system. The interaction between the float and the hydraulic PTO introduces an equivalent load-damping effect on the float’s motion. The average output power of such an articulated wave energy converter is given by:
where
Tc represents the output torque (in N·m), induced by the load damping at the hinge, while
n denotes the relative angular velocity (in r/min) of the float rotating about the hinge point. Substituting the time-averaged values of these quantities into the equation yields the average electrical output power.
3.1. Wave Tank Setup and Test Conditions
Wave tank experiments were conducted to validate the numerical model. The physical experiment was conducted in the wave tank of Qingdao Marine Inspection & Testing Group Co., Ltd., Qingdao, China. The experiment was conducted by Xue et al. from Shandong University [
10,
23,
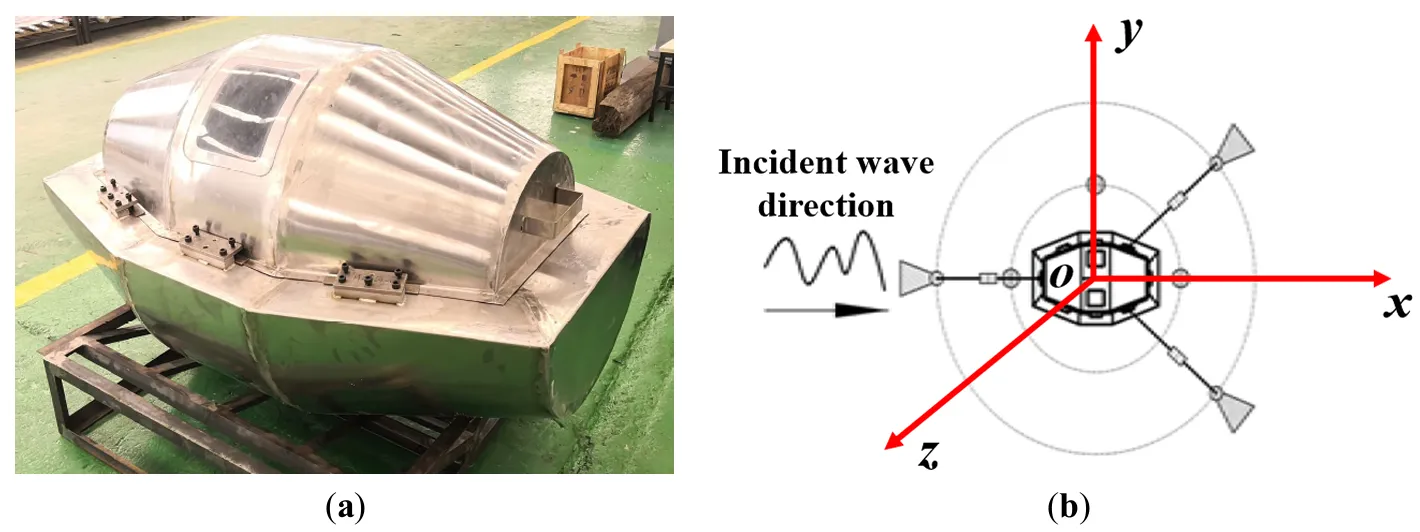
24]. The wave tank is rectangular, with a length of 30 m, a width of 4 m, and a depth of 3.5 m. Waves were generated using a low-inertia motor-driven wave paddle, capable of producing regular waves with heights ranging from 0.02 m to 1.0 m and periods between 1.5 s and 3.0 s. The physical prototype, shown in a, scaled at 1:5, has dimensions of 1.5 m (length) × 1.0 m (width) × 0.86 m (height) and a total mass of 210 kg. The draft of the floating body is 320 mm, with the center of buoyancy located 110 mm below the waterline and the center of gravity 60 mm above it. The device was moored using a three-point taut Kevlar rope system, with one end of each line fixed to the prototype and the other anchored to dead weights, as shown in b.
Experiments were performed under regular wave conditions with varying wave heights and periods. The WEC model was positioned 10 m away from the wave paddle in the wave propagation direction. To monitor the incident and transmitted waves, two wave gauges were placed 1 m upstream and downstream of the model along the wave direction, respectively, while another wave gauge was placed perpendicular to the wave direction to capture lateral wave variations. The sampling frequency of the wave gauges was set at 50 Hz. The motion response of the floating model was recorded using an onboard attitude sensor. The electrical output was monitored through a voltage module and a resistive load module. A tension sensor was installed on the mooring line to measure dynamic mooring forces. Furthermore, a pressure transducer and a flowmeter were used to capture the performance of the hydraulic PTO system. This setup allowed for a comprehensive evaluation of both hydrodynamic responses and energy capture characteristics under controlled wave conditions. The entire testing process was video-recorded for supplementary analysis. To ensure dynamic similarity between the numerical simulations and the physical experiments, a geometric scale ratio of 1:5 was adopted. Accordingly, the wave heights used in the numerical simulations were five times larger than those in the experimental tests. Based on Froude scaling, the corresponding time scale ratio is √5, which is approximately 2.24. All wave parameters in the numerical model were adjusted in accordance with this scaling to ensure consistency in hydrodynamic behavior and energy capture characteristics across both approaches. Details of the test conditions and wave parameters are provided in .
. Experiment setup. (<b>a</b>) The physical prototype [
23] (<b>b</b>) Mooring type (top view) [
10].
.
Comparison of numerical and experimental wave parameters.
| Regular Wave Cases |
Case 1 |
Case 2 |
Case 3 |
Case 4 |
| Numerical model |
H = 1 m, T = 4.25 s |
H = 1.5 m, T = 4.47 s |
H = 2 m, T = 4.7 s |
H = 2.5 m, T = 4.92 s |
| Experimental model [23] |
H = 0.2 m, T = 1.9 s |
H = 0.3 m, T = 2 s |
H = 0.4 m, T = 2.1 s |
H = 0.5 m, T = 2.2 s |
3.2. Validation of Numerical Model
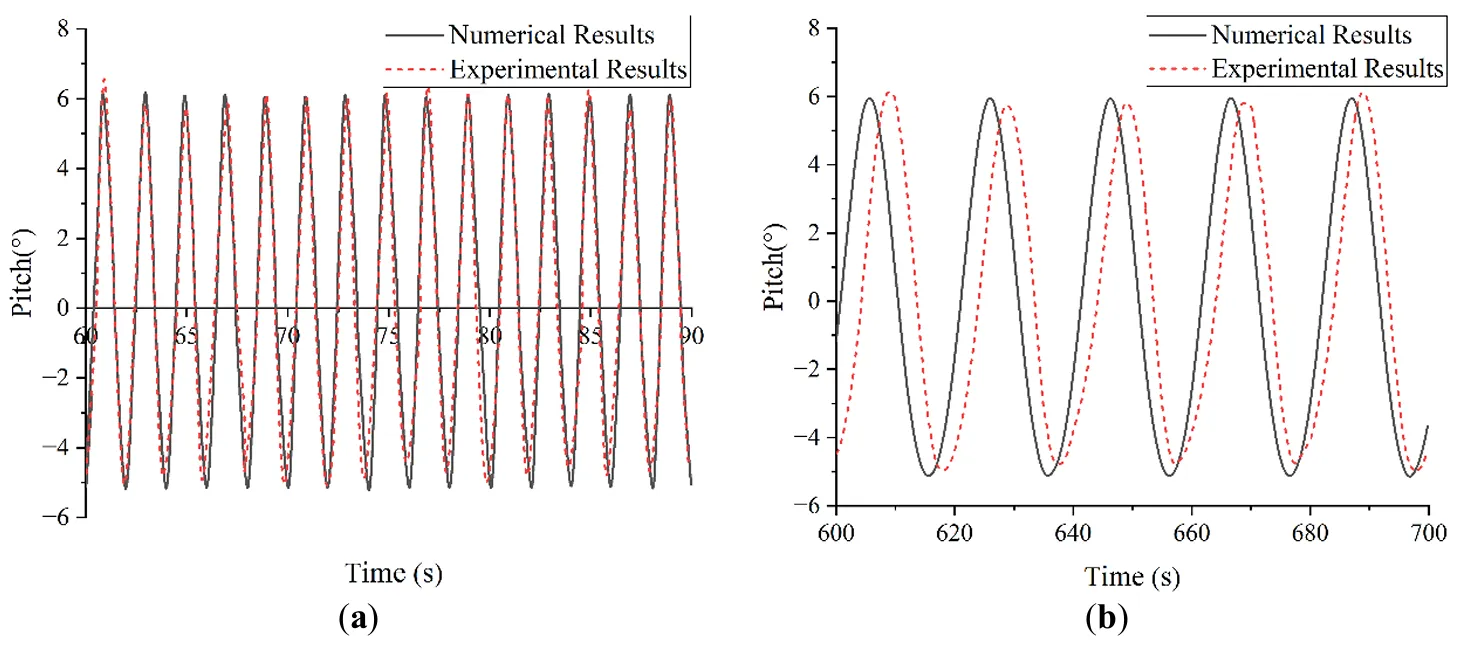
The numerical simulations were conducted using the same wave parameters as in the physical tests. To validate the numerical model, a comparison was conducted between the simulated and experimental pitch motion of the WEC under the experimental wave condition of
H = 0.3 m and
T = 1.5 s. As shown in a, the time histories of the pitch response from both the numerical simulation (solid line) and physical experiment (dashed line) are in good agreement in terms of amplitude and waveform. The numerical simulation results are slightly overestimated, primarily because AQWA is a potential flow solver that neglects viscous effects. Additionally, Stokes’s second-order wave theory was employed in the ANSYS Workbench simulations, which may contribute to the overprediction. Nevertheless, the deviation remains within an acceptable range, and the results provide a reliable basis for subsequent hydrodynamic analysis and energy capture efficiency evaluation.
In addition, a comparative analysis of the pitch motion response under regular wave Case 3 was performed. As shown in b, the time-history comparison indicates that the numerical model captures the general dynamic behavior of the device. A slight phase shift is observed between the two curves, which may result from the following factors: (1) minor differences in the initial conditions of the simulation and the physical test; (2) response lag of the motion sensors; and (3) synchronization delay in the data acquisition system. These effects are commonly encountered in experimental validation of wave energy devices and do not significantly affect the overall agreement. Therefore, although minor discrepancies exist, particularly in transient phases, the peak values and amplitudes show strong agreement. This confirms the validity of the numerical model and its applicability for subsequent design and optimization tasks.
. Comparison of motion response between numerical model and experimental test. (<b>a</b>) Comparison in Case 2 (<b>b</b>) Comparison in Case 3.
4.1. Effect of Main Float Cross-Sectional Geometry
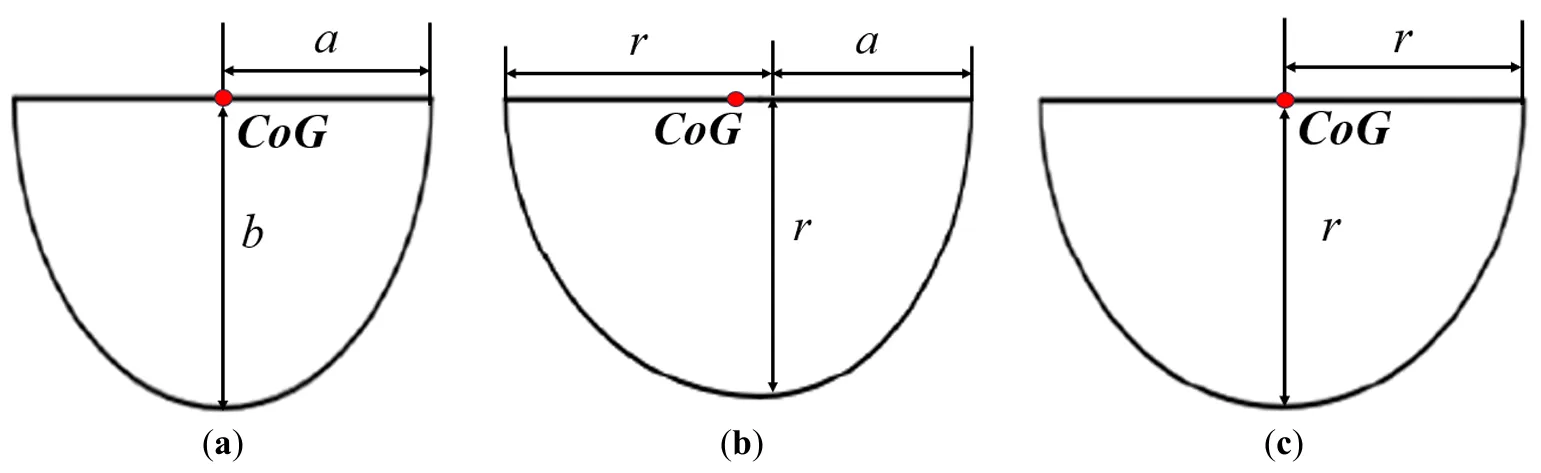
This section investigates the influence of main float cross-sectional geometry on the hydrodynamic behavior and energy capture performance of a floating inner-rotor WEC. The converter features a curved fore and aft structure designed to minimize vortex shedding and enhance energy absorption efficiency. Three distinct cross-sectional configurations of the main float were considered: ellipse type, ellipse-circle (asymmetric) type, and circle type, as illustrated in . While the elliptical and circular models exhibit symmetric geometry, the elliptical-circular model introduces asymmetry, which is hypothesized to improve wave energy capture. The structural dimensions for each configuration are summarized in , and the geometric and mass properties of the internal components—such as the hull, central shaft, and inner rotor—are listed in .
To evaluate the hydrodynamic behavior, frequency-domain simulations were conducted using numerical models that replicate the physical characteristics and mooring layout of the device. The added mass, radiation damping, response amplitude operator (RAO), and wave excitation forces were analyzed across a range of wave frequencies for pitch, roll, and yaw motions.
. Three types of cross-section. (<b>a</b>) Ellipse type (<b>b</b>) Ellipse-circle type (c) Circle type.
.
Design structural dimensions for three configurations.
| Parameters |
Model a |
Model b |
Model c |
| Cross section type |
Ellipse |
Ellipse-circle |
Circle |
| Length (m) |
7.5 |
7.5 |
7.5 |
| Width (m) |
6 |
5.5 |
5 |
| Height (m) |
3 |
2.5 |
2.5 |
| Draft depth (m) |
1.6 |
1.6 |
1.6 |
.
Desigin parameters of geometric and mass properties of the internal components.
| Model Structures |
Hull |
Central Shaft |
Inner Rotor |
| Mass (kg) |
27,625 |
116 |
4600 |
| Center of gravity (m) |
(0, 0.16, 0.73) |
(0, 0, 0) |
(1.39, 0, 1.2) |
| moment of inertia (kg·m2) |
(100,192, 155,471, 147,038) |
(295, 295, 1) |
(7558, 17,074, 10,498) |
,
,
and
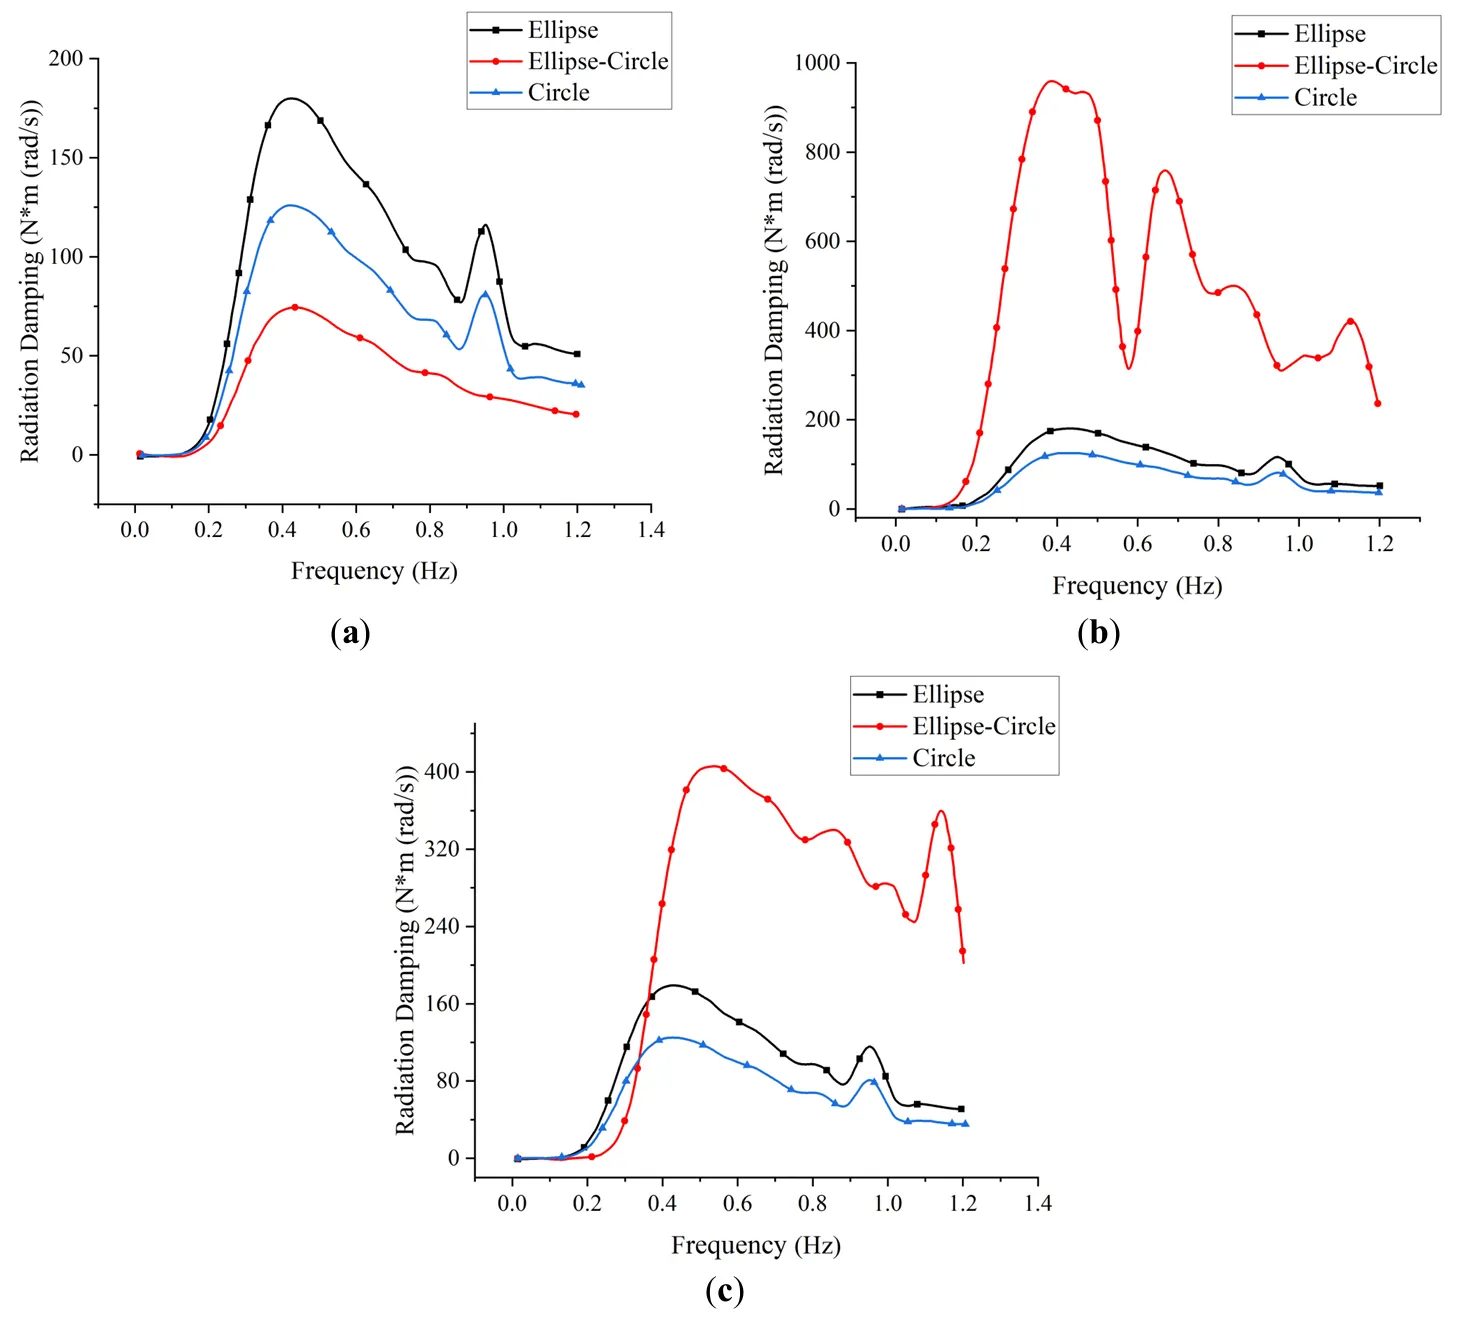
display the frequency-dependent hydrodynamic coefficients for the three models. The radiation damping (
) exhibits a general trend of increasing and then decreasing with frequency, peaking near 0.4 Hz. In the pitch direction, the symmetric elliptical and circular models show higher damping compared to the asymmetric elliptical-circular model. All three shapes reach peak damping within the 0.3–0.5 Hz range. In the roll direction, the elliptical-circular model demonstrates significantly higher damping, particularly at higher frequencies, indicating enhanced wave interaction due to geometric asymmetry. Yaw damping trends mirror those in roll, though the peak values are notably smaller.
. Variations of radiation damping in three directions for different cross sections. (<b>a</b>) Pitch (<b>b</b>) Roll (<b>c</b>) Yaw.
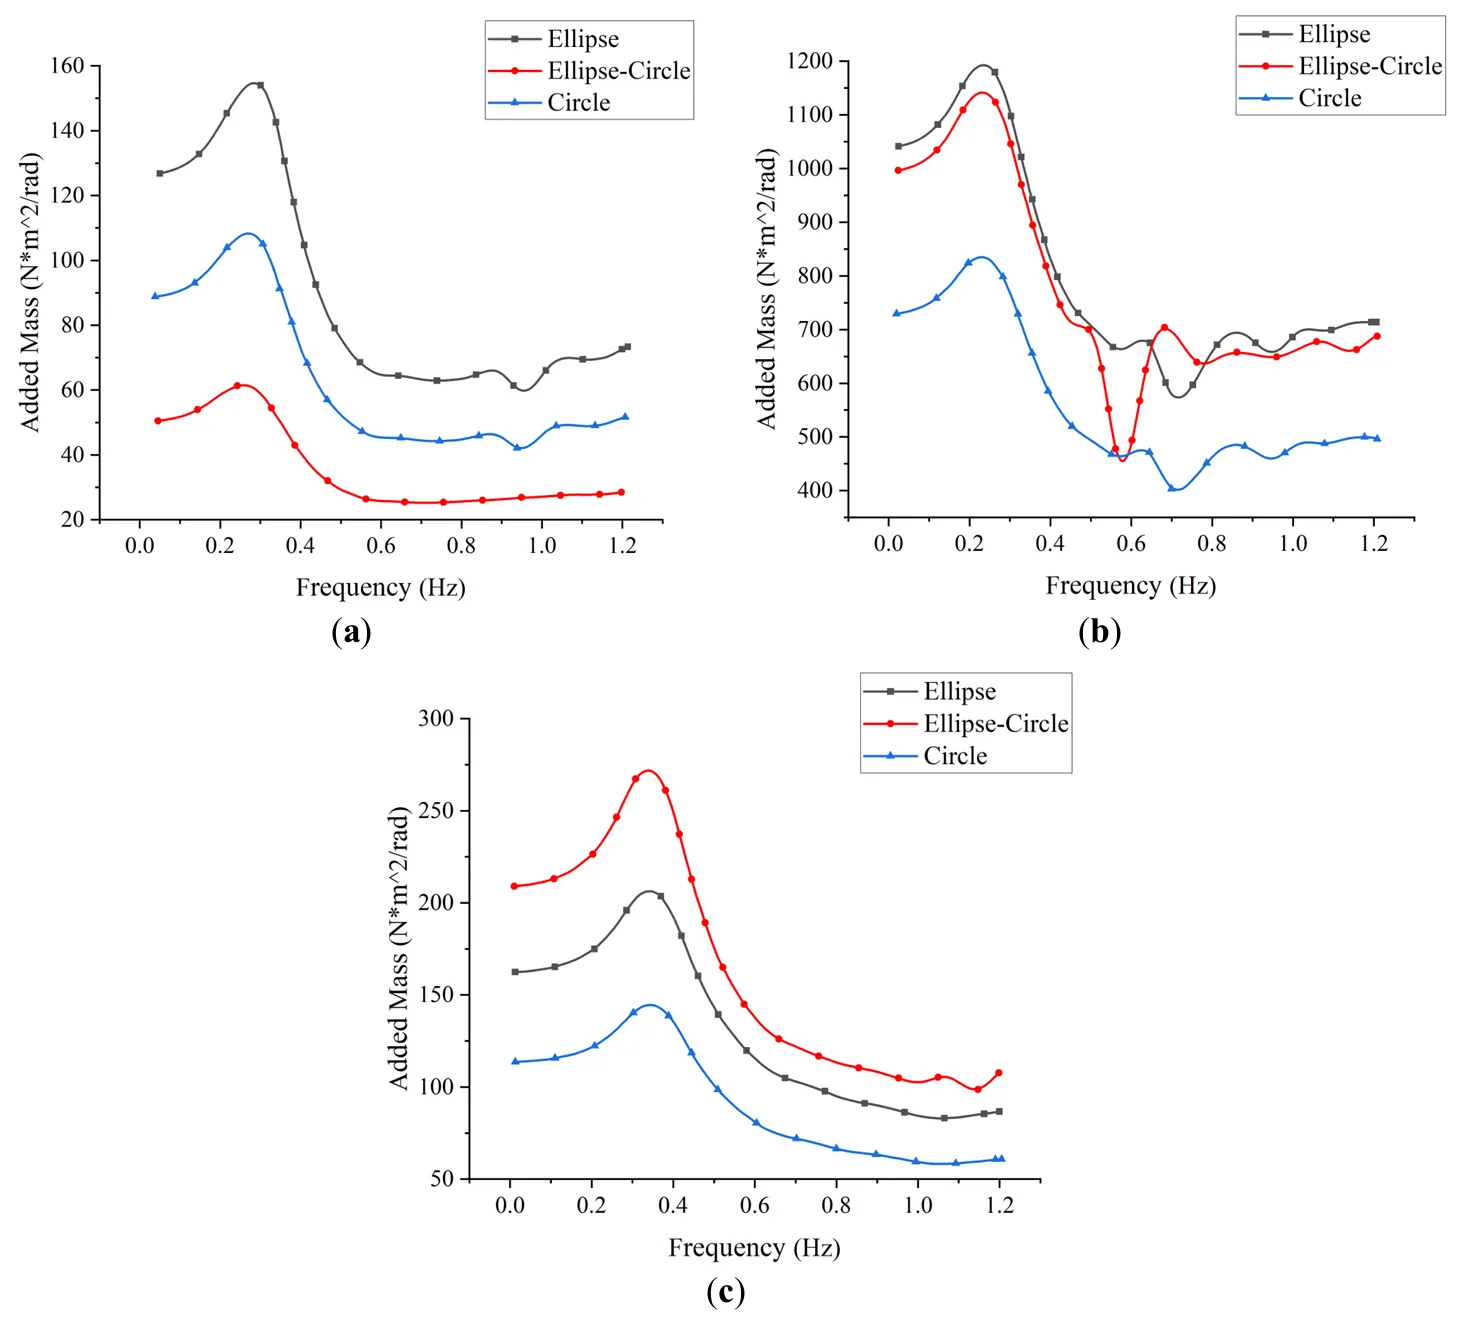
The added mass results (
) follow a similar trend, with peak values observed near 0.3 Hz. The symmetric configurations yield higher added mass in the pitch direction, while in roll, the elliptical-circular and elliptical shapes perform comparably. In yaw, the elliptical-circular model shows the greatest amplitude, peaking at 0.3–0.4 Hz, though absolute values remain modest.
. Variations of added mass in three directions for different cross sections. (<b>a</b>) Pitch (<b>b</b>) Roll (<b>c</b>) Yaw.
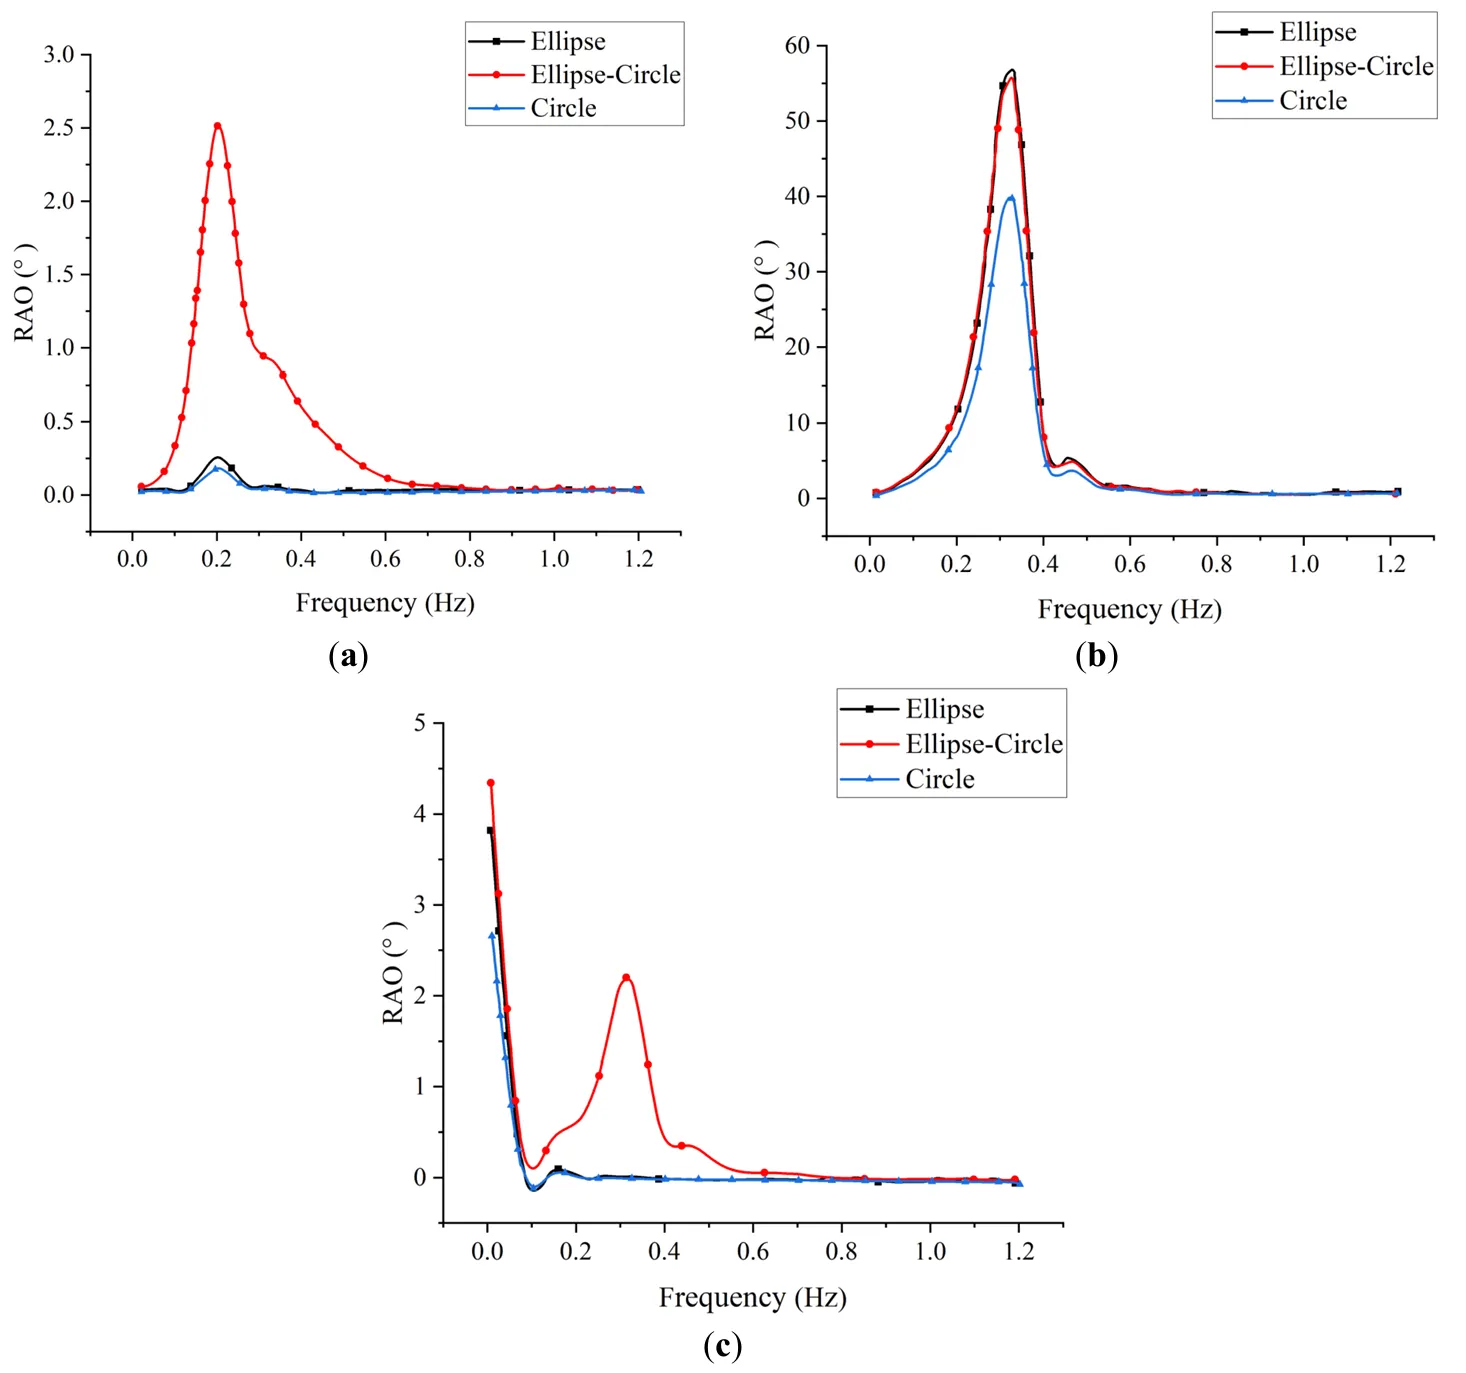
RAO curves (
) indicate that the elliptical-circular shape consistently achieves the highest response amplitudes, particularly in pitch, with peaks occurring around 0.3 Hz. Although symmetric models demonstrate similar RAOs in roll and yaw, the asymmetric design amplifies responses at low frequencies (0.2–0.4 Hz), suggesting improved resonance with incoming wave energy. At higher frequencies, RAOs for all models converge, indicating diminished shape influence.
. Variations of RAO in three directions for different cross sections. (<b>a</b>) Pitch (<b>b</b>) Roll (<b>c</b>) Yaw.
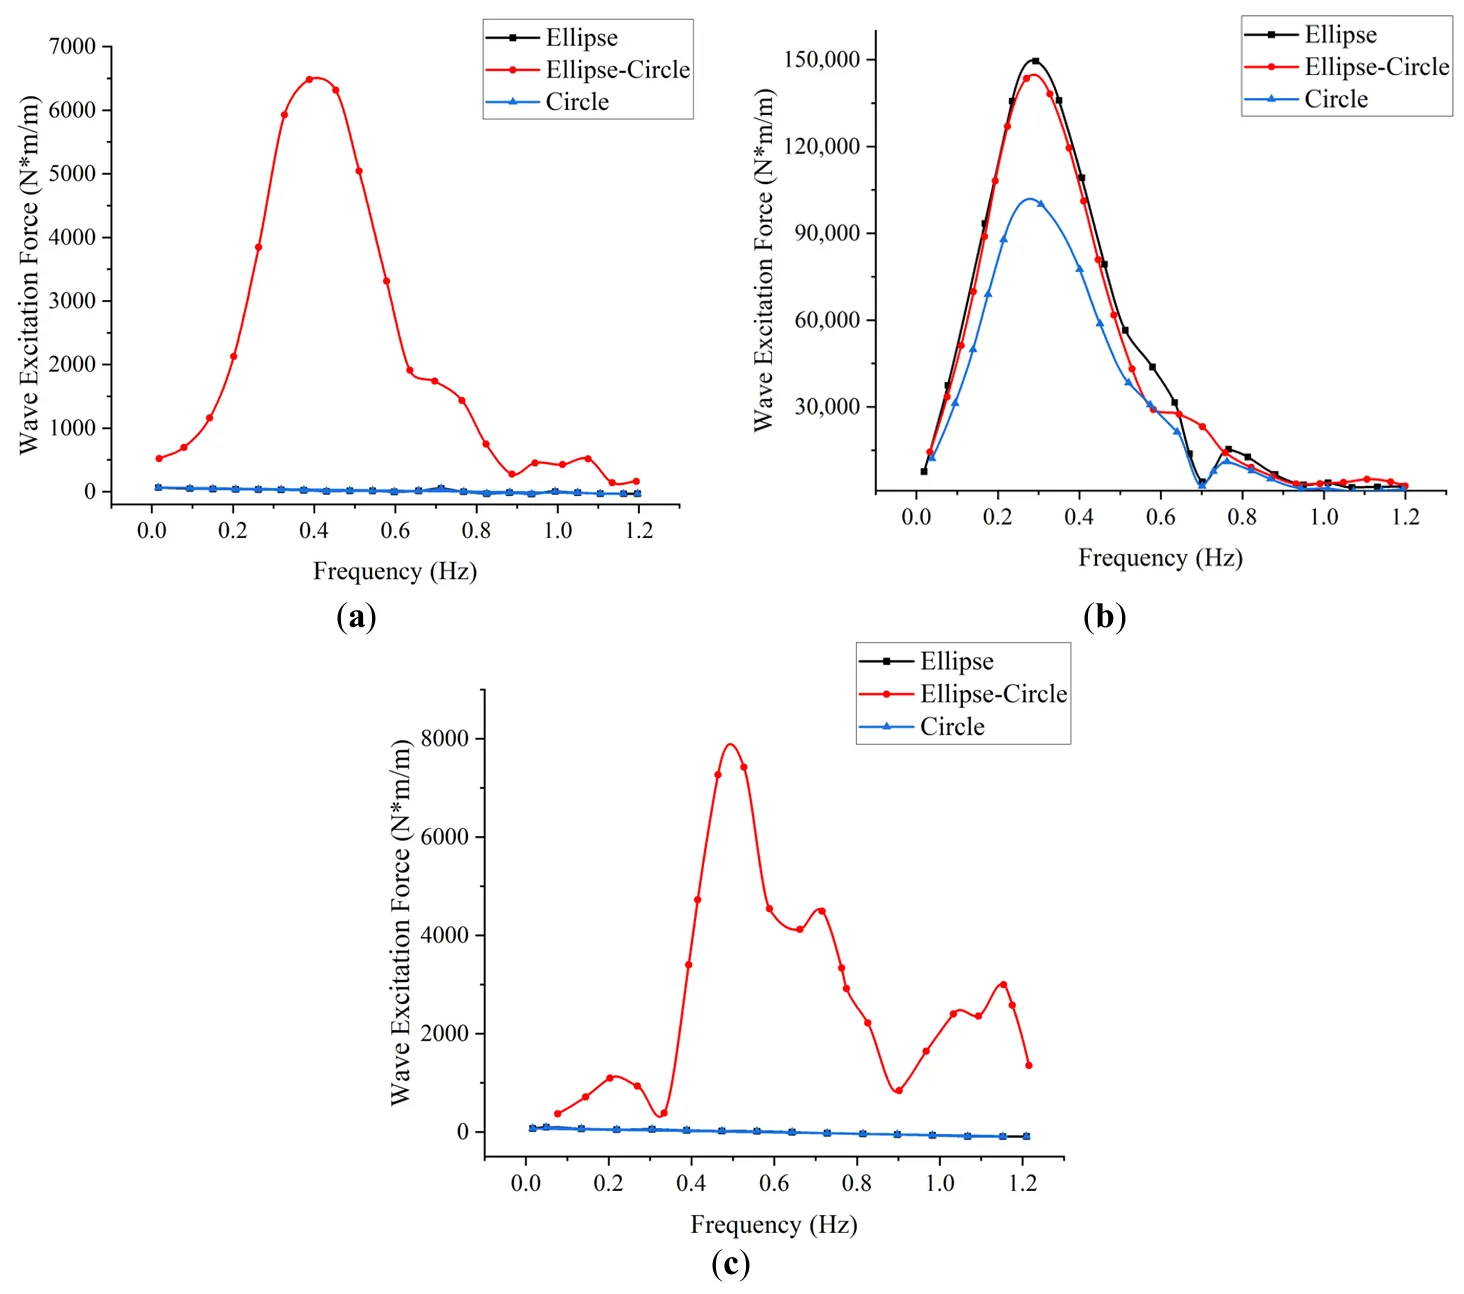
Wave excitation forces (
) further support the superiority of the elliptical-circular configuration. In pitch and yaw, this model experiences significantly larger excitation forces, with peak values around 0.4 Hz and 0.5 Hz, respectively. In roll, the asymmetric and elliptical models exhibit similar performance, with the circular model consistently underperforming.
. Variations of wave excitation forces in three directions for different cross sections. (<b>a</b>) Pitch (<b>b</b>) Roll (<b>c</b>) Yaw.
These results reveal that each hydrodynamic coefficient attains a maximum at specific wave frequencies. Overall, the asymmetric elliptical-circular configuration consistently yields the highest coefficients, confirming its enhanced capability for wave energy absorption. Notably, the most pronounced wave-structure interactions occur in the low-frequency band (0.2–0.4 Hz), which aligns well with typical ocean wave spectra, making this configuration particularly suitable for real-sea applications.
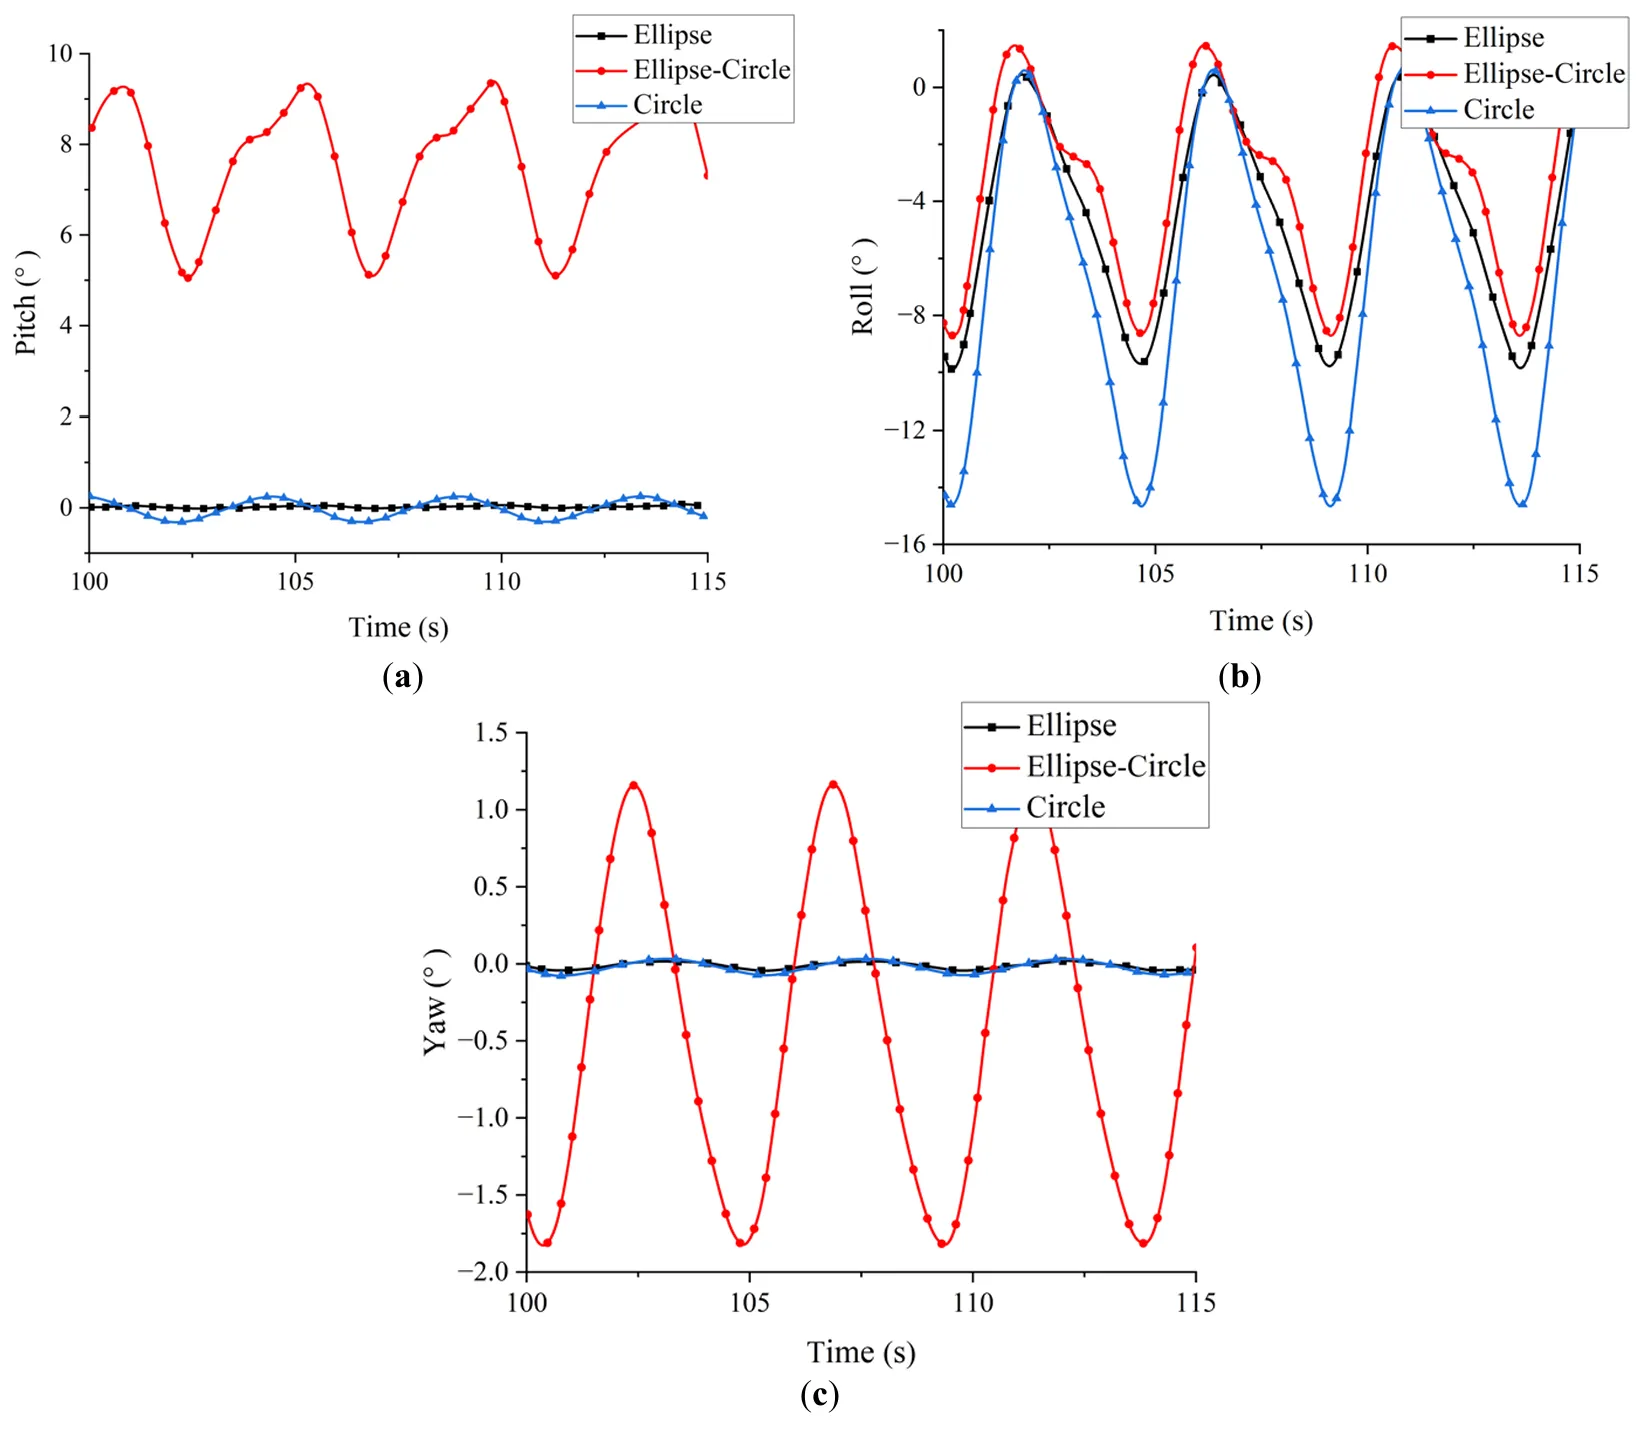
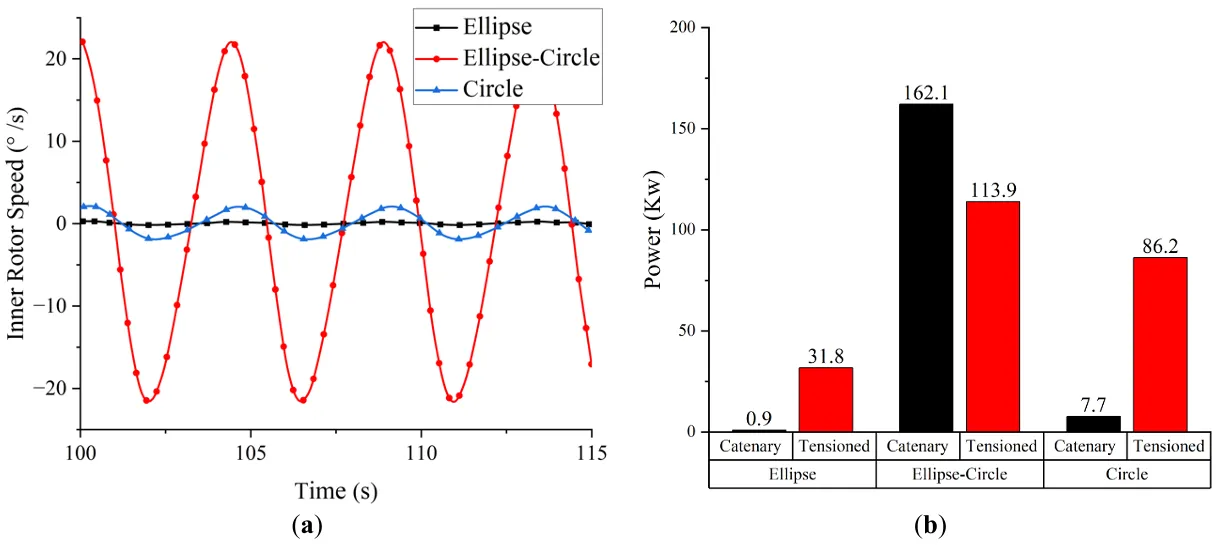
To further explore the effect of float shape on energy capture, time-domain simulations were performed under regular wave conditions. The wave height was set to 2.0 m, and the wave period was 4.47 s. A linear PTO damping coefficient of 200 N·s·m/rad was used, and two mooring strategies-catenary and taut-line-were applied. The motion responses and energy conversion characteristics of the different float shapes are presented in and . As shown in , float geometry significantly affects the WEC’s motion response. In pitch, the elliptical-circular model achieves a peak angular displacement of approximately 5°, while the elliptical and circular models remain below 1°. In roll, the elliptical-circular and elliptical shapes produce similar amplitudes (~10°), with the circular model slightly exceeding both. In yaw, the elliptical-circular configuration again exhibits the largest amplitude (~2.5°), with the other two under 1°. illustrates the variation of inner rotor angular velocity over time and compares the corresponding power output under different mooring systems. The asymmetric elliptical-circular model yields a significantly higher rotor speed, peaking at 44°/s, compared to the symmetric configurations. This enhancement translates into substantially greater power output, affirming the design’s improved capacity for converting wave motion into rotational energy.
. Comparison of motion histories in three directions for different cross sections. (<b>a</b>) Pitch (<b>b</b>) Roll (<b>c</b>) Yaw.
. Comparison of inner rotor velocity and energy capture power for different cross sections. (<b>a</b>) Inner rotor velocity (<b>b</b>) Energy capture power.
This section examines the impact of draft depth on the hydrodynamic performance of the floating inner-rotor wave energy converter. The analysis focuses on the elliptical–circular configuration of the irregular main float, identified in the previous section as the optimal design. Three draft depths were considered: 1.0 m, 1.6 m, and 2.2 m. All other design and environmental parameters were held constant throughout the simulations.
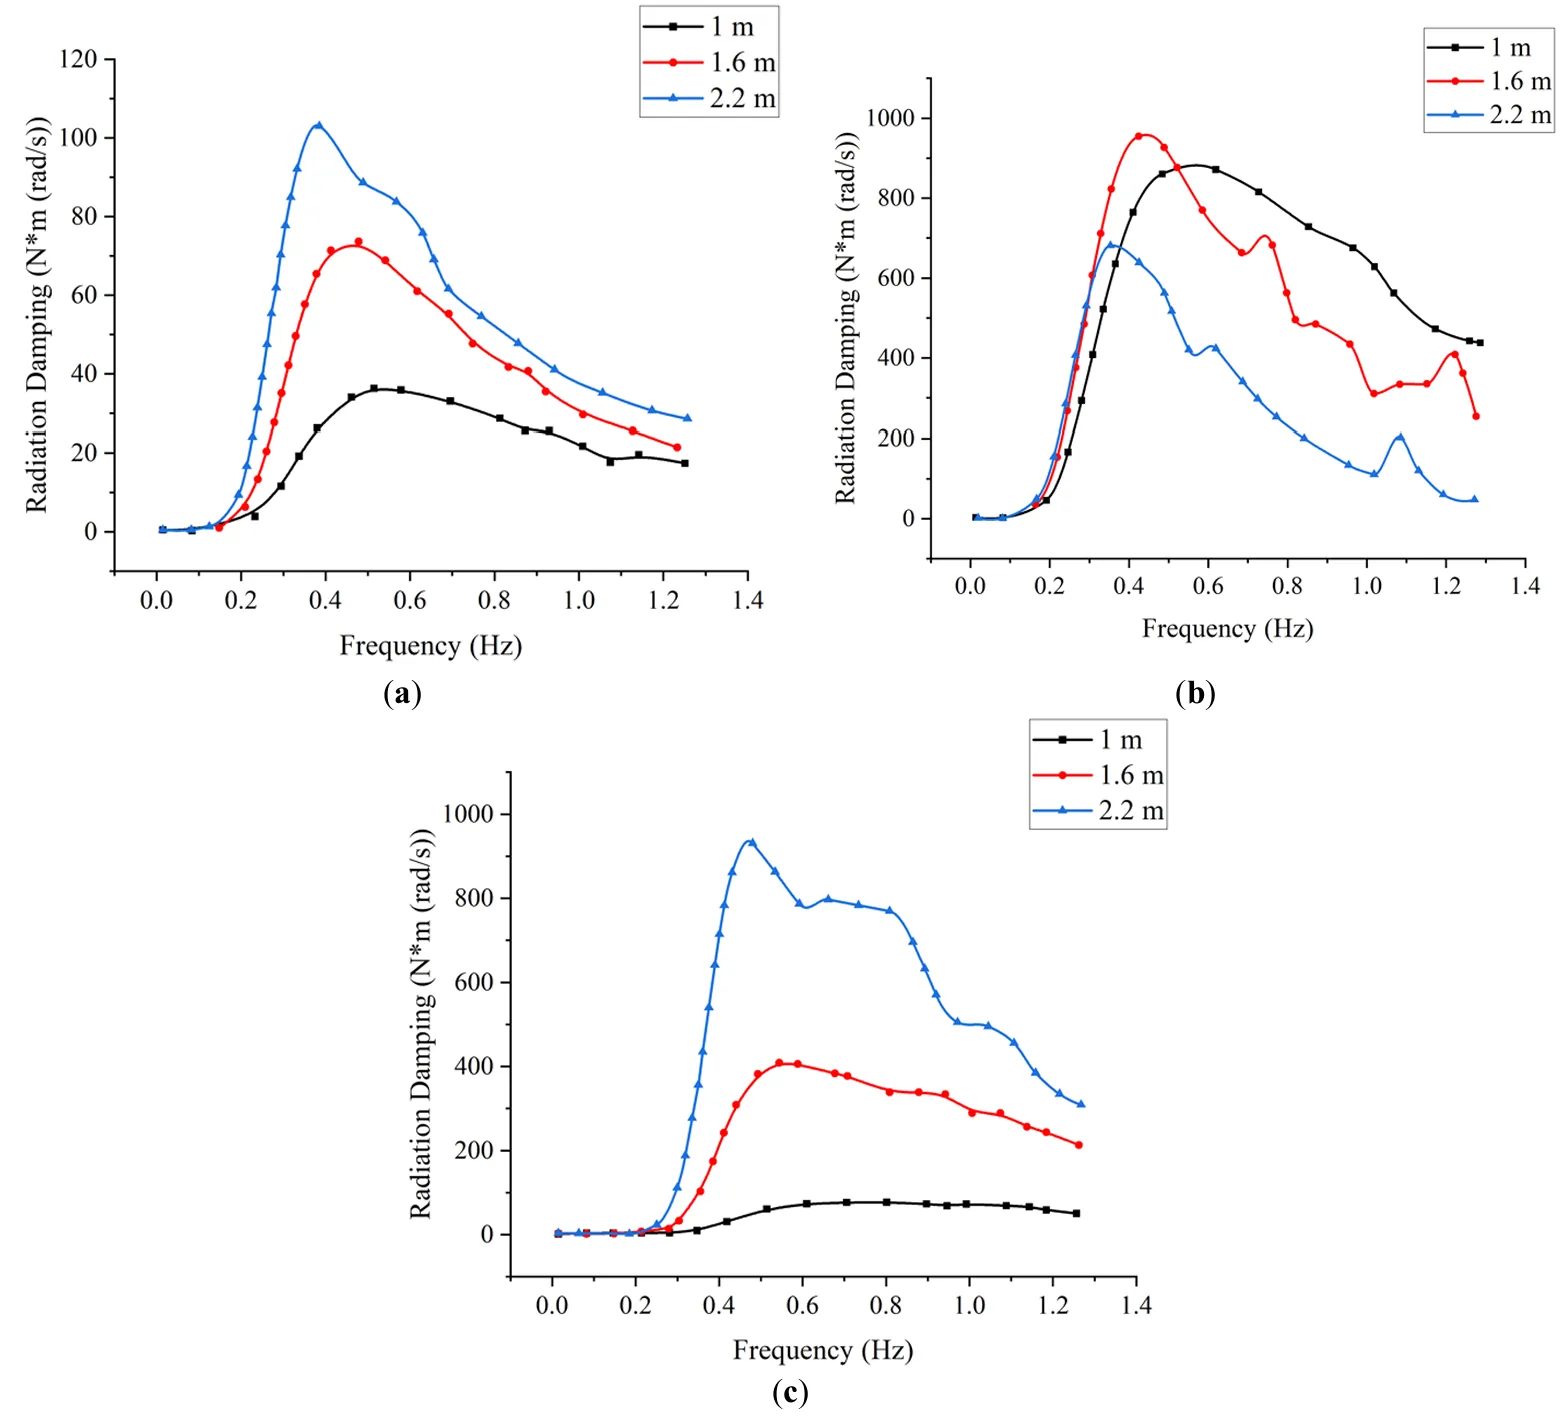
illustrates the effect of draft depth on the radiation-damping coefficients in pitch, roll, and yaw. In all three modes, the radiation damping initially increases with wave frequency, reaching a peak at approximately 0.5 Hz before decreasing. In the pitch direction, radiation damping increases noticeably with greater draft depth. This is attributed to the enhanced interaction between the device and incident waves at greater submerged volumes, resulting in stronger hydrodynamic coupling. In the roll direction, a similar trend is observed: damping increases then decreases with frequency, also peaking at 0.5 Hz. However, the influence of draft depth becomes less significant as it increases, suggesting a diminishing sensitivity of roll damping to draft beyond a certain threshold. For yaw motion, radiation damping also shows a peak around 0.5 Hz, with increasing variation as draft depth increases. The sensitivity of yaw damping to draft is more pronounced than in roll, likely due to the asymmetric geometry and flow separation effects around the device’s ends.
. Variations of radiation damping in three directions for different draft depths. (<b>a</b>) Pitch (<b>b</b>) Roll (<b>c</b>) Yaw.
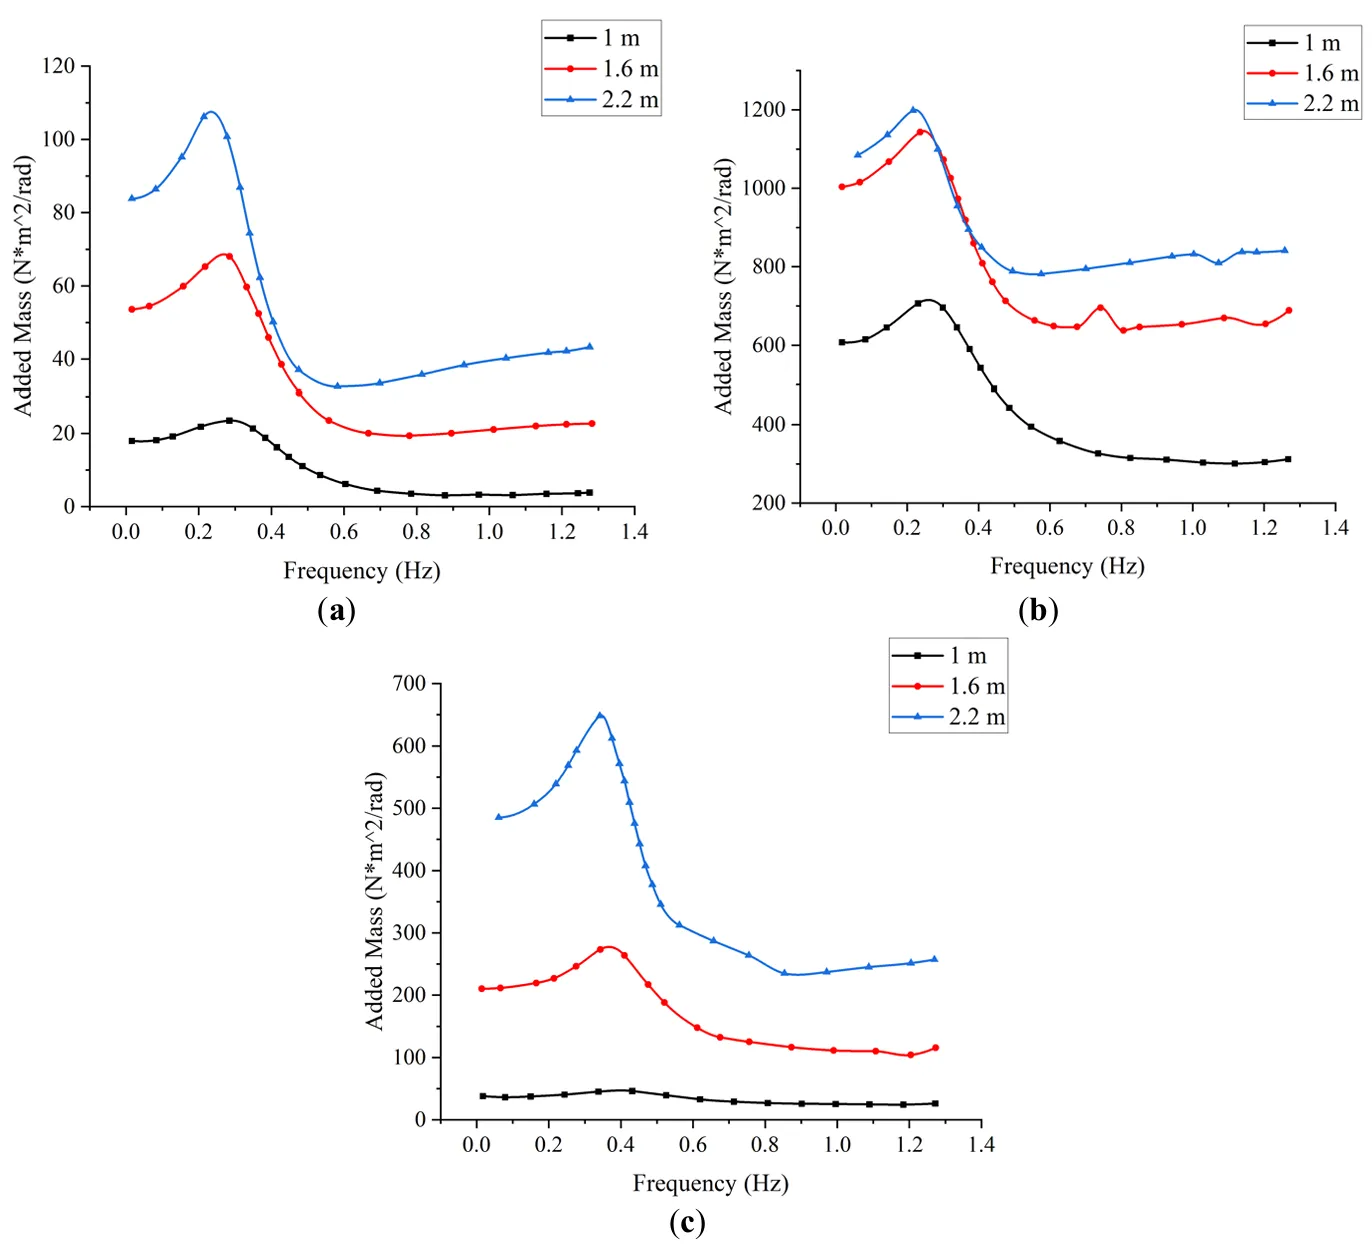
presents the frequency-dependent added mass for the three draft configurations. Across all directions, the added mass increases with wave frequency up to a peak value before declining. In pitch, the peak added mass occurs near 0.3 Hz, with values increasing proportionally with draft depth, again indicating stronger fluid-structure interaction at greater submergence. In the roll direction, peak added mass is also observed at approximately 0.3 Hz. However, the influence of draft becomes less pronounced at 1.6 m and 2.2 m, suggesting that roll-induced added mass becomes saturated or less sensitive beyond moderate submergence levels. For yaw, the added mass follows a similar frequency trend, peaking in the 0.2–0.4 Hz range. As draft depth increases, the amplitude of the yaw added mass also increases, indicating that yaw motion is more sensitive to submerged geometry in the lower-frequency range.
. Variations of added mass in three directions for different draft depths. (<b>a</b>) Pitch (<b>b</b>) Roll (<b>c</b>) Yaw.
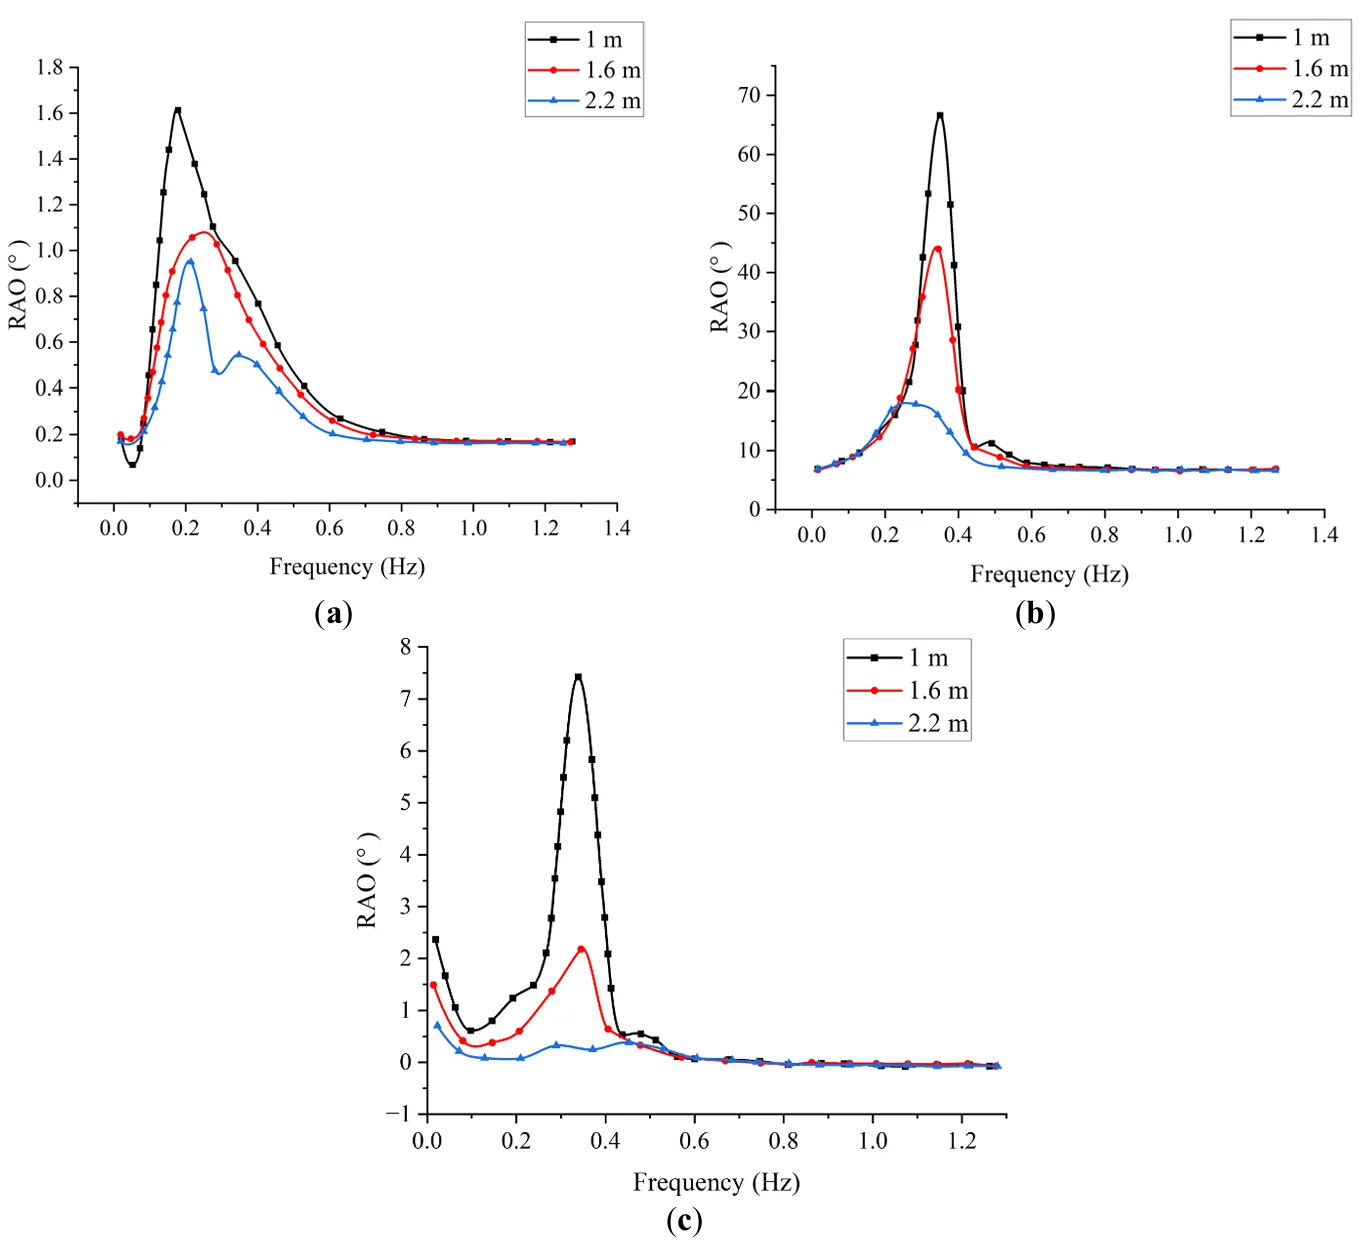
shows the variation of RAOs with wave frequency under different draft depths for pitch, roll, and yaw. In all cases, RAOs increase with wave frequency up to a peak, followed by a decline. Notably, the influence of draft on RAO is most significant in the low-frequency range (below 0.5 Hz), where the device demonstrates the greatest sensitivity to wave loading. Beyond 0.5 Hz, differences in RAO across the draft configurations become negligible, consistent with previous findings that the device is more responsive to low-frequency waves. In pitch, the RAO peaks around 0.3 Hz but decreases in magnitude with increasing draft depth, indicating that a deeper draft can reduce pitch response amplitude due to increased hydrodynamic damping and inertia. In the roll direction, the RAO also peaks near 0.3 Hz. As draft increases, the roll RAO decreases more significantly than in pitch, demonstrating that roll motion is more sensitive to draft variation, especially at lower submergence levels. For yaw, the RAO exhibits a similar frequency response, peaking around 0.3 Hz. The reduction in yaw RAO magnitude with increasing draft is more pronounced than in roll, suggesting that greater submergence substantially stabilizes yaw motion under wave forcing.
. Variations of RAO in three directions for different draft depths. (<b>a</b>) Pitch (<b>b</b>) Roll (<b>c</b>) Yaw.
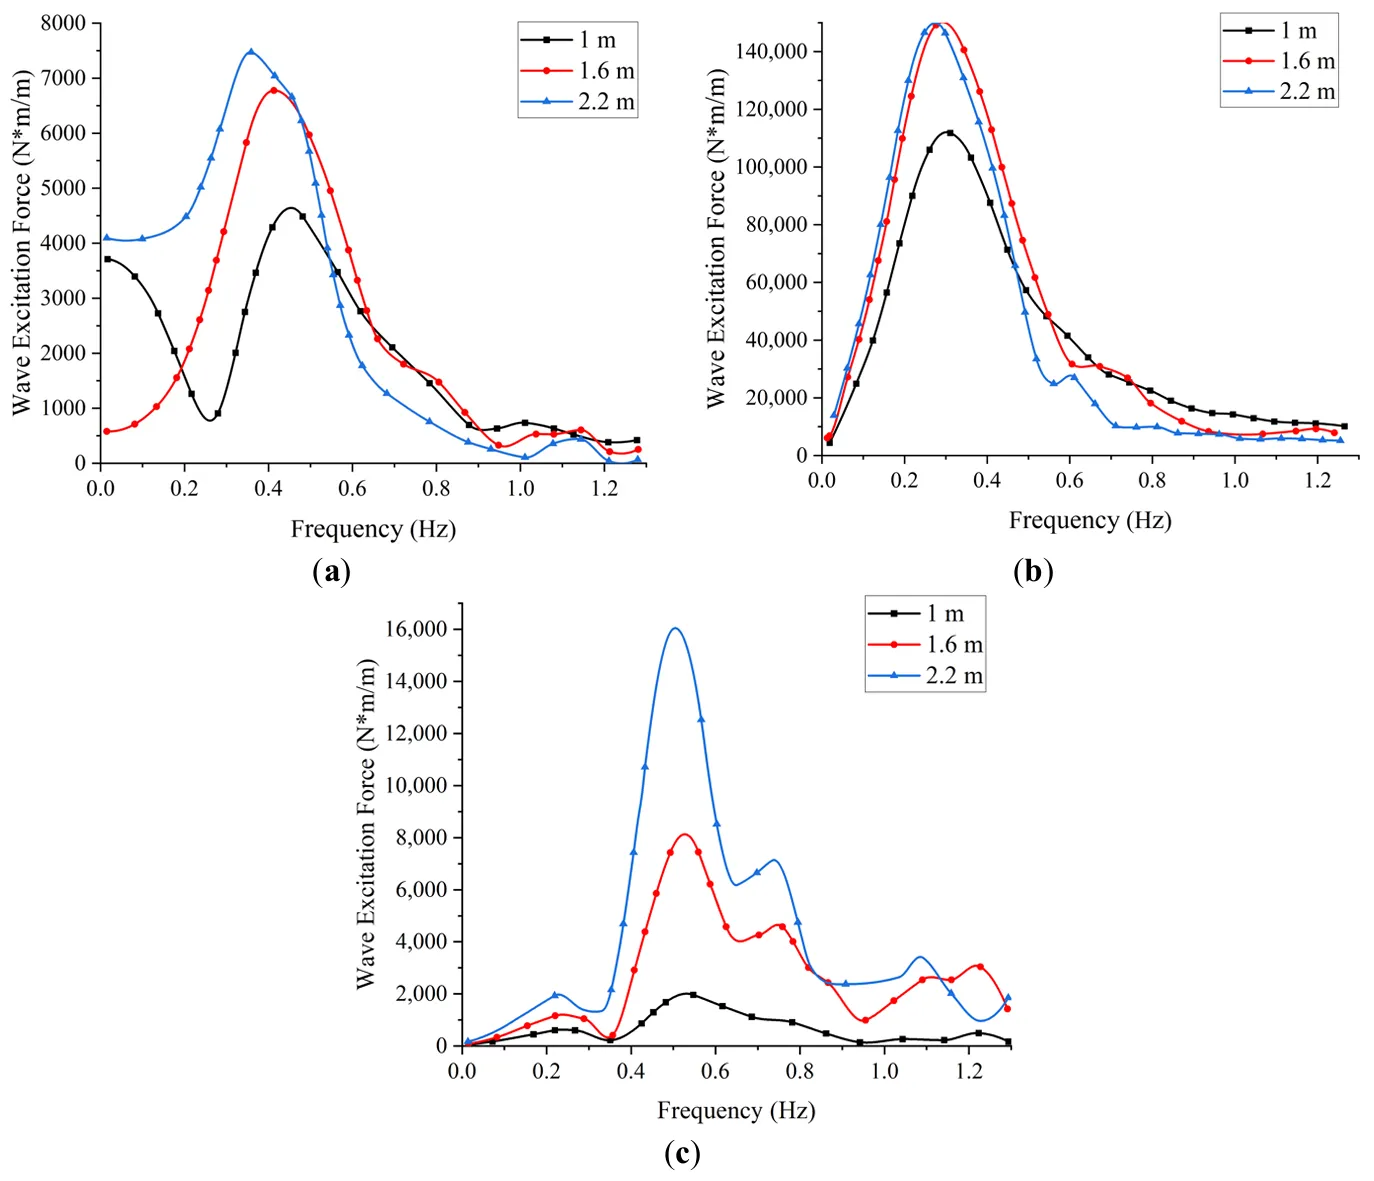
The influence of draft depth on wave excitation forces is illustrated in . In all three rotational degrees of freedom, the excitation force shows a typical frequency response, increasing to a peak value before declining. The draft has the most pronounced effect in the yaw direction. In pitch, excitation forces peak between 0.3–0.5 Hz and increase with draft depth, particularly in the low-frequency range. However, at higher frequencies, the influence of the draft becomes minimal. In roll, the excitation force peaks at around 0.3 Hz. While the increase in the draft from 1.0 m to 1.6 m shows a slight effect, further increases to 2.2 m do not substantially alter the force, indicating a reduced sensitivity at greater draft depths. Yaw excitation forces peak at approximately 0.5 Hz and show a greater dependence on draft depth. As the draft increases, the variation in yaw excitation force becomes more substantial, suggesting that the yaw response is the most affected by changes in submerged volume.
. Variations of wave excitation forces in three directions for different draft depths. (<b>a</b>) Pitch (<b>b</b>) Roll (<b>c</b>) Yaw.
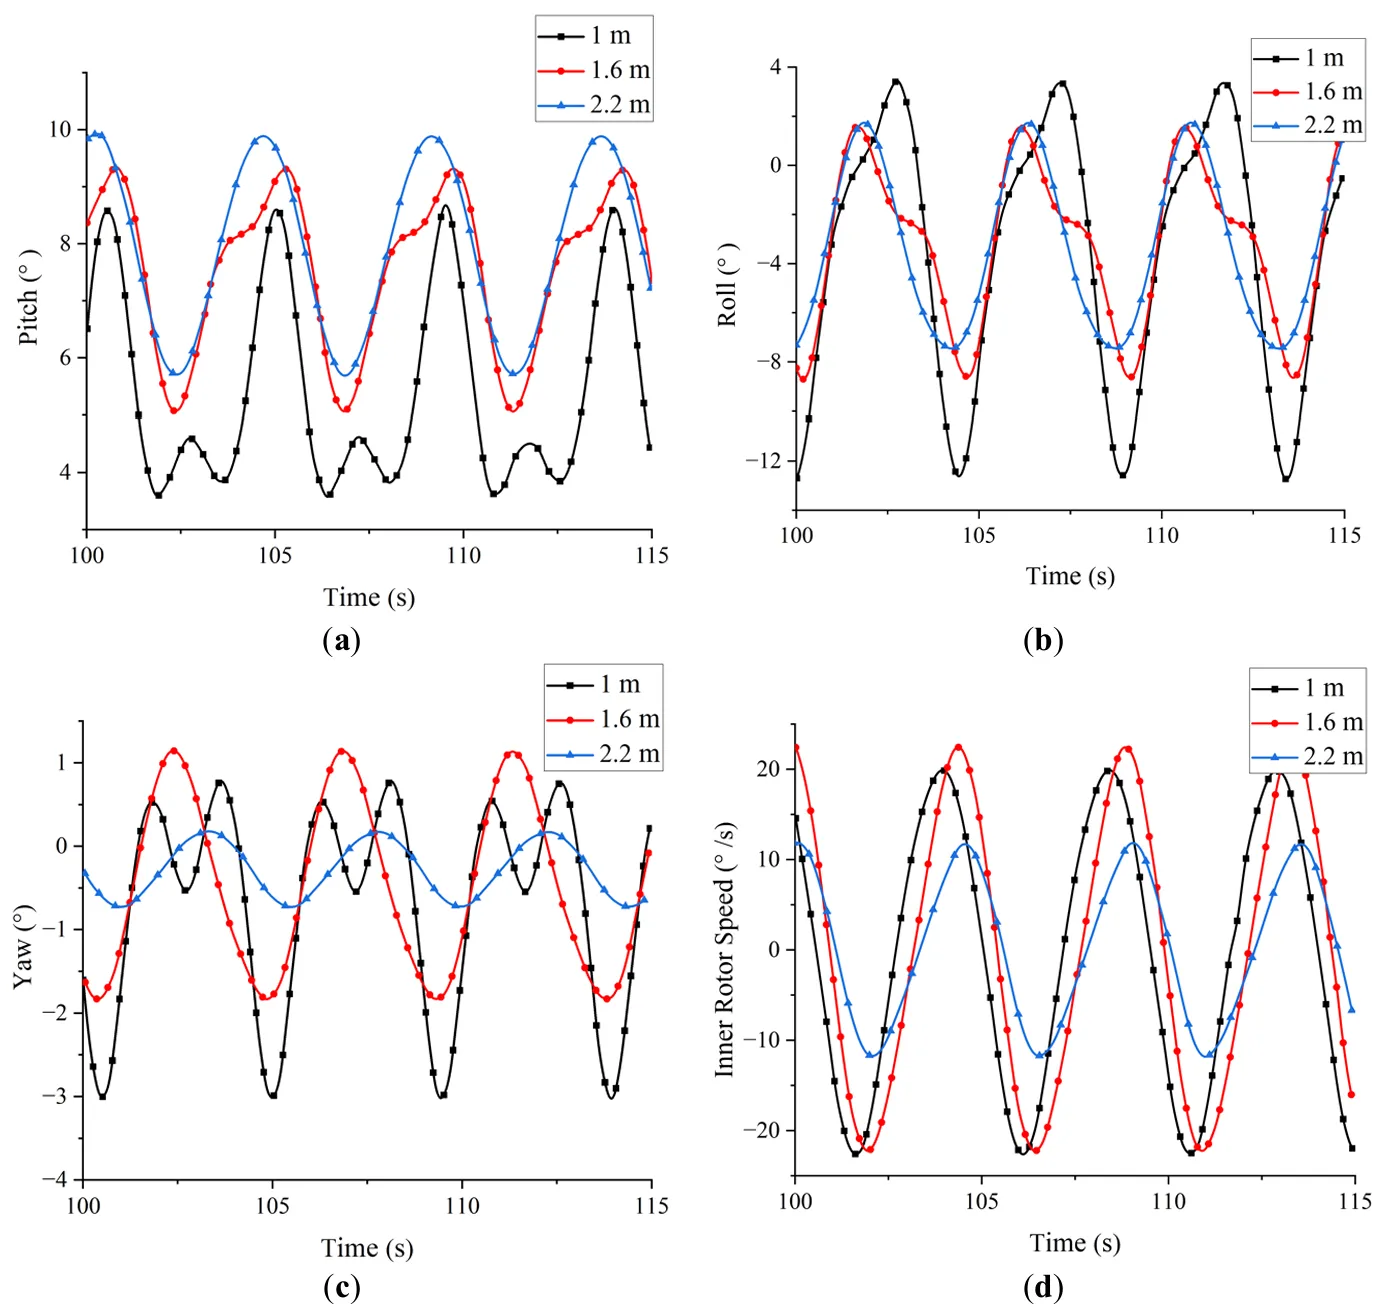
a–c presents the time-domain motion responses of the device at different draft depths. In pitch, the angular displacement remains relatively consistent across all configurations, with amplitudes around 5°. In roll, the device exhibits similar amplitudes (~10°) at 1.6 m and 2.2 m drafts, while the amplitude increases to approximately 16° at the shallower 1.0 m draft, indicating a greater susceptibility to wave-induced rolling at reduced submergence. For yaw motion, angular displacement decreases with increasing draft depth, confirming that deeper drafts contribute to enhanced directional stability. d illustrates the variation of inner rotor angular velocity with draft depth. Although rotor speed shows limited variation at lower drafts, it follows a non-monotonic trend—first increasing and then decreasing with the draft. The maximum angular velocity of approximately 48°/s occurs at a draft of 1.6 m, suggesting that this configuration offers the most favorable balance between wave-induced motion and energy transmission to the rotor.
. Comparison of motion histories and inner rotor velocity for different draft depths. (<b>a</b>) Pitch (<b>b</b>) Roll (<b>c</b>) Yaw (<b>d</b>) Inner rotor velocity.
This section investigates the influence of the center of gravity (CG) on the hydrodynamic performance of the floating inner-rotor wave energy converter. Three configurations of the device with different CG heights—defined as the vertical distance from the center of gravity to the still water level (positive above, negative below)—are considered: 0.53 m, 1.13 m, and 1.73 m. The impact of CG position on added mass, radiation damping, wave excitation force, and RAOs is examined.
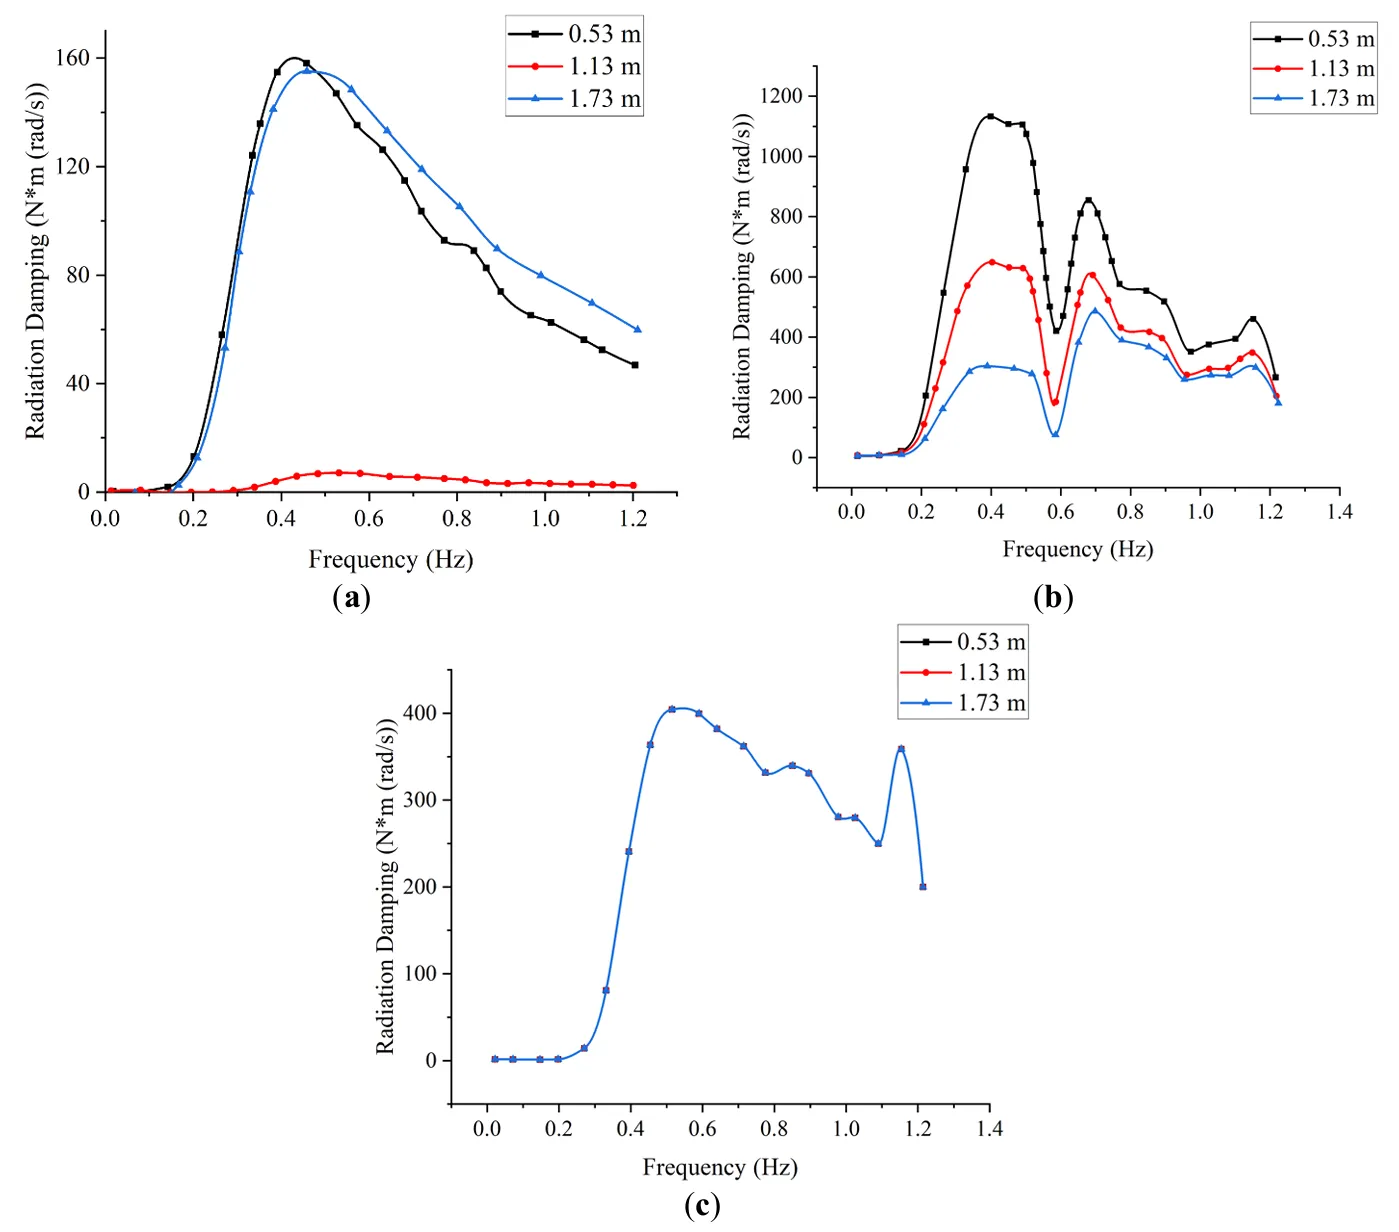
presents the radiation-damping coefficients of the device with varying CG positions as a function of wave frequency. Across the pitch, roll, and yaw directions, the radiation damping increases initially with frequency, reach a peak, and subsequently decreases. In the pitch direction, the case with CG at 1.13 m exhibits the smallest variation in radiation damping, while the cases with CG at 0.53 m and 1.73 m display nearly identical values and trends, peaking around 0.4 Hz. For roll, all three CG configurations follow a similar pattern. In the low-frequency range, increasing the CG height results in lower damping amplitudes. However, the influence of CG diminishes in the high-frequency range (beyond 0.6 Hz), though local fluctuations and secondary peaks are still observed. In the yaw direction, the CG position does not significantly affect the damping profile, though a pronounced peak appears between 0.4–0.6 Hz.
. Variations of radiation damping in three directions for different CG heights. (<b>a</b>) Pitch (<b>b</b>) Roll (<b>c</b>) Yaw.
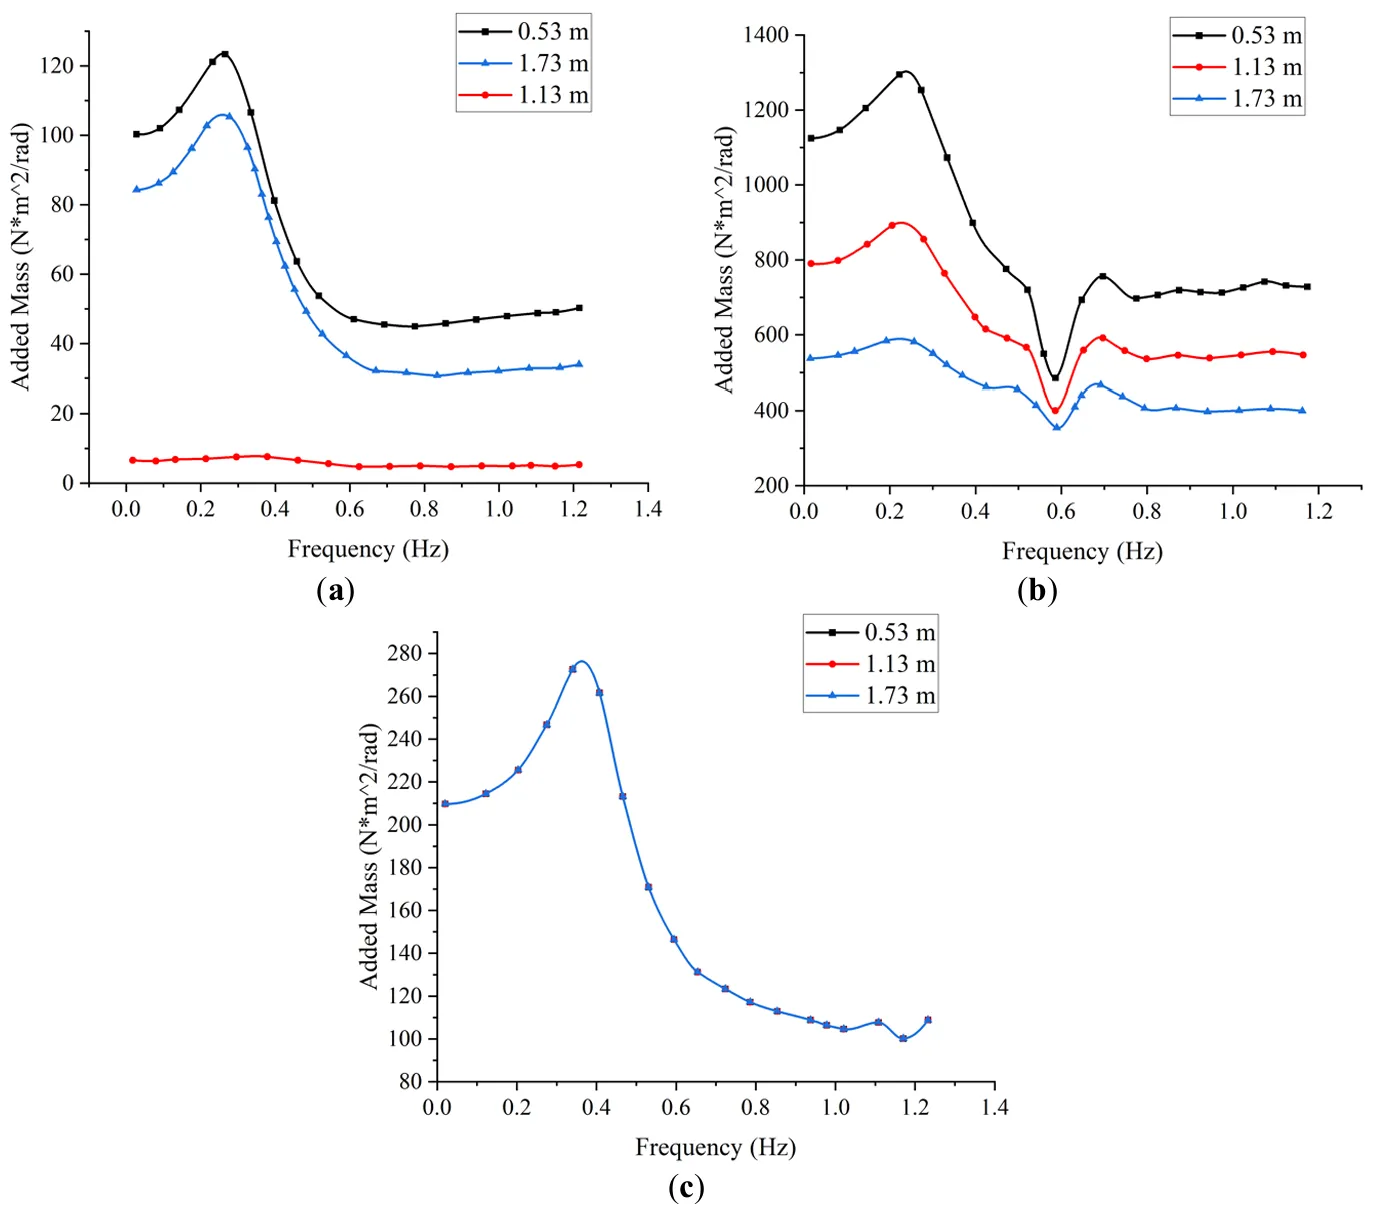
shows the variation in added mass with frequency for different CG positions. In all three motion directions, the added mass increases initially with frequency and then decreases, with peak values observed near 0.3 Hz. The influence of CG on added mass is most apparent in the pitch and roll directions, while it is negligible in yaw. In pitch, the CG at 1.13 m again yields the smallest variation, whereas the 0.53 m and 1.73 m cases demonstrate nearly identical behaviors, peaking in the 0.2–0.4 Hz range. In roll, the trend is consistent among all CG cases, but the amplitude decreases with increasing CG height. Peak values again occur in the 0.2–0.4 Hz range. For yaw, CG height has minimal impact, although peak added mass is observed within the same frequency band, likely due to the device’s natural frequency.
. Variations of added mass in three directions for different CG heights. (<b>a</b>) Pitch (<b>b</b>) Roll (<b>c</b>) Yaw.
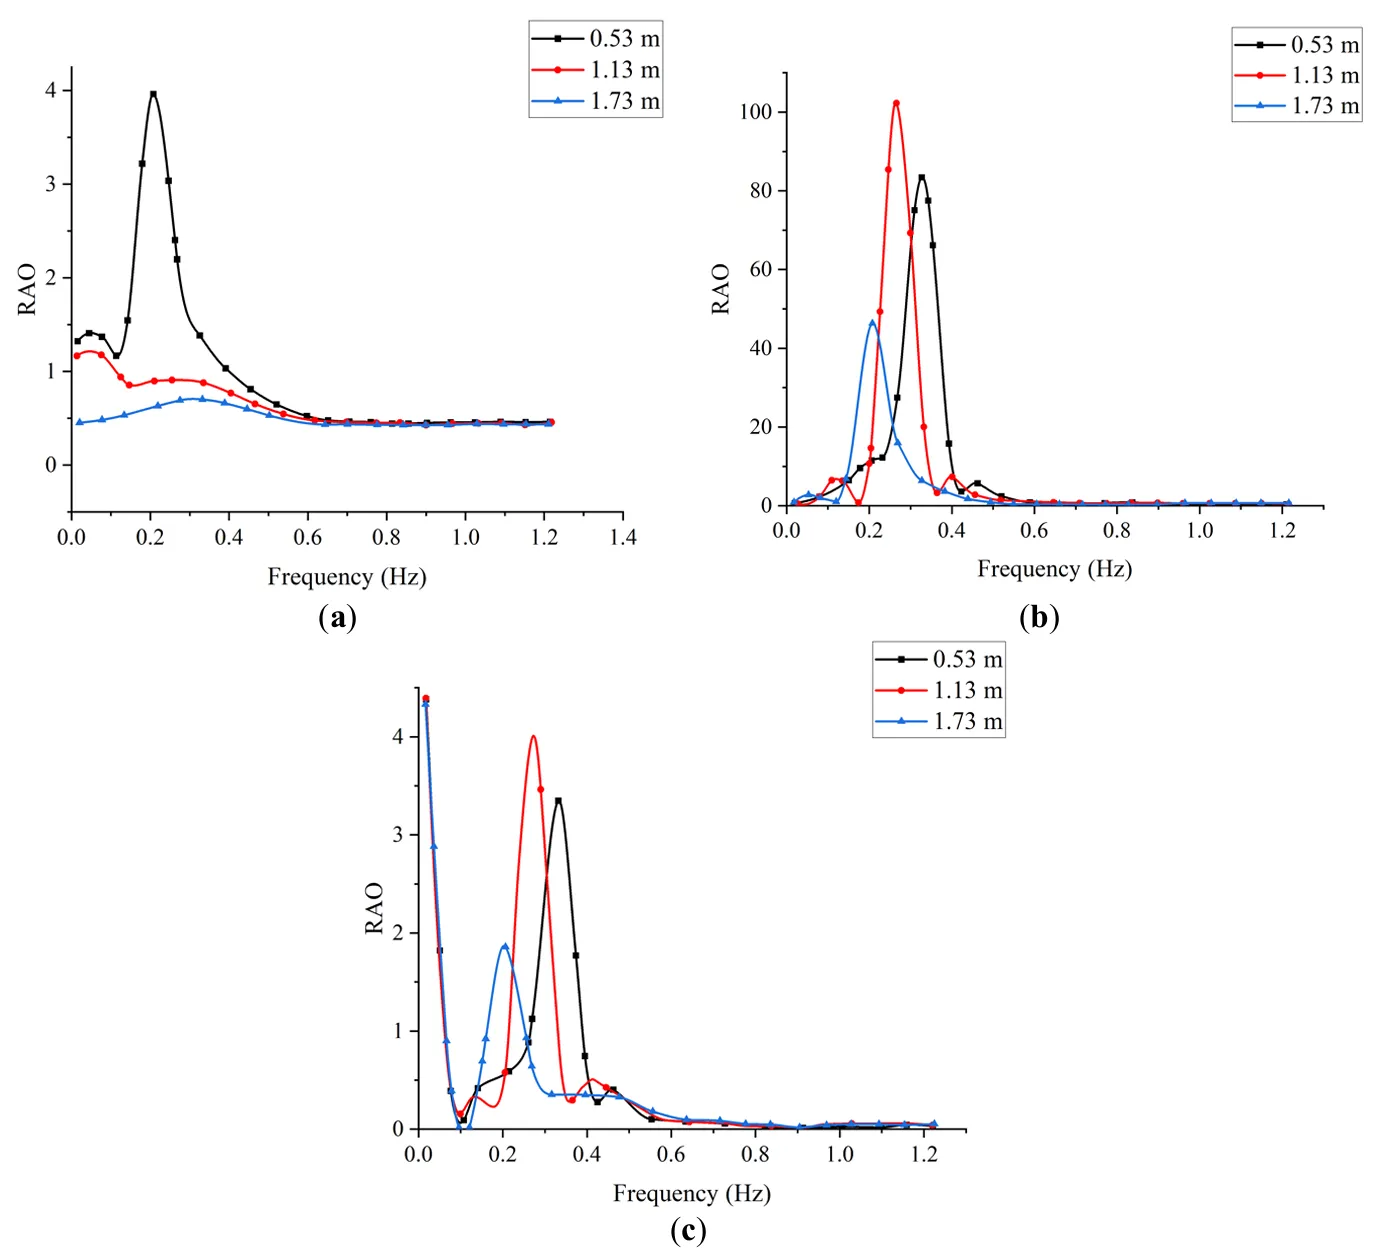
The RAO curves for pitch, roll, and yaw motions under different CG configurations are shown in . As frequency increases, RAO values for the three CG cases tend to converge. In the pitch direction, RAO magnitude decreases with increasing CG height, and the variation becomes negligible at 1.73 m. For roll and yaw, the RAO exhibits a non-monotonic trend, initially increasing and then decreasing with CG height. The influence of CG on RAO is more pronounced in the low-frequency region, whereas it becomes negligible in the high-frequency region. This suggests that CG has a significant impact on the device’s motion response at low frequencies, consistent with the frequency-dependent sensitivity previously identified.
. Variations of RAO in three directions for different CG heights. (<b>a</b>) Pitch (<b>b</b>) Roll (<b>c</b>) Yaw.
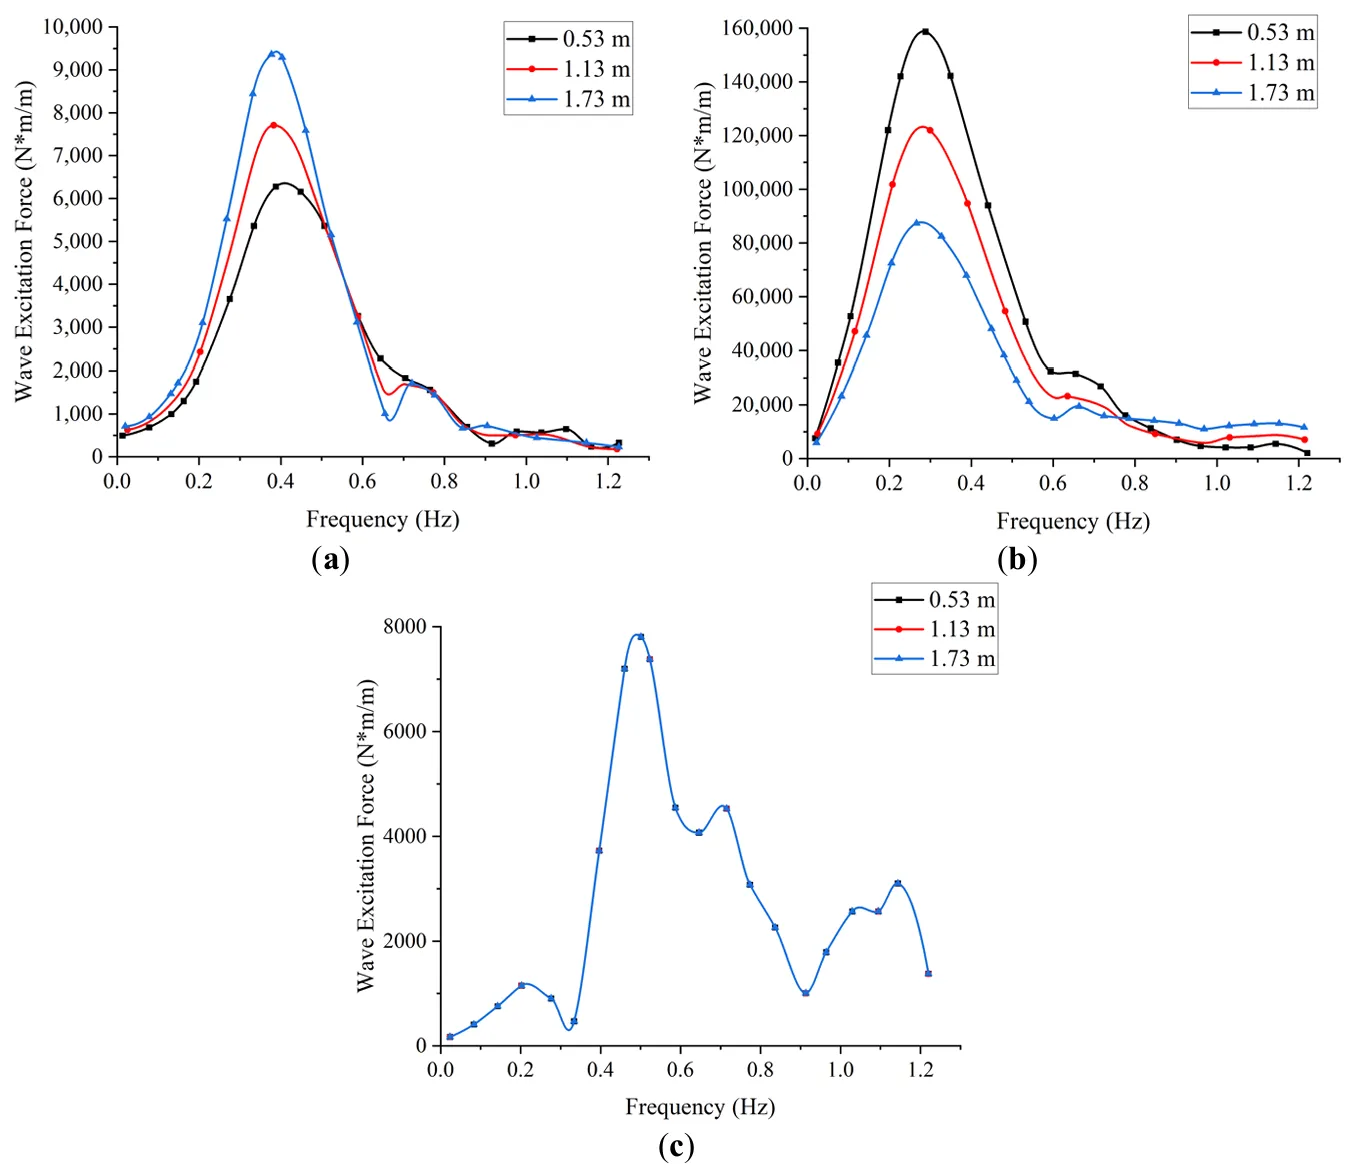
illustrates the variation in wave excitation force with frequency for different CG positions. In both pitch and roll directions, the excitation force follows a similar trend—first increasing and then decreasing with frequency. The pitch response peaks around 0.4 Hz, and the roll response peaks near 0.3 Hz. In the high-frequency region, the excitation force is largely unaffected by CG position. However, in pitch, the excitation force increases with CG height, while in roll, it decreases. In the yaw direction, a similar increase-then-decrease trend is observed with frequency, including some fluctuations. However, the CG distribution has minimal effect on yaw excitation forces.
. Variations of wave excitation force in three directions for different CG heights. (<b>a</b>) Pitch (<b>b</b>) Roll (<b>c</b>) Yaw.
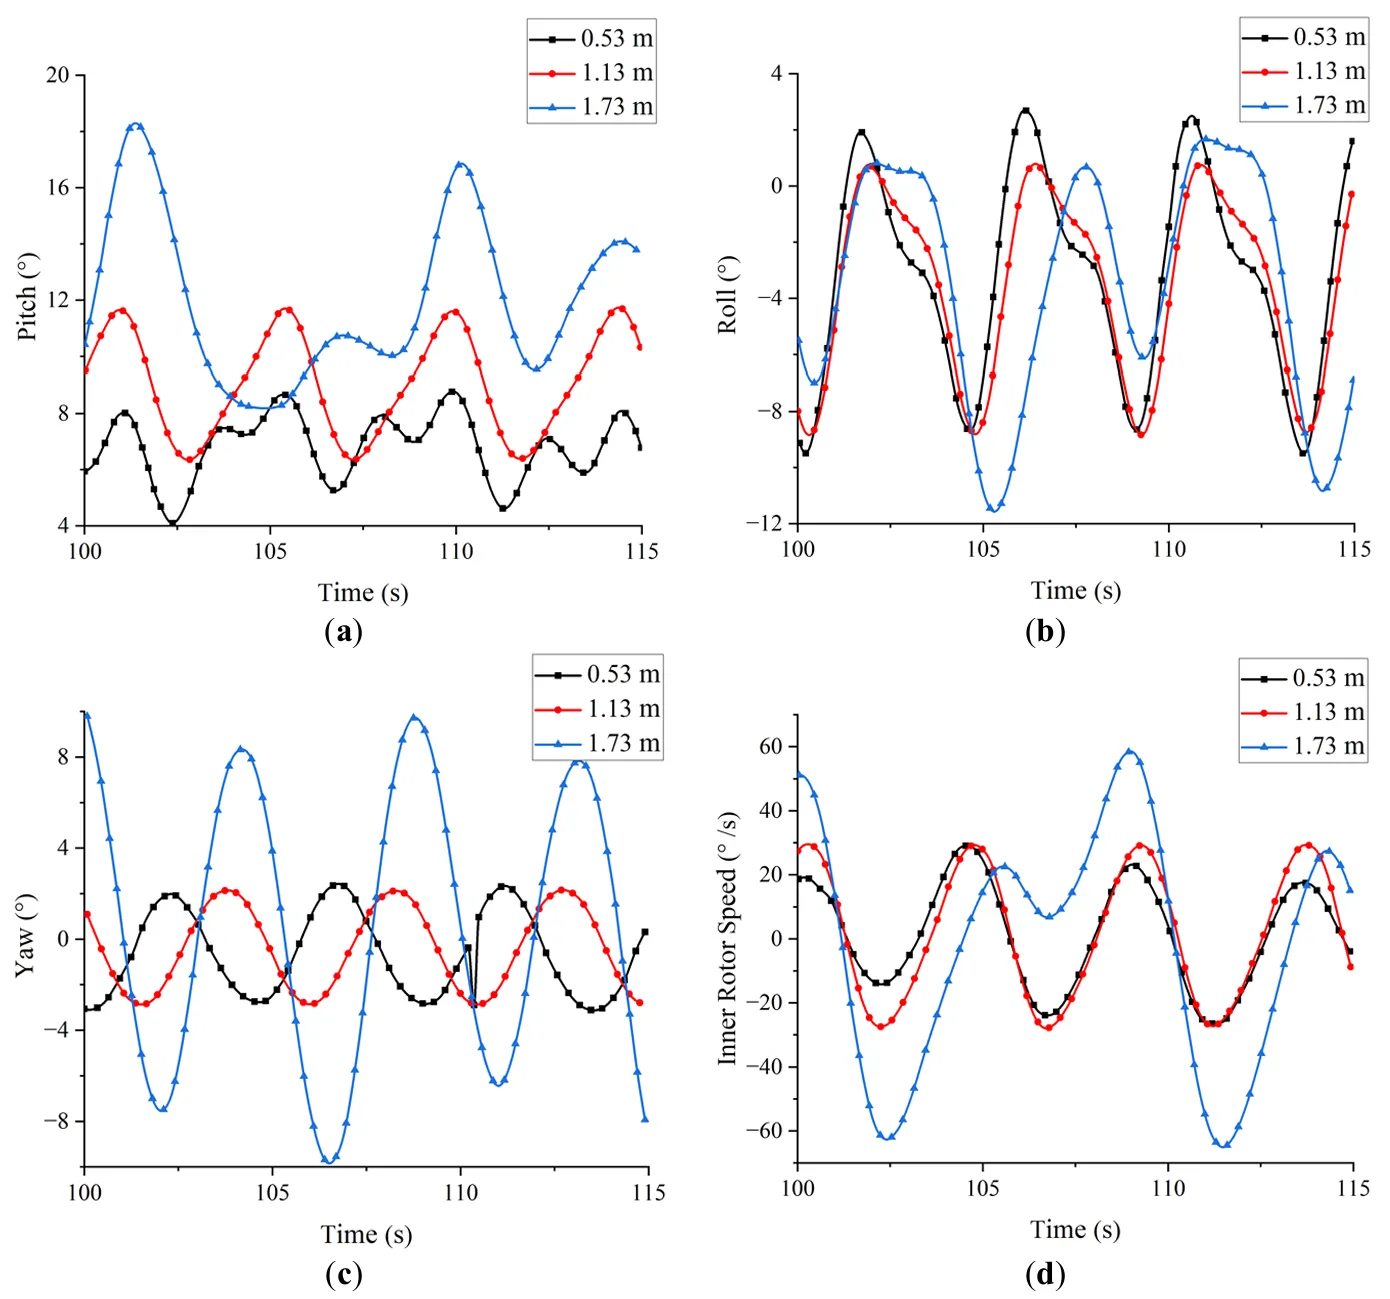
a–c shows the effect of CG position on the motion amplitudes of the device. In pitch, the motion amplitude increases with CG height, reaching approximately 10° at 1.73 m. In roll, CG position has little effect on motion, with all cases exhibiting amplitudes around 10°. In yaw, the motion amplitudes at CG heights of 0.53 m and 1.13 m are similar, while a notable increase to approximately 16° is observed at 1.73 m. d presents the variation in inner rotor angular velocity with CG position. At CG heights of 0.53 m and 1.13 m, the rotor speed amplitude remains around 55°/s, indicating minor sensitivity. However, at 1.73 m, the rotor speed increases significantly, reaching a maximum of 122°/s. This indicates a pronounced enhancement in rotational performance at higher CG positions.
. Comparison of motion histories and inner rotor velocity for different CG heights. (<b>a</b>) Pitch (<b>b</b>) Roll (<b>c</b>) Yaw (<b>d</b>) Inner rotor velocity.
Building upon the preceding analysis, this section investigates the impact of the PTO system on the hydrodynamic behavior and energy capture performance of the floating inner-rotor wave energy converter. The device is modeled with a hinged connection between the inner rotor and the central shaft, and seven different linear damping coefficients are applied to simulate the PTO system: 50, 75, 100, 200, 400, 600, and 800 N·m·s/(°).
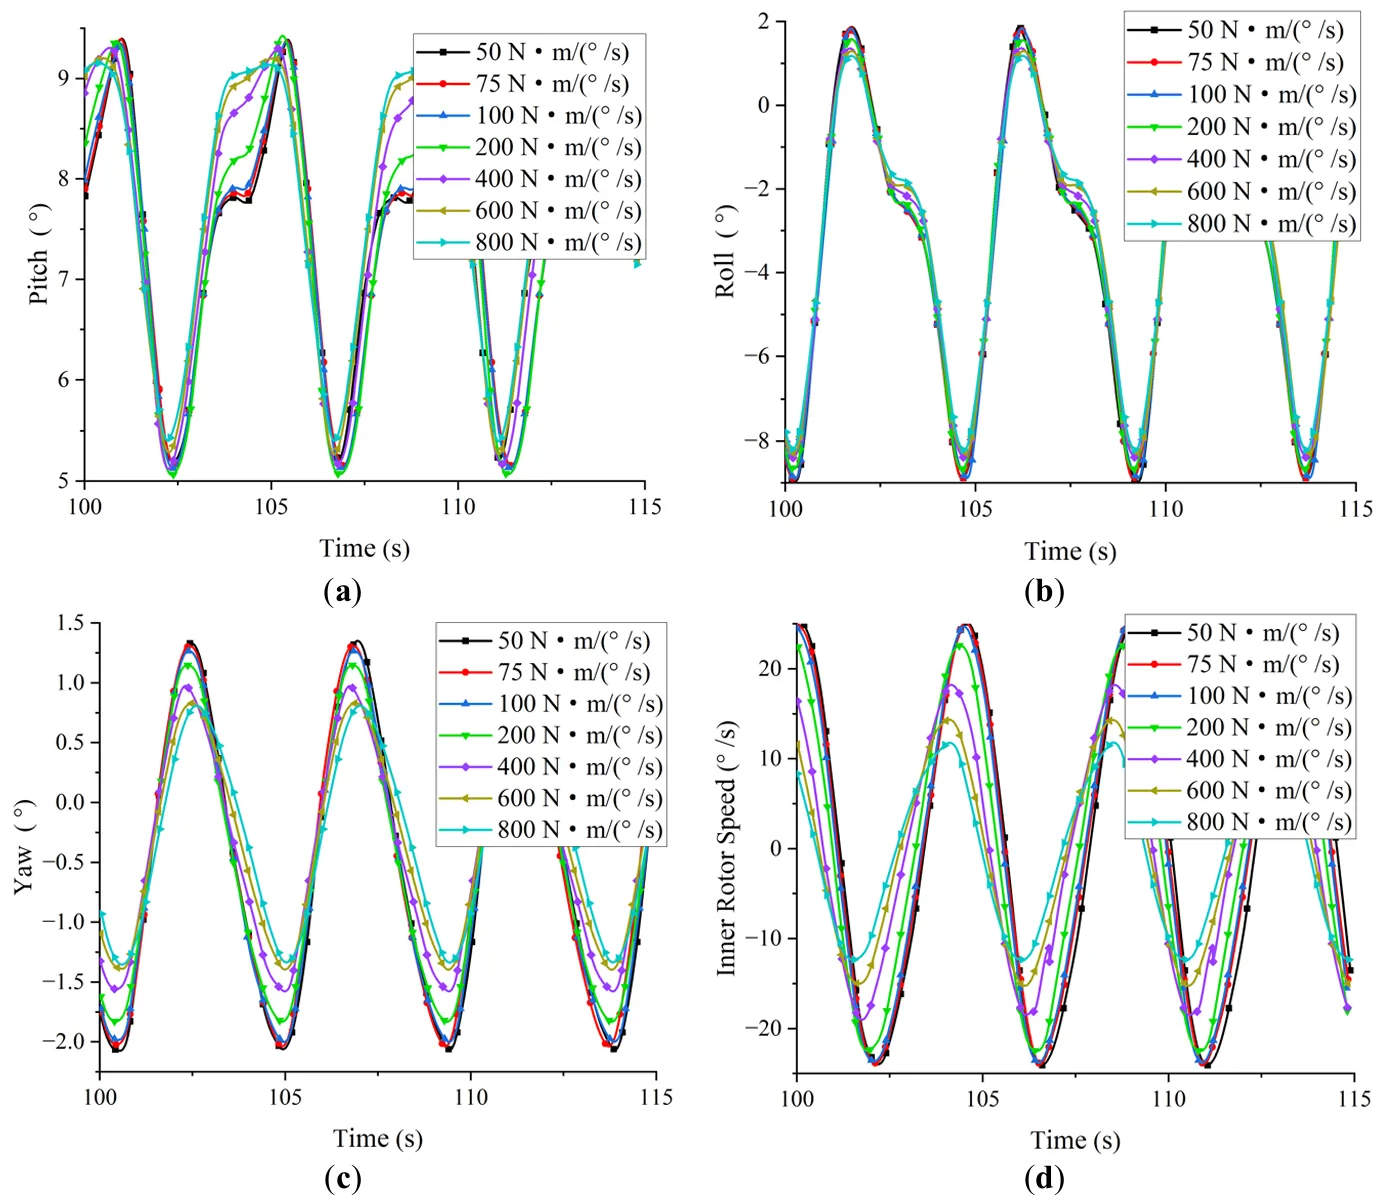
presents the time histories of the device’s motion responses under varying damping coefficients. a,b indicate that the PTO damping has minimal effect on the pitch and roll responses, with only minor fluctuations observed during certain intervals of each wave cycle. However, the yaw response, shown in c, is more sensitive to damping. At lower damping values, the yaw motion amplitude is significantly larger. As the PTO damping increases, the yaw amplitude decreases accordingly, indicating that higher PTO damping effectively suppresses yaw motion. To further examine the effect of damping, time-domain simulations were conducted under the same set of linear damping coefficients, and the resulting inner rotor angular velocity profiles are shown in d. The rotor velocity exhibits a non-monotonic trend with respect to PTO damping: it increases initially, reaches a peak, and then declines. Specifically, the rotor velocity remains relatively consistent at damping values of 50, 75, and 100 N·m·s/(°), but begins to decrease notably when the damping exceeds 200 N·m·s/(°).
. Comparison of motion histories and inner rotor velocity for different damping coefficients. (<b>a</b>) Pitch (<b>b</b>) Roll (<b>c</b>) Yaw (<b>d</b>) Inner rotor velocity.
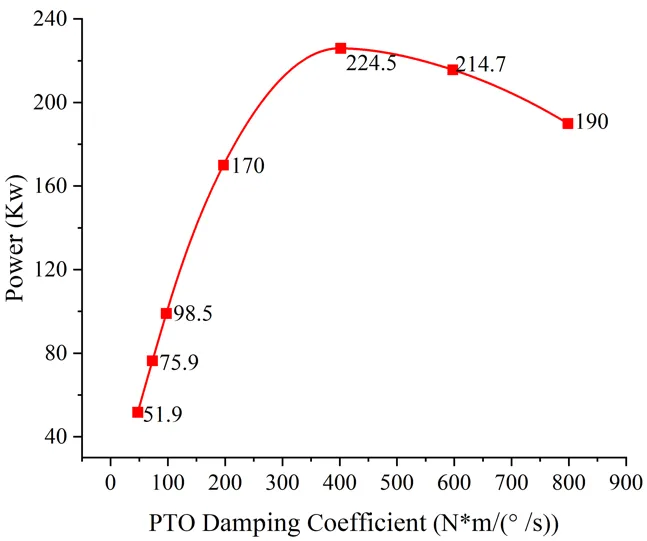
Based on the angular velocity of the inner rotor, the instantaneous power output of the device is computed. illustrates the energy capture performance under different damping conditions. The power output follows a similar non-linear trend, increasing initially with damping and then decreasing beyond a certain point. The maximum captured power, approximately 224.5 kW, occurs at a PTO damping coefficient of 400 N·m·s/(°). These results demonstrate that for a floating inner-rotor wave energy device with fixed structural parameters, there exists an optimal PTO damping value that maximizes energy capture. Identifying and applying this optimal damping is, therefore, critical to enhancing the overall efficiency and performance of the device.
. Energy capture power versus PTO damping coefficient.
Following the individual optimization of key structural and operational parameters, this section investigates the combined effects of multiple parameters on the hydrodynamic behavior and energy capture performance of the floating inner-rotor wave energy converter. Based on the previous analyses, the optimized configuration includes an elliptical–circular cross-sectional shape, a draft of 1.6 m, a center of gravity located at 1.13 m above the waterline, an inner rotor mass of 4600 kg, and a PTO damping coefficient of 400 N·m·s/(°). A time-domain simulation of 200 s was conducted using this parameter combination.
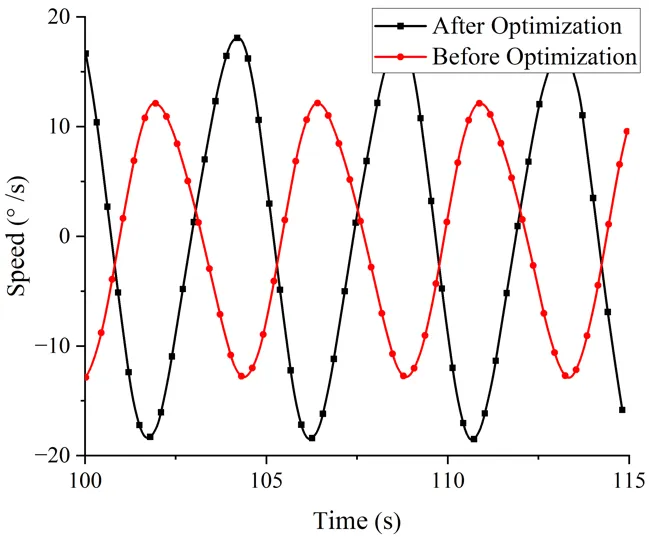
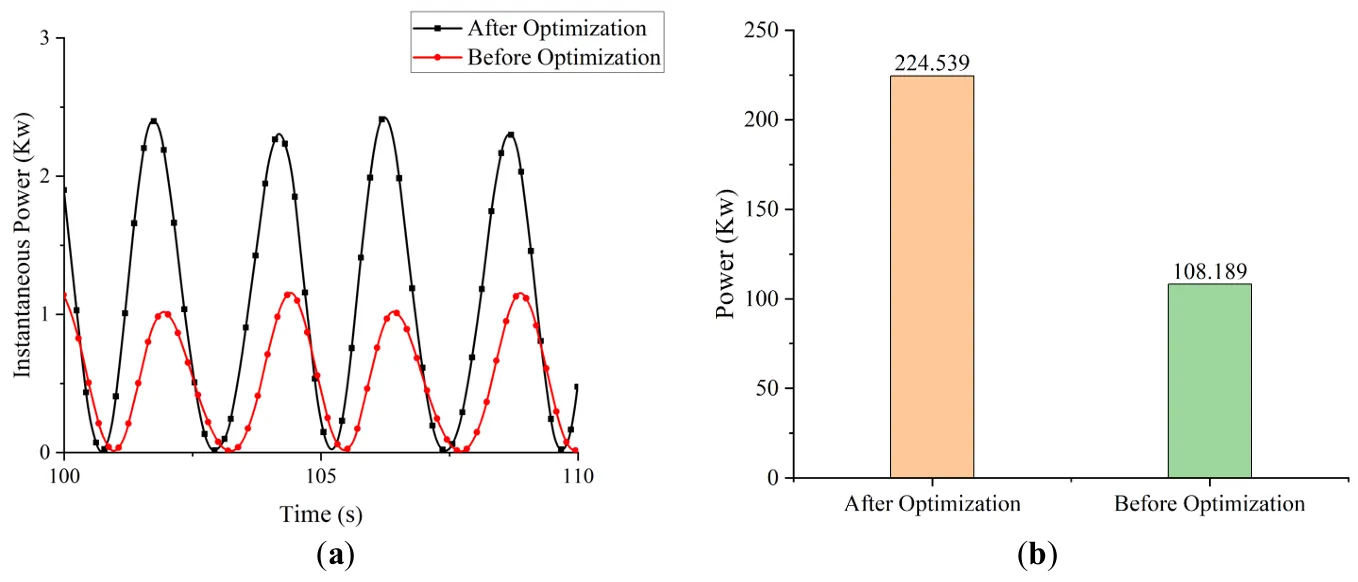
illustrates the angular velocity of the inner rotor before and after optimization. As a result of the combined optimization—including refinements to the buoy geometry, draft, rotor mass, center of gravity, and PTO damping—the peak angular velocity of the inner rotor increased by 50%, rising from 12°/s to 18°/s. presents the corresponding power capture performance. The optimized device achieved a substantial improvement in both instantaneous and total power output. Specifically, the instantaneous power increased from 1 kW to 2.5 kW—an enhancement of nearly 150%. In terms of total energy capture, the output improved from 108 kW to 224 kW, representing a 108% increase.
. Comparison of inner rotor velocity before and after optimization.
These results confirm that systematic multi-parameter optimization significantly enhances the hydrodynamic efficiency and energy capture capability of the floating inner-rotor wave energy converter.
. Comparison of energy capture power before and after optimization. (<b>a</b>) Instantaneous power (<b>b</b>) Energy capture power.
Special thanks go to Yanjun Liu, Gang Xue, and their research team at Shandong University for providing valuable experimental data and results that contributed to validating our numerical simulations. The authors also wish to express their sincere gratitude to CIMC Offshore Engineering Research Institute Co., Ltd. for their institutional support, and Dahui Liu for his valuable technical guidance. We greatly appreciate their support and collaboration.
Author Contributions
C.W.: Formal analysis, Model development, Writing original draft. Z.H.: Visualization. C.Y.: Conceptualization, Formal analysis, Methodology, Writing original draft, Project administration, Funding Acquisition. W.Z.: Software, Validation, Model development. L.J.: Conceptualization, Writing review & editing, Project administration, Supervision, Funding Acquisition.
Not applicable.
Not applicable.
Data will be made available on request.
This paper is financially supported by the National Natural Science Foundation (Grant No.52101306, 52101326), the National Science Foundation of Shandong Province (Grant No. ZR2021QE121), the British Council (BRI JOINT project) and EPSRC ResIn project (EP/R007519/1), and Harbin Engineering University (award to Chang Wan for studying abroad at University of Queensland).
The authors declare that they have no known competing financial interests or personal relationships that could have appeared to influence the work reported in this paper.