
Granulation of Fine Eggshell Powder to Produce Feedstock Powder for Binder Jetting Additive Manufacturing: Effects of Spraying Pressure and Slurry Feed Rate

Granulation of Fine Eggshell Powder to Produce Feedstock Powder for Binder Jetting Additive Manufacturing: Effects of Spraying Pressure and Slurry Feed Rate

Received: 28 July 2026 Revised: 11 August 2026 Accepted: 31 August 2026 Published: 11 September 2026

© 2026 The authors. This is an open access article under the Creative Commons Attribution 4.0 International License (https://creativecommons.org/licenses/by/4.0/).
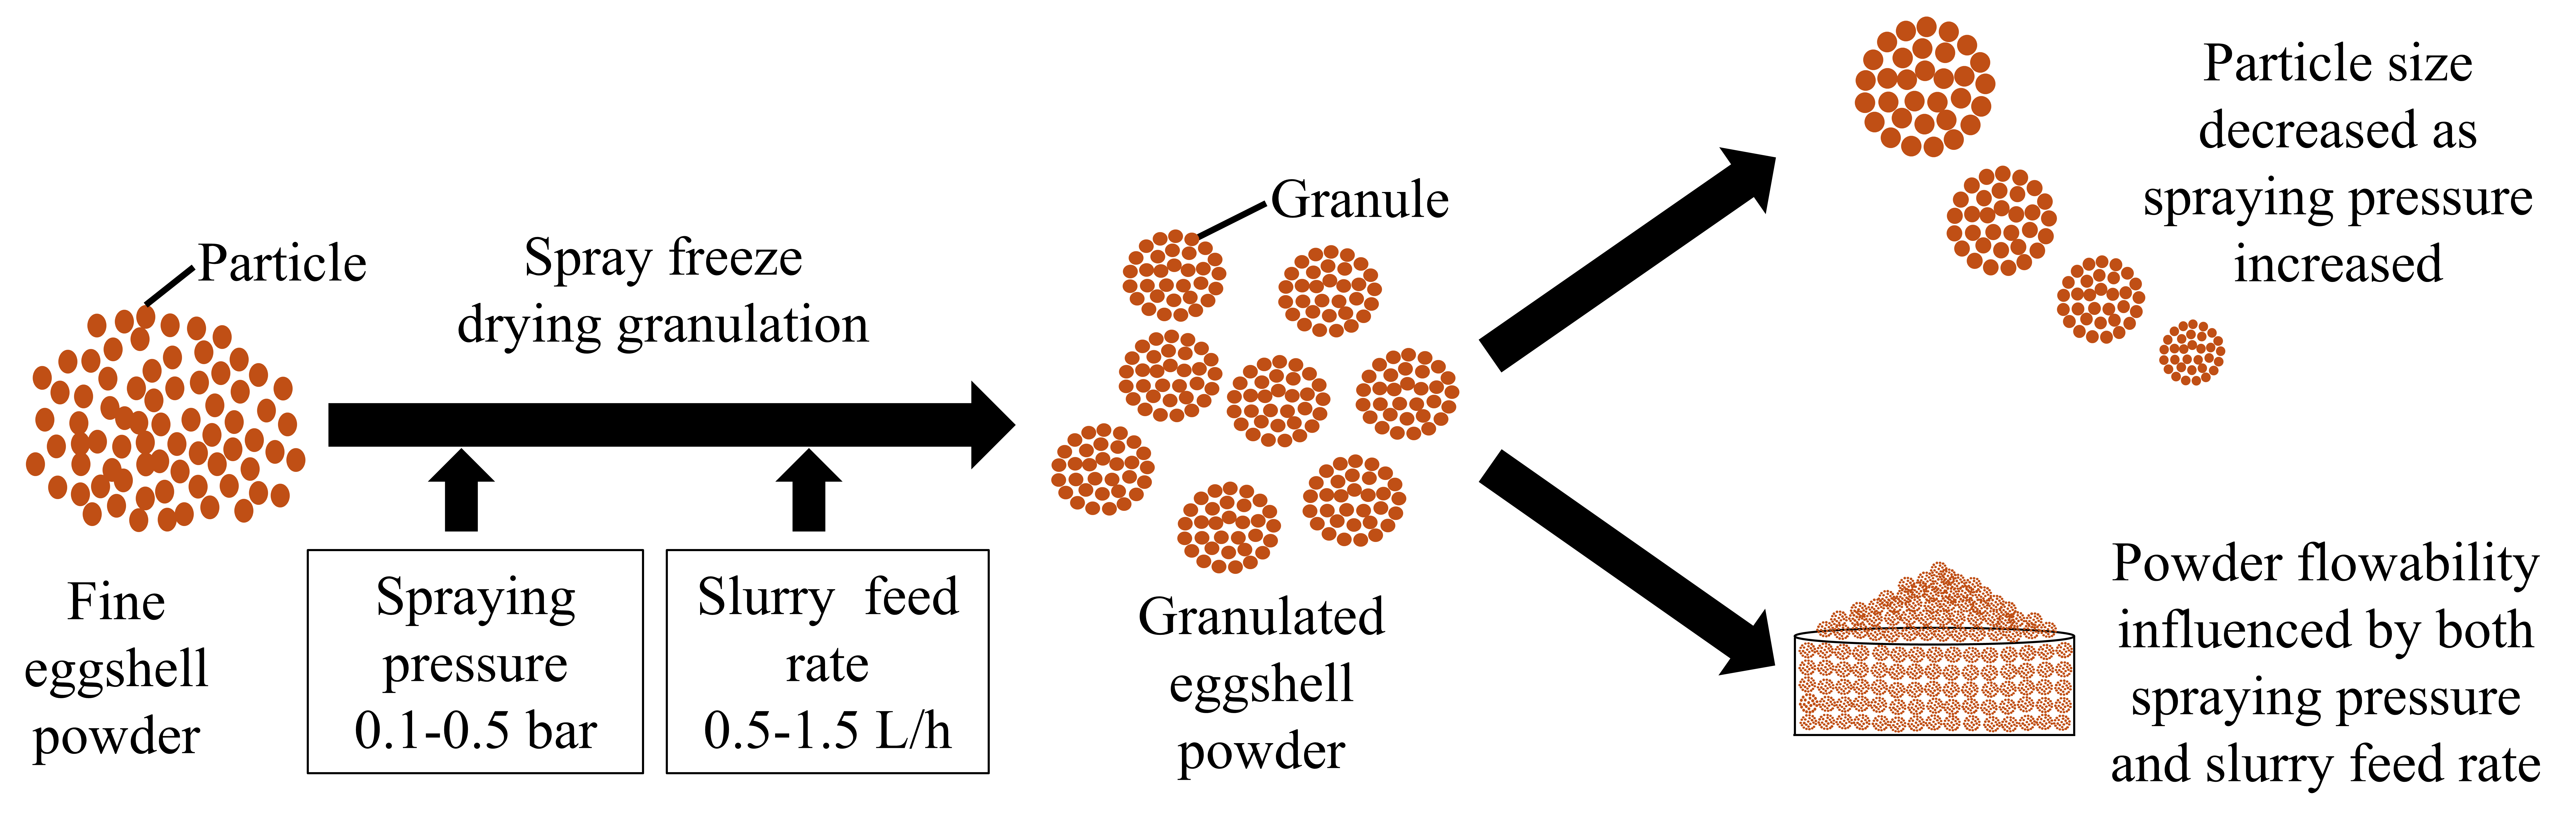
Graphical Abstract
1. Introduction
In binder jetting additive manufacturing, a liquid binder is deposited onto selected regions of a powder bed to produce components layer by layer [1,2]. Powder flowability strongly influences powder spreading and powder bed uniformity, thereby affecting the density of the printed parts [3,4]. Therefore, powder feedstock with suitable flowability is essential to achieve consistent density in binder jetting [5,6].
Eggshell is mainly composed of calcium carbonate, with smaller amounts of organic matter and other inorganic components [7,8]. Eggshell waste can be converted into calcium carbonate- or calcium oxide-based catalysts, wastewater-treatment adsorbents, bioceramics, and fillers for polymer, metal, and cementitious composites [8]. However, eggshell powder generally consists of irregular particles with poor flowability. In binder jetting, these characteristics can result in non-uniform powder spreading and defects in printed parts [9]. Therefore, granulation of eggshell powder can improve powder characteristics, particularly particle size and flowability, making the eggshell powder more suitable for binder jetting additive manufacturing [10,11].
Granulation methods are broadly categorized as dry or wet methods [12,13]. Dry granulation forms granules without using a liquid binder and is commonly divided into conventional methods, such as slugging and roller compaction, and advanced methods, such as pneumatic dry granulation [14,15]. Wet granulation methods use a liquid medium to promote particle agglomeration and include conventional methods such as spray drying [16,17,18], high-shear granulation [19,20], and fluidized bed granulation [21,22]. However, these methods often subject the material to significant thermal or mechanical stresses, which may result in dense agglomerates, irregular granule morphology, or alteration of material characteristics [23].
Spray freeze drying granulation, also referred to as freeze granulation, involves atomizing a slurry into a cryogenic medium (liquid nitrogen), followed by freeze drying of the frozen droplets [24,25,26,27,28]. Uniform contact between the atomized droplets and the cryogenic medium is essential for achieving consistent heat transfer and freezing conditions. Rapid freezing immobilizes the suspended particles and dissolved components, thereby limiting their migration and preserving the composition and spherical shape of the original droplets [24,29]. The freezing rate also affects ice-crystal growth and, consequently, the pore structure and specific surface area of the freeze-dried granules. However, incomplete or inconsistent exposure of the droplets to the cryogenic medium can lead to variations in freezing history, resulting in differences in granule morphology, porosity, and internal structure [24,29]. Therefore, effective distribution of the cryogenic medium contributes to uniform droplet solidification and consistent granule characteristics. Spray freeze drying granulation can produce porous and near-spherical granules while preserving the original material composition and minimizing thermal degradation [30,31]. These features make spray freeze drying granulation particularly suitable for producing uniform and flowable granules from fine and irregular powders.
Reported studies have demonstrated the feasibility of using granulated powders of SiC [32], alumina [33], and zirconia [34] as feedstock materials for binder jetting additive manufacturing. Table 1 provides a summary of reported studies on granulated powders for binder jetting additive manufacturing.
Table 1. Summary of reported studies on granulated powders for binder jetting additive manufacturing.
|
Feedstock Material |
Granulation Method |
Granulation Process Variables Investigated |
Reference |
|---|---|---|---|
|
Silicon carbide (SiC) |
Milling, spray drying, and thermal plasma treatment |
No |
[32] |
|
Alumina |
Ball milling and spray freeze drying |
No |
[33] |
|
Zirconia |
Spray drying, slow freezing, and freeze drying, fast freezing and freeze drying |
No |
[34] |
|
Yttria-stabilized zirconia (YSZ) |
Planetary milling and sieving |
No |
[35] |
|
Alumina |
Ball milling and spray freeze drying |
Yes (spraying pressure and slurry feed rate) |
[36] |
|
Eggshell |
Ball milling and spray freeze drying |
No |
[37] |
Although spray freeze drying granulation has been shown to produce granulated eggshell powder with more spherical particles and improved flowability, the influence of process variables on granule characteristics has not been systematically investigated. Spraying pressure and slurry feed rate play important roles in droplet formation during atomization, which in turn affects particle size, morphology, and internal structure. While these variables are known to influence particle formation, limited quantitative studies have examined their main and interaction effects on particle size and flowability of granulated powder.
This study investigates the effects of spraying pressure and slurry feed rate on the properties of granulated eggshell powder produced by spray freeze drying. A full factorial design is employed to systematically evaluate the main and interaction effects of spraying pressure and slurry feed rate on particle size and flowability of the granulated powder.
2. Experimental Procedure
2.1. Spray Freeze Granulation
Commercially sourced eggshell powder (Natures Vitality Farms, Lima, OH, USA) was used as the raw material in this study. The spray freeze drying granulation was performed following the methodology described by Arman et al. [37]. Briefly, the granulation method consisted of three main steps: slurry preparation, spray freezing, and freeze drying, as shown in Figure 1. In Figure 1a, the slurry was prepared by mixing 50 g of fine eggshell powder, 52 g of deionized (DI) water, 1 g of carboxylic acid dispersant (Dolapix CA, ZSCHIMMER & SCHWARZ, Lahnstein, Germany), and 104 g of alumina balls of 5 mm in diameter. The resulting slurry had a solid loading of approximately 30 vol.%. The mixture was ball milled (Jar Rolling Mills, Paul O. Abbe, Wood Dale, IL, USA) at 180 rpm for 12 h and then passed through a 250-µm sieve to remove large agglomerates. In Figure 1b, the slurry was supplied to the atomizing nozzle using a peristaltic pump (323S/D, Watson-Marlow, Falmouth, UK) and atomized with compressed air using an LS-2 spray-freezing system (PowderPro AB, Göteborg, Sweden). The spraying pressure and slurry feed rate were varied according to the experimental conditions described in Section 2.3. The resulting droplets were sprayed into liquid nitrogen, where they rapidly froze to form frozen granules. Finally, as shown in Figure 1c, the frozen granules were freeze dried at a temperature of −50 °C and a pressure of 1.5 mbar for 12 h to remove water by sublimation, resulting in granulated powder.
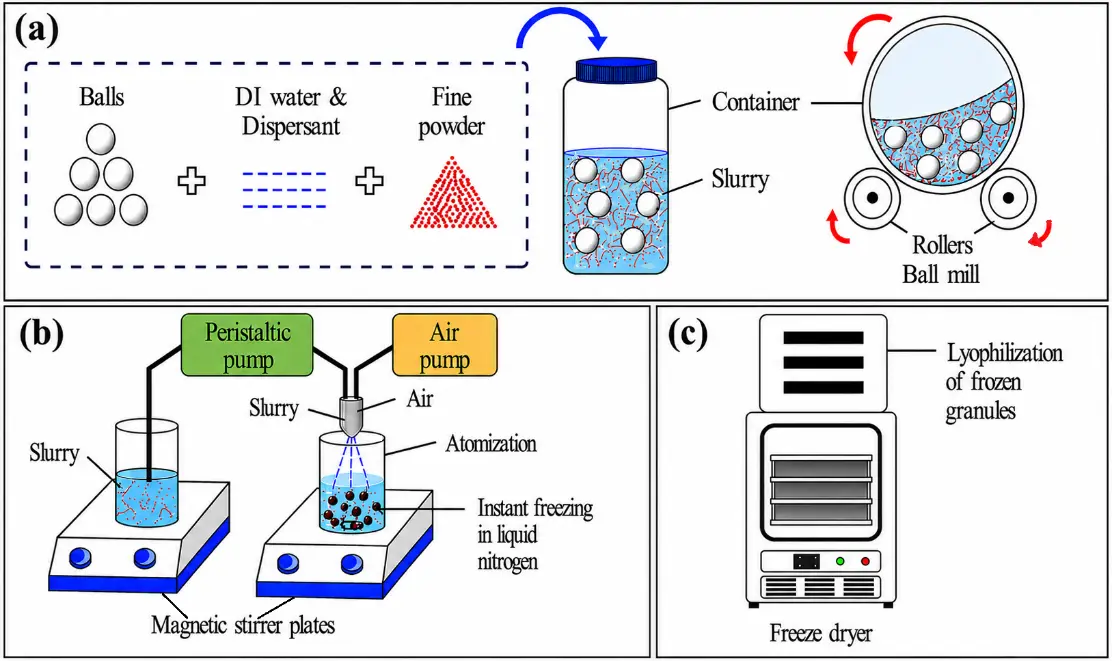
Figure 1. Schematic diagram of spray freeze drying granulation: (a) slurry preparation; (b) spray freezing; and (c) freeze drying. In (a), the blue arrow indicates loading of the slurry components into the container, and the red arrows indicate the rotation directions during ball milling.
2.2. Determination of the Feasible Ranges of Spraying Pressure and Slurry Feed Rate
One-factor-at-a-time experiments were conducted to determine the feasible ranges of spraying pressure and slurry feed rate. First, the slurry feed rate was maintained at 0.5 L/h while the spraying pressure varied from 0.1 to 0.6 bar. Subsequently, the spraying pressure was fixed at 0.3 bar, and the slurry feed rate was varied over the range of 0.25 to 2.5 L/h. The morphology of the resulting granulated powders was examined using scanning electron microscopy (SEM). These preliminary experiments enabled the identification of feasible ranges for spraying pressure and slurry feed rate that produce spherical granules. The identified ranges were then used to define the factor levels in the design of experiments.
2.3. Design of Experiments (DoE)
Based on the feasible ranges identified through the experiments described in Section 2.2, a 32 full factorial design was employed to investigate the main and interaction effects of spraying pressure and slurry feed rate on the properties of the granulated powder. Spraying pressure and slurry feed rate were selected as the two process variables. Three levels were selected for each variable. Table 2 presents the process variables and their corresponding levels.
Table 2. Process variables and their corresponding levels.
|
Process Variable (Unit) |
Levels |
|---|---|
|
Spraying Pressure (bar) |
0.1, 0.3, 0.5 |
|
Slurry Feed Rate (L/h) |
0.5, 1.0, 1.5 |
The full factorial design consisted of nine experimental conditions. Two separate experimental runs were performed under each condition, resulting in a total of eighteen runs. The experimental run order was randomized using Minitab Statistical Software, version 19.
Particle size, expressed as mean particle diameter, and powder flowability, expressed as the Hausner ratio, were selected as the primary response variables. Repose angle was evaluated separately as an additional measure of powder flowability. The shape of the granules was also qualitatively examined using scanning electron microscopy (SEM). However, granule shape was not included as a numerical response variable in the statistical analysis.
2.3.1. Measurement of Response Variables
The shape of the granulated powder was examined using a field-emission scanning electron microscope (FE-SEM, JSM-7500, JEOL, Tokyo, Japan). Before imaging, the powder samples were coated with an approximately 5-nm-thick platinum layer. SEM images were obtained for granulated powders produced under each experimental condition.
The particle size of the granulated powder was measured using a laser diffraction particle size analyzer (Partica LA-960, Horiba, Kyoto, Japan). The particle size was expressed as the mean particle diameter and used as the response variable in the statistical analysis.
The Hausner ratio was calculated from the apparent and tap densities. Apparent density was measured using a Hall flowmeter equipped with a Carney funnel and a cylindrical cup with a volume of 25 cm3, following ASTM B212-17 [38]. The empty cylindrical cup was first weighed. The granulated powder was then poured through the Carney funnel into the cup until the powder overflowed. Excess powder was carefully leveled using a spatula, and the cup containing the powder was weighed. The apparent density was calculated by dividing the mass of powder in the cup by the cup volume. Tap density was measured using a tap density tester (DY-100A, Daho Meter, Dongguan, China). A 30 g sample of granulated powder was placed in a 100 mL glass cylinder and tapped 3000 times with a 3 mm tap stroke, following ASTM B527-23 [39]. The final tapped volume was recorded, and the tap density was calculated by dividing the powder mass by the final tapped volume. The Hausner ratio was calculated using Equation (1):
The apparent density and tap density measurements were performed three times for each sample, and the Hausner ratio was used as the powder flowability primary response variable. The repose angle was measured from the captured powder-pile images using ImageJ software.
2.3.2. Statistical Analysis
Minitab Statistical Software, version 19, was used to analyze the experimental results. A two-way analysis of variance (ANOVA) was performed separately for the mean particle diameter, Hausner ratio, and repose angle. Furthermore, the assumptions of conducting ANOVA were evaluated using residual diagnostic plots. Residual normality was assessed using normal probability plots, while homoscedasticity was evaluated using residual versus fitted value plots. The statistical model included the main effects of spraying pressure and slurry feed rate, and their interaction effect.
Statistical significance was evaluated at a significance level of α = 0.05. An effect was considered statistically significant when its p-value was less than 0.05. Main effect plots were generated to illustrate the individual effects of spraying pressure and slurry feed rate on each response variable. Interaction plots were used to determine whether the effect of one variable depended on the level of the other variable. When a statistically significant interaction was identified, the response was interpreted primarily based on the interaction effect rather than on the main effects separately.
3. Results and Discussion
3.1. Feasible Ranges of Spraying Pressure and Slurry Feed Rate
Figure 2 shows the SEM images of granulated powder produced at a constant slurry feed rate of 0.5 L/h while varying the spraying pressure from 0.1 to 0.6 bar. At lower spraying pressures, particularly at 0.1 bar, relatively larger granules were produced. However, slurry sometimes accumulated at the nozzle tip and caused partial clogging, resulting in the formation of large chunks. As the spraying pressure increased to 0.2 and 0.3 bar, the granules became more discrete and rounded. At 0.4 and 0.5 bar, the shape uniformity of the granules decreased, and more irregular granules were observed. At 0.6 bar, proper granules were not formed.
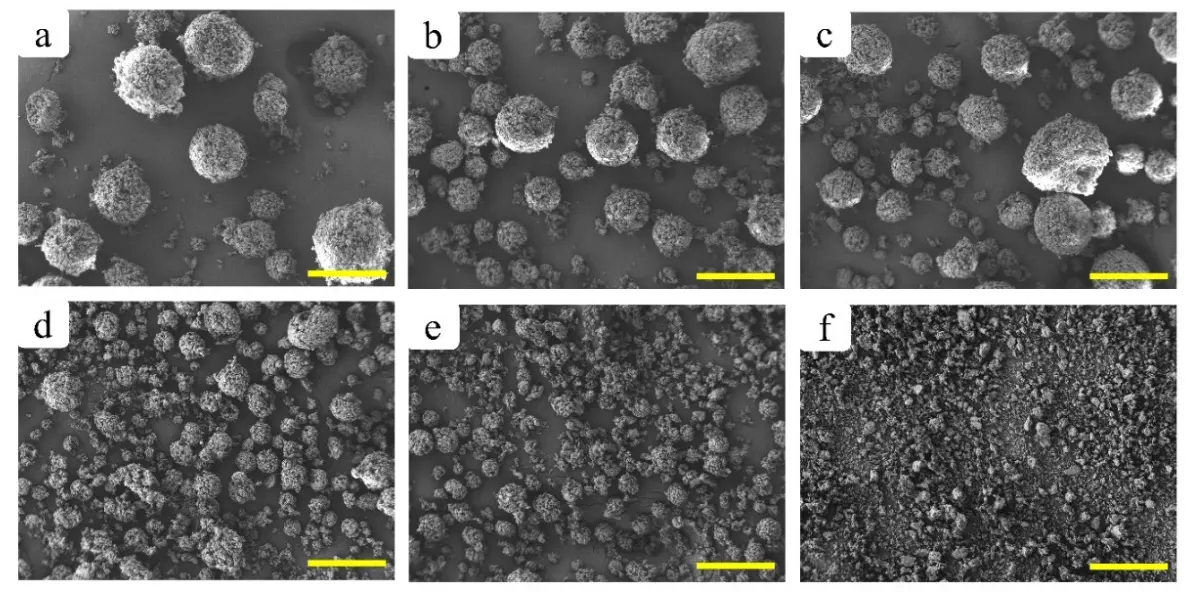
Figure 2. SEM images of granulated powder produced at a constant slurry feed rate of 0.5 L/h under different spraying pressures: (a) 0.1 bar, (b) 0.2 bar, (c) 0.3 bar, (d) 0.4 bar, (e) 0.5 bar, and (f) 0.6 bar. (Scale: 100 µm).
Figure 3 shows SEM images of granulated powder produced at a constant spraying pressure of 0.3 bar, with the slurry feed rate varied from 0.25 to 2.5 L/h. Within the range of 0.25 to 1.0 L/h, the particles appeared as relatively discrete granules with more rounded shapes. When the slurry feed rate increased to 1.5 and 2.0 L/h, more irregular granules were observed. At the slurry feed rate of 2.5 L/h, the granules appeared highly irregular.
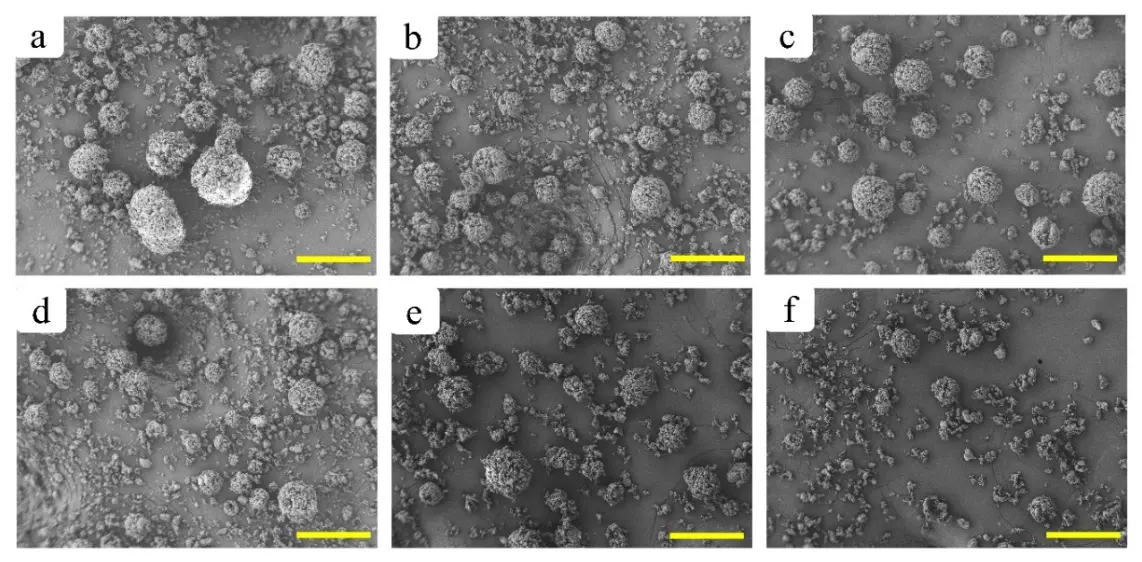
Figure 3. SEM images of granulated powder produced at a constant spraying pressure of 0.3 bar under different slurry feed rates: (a) 0.25 L/h, (b) 0.5 L/h, (c) 1.0 L/h, (d) 1.5 L/h, (e) 2.0 L/h, and (f) 2.5 L/h (Scale: 100 µm).
Based on these observations, spraying pressures between 0.1 and 0.5 bar and slurry feed rates between 0.25 and 1.5 L/h were selected as the feasible operating ranges.
3.2. Effects of Spraying Pressure and Slurry Feed Rate
Figure 4 shows representative images of the resulting granulated powders. The experimental matrix of process variables and measured response variables is summarized in Table 3.
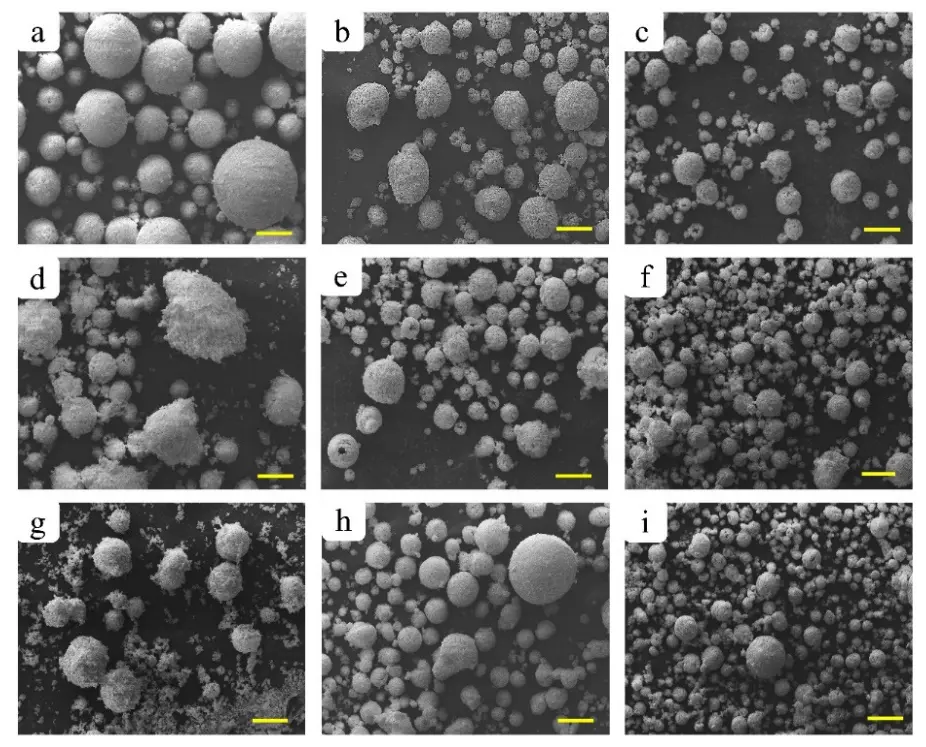
Figure 4. SEM images of granulated powder produced under different combinations of spraying pressure and slurry feed rate according to the full factorial design: (a) 0.1 bar, 0.5 L/h; (b) 0.1 bar, 1.0 L/h; (c) 0.1 bar, 1.5 L/h; (d) 0.3 bar, 0.5 L/h; (e) 0.3 bar, 1.0 L/h; (f) 0.3 bar, 1.5 L/h; (g) 0.5 bar, 0.5 L/h; (h) 0.5 bar, 1.0 L/h; and (i) 0.5 bar, 1.5 L/h (Scale: 100 µm).
Table 3. The experimental matrix of process variables and measured response variables.
|
Standard Order |
Process Variable |
Response Variable |
||
|---|---|---|---|---|
|
Spraying Pressure (bar) |
Slurry Feed Rate (L/h) |
Particle Size (Mean Particle Diameter (µm)) |
Powder Flowability (Hausner Ratio) |
|
|
14 |
0.3 |
1.0 |
40.18 |
1.60 |
|
3 |
0.1 |
1.5 |
22.85 |
1.72 |
|
17 |
0.5 |
1.0 |
15.02 |
1.65 |
|
9 |
0.5 |
1.5 |
14.57 |
1.57 |
|
10 |
0.1 |
0.5 |
32.65 |
1.52 |
|
18 |
0.5 |
1.5 |
15.52 |
1.74 |
|
6 |
0.3 |
1.5 |
30.52 |
1.65 |
|
11 |
0.1 |
1.0 |
29.04 |
1.63 |
|
4 |
0.3 |
0.5 |
19.63 |
1.66 |
|
16 |
0.5 |
0.5 |
11.82 |
1.81 |
|
7 |
0.5 |
0.5 |
9.39 |
1.80 |
|
12 |
0.1 |
1.5 |
26.13 |
1.77 |
|
1 |
0.1 |
0.5 |
66.48 |
1.53 |
|
2 |
0.1 |
1.0 |
53.21 |
1.63 |
|
5 |
0.3 |
1.0 |
47.59 |
1.60 |
|
13 |
0.3 |
0.5 |
43.68 |
1.66 |
|
8 |
0.5 |
1.0 |
16.60 |
1.66 |
|
15 |
0.3 |
1.5 |
54.16 |
1.65 |
3.2.1. Effects of Spraying Pressure and Slurry Feed Rate on Particle Size
Table 4 presents the ANOVA results for mean particle diameter. The analysis shows that spraying pressure has a statistically significant effect on particle size (p = 0.011), whereas slurry feed rate is not significant (p = 0.703) within the investigated range. In addition, the interaction between spraying pressure and slurry feed rate is not statistically significant (p = 0.400). These results indicate that spraying pressure is the dominant variable controlling particle size in the spray freeze granulation.
Table 4. ANOVA for mean particle diameter.
|
Source |
Degrees of Freedom |
Adjusted Sum of Squares |
Adjusted Mean Square |
F-Value |
p-Value |
|---|---|---|---|---|---|
|
Spraying Pressure (bar) |
2 |
2507.1 |
1253.55 |
7.67 |
0.011 |
|
Slurry Feed Rate (L/h) |
2 |
119.7 |
59.87 |
0.37 |
0.703 |
|
Pressure × Feed Rate |
4 |
740.4 |
185.10 |
1.13 |
0.400 |
|
Error |
9 |
1470.4 |
163.38 |
||
|
Total |
17 |
4837.7 |
The residual diagnostic plots for the mean particle diameter ANOVA model are shown in Figure 5. The residuals in the normal probability plot fell reasonably close to a straight line, indicating no substantial departure from normality. The residual versus fitted value plot showed no distinct funnel-shaped pattern, although the residual spread was somewhat greater at higher fitted values [40,41].
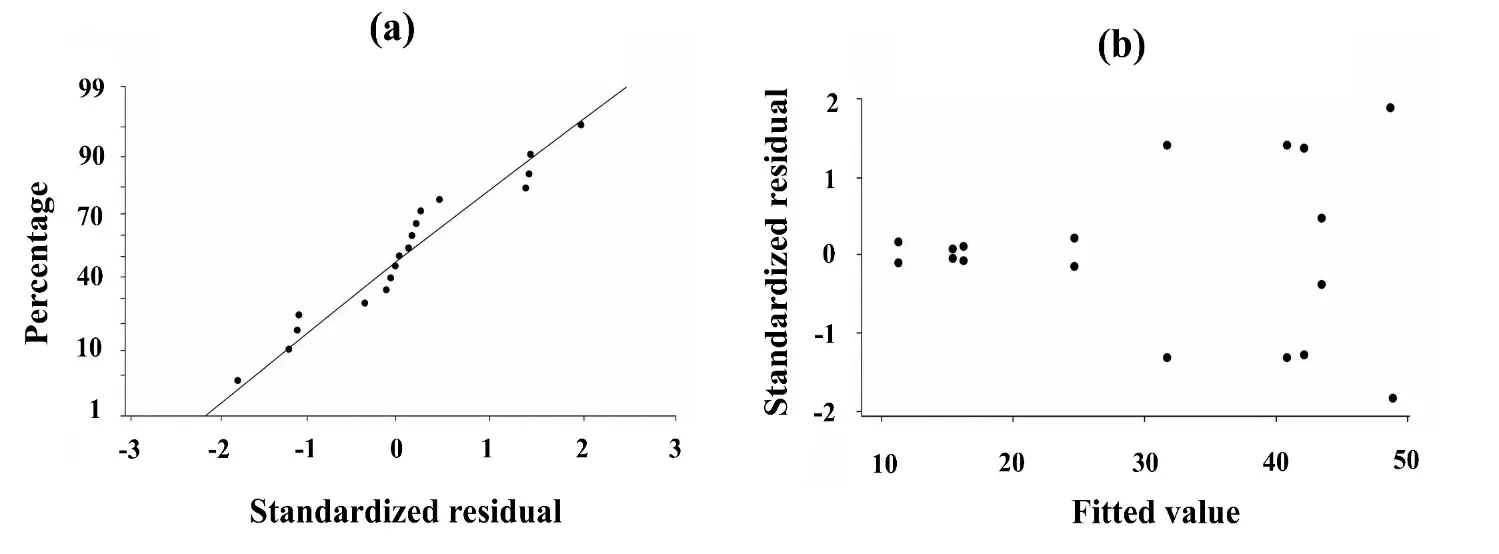
Figure 5. Residual diagnostic plots for the ANOVA model of mean particle diameter (µm): (a) normal probability plot and (b) residual versus fitted value plot.
In Figure 6, the experimental variability in the mean particle diameter for different combinations of spraying pressure and slurry feed rate is shown as mean and range. Larger variability was observed for several conditions at spraying pressures of 0.1 bar and 0.3 bar, whereas the measurements at spraying pressure of 0.5 bar showed relatively small variability across all three slurry feed rates. Despite the variability, the mean particle diameter remained consistently lower at a spraying pressure of 0.5 bar.
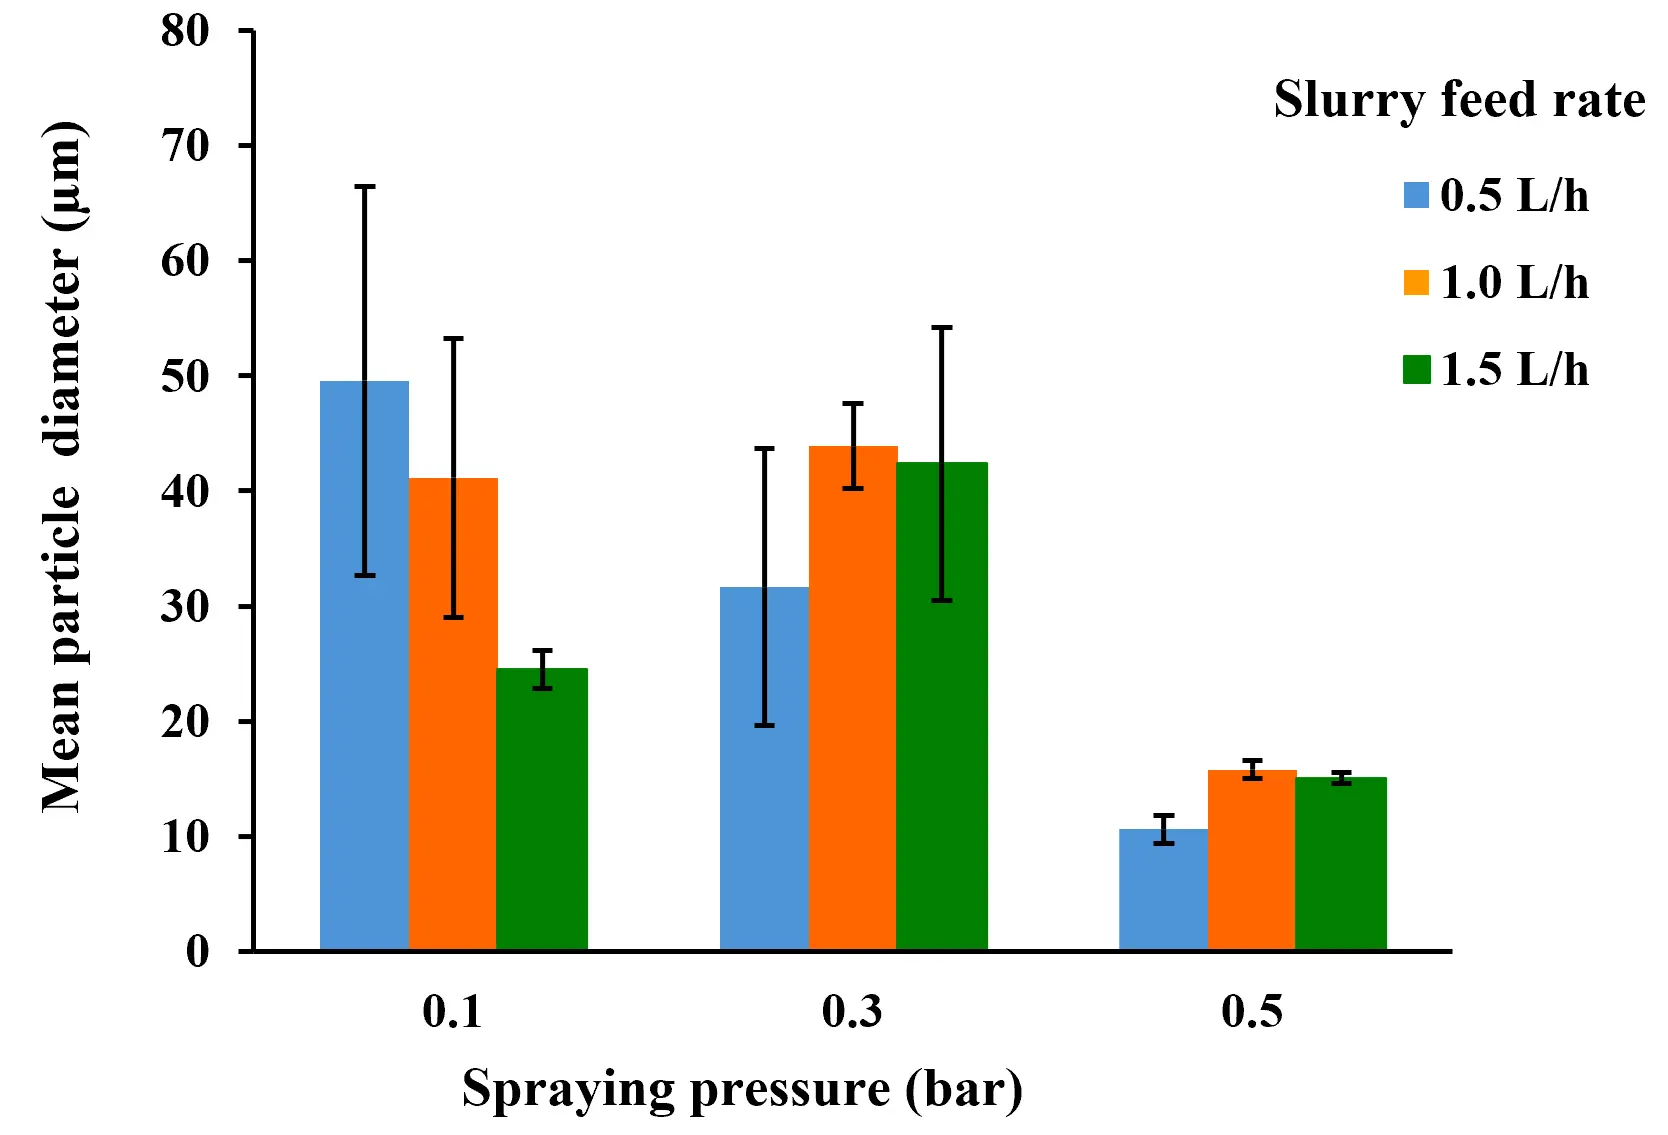
Figure 6. The means and ranges of particle diameter for different combinations of spraying pressure and slurry feed rate.
The main-effect plot in Figure 7a shows that the mean particle diameter remained relatively similar at 0.1 and 0.3 bar but decreased sharply at 0.5 bar, indicating that the highest spraying pressure leads to smaller granules. In contrast, the variation in particle size with slurry feed rate is relatively small, and no consistent trend was observed with increasing slurry feed rate (Figure 7b).
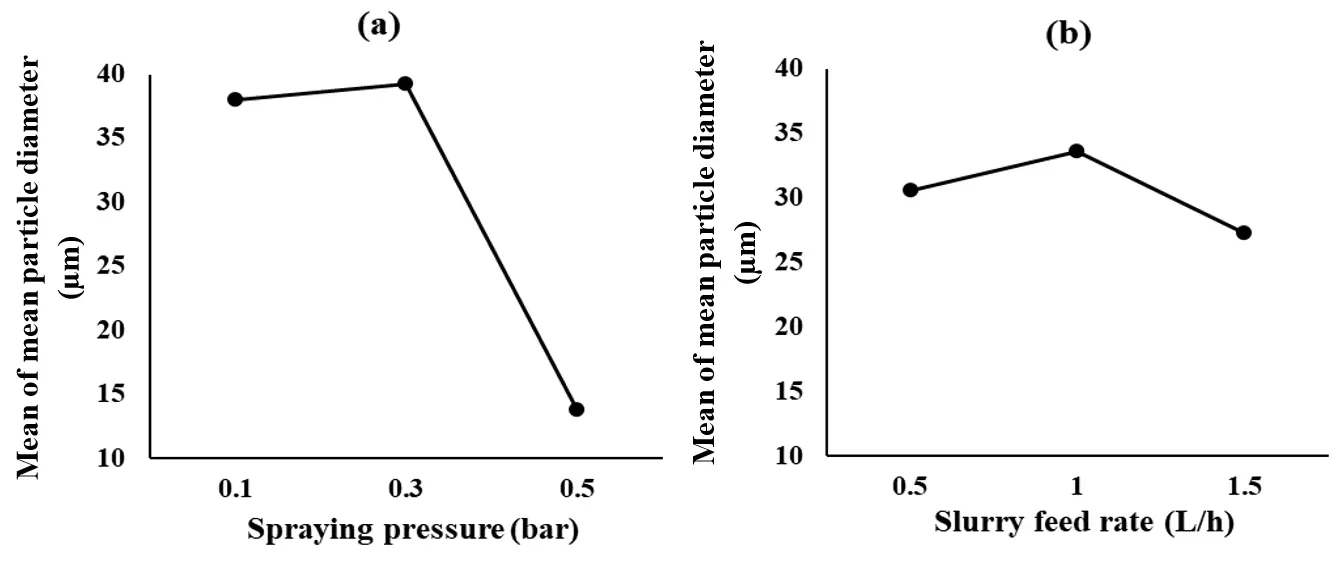
Figure 7. Main effect plots of (a) spraying pressure and (b) slurry feed rate on mean particle diameter.
The interaction plot (Figure 8) shows that the lines corresponding to different slurry feed rates are largely parallel, indicating a weak interaction between spraying pressure and slurry feed rate. Although slight deviations from parallelism are observed, particularly at lower spraying pressures, these differences are relatively small and do not indicate a strong combined effect of the two factors. This observation is consistent with the ANOVA results, which show that the interaction term is not statistically significant.
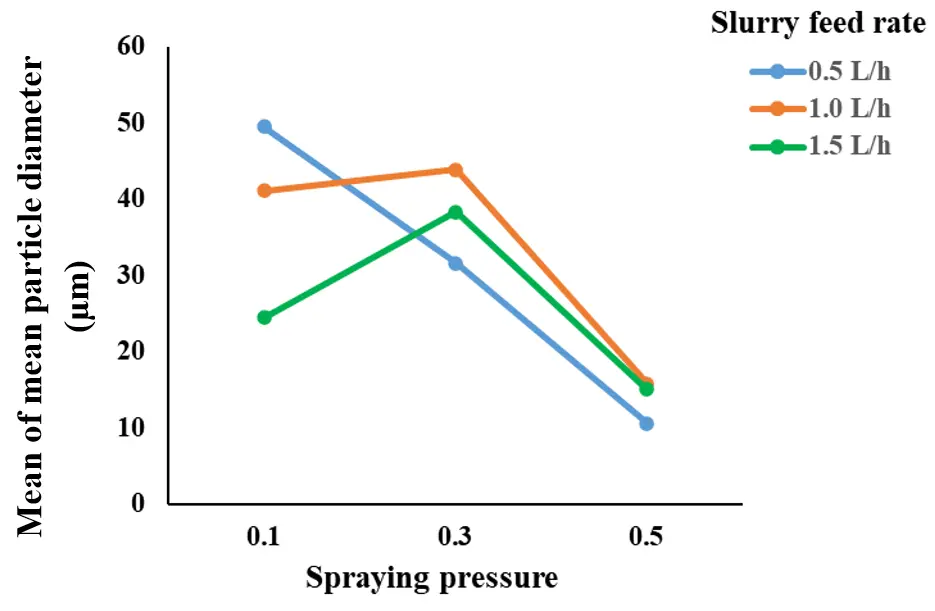
The significant effect of spraying pressure on the particle size of granules can be explained by its direct influence on droplet formation during atomization. Increasing spraying pressure increases the dynamic forces exerted by the atomizing air on the slurry, resulting in smaller droplets [42]. Because the frozen droplets subsequently form the granules, the formation of smaller droplets at higher spraying pressures results in smaller granules. This is consistent with the observed decrease in the mean particle diameter. In contrast, within the investigated range of 0.5–1.5 L/h, the slurry feed rate did not significantly affect the particle size of granules. The slurry composition and preparation procedure were kept the same throughout the experiments.
Reported studies [36,43,44] have shown that increasing spraying or atomization pressure generally produces smaller granules. Du et al. [36] reported that increasing spraying pressure resulted in smaller spray-freeze-granulated alumina granules. Similarly, Yu et al. [43] observed that the particle size of spray-dried alumina decreased with increasing atomization pressure, while Schappo et al. [44] reported smaller spray-dried hydroxyapatite particles at higher atomization pressure. These findings are consistent with the present study, in which increasing spraying pressure resulted in a significant decrease in particle size of the granulated eggshell powder.
3.2.2. Effects of Spraying Pressure and Slurry Feed Rate on Powder Flowability
Table 5 presents the ANOVA results for powder flowability, expressed as the Hausner ratio, obtained at different spraying pressures and slurry feed rates. The ANOVA results indicate that spraying pressure has a statistically significant effect on powder flowability (p = 0.027), while slurry feed rate alone is not significant (p = 0.125). However, the interaction between spraying pressure and slurry feed rate is highly significant (p = 0.002), indicating that the combined effect of these two variables plays a critical role in determining powder flowability.
Table 5. ANOVA for the Hausner ratio.
|
Source |
Degrees of Freedom |
Adjusted Sum of Squares |
Adjusted Mean Square |
F-Value |
p-Value |
|---|---|---|---|---|---|
|
Spraying Pressure (bar) |
2 |
0.0196 |
0.0098 |
5.57 |
0.027 |
|
Slurry Feed Rate (L/h) |
2 |
0.0093 |
0.0047 |
2.64 |
0.125 |
|
Pressure × Feed Rate |
4 |
0.0732 |
0.0183 |
10.40 |
0.002 |
|
Error |
9 |
0.0159 |
0.0018 |
||
|
Total |
17 |
0.1181 |
The residual diagnostic plots for the Hausner ratio ANOVA model are shown in Figure 9. The normal probability plot showed some deviation from a straight-line pattern, particularly at the extreme residual values. However, the residual versus fitted value plot did not exhibit a distinct funnel-shaped pattern or a systematic change in residual spread across the fitted values.
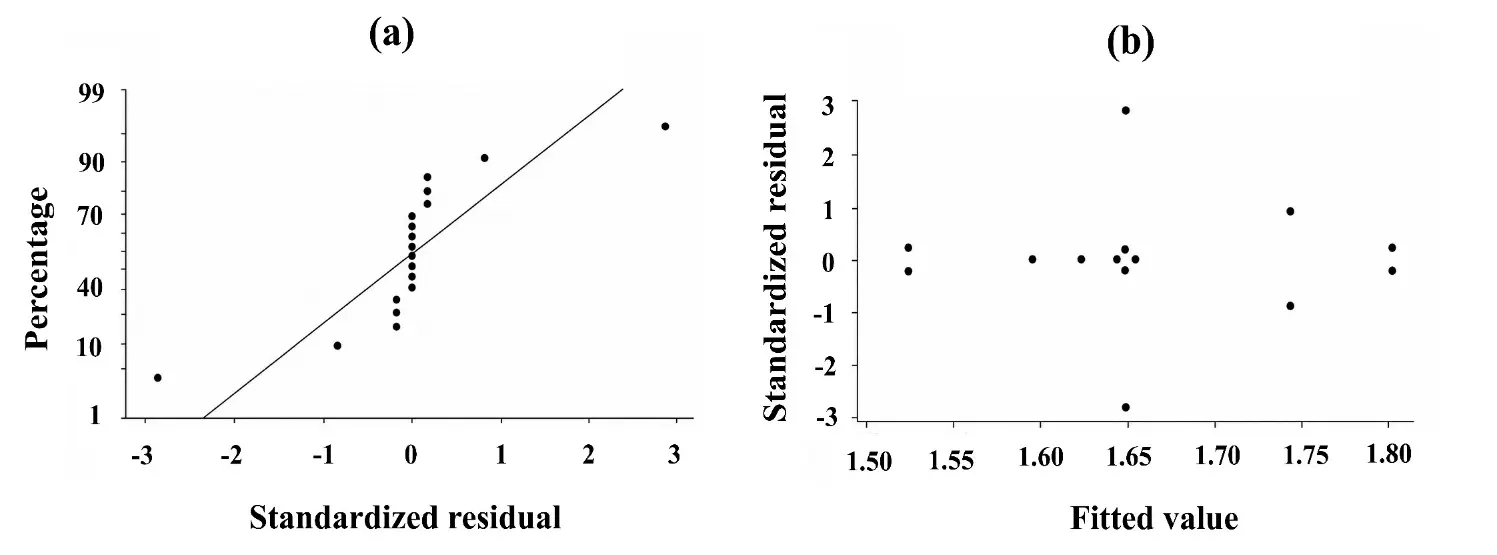
Figure 9. Residual diagnostic plots for the ANOVA model of Hausner ratio: (a) normal probability plot and (b) residual versus fitted value plot.
Figure 10 shows the experimental variability in the Hausner ratio for different combinations of spraying pressure and slurry feed rate as mean and range. Relatively small variability was observed across most experimental conditions, whereas noticeably greater variability was observed at 0.5 bar and 1.5 L/h. Overall, the variability depended on the specific combination of spraying pressure and slurry feed rate.
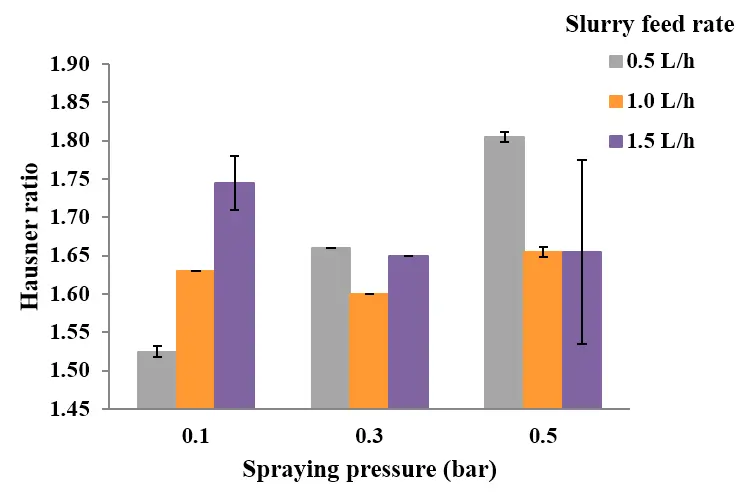
Figure 10. Means and ranges of the Hausner ratio for different combinations of spraying pressure and slurry feed rate.
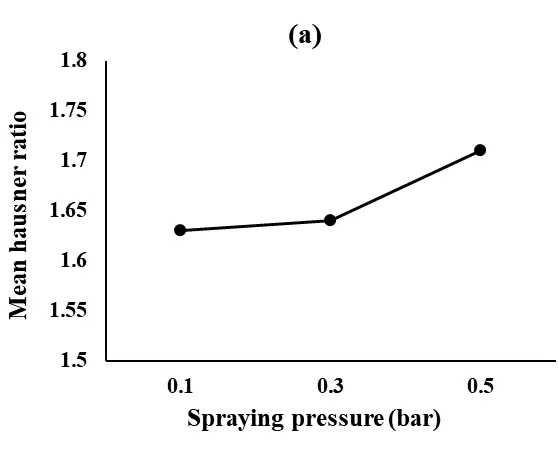
The main effect plots (Figure 11) show that the Hausner ratio increases with increasing spraying pressure, indicating a gradual reduction in powder flowability at higher pressures. In contrast, the variation in the Hausner ratio with slurry feed rate is relatively small. However, because the interaction between spraying pressure and slurry feed rate is statistically significant, these marginal trends should be interpreted alongside the interaction effect shown in Figure 12.
 |
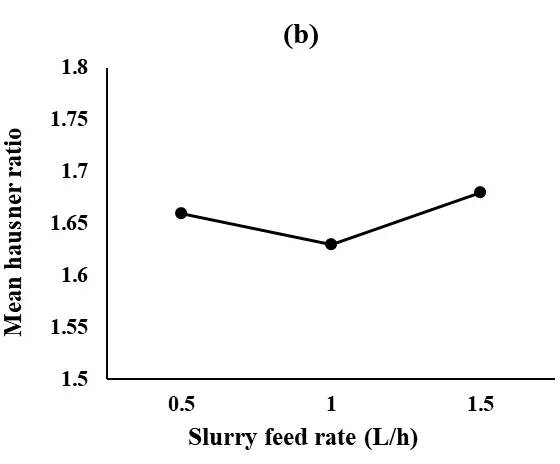 |
Figure 11. Main effect plots of (a) spraying pressure and (b) slurry feed rate on mean Hausner ratio.
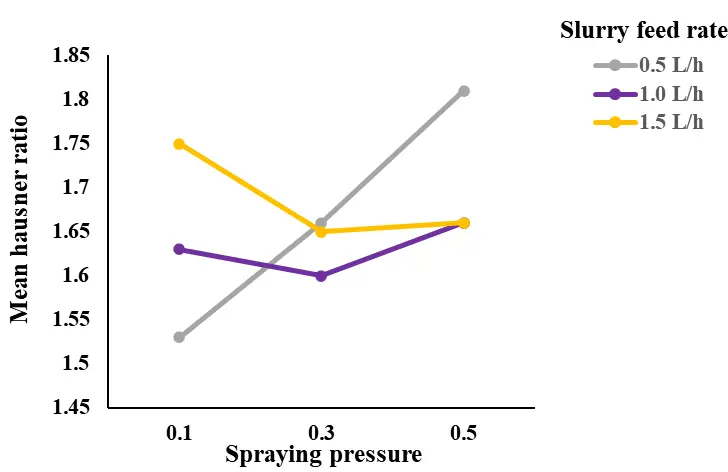
The interaction plot (Figure 12) shows non-parallel lines, indicating a significant interaction between spraying pressure and slurry feed rate. At 0.1 bar, the Hausner ratio increased with increasing slurry feed rate, indicating reduced powder flowability. At 0.3 bar, only small changes in the Hausner ratio were observed. At 0.5 bar, increasing the slurry feed rate from 0.5 to 1.0 L/h decreased the Hausner ratio, while a further increase to 1.5 L/h caused little additional change. This indicates that the effect of slurry feed rate on powder flowability depends on the level of spraying pressure.
Reported studies [36,37] have shown that spray freeze granulation can improve the flowability of fine ceramic powders by converting them into larger granules. For example, Du et al. [36] reported a significant improvement in the flowability of granulated alumina compared with the raw nano powder. Similarly, the authors’ previous feasibility study [37] showed that spray freeze granulation produced more spherical eggshell granules with improved flowability. The present study extends these findings by showing that the flowability of granulated eggshell powder depends on the specific combination of spraying pressure and slurry feed rate, as indicated by the significant interaction effect of these two variables.
In addition to the Hausner ratio, the repose angle of the granulated powder was measured. Table 6 presents the repose angle values on all granulated powder produced under the nine conditions (two experimental runs under each condition), while Figure 13 shows the corresponding repose angle images. At a spraying pressure of 0.5 bar and a slurry feed rate of 0.5 L/h, the repose angle was the highest, with values of 49.5° and 50.1° for the two replications, indicating relatively poor powder flowability. In contrast, at a spraying pressure of 0.1 bar and a slurry feed rate of 0.5 L/h, lower repose angles of 26.4° and 25.2° were obtained, indicating better flowability. These observations are consistent with the Hausner ratio results.
Table 6. The repose angle values (°) produced under the nine conditions (with two experimental runs under each condition).
|
Spraying Pressure (bar) |
Slurry Feed Rate (L/h) |
Repose Angle |
|
|---|---|---|---|
|
0.1 |
0.5 |
25.2 |
26.4 |
|
0.1 |
1.0 |
34.4 |
38.4 |
|
0.1 |
1.5 |
41.7 |
42.9 |
|
0.3 |
0.5 |
37.9 |
38.5 |
|
0.3 |
1.0 |
31.4 |
32.0 |
|
0.3 |
1.5 |
24.1 |
31.8 |
|
0.5 |
0.5 |
49.5 |
50.1 |
|
0.5 |
1.0 |
31.0 |
35.5 |
|
0.5 |
1.5 |
26.3 |
29.5 |
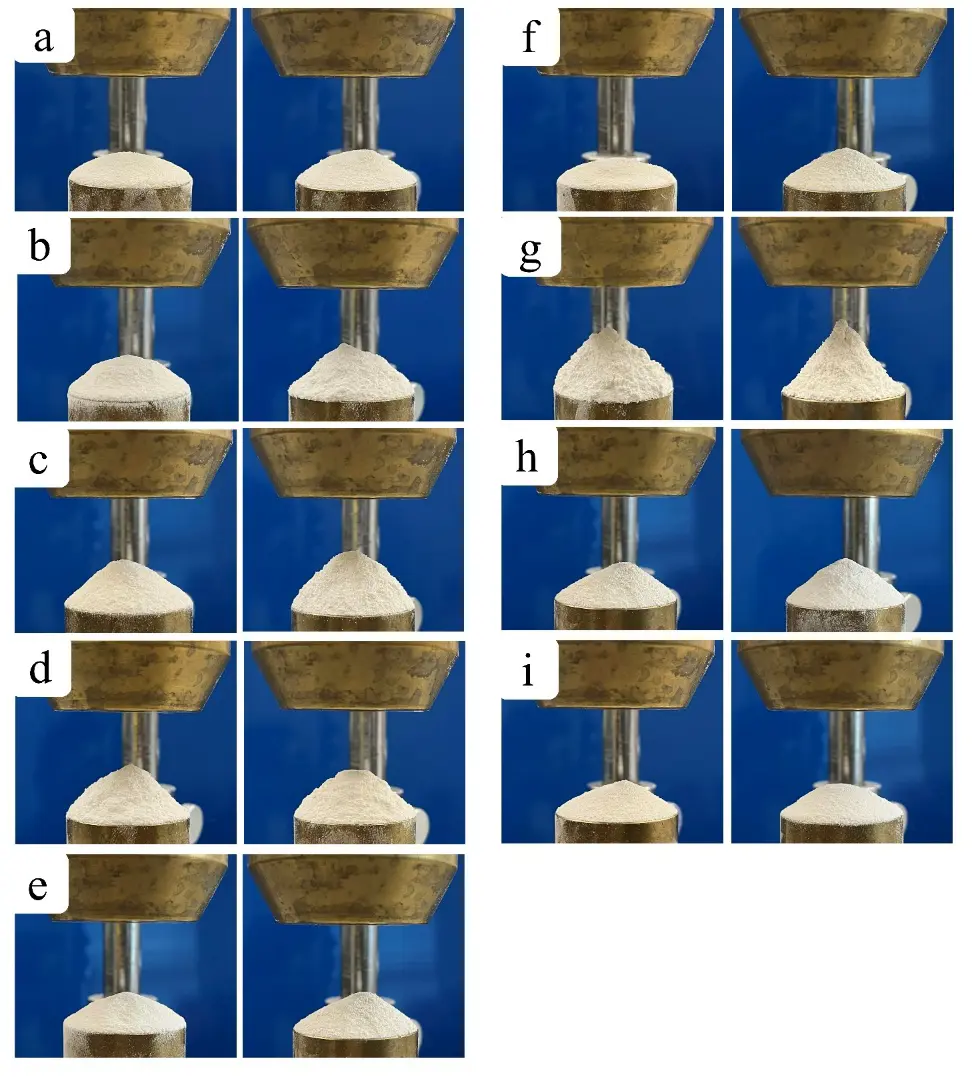
Figure 13. Repose angle of granulated powder produced under different combinations of spraying pressure and slurry feed rate: (a) 0.1 bar, 0.5 L/h; (b) 0.1 bar, 1.0 L/h; (c) 0.1 bar, 1.5 L/h; (d) 0.3 bar, 0.5 L/h; (e) 0.3 bar, 1.0 L/h; (f) 0.3 bar, 1.5 L/h; (g) 0.5 bar, 0.5 L/h; (h) 0.5 bar, 1.0 L/h; and (i) 0.5 bar, 1.5 L/h.
Table 7 presents the ANOVA results for repose angle. The ANOVA results indicate that both spraying pressure and slurry feed rate have statistically significant effects on repose angle, with p-values of 0.040 and 0.013, respectively. In addition, the interaction between spraying pressure and slurry feed rate is highly significant (p < 0.001), indicating that the combined effect of these two variables plays a critical role in determining powder flowability. This result is consistent with the Hausner ratio analysis, which also showed a significant interaction between spraying pressure and slurry feed rate.
Table 7. ANOVA for repose angle.
|
Source |
Degrees of Freedom |
Adjusted Sum of Squares |
Adjusted Mean Square |
F-Value |
p-Value |
|---|---|---|---|---|---|
|
Spraying Pressure (bar) |
2 |
57.643 |
28.822 |
4.69 |
0.040 |
|
Slurry Feed Rate (L/h) |
2 |
90.943 |
45.472 |
7.40 |
0.013 |
|
Pressure × Feed Rate |
4 |
816.933 |
204.233 |
33.22 |
<0.001 |
|
Error |
9 |
55.325 |
6.147 |
||
|
Total |
17 |
1020.845 |
The residual diagnostic plots for the repose angle ANOVA model are shown in Figure 14. The residuals in the normal probability plot fell reasonably close to a straight line, indicating no substantial departure from normality. The residual versus fitted value plot showed no distinct systematic or funnel-shaped pattern, with the residuals distributed on both sides of zero across the range of fitted values.
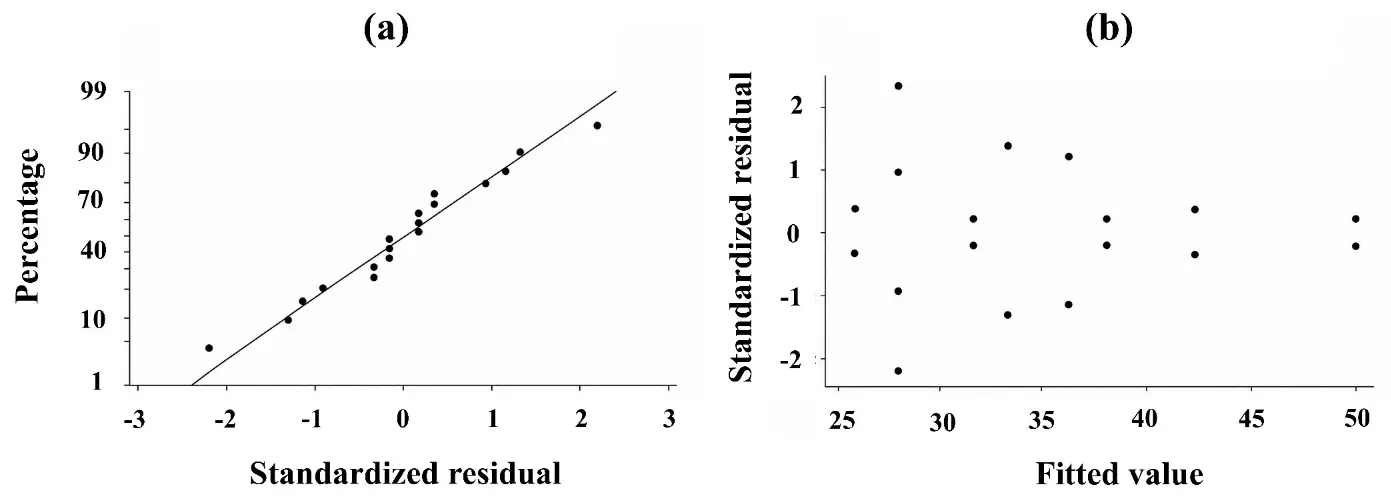
Figure 14. Residual diagnostic plots for the ANOVA model of repose angle: (a) normal probability plot and (b) residual versus fitted value.
4. Conclusions
This study systematically investigated the effects of spraying pressure and slurry feed rate on the particle size and flowability of granulated eggshell powder produced by spray freeze drying. Preliminary experiments identified spraying pressures of 0.1–0.5 bar and slurry feed rates of 0.25–1.5 L/h as feasible ranges for producing discrete and relatively spherical granules. Within the factorial design, spraying pressure was the dominant variable controlling particle size, whereas slurry feed rate and the pressure–feed rate interaction were not significant. Powder flowability was affected by the combined effects of spraying pressure and slurry feed rate. Both the Hausner ratio and repose angle showed a significant interaction between these two variables, indicating that the effect of slurry feed rate changed with spraying pressure.
From a binder jetting perspective, the particle size and flowability of the granulated powder can influence powder dispensing, powder spreading, and powder-bed formation, as well as the quality of printed parts. Improved powder flowability may facilitate powder dispensing and spreading and promote the formation of a more uniform powder bed. Particle size, however, involves a trade-off between flowability and sinterability, as larger particles generally exhibit better flowability while finer particles can provide greater sinterability. Therefore, particle size and flowability should be considered together when selecting granulation conditions. In the present study, increasing spraying pressure produced smaller granules but did not consistently improve powder flowability. Future work will focus on evaluating the performance (including powder spreading and green density of printed samples) of the granulated eggshell powder in binder jetting additive manufacturing through printing experiments.
Statement of the Use of Generative AI and AI-Assisted Technologies in the Writing Process
During the preparation of this work the author(s) used ChatGPT to improve language and readability. After using this tool/service, the author(s) reviewed and edited the content as needed and took full responsibility for the content of the publication.
Acknowledgments
The authors would like to acknowledge that the scanning electron microscopy (SEM) and particle size distribution (PSD) of this work were performed at the Texas A&M University Materials Characterization Core Facility (RRID:SCR_022202). The authors extend their special thanks to Dr. Yordanos Bisrat for assistance with SEM and to Dr. Wilson Serem for assistance with PSD analysis.
Author Contributions
Conceptualization, M.S.A. and Z.P.; Methodology, M.S.A.; Formal Analysis, M.S.A.; Investigation, M.S.A., F.K. and M.M.P.; Resources, Z.P.; Data Curation, M.S.A.; Writing—Original Draft Preparation, M.S.A.; Writing—Review & Editing, M.S.A., F.K., M.M.P. and Z.P.; Supervision, Z.P. All authors have read and agreed to the submitted version of the manuscript.
Ethics Statement
Not applicable.
Informed Consent Statement
Not applicable.
Data Availability Statement
Data will be made available upon request.
Funding
This work is partially supported by the Mike and Sugar Barnes Professorship II.
Declaration of Competing Interest
The authors declare that there are no conflicts of interest in connection with the work submitted.
References
-
Zhu B, Li R, Yuan T, Li W, Cai D, Kang N. Metal binder jetting additive manufacturing: An overview of the process, materials and reinforcement methods. J. Alloys Compd. 2025, 1037, 182196. DOI:10.1016/j.jallcom.2025.182196 [Google Scholar]
-
Khan F, Pei Z, Arman MS, Kuntzendorf S, Kao Y-T. Effects of Dispense Delay and Recoat Speed on Green Part Density and Powder Bed Density in Binder Jetting Additive Manufacturing. J. Manuf. Mater. Process. 2026, 10, 80. DOI:10.3390/jmmp10030080 [Google Scholar]
-
Mehrabi M, Gardy J, Talebi FA, Farshchi A, Hassanpour A, Bayly AE. An investigation of the effect of powder flowability on the powder spreading in additive manufacturing. Powder Technol. 2023, 413, 117997. DOI:10.1016/j.powtec.2022.117997 [Google Scholar]
-
Mussatto A, Groarke R, O’Neill A, Obeidi MA, Delaure Y, Brabazon D. Influences of powder morphology and spreading parameters on the powder bed topography uniformity in powder bed fusion metal additive manufacturing. Addit. Manuf. 2021, 38, 101807. DOI:10.1016/j.addma.2020.101807 [Google Scholar]
-
Miyanaji H, Rahman KM, Da M, Williams CB. Effect of fine powder particles on quality of binder jetting parts. Addit. Manuf. 2020, 36, 101587. DOI:10.1016/j.addma.2020.101587 [Google Scholar]
-
Barthel B, Janas F, Wieland S. Powder condition and spreading parameter impact on green and sintered density in metal binder jetting. Powder Metall. 2021, 64, 378–386. DOI:10.1080/00325899.2021.1912923 [Google Scholar]
-
Seikh Z, Mallick MA, Gazi AS, Sekh M. An Overview of Utilization of Egg Shell Wastes: A Transformation from Waste to Wealth. J. Inst. Eng. India Ser. D 2026, 107, 1471–1485. DOI:10.1007/s40033-024-00856-9 [Google Scholar]
-
Baláž M, Boldyreva EV, Rybin D, Pavlović S, Rodríguez-Padrón D, Mudrinić T, et al. State-of-the-Art of Eggshell Waste in Materials Science: Recent Advances in Catalysis, Pharmaceutical Applications, and Mechanochemistry. Front Bioeng. Biotechnol. 2021, 8, 612567. DOI:10.3389/fbioe.2020.612567 [Google Scholar]
-
Marczyk J, Ostrowska K, Hebda M. Influence of binder jet 3D printing process parameters from irregular feedstock powder on final properties of Al parts. Adv. Powder Technol. 2022, 33, 103768. DOI:10.1016/j.apt.2022.103768 [Google Scholar]
-
Du W, Miao G, Pei Z, Ma C. Comparison of Flowability and Sinterability Among Different Binder Jetting Feedstock Powders: Nanopowder, Micropowder, and Granulated Powder. J. Micro Nano-Manuf. 2021, 9, 021008. DOI:10.1115/1.4052253 [Google Scholar]
-
Chen Q, Juste E, Lasgorceix M, Petit F, Leriche A. Binder jetting process with ceramic powders: Influence of powder properties and printing parameters. Open Ceram. 2022, 9, 100218. DOI:10.1016/j.oceram.2022.100218 [Google Scholar]
-
Ranjan OP, Kumbhar AP. 10—Dry and wet granulation. In Polymers for Oral Drug Delivery Technologies; Parambath A, Ed.; Elsevier Science Ltd.: Amsterdam, The Netherlands, 2025; pp. 463–494. DOI:10.1016/B978-0-443-13774-7.00010-4 [Google Scholar]
-
Shanmugam S. Granulation techniques and technologies: Recent progresses. Bioimpacts 2015, 5, 55–63. DOI:10.15171/bi.2015.04 [Google Scholar]
-
Sandler N, Lammens RF. Pneumatic dry granulation: potential to improve roller compaction technology in drug manufacture. Expert Opin. Drug Deliv. 2011, 8, 225–236. DOI:10.1517/17425247.2011.548382 [Google Scholar]
-
Vadaga AK, Gudla SS, Nareboina GSK, Gubbala H, Golla B. Comprehensive review on modern techniques of granulation in pharmaceutical solid dosage forms. Intell. Pharm. 2024, 2, 609–629. DOI:10.1016/j.ipha.2024.05.006 [Google Scholar]
-
Mariani M, Bertolini F, Mercadelli E, Blanco GF, Baldisserri C, Sanchez-Herencia AJ, et al. Spray drying granulation of potassium sodium niobate (KNN) for binder jetting: Feedstock preparation and influence on sintered material properties. Open Ceram. 2025, 21, 100743. DOI:10.1016/j.oceram.2025.100743 [Google Scholar]
-
Mariani M, Frias Blanco G, Mercadelli E, Sánchez-Herencia AJ, Galassi C, Lecis N, et al. Tailoring α-alumina powder morphology through spray drying for cold consolidation by binder jetting. Open Ceram. 2022, 12, 100307. DOI:10.1016/j.oceram.2022.100307 [Google Scholar]
-
Santos D, Maurício AC, Sencadas V, Santos JD, Fernandes MH, Gomes PS. Spray Drying: An Overview. Biomaterials—Physics and Chemistry—New Edition; IntechOpen: London, UK, 2017. DOI:10.5772/intechopen.72247 [Google Scholar]
-
Liu B, Wang J, Zeng J, Zhao L, Wang Y, Feng Y, et al. A review of high shear wet granulation for better process understanding, control and product development. Powder Technol. 2021, 381, 204–223. DOI:10.1016/j.powtec.2020.11.051 [Google Scholar]
-
Scott AC, Hounslow MJ, Instone T. Direct evidence of heterogeneity during high-shear granulation. Powder Technol. 2000, 113, 205–213. DOI:10.1016/S0032-5910(00)00354-5 [Google Scholar]
-
Ming L, Li Z, Wu F, Du R, Feng Y. A two-step approach for fluidized bed granulation in pharmaceutical processing: Assessing different models for design and control. PLoS ONE 2017, 12, e0180209. DOI:10.1371/journal.pone.0180209 [Google Scholar]
-
Burggraeve A, Monteyne T, Vervaet C, Remon JP, Beer TD. Process analytical tools for monitoring, understanding, and control of pharmaceutical fluidized bed granulation: A review. Eur. J. Pharm. Biopharm. 2013, 83, 2–15. DOI:10.1016/j.ejpb.2012.09.008 [Google Scholar]
-
Stunda-Zujeva A, Irbe Z, Berzina-Cimdina L. Controlling the morphology of ceramic and composite powders obtained via spray drying—A review. Ceram. Int. 2017, 43, 11543–11551. DOI:10.1016/j.ceramint.2017.05.023 [Google Scholar]
-
Ioannou Sartzi M, Drettas D, Stramarkou M, Krokida M. A Comprehensive Review of the Latest Trends in Spray Freeze Drying and Comparative Insights with Conventional Technologies. Pharmaceutics 2024, 16, 1533. DOI:10.3390/pharmaceutics16121533 [Google Scholar]
-
Singlard M, Paillassa A, Ferres L, Pagnoux C, Aimable A. Freeze granulation and spray drying of mixed granules of Al2O3. Powder Technol. 2022, 395, 280–289. DOI:10.1016/j.powtec.2021.09.044 [Google Scholar]
-
Kondo N, Shimamura A, Hotta M, Tatatmi J, Kawaguchi S. Comparison of alumina granules prepared by spray freeze granulation drying and spray drying. J. Ceram. Soc. Jpn. 2020, 128, 922–926. DOI:10.2109/jcersj2.20041 [Google Scholar]
-
Rautenberg A, Lamprecht A. Spray-freeze-dried lyospheres: Solid content and the impact on flowability and mechanical stability. Powder Technol. 2022, 411, 117905. DOI:10.1016/j.powtec.2022.117905 [Google Scholar]
-
Yamazaki R, Tatami J, Iijima M, Kawaguchi S, Kondo N. Freezing behaviour and spray freeze granulation drying of silicon nitride slurries prepared from tert-butyl alcohol and cyclohexane solvent mixtures. Adv. Powder Technol. 2025, 36, 105030. DOI:10.1016/j.apt.2025.105030 [Google Scholar]
-
Farinha S, Sá JV, Lino PR, Galésio M, Pires J, Rodrigues MÂ, et al. Spray Freeze Drying of Biologics: A Review and Applications for Inhalation Delivery. Pharm. Res. 2023, 40, 1115–1140. DOI:10.1007/s11095-022-03442-4 [Google Scholar]
-
Ishwarya SP, Anandharamakrishnan C, Stapley AGF. Spray-freeze-drying: A novel process for the drying of foods and bioproducts. Trends Food Sci. Technol. 2015, 41, 161–181. DOI:10.1016/j.tifs.2014.10.008 [Google Scholar]
-
Silva JM, Teixeira CCC, Tacon LA, Freitas LVD, Meneguin AB, Barud HS, et al. Nanoporous microparticles of cellulose nanofibrils: The effect of fluid bed atmospheric spray freeze drying. Powder Technol. 2025, 452, 120502. DOI:10.1016/j.powtec.2024.120502 [Google Scholar]
-
Polozov I, Razumov N, Masaylo D, Silin A, Lebedeva Y, Popovich A. Fabrication of Silicon Carbide Fiber-Reinforced Silicon Carbide Matrix Composites Using Binder Jetting Additive Manufacturing from Irregularly-Shaped and Spherical Powders. Materials 2020, 13, 1766. DOI:10.3390/ma13071766 [Google Scholar]
-
Miao G, Du W, Moghadasi M, Pei Z, Ma C. Ceramic binder jetting additive manufacturing: Effects of granulation on properties of feedstock powder and printed and sintered parts. Addit. Manuf. 2020, 36, 101542. DOI:10.1016/j.addma.2020.101542 [Google Scholar]
-
Du W, Li M, Pei Z, Ma C. Roller-compaction-assisted binder jetting with different granulated zirconia powders. Manuf. Lett. 2023, 35, 576–582. DOI:10.1016/j.mfglet.2023.08.031 [Google Scholar]
-
Huang S, Ye C, Zhao H, Fan Z, Wei Q. Binder jetting yttria stabilised zirconia ceramic with inorganic colloid as a binder. Adv. Appl. Ceram. 2019, 118, 458–465. DOI:10.1080/17436753.2019.1666593 [Google Scholar]
-
Du W, Miao G, Liu L, Pei Z, Ma C. Binder Jetting Additive Manufacturing of Ceramics: Feedstock Powder Preparation by Spray Freeze Granulation. In Proceedings of the ASME 2019 14th International Manufacturing Science and Engineering Conference, Erie, PA, USA. 10–14 June 2019; Volume 1: Additive Manufacturing; Manufacturing Equipment and Systems; Bio and Sustainable Manufacturing; ASME: New York, NY, USA, 2019; V001T01A006. DOI:10.1115/MSEC2019-3001 [Google Scholar]
-
Arman MS, Khan F, Pasha MM, Sanders J, Pei Z. Granulation of fine eggshell powder to produce feedstock powder for binder jetting additive manufacturing: A feasibility study. Mater. Today Commun. 2025, 46, 112918. DOI:10.1016/j.mtcomm.2025.112918 [Google Scholar]
-
Standard Test Method for Apparent Density of Free-Flowing Metal Powders Using the Hall Flowmeter Funnel. Available online: https://store.astm.org/b0212-17.html (accessed on 2 July 2026).
-
Standard Test Method for Tap Density of Metal Powders and Compounds. Available online: https://store.astm.org/b0527-23.html (accessed on 2 July 2026).
-
Passerine BFG, Breitkreitz MC. Important Aspects of the Design of Experiments and Data Treatment in the Analytical Quality by Design Framework for Chromatographic Method Development. Molecules 2024, 29, 6057. DOI:10.3390/molecules29246057 [Google Scholar]
-
Marques A, Cunha A, Faria S, Silva FS, Carvalho O. Predictive models on the influence of laser texturing parameters on the Inconel 718 surface by using Nd: YVO4 laser. Opt. Laser Technol. 2022, 154, 108320. DOI:10.1016/j.optlastec.2022.108320 [Google Scholar]
-
Mandato S, Rondet E, Delaplace G, Barkouti A, Galet L, Accart P, et al. Liquids’ atomization with two different nozzles: Modeling of the effects of some processing and formulation conditions by dimensional analysis. Powder Technol. 2012, 224, 323–330. DOI:10.1016/j.powtec.2012.03.014 [Google Scholar]
-
Yu B, Feng YJ, Wohn LS, Huang C, Li YF, Jia Z. Spray-drying of alumina powder for APS: Effect of slurry properties and drying conditions upon particle size and morphology of feedstock. Bull. Mater. Sci. 2011, 34, 1653–1661. DOI:10.1007/s12034-011-0373-0 [Google Scholar]
-
Schappo H, Giry K, Damia C, Hotza D. Screening method for producing suitable spray-dried HA powder for SLS application. Powder Technol. 2021, 384, 62–69. DOI:10.1016/j.powtec.2021.02.004 [Google Scholar]