
Functionalized Polyurethane as a Hole Transport Layer for Quantum Dot-Sensitized Solar Cells with Higher Open-Circuit Voltage and Fill Factor

Functionalized Polyurethane as a Hole Transport Layer for Quantum Dot-Sensitized Solar Cells with Higher Open-Circuit Voltage and Fill Factor
Received: 09 July 2026 Revised: 22 July 2026 Accepted: 12 August 2026 Published: 27 August 2026

© 2026 The authors. This is an open access article under the Creative Commons Attribution 4.0 International License (https://creativecommons.org/licenses/by/4.0/).
Graphical Abstract
1. Introduction
Due to their special optical and electrical characteristics, quantum dots, also known as semiconductor nanocrystals (diameter of 2–10 nm), are a novel class of materials that have drawn the attention of most researchers worldwide during the past ten years [1]. High quantum yields, size-dependent band gaps, multiple exciton generation, hot electron transfer, high extinction coefficients, and photostability are all present. These special qualities make it a viable substitute for organic chromophores in a variety of applications, including biomedical imaging, photovoltaics, and light-emitting diodes. Due to their superior optoelectronic qualities, conventional quantum dots such as CdS, CdSe, CdTe, PbS, PbSe, SnS, and SnSe have been extensively used in photovoltaics [2,3]. However, many of these materials contain potentially dangerous elements, especially lead (Pb) and cadmium (Cd), which limit their widespread commercialization and raise serious health and environmental concerns. The International Agency for Cancer Research (IARC) classified cadmium and lead as type Ⅰ carcinogens. These materials can cause tumors in the lungs, prostate, injection site, and other tissues [4,5]. A potential inorganic semiconductor made of elements that are generally safe for the environment, copper indium sulfide (CuInS2), is a desirable substitute for traditional heavy-metal-based quantum dots. Due to its exceptional photoelectric properties, which include a high optical absorption coefficient (>104 cm−1), an appropriate optical band gap (1.5 eV), excellent radiation stability, and remarkable defect tolerance, it has drawn a lot of attention in recent years for photovoltaic and optoelectronic applications. CuInS2 is an excellent material for next-generation solar energy conversion technologies because of its inherent properties, which enable effective light harvesting, enhanced charge-carrier generation, and stable device performance [6,7,8]. Copper indium sulfide (CuInS2) QDs have a high absorption coefficient, a tunable band gap, and are non-toxic, environmentally friendly chalcopyrite semiconducting materials [9]. According to the Shockley-Queisser limit, a CuInS2-based solar cell could potentially have a power conversion efficiency of 30–32% [6,10]. Although CuInS2 has poor electrochemical catalytic properties, high recombination of photogenerated electron-hole pairs and low photochemical stability still limit its photoelectrocatalytic and electrocatalytic performance, despite improvements based on the aforementioned studies [11].
The performance of QDSSCs is directly affected by electrolyte behaviour. Lately, liquid electrolytes like I−/I3− and S−2/Sn−2 electrolytes have been widely used in QDSSCs. To complete the circuit and generate an electric current, the electrolyte mediator accepted the hole and shifted it to the counter electrode. Leakage is an issue for QDSSCs that use liquid electrolytes [12]. To solve this problem, we need to develop a different physical form of electrolytes, like semi-solid gel electrolytes or solid film. This is required because ordinary liquid electrolytes have poor long-term stability, are difficult to handle, and are prone to evaporation. Numerous research teams have created QDSSC devices using solid-state and semi-solid (gel form) polymer electrolytes [13,14,15]. The polyurethane (PU) is usually used as a matrix for the preparation of gel. Pure PU is an insulator, but you can improve its electrical conductivity by adding polar groups, like sulfonate moieties, to the polymer chain. This makes conduction easier. Besides its electrical conductivity, its good mechanical properties and long-term stability make it a good choice as a hole-transporting material [15]. By adding sulfonic acid (–SO3H) groups to the polyurethane backbone, sulphonation greatly improves its physicochemical characteristics. These functional groups boost ionic conductivity, hydrophilicity, and adhesion to metal oxide photoanodes like TiO2 and SnO2. Furthermore, by interacting strongly with the surfaces of semiconductor quantum dots like CuInS2, CdS, and CdSe, the –SO3H groups successfully passivate surface defects that act as charge recombination centers. This interfacial passivation can increase the open-circuit voltage (VOC) and fill factor (FF) of QDSSCs while also inhibiting charge recombination and promoting efficient hole extraction [16,17].
Sulphonated polyurethane (SPU) can facilitate efficient hole extraction in QDSSCs based on CuInS2 quantum dots placed on TiO2 photoanodes by establishing close interfacial contact and reducing defect-induced charge recombination. It is a promising material for wearable and flexible solar cells on polymer substrates such as ITO-coated polyethylene terephthalate due to its exceptional flexibility and solution processability [18].
In this article, a synthesized, functionalized thermoplastic PU is used as a hole transport layer (HTL), and various semiconducting materials, such as SnO2 and TiO2, are used as electron transport layers (ETLs) in QDSSCs. Gel electrolyte-based QDSSCs are fabricated using FTO/TiO2/CuInS2 and FTO/SnO2/TiO2/CuInS2 as the photoelectrode. And SPU-2 is used as a hole-transport layer due to higher ionic conductivity as compared to SPU-1, at the counter electrode. Overall, sulphonated polyurethane represents a promising emerging hole transport material for QDSSCs. Its low intrinsic conductivity remains a problem, but it can be overcome through molecular engineering, controlled sulphonation, or the creation of conductive polymer composites. SPU has great potential for use in next-generation, flexible, affordable, and eco-friendly quantum dot-sensitized solar cells, with further optimization of its energy-level alignment and charge-transport properties.
2. Experimental
2.1. Precursor Materials
4,4-diphenylmethane diisocyanate (MDI, 98%), sodium hydride (NaH, 55–65%, moistened with paraffin oil), poly(tetramethylene glycol) (PTMG, Mn = 2900 g/mol from Sigma-Aldrich, Bengluru, India), 1,3-propane sultone (≥99%, Sigma-Aldrich, Bengluru, India), butane diol (BD, Sigma-Aldrich, Bengluru, India), dibutyl tindilaurate (DBTDL, 95% from Sigma-Aldrich,Bengluru, India), N,N-dimethyl acetamide (DMAc, ≥99%), N,N-dimethylformamide (DMF, ≥99.9%), N-methyl pyrrolidone (NMP, 99.5%), Potassium Ferrocynide (K4[Fe(CN)6], 99%), Potassium Ferricynide (K3[Fe(CN)6], 98%), Potassium chloride (KCl), 1-Dodecanethiol (≥98%, Sigma-Aldrich, Bengluru, India), 3-mercaptopropinoic acid (3-MPA, ≥99.9%), Indium(iii) acetate (In(OAc)3, 99.99% from thermoscientific, India), Copper Iodide (CuI), Dichloromethne, Methanol (CH3OH, ≥99.8%), Acetone (CH3COCH3, 99.7%), Fluorine-doped tin oxide (FTO)-coated glass substrates (Sigma-Aldrich, Bengluru, India) with a thickness of 2.2 mm and a sheet resistance of 14 Ω/sq, TiO2 paste (Solaronix, Switzerland), Anhydrous tin(II) chloride (SnCl2, ≥99.9%, Sigma-Aldrich, Bengluru, India), Silver conductive paste (Elcosil S-L/SP from Solaronix, Switzerland).
2.2. Synthesis of CuInS2
The one-pot synthesis method used for the synthesis of CuInS2 QDs, in which 292 mg of Indium acetate and 190 mg of copper iodide were taken in a round-bottom flask, mixed with 7.5 mL of 1-dodecanethiol. The reaction mixture was purged with nitrogen gas three to four times to establish an inert N2 atmosphere. Under strong stirring, the temperature was raised to 100 °C until a light yellow solution formed, then increased to 210 °C. As the temperature rose to 210 °C, the color of the reaction mixture changed from yellow to light red, then to dark red, addressing the CuInS2 QDs nucleation and growth. To quickly stop further nanoparticle growth, the reaction mixture was rapidly cooled to below 50 °C. The resulting QDs were washed several times by centrifugation at 7000 RPM in a mixture of excess methanol and 0.1 M 3-mercaptopropionic acid (3-MPA) to eliminate unreacted precursor [19,20]. The aim of using 3-MPA is, to surface passivate defect states, enhance colloidal stability, and facilitate efficient charge transfer between the CuInS2 quantum dots and the TiO2 photoanode, thereby improving QDSSC performance [21].
2.3. Synthesis of PU
A two-step condensation polymerization method was used to make the MDI-based polyurethane (PU). In the first step, an isocyanate-terminated prepolymer was prepared by reacting 1.3 g of poly(tetramethylene glycol) (PTMG) with 0.8 g of 4,4′-methylene diphenyl diisocyanate (MDI) in 20 mL DMF. This reaction was carried out under continuous stirring at 70 °C for 3 h in an inert atmosphere. Subsequently, 0.2 mL butane diol was introduced as a chain extender, followed by the addition of a catalyst (1 mL of 1% DBTDL in toluene). The reaction mixture was stirred continuously at the same temperature under an inert atmosphere for 24 h. The cold deionized water is used to precipitate the resulting polyurethane. The collected precipitate was dried first on a hot plate, then in a vacuum oven at 50 °C for 72 h [22]. A schematic representation of the reaction is shown in Figure 1a.
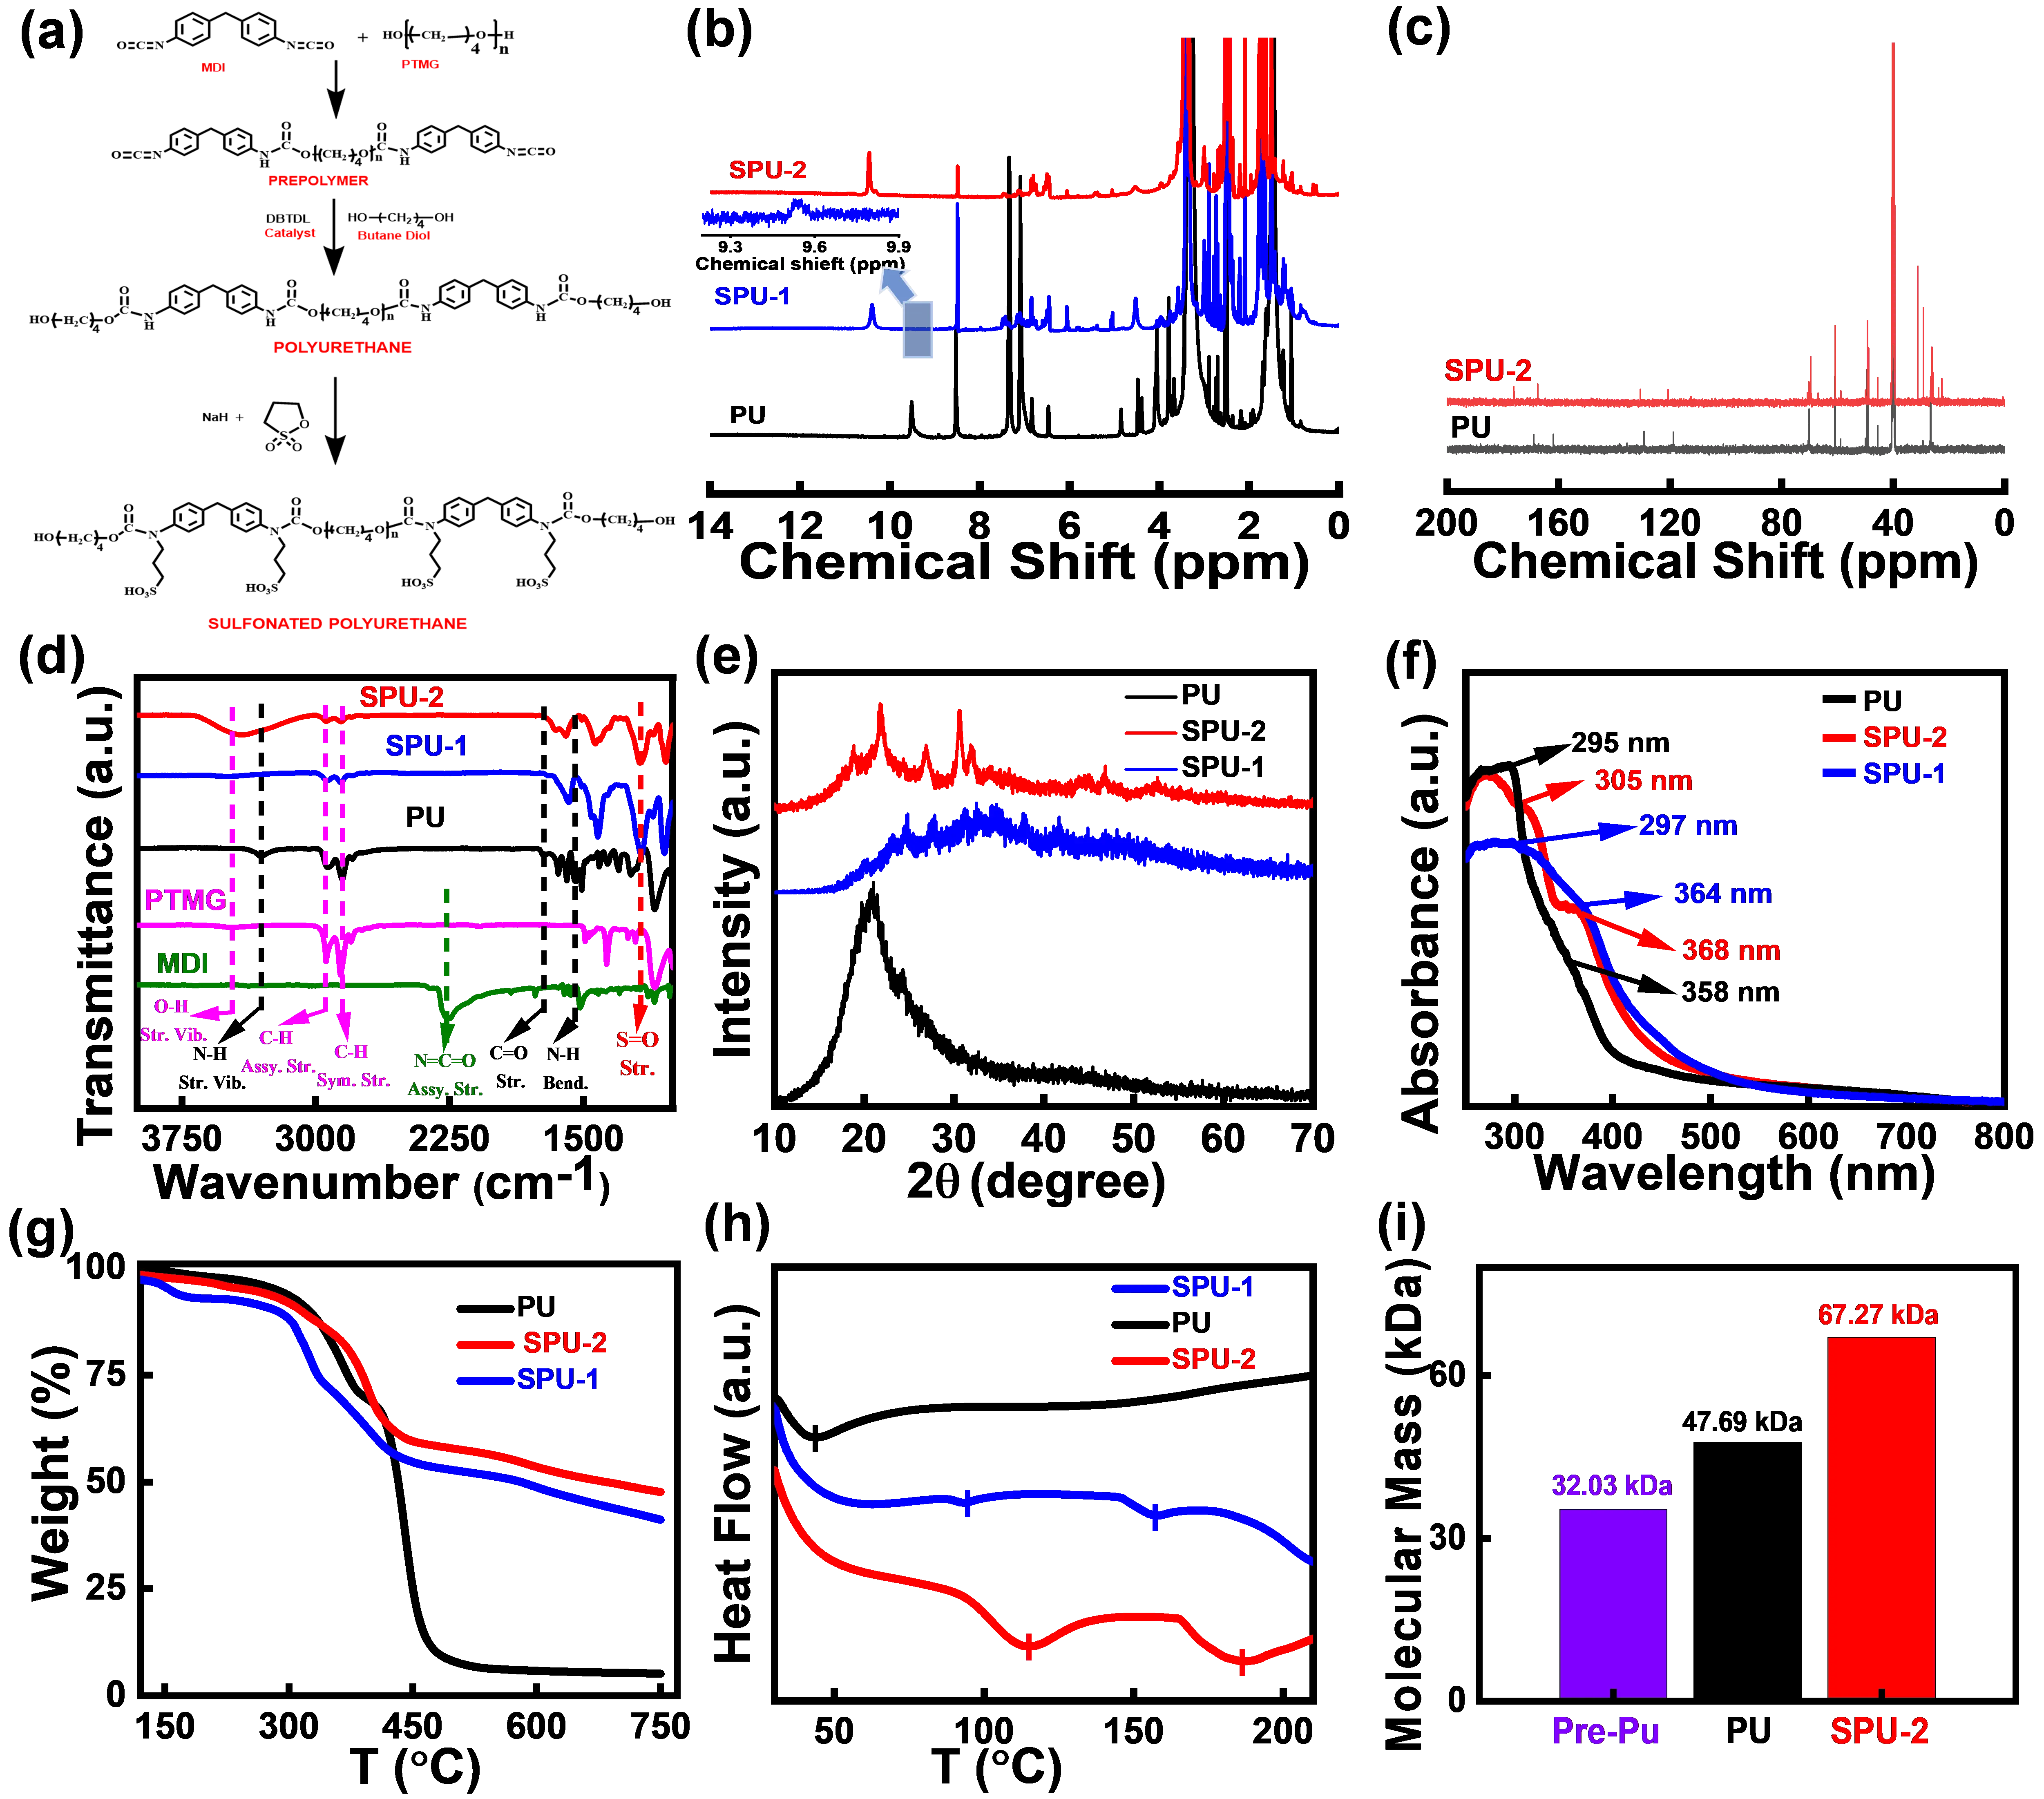
Figure 1. (a) Reaction scheme to synthesize butane diol extended thermoplastic polyurethane (PU) and functionalization of hard segment using propane sultone to generate ionomer (SPU-1 and SPU-2); (b) 1H NMR spectra of pure PU, functionalized polymer SPU-1 and SPU-2; (c) 13C NMR spectra of pure PU and SPU; (d) FTIR spectra of synthesized pure PU, SPU-1 and SPU-1, showing appearance of new peak and shifting of peak position; (e) XRD spectra of PU SPU-1 and SPU-2; (f) UV-vis absorption spectra of pure PU, SPU-1 and SPU-2 showing the shifting of peak position; (g) TGA thermograms of Pure PU, SPU-1 and SPU-2 demonstrating relative thermal stability; (h) DSC thermograms of pure PU, SPU-1 and SPU-2 showing the melting temperatures; and (i) Weight average molecular mass histogram of Pre-PU, PU and SPU-2, shows successful polymerization and sulphonation.
2.4. Functionalization of Polyurethane
A bimolecular nucleophilic substitution reaction method was used to functionalize the synthesized polyurethane. At the start of the reaction, 0.3 g of synthesized polymer was dissolved using 15 mL DMAc solvent in a round-bottom flask at 60 °C, and then the reaction temperature was taken to room temperature. Under an inert atmosphere, 0.6 g NaH was added to the solution at 0 °C with vigorous stirring, and the mixture was kept at this temperature for 1 h. After that, the reaction mixture was cooled to room temperature. After this, 0.750 mL (for SPU-1) and 1 mL (for SPU-2) 1,3-propane sultone is added, and the mixture is continuously stirred for 3 h at 65 °C. After the reaction mixture is complete, cool to room temperature, then pour it into a toluene-containing beaker to precipitate the ionomer and remove any unreacted reagents. Finally, the sulphonated PU (SPU) was collected and washed two to three times with ethanol and diethyl ether [23], as shown in Figure 1a.
2.5. Preparation Gel Electrolytes
In the DMF solvent, the functionalized polymer was added to form a semi-solid gel. Under continuous stirring, the solution was heated to 80 °C until a homogenous mixture was formed. A semi-solid ionomer (SPU) gel was formed by cooling it to 5 °C and keeping it there for 12 h.
2.6. Device Fabrication
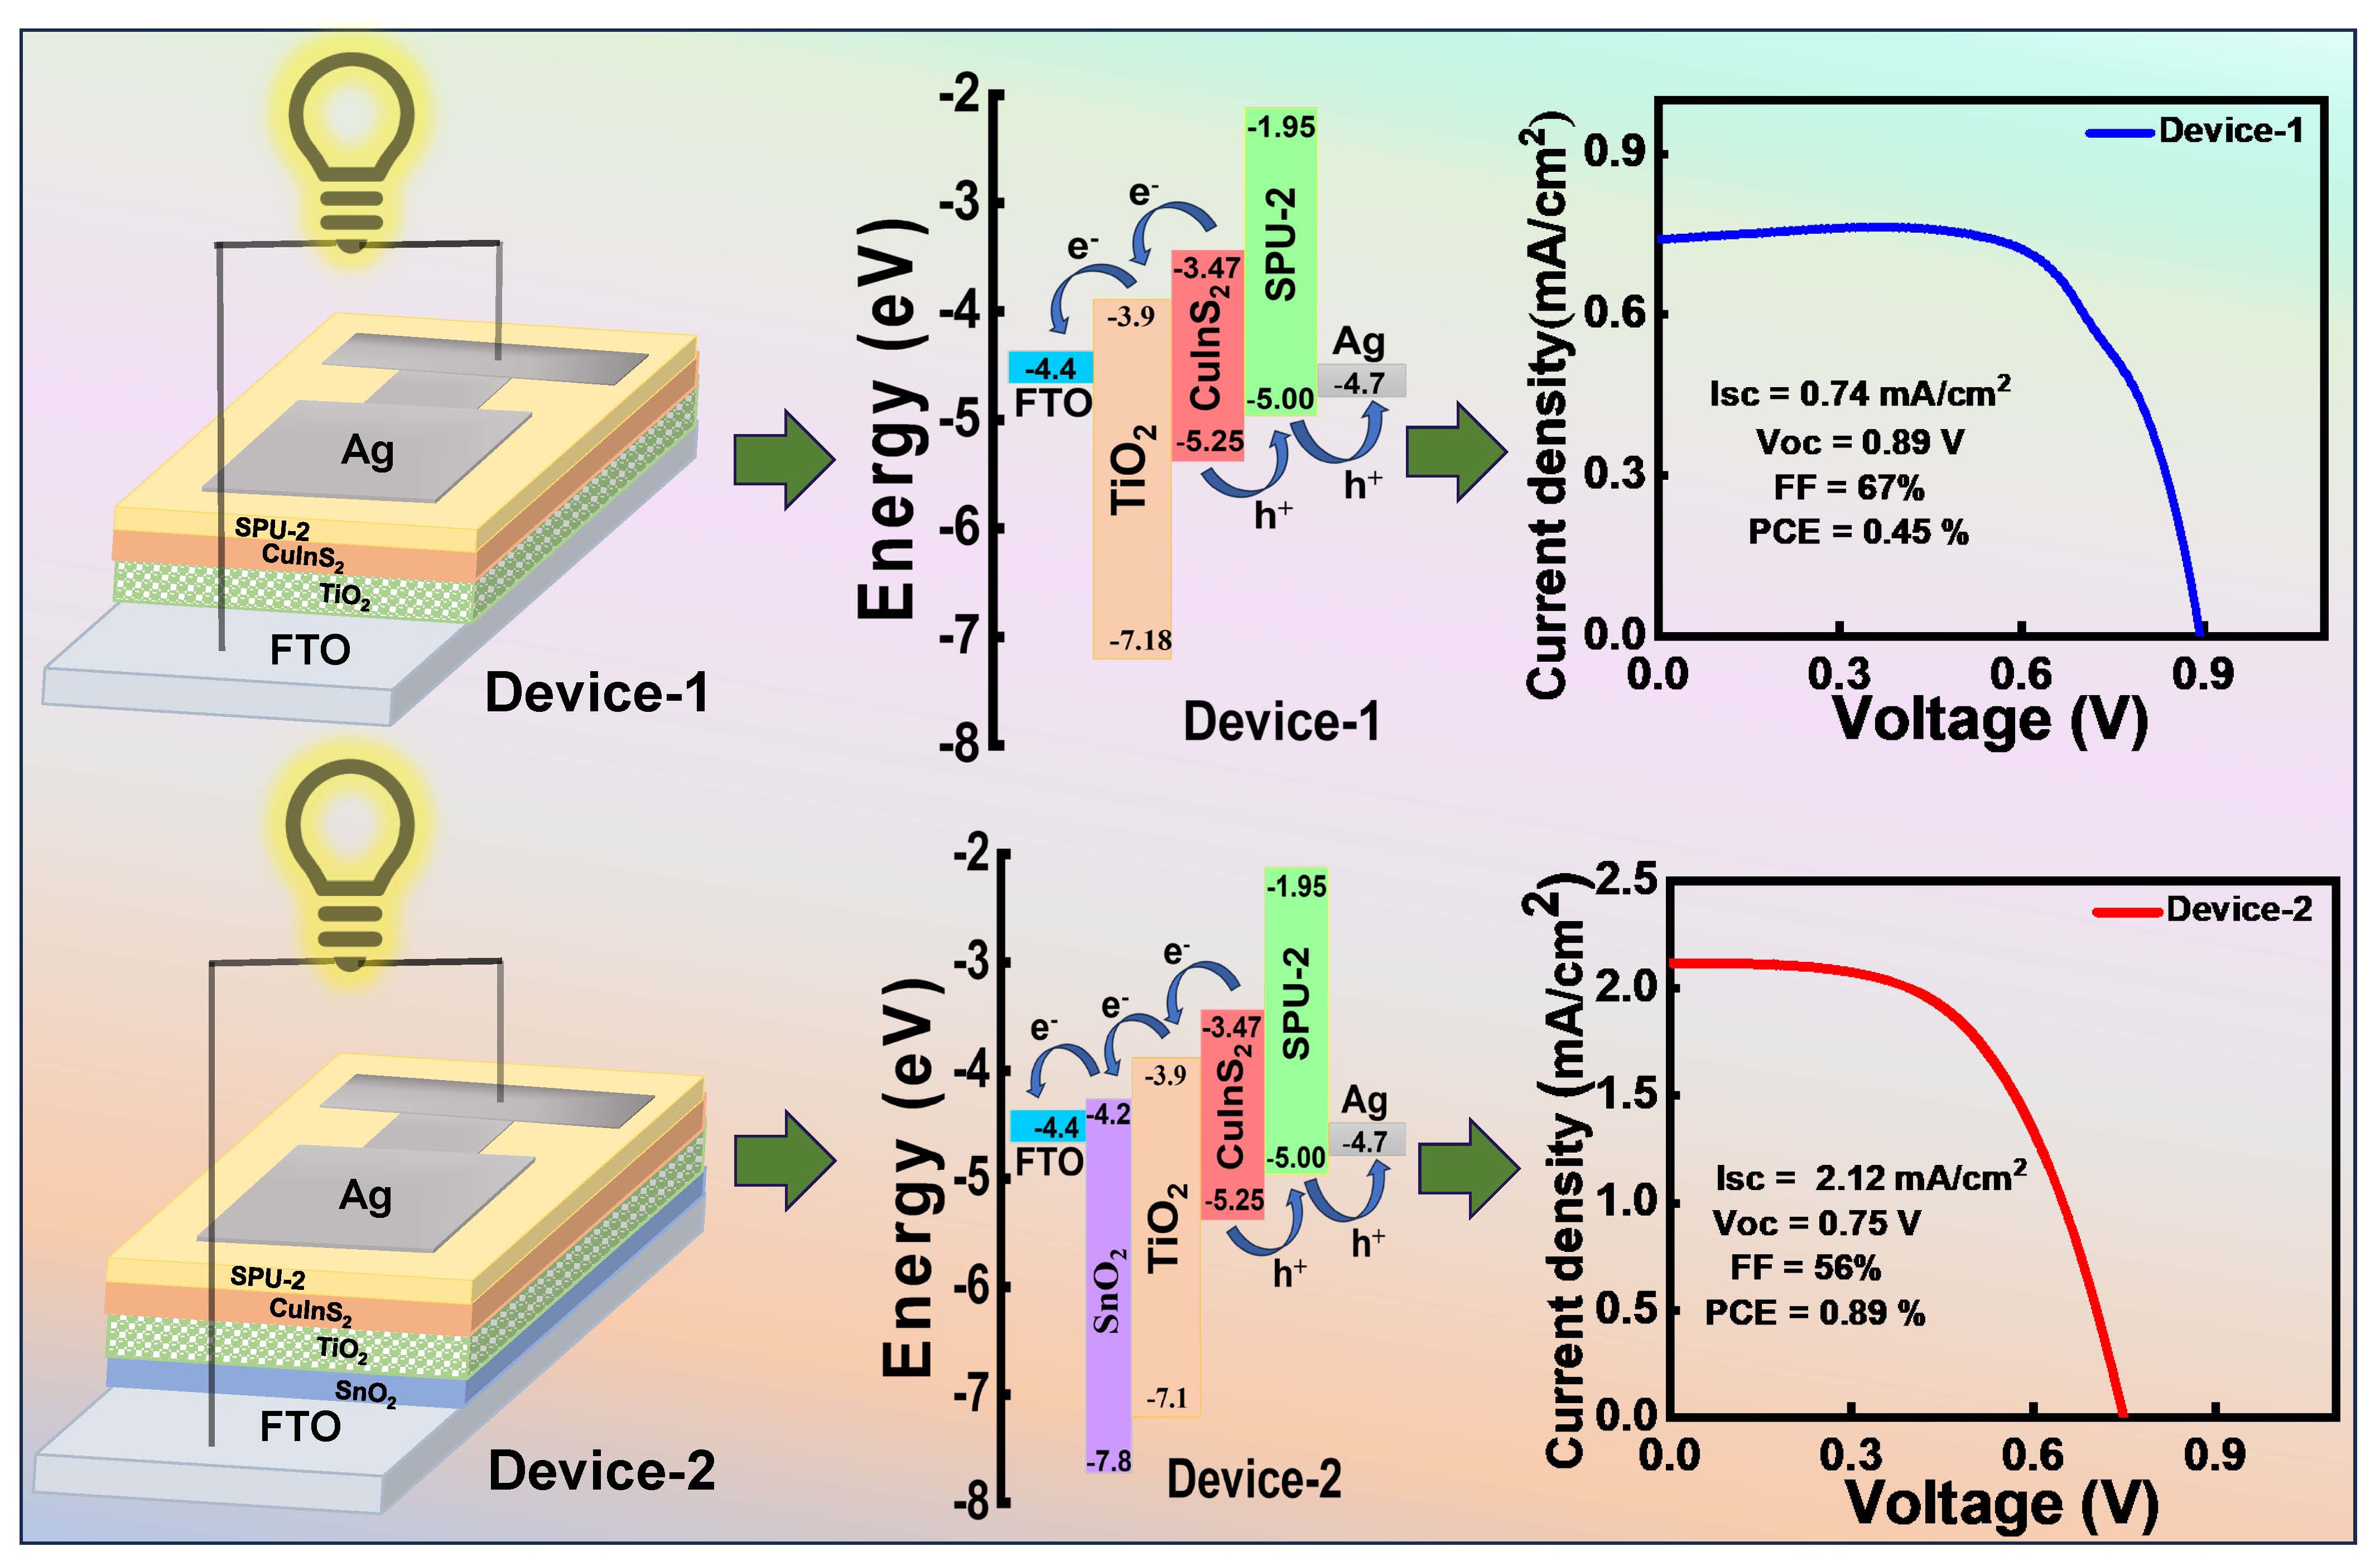
To investigate the influence of different ETLs, QDSSCs were fabricated with identical device architectures, varying only in the ETL configuration to enable a direct comparison of their photovoltaic performance. All other functional layers and fabrication conditions were kept unchanged to ensure a reliable comparative evaluation. The fabricated devices consisted of Glass/FTO/TiO2/CuInS2/SPU-2/Ag and Glass/FTO/SnO2/TiO2/CuInS2/SPU-2/Ag architectures, designated as Device-1 and Device-2, respectively. Device fabrication commenced with the preparation of FTO-coated glass substrates. The substrates were patterned by chemical etching with a zinc-hydrochloric acid solution to define the active area, as illustrated in Supplementary Figure S1a. Subsequently, they were cleaned sequentially in soap solution, acetone, and isopropanol (IPA), with ultrasonication applied at each step. Finally, the oxygen plasma is used for cleaned treated substrate at 20 W for 10 min to improve film adhesion. For Device-1, a TiO2 layer is deposited by doctor-blade coating and subsequently annealed at 500 °C for 30 min (Figure S1b). And for Device-2, SnO2 as ETL is deposited by spin coating a 500 mM solution of SnCl2 at 5000 rpm for 50 s under ambient conditions. The film is then annealed at 550 °C for 30 min to yield a transparent SnO2 layer, and the top of the SnO2, TiO2 layer is deposited by doctor-blade coating and subsequently annealed at 500 °C for 30 min [24]. For the coating of the active layer (CuInS2), the dip coating method was used with a solution of CuInS2 prepared in dichloromethane [25]. The counter electrode was prepared by using silver paste on FTO through the doctor blade coating method. After annealing at 130 °C for 15 min, we obtained a thin layer of Ag (Figure S1b). Finally, the active area of both devices is ~0.56 cm2, and a schematic figure of the complete device architecture is presented in Figure S1c.
2.7. Characterization
2.7.1. X-ray Diffraction
The structural characteristics of the synthesized QDs, pure polymer, and functionalized polymer were examined using an X-ray diffraction instrument (Rigaku Miniflex 600, Rigaku Corporation, Tokyo, Japan) with Cu Kα radiation (λ = 0.154 nm), operated at a constant current of 15 mA and a voltage of 40 kV. The samples were mounted on a quartz holder and analyzed at ambient temperature with a scanning rate of 3° min−1 over a 2θ range of 10–70°.
2.7.2. Spectroscopic Measurements
The 1H NMR spectra of the functionalized polymer were recorded on a Bruker Biospin spectrometer (500 MHz, Bruker, Ettlingen, Germany), and the chemical shifts were expressed in ppm. DMSO-d6 was used as the solvent for the 1H NMR measurements. All spectroscopic measurements were conducted at room temperature. For optical analysis, a JASCO V-650 UV-visible spectrophotometer (JASCO Corporation, Tokyo, Japan), was used to record the UV-Vis absorption spectra of the various polymers and the synthesized quantum dots at a scan rate of 2 nm·s−1, over a wavelength range of 200–800 nm. Photoluminescence measurements were carried out in fluorescence mode using a BioTek Synergy H1 instrument (BioTek, Winooski, VT, USA). FTIR transmittance spectra of the quantum dots and polymers were obtained using a Nicolet 670 spectrometer (Thermo Fisher Scientific Inc., Madison, WI, USA.), with 100 scans at a resolution of 4 cm−1, over the spectral range of 600–4000 cm−1.
2.7.3. DLS and Zeta Potential
A Litesizer DLS 701 Particle Analyzer (Anton Paar, Graz, Austria) instrument was used to measure the molecular mass and zeta potential of the polymers at room temperature (25 °C). For molecular weight analysis, three different sample concentrations (0.25, 0.5, and 1 mg·mL−1) of the prepolymer, polymer, and functionalized polymer were prepared. For zeta potential analysis, a 1.5 mg·mL−1 sample prepared in DMF was used.
2.7.4. Thermal Analysis
An instrument (Mettler-Toledo, Greifensee, Switzerland), a thermogravimetric analyzer, is used for the analysis of the thermal behavior of pristine polymer and functionalized polymer over the temperature range 30–750 °C. The thermal behaviour of the pristine polymer and its functionalized derivatives was investigated using a Mettler-Toledo thermogravimetric analyzer at a heating rate of 20 °C min−1 over the temperature range 30–750 °C under an inactive atmosphere. The Mettler 832 instrument is used for differential scanning calorimetry (DSC) measurements. It operates under a nitrogen atmosphere with a heating rate of 10 °C per minute and covers a temperature range of 0–300 °C.
2.7.5. Cyclic Voltammetry
An instrument, (Metrohm Autolab M204, Metrohm Autolab B.V., Utrecht, The Netherlands) is used for cyclic voltammetry measurements of the polymer, CIS QDs, and ETLs with a three-electrode setup, platinum as the counter electrode, Ag/AgCl as the reference electrode, and glassy carbon as the working electrode. The conduction band (CB) and valence band (VB) of QDs, and the highest occupied molecular orbital (HOMO) energy level and lowest unoccupied molecular orbital (LUMO) energy level of polymer, were calculated from CV measurement. Equation (1) and Equation (2) are used to calculate the HOMO and LUMO energy levels of the polymer and QDs, reference material (−4.4 eV) ferrocene is used.
10 mL of N-methyl-2-pyrrolidone (NMP) solvent is used to dissolve 5 mg of the polymers. The sample solution was prepared by mixing 5 mg of polymer, while 2 mg of CuInS2 (CIS) quantum dots were dispersed in 6 mL of the same solvent. The resulting solutions were ultrasonicated for 15 min to ensure uniform dispersion. A blank cyclic voltammetry (CV) measurement was first performed using pure NMP to determine the appropriate working potential window. Subsequently, CV measurements were carried out at room temperature of the prepared sample over a potential range of −2.0 to +2.0 V at a scan rate of 20 mV·s−1. The TiO2 and SnO2 electron transport layers (ETLs) were deposited onto FTO substrates. The electrolyte was prepared by dissolving 5 mM ferricyanide, 5 mM ferrocyanide, and 0.1 M KCl in deionized water. Before evaluating the ETLs, a CV measurement was performed using a bare FTO electrode in the prepared electrolyte to establish the appropriate working potential window. The TiO2 and SnO2 ETLs were then analyzed by CV at room temperature over a potential range of −0.9 to +1.0 V at a scan rate of 20 mV·s−1 under a nitrogen atmosphere.
2.7.6. Electrochemical Impedance Spectroscopy (EIS)
The electrochemical impedance spectroscopy (EIS) measurements of the pure and functionalized polymers were carried out using a multichannel M204 potentiostat/galvanostat workstation equipped with an FRA 32 (Frequency Response Analyzer) over a frequency range of 0.1 Hz to 106 Hz. Thin films of the pure and functionalized polymers were sandwiched between two stainless steel circular electrodes with an effective area of 4.0 cm2. The EIS analysis was performed to evaluate the electrical conductivity of the pure and functionalized polymers. The polymer resistance was obtained by fitting the impedance data using Nova software (version 2.1.4). The ionic conductivity of the polymers was then calculated from the measured ionic resistance using Equation (3).
where, R is the resistance of the polymer, km is the ionic conductivity of the polymer, A is the area of the polymer, and L is the distance between the two electrodes.
2.7.7. Solar Cell Measurement
The Multichannel Autolab M204 potentiostat/galvanostat is used for the current-voltage (I–V) characterization of the fabricated QDSSC devices with an LED driver (700 mA output) and connected to an optical device. Illumination came from a focused LED light source powered by the Autolab LED driver. Programmable software (Nova 2.1.4) controlled the light intensity, which connected with the optical bench. The photovoltaic performance of the devices was evaluated by looking at the open-circuit voltage (Voc), short-circuit current density (Jsc), and fill factor (FF). These parameters directly determine the power conversion efficiency (η). The following formulas were used to determine these parameters.
| ```latex\mathrm{F}\mathrm{F}=\mathrm{ }\frac{{J}_{max}}{{J}_{sc}}\mathrm{ }\times \mathrm{ }\frac{{V}_{max}}{{V}_{oc}} \,\text{or}\, \mathrm{F}\mathrm{F}=\mathrm{ }\frac{{P}_{max}}{{J}_{sc}\mathrm{ }\times \mathrm{ }{V}_{oc}}``` | |
| ```latex\eta(\%) = \frac{P_{{max}}}{P_{{in}}} \times 100 \quad \text{or} \quad \eta(\%) = \frac{J_{{sc}} \times V_{{oc}} \times \mathrm{FF}}{P_{{in}}} \times 100``` |
3. Results and Discussions
3.1. NMR, FTIR, UV-Vis, XRD, and DLS Analysis of Synthesized Polymers
Figure 1a Synthesis of polyurethane and introduction of sulfonate group into it is confirmed by 1H and 13C NMR studies, and the % (DS) degree of substitution of N–H proton by propane sultone is calculated through the selective integral area of the new incoming peak at 10.5 ppm, which corresponds to the –SO3H proton in 1H-NMR spectra, as shown in Figure 1b. Before functionalization of Polyurethane, two different types of N–H protons were observed at 8.5 ppm (Ha) and 9.5 ppm (Hb), corresponding to the two types of urethane linkage present in the polymer backbone, which is also reflected in the 13C NMR spectra. The aromatic reacting partner used in polyurethane synthesis was identified by a peak in the aromatic region at ∼7.08 to ∼7.33 ppm in 1H NMR. Varying the condition of functionalization corresponds to a new peak intensity, which at 10.5 ppm (–SO3H) varied, which reflects that the degree of substitution increases in the case of SPU-2 than SPU-1, as supported by a N–H proton, which was found at 9.5 ppm and completely disappeared in the case of highly functionalized SPU-2. But the low degree of functionalization of SPU-1 resulted in a weak characteristic signal that was distinguishable only in the zoomed-in spectrum (Figure 1b). The proton of the alkyl chain of 1,3-Propane sultone was observed at 3.96 ppm, 1.43 ppm, and 1.20 ppm, confirming the functionalization [26,27].
In the 13C NMR spectrum of PU and SPU, the urethane carbonyl carbon peaks, which appear at 162 ppm and 168 ppm in the case of unfunctionalized polyurethane, shifted to 167 ppm and 176 ppm after functionalization, as shown in Figure 1c. This deshielded behaviour was attributed to alkylation of the nitrogen atom in the urethane group. Also, peak shifting was observed in the case of aromatic carbons, which present around 115–130 ppm, which shifted to higher ppm, and a few new peaks came into the picture that belong to the alkyl chain of 1,3-Propane sultone, which are positioned at 28.5, 31.2, and 66.4 ppm, confirming the functionalization of polyurethane [28,29]. Equation (4) is used to calculate the degree of sulphonation.
where ‘C’ is the peak area of the proton signal attributed to the SO3–H group, and ‘Aro–H’ is the proton signal attributed to aromatic hydrogen. Based on these peak integrations, the degree of sulfonation was calculated to be 28% for SPU-1 and 64% for SPU-2. So, NMR studies confirm that SPU-2 shows higher substitution of the urethane N–H hydrogen atoms through sulphonate groups as compared to SPU-1.
Figure 1d shows the FTIR spectra of PU and SPU. Pure PU exhibits a characteristic absorption band at 3308 cm−1, corresponding to the hydrogen-bonded >N–H group in the hard segment, which contributes to the stacking arrangement of the polymer. In contrast, the functionalized PU samples display broad bands at 3321 and 3348 cm−1 for SPU-1 and SPU-2, respectively, with the peak position progressively shifting to higher wavenumbers in SPU-2 as the degree of sulfonation increases, and this shifting occurs due to the stronger electron-withdrawing effect of the sulfonic group in the case of SPU-2 than that of SPU-1[30]. A new intense absorption band appears at 1174 cm−1 for SPU-1 and at 1181 cm−1 for SPU-2. This band is linked to the symmetric stretching vibration of the S=O group. The appearance of this band confirms the successful incorporation of sulfonate groups at different degrees of sulfonation within the polymer backbone. Notably, these absorption bands are absent in pristine PU. The gradual shift in the FTIR peak positions as sulfonation increases is due to the stronger electron-withdrawing effect of the sulfonic group and improved intermolecular hydrogen bonding between the sulfonate groups and the >NH moieties [31,32].
Figure 1e XRD analysis is conducted to investigate the crystallinity of the samples utilized in this study. The results indicate that aromatic moiety-based pure polyurethane exhibits an amorphous nature, showing a single diffuse peak at approximately 2θ = 21°, while SPU-1 and SPU-2 crystallinity is evident from the extra peak at approximately 25°, 28°, 31° in SPU-1 and 19°, 22°, 27°, 30.5°, 32°, 47° in SPU-2. However, SPU-2 is more crystalline than SPU-1, presumably due to a higher degree of sulphonation that results in stronger intermolecular hydrogen bonding between the sulfonic acid and urethane (–NH–COO–) groups [30,33].
Figure 1f shows the UV-visible absorption spectra of both pristine and functionalized PU samples. The pristine PU has an absorption peak at 295 nm, which relates to the n → π* transition. In comparison, the functionalized polymers, SPU-1 and SPU-2, show broad absorption bands at 297 nm and 305 nm. These are primarily due to the sulfonate groups through the n → π* transition [34]. Notably, another peak of pure PU at 358 nm and the functionalized PUs show at 364 nm SPU-1 and 368 nm SPU-2. In functionalized PU, the absorption peaks shift from pristine PU as sulfonation increases; the absorption peak progressively shifts toward a higher wavelength, indicating improved intermolecular interactions through specific interactions. The shift of the absorption edge toward the visible region at higher sulfonation levels also suggests a size quantization effect [35,36]. The optical band gap obtained from Tauc plots and the corresponding energy level analysis are shown in Figure S1d. Overall, the spectroscopic results confirm successful sulfonation at different levels and demonstrate the potential of the functionalized PU as a promising material for solar cell applications.
The thermal stability of PU and functionalized PU was evaluated using thermogravimetric analysis (TGA), which monitors weight loss as a function of temperature. A two-step degradation pattern was observed for PU, SPU-1, and SPU-2. However, the functionalized PU (SPU-1) exhibited comparatively lower thermal stability as compared to SPU-2 due to the early decomposition of the sulfonate groups (Figure 1g). The breakdown of the hard segments of the polyurethane chains is responsible for the initial weight loss at lower temperatures, while the breakdown of the soft segments is responsible for the weight loss at higher temperatures. A slight weight loss at the initial stage in SPU-1 is associated with the evaporation of adsorbed moisture, which is due to the hydrophilic nature of the functionalized polyurethane [37]. The DSC thermograms of the synthesized polyurethane (PU) and sulphonated polyurethane (SPU), which are presented in Figure 1h. The pristine PU exhibited a broad thermal transition centered at approximately 43.6 °C, attributed to the melting of the PTMG-rich soft segment. Following sulphonation, the thermal transitions shifted towards higher temperatures. SPU-1 exhibited broad transitions at approximately 94 °C and 156.6 °C, while SPU-2 showed further shifts to around 114.66 °C and 186.3 °C. The rise in transition temperatures is attributed to the addition of sulfonic acid (–SO3H) groups, which improve intermolecular hydrogen bonding, promote ionic aggregation, and restrict polymer chain mobility. Therefore, more thermal energy is needed to start segmental motion. The extensive temperature transitions originate from the heterogeneous microphase-separated structure of the segmented polyurethane and the unequal distribution of hydrogen-bonding contacts and sulfonic acid functionalities [38,39]. Overall, the DSC results show that the thermal rigidity of the polyurethane network and its intermolecular interactions improve with increasing degree of sulphonation.
The molecular properties and surface charge of the resulting prepolymer, polyurethane (PU), and sulphonated polyurethane (SPU-2) were characterized by dynamic light scattering (DLS) and zeta potential measurements using DMF as the dispersion medium, as shown in Figure 1i. The estimated molecular weight increased progressively from about 35 kDa for the prepolymer to 47 kDa for PU, and reached 67 kDa for SPU-2 [40]. The steady rise in molecular weight verifies successful chain extension during polyurethane synthesis, whereas the increasing molecular weight of SPU reveals the efficient insertion of sulphonate groups into the polymer backbone. SPU-2 seen somewhat higher apparent molecular weight, indicates that the addition of ionic functional groups improves polymer-solvent interactions in DMF, resulting in enhanced hydrodynamic volume and chain expansion. Additionally, the polymer network’s intermolecular connections are strengthened by the presence of sulfonic acid groups and the hydrogen-bonding interactions that accompany them [41]. After chemical treatment, a consistent fluctuation was seen in the zeta potential data. The zeta potential of the prepolymer is −0.47, revealing a nearly neutral surface with few ionizable groups. For polyurethane, the zeta potential slightly shifts to a more negative value (−2.13), due to some rise in surface charge polarity by the addition of the sulphonic group. But in the case of SPU-2, a much larger negative zeta potential (−17.0 mV) was demonstrated, which happened because of the efficient insertion of sulphonate (–SO3−) groups into the polyurethane backbone, shown in Figure S1e and S1f. Since the DMF solvent is polar, so these highly acidic ionic groups dissolve, increasing the negative surface charge and improving the electrostatic stability of the polymer dispersion [42,43].
3.2. XRD, UV, FTIR, and TEM Analysis of Synthesized QDs
X-ray diffraction (XRD) was used to examine the phase purity and crystal structure of the synthesized CuInS2 nanoparticles. The diffraction pattern of CuInS2 is shown in Figure 2a. The distinct diffraction peaks were observed at 2θ values of 27.49° and 46.05°, which are consistent with the standard JCPDS card No. 85–1575, indicating the successful formation of crystalline CuInS2 nanoparticles. The synthetic material’s nanocrystalline structure is evident in the broad shape of the diffraction peaks [44]. The Debye-Scherrer equation yielded an average crystallite size of 12.66 Å. These small-sized CuInS2 QDs have a high surface-to-volume ratio, which underscores their potential as an effective absorber material for photovoltaic applications [45].
Figure 2b displays the synthesized CuInS2 QDs’ UV-vis absorption spectra. At 574 nm, a distinctive absorption peak is seen, which is in good agreement with values published in the literature [46]. While uncapped CuInS2 quantum dots have been reported in literature to have an absorption band of around 512 nm [47]. The red shift of the absorption peak during DDT capping is attributed to a change in the surface electronic environment and improved surface passivation, which can reduce surface trap states and improve visible light absorption. The results suggest that the optical properties of CuInS2 quantum dots can significantly be improved through DDT capping, indicating their potential applications in photovoltaic devices [34]. The optical band gap of CuInS2 QDs is 1.78 eV, as calculated from Tauc’s plots of the CIS QD absorption spectra, shown in Figure 2c.
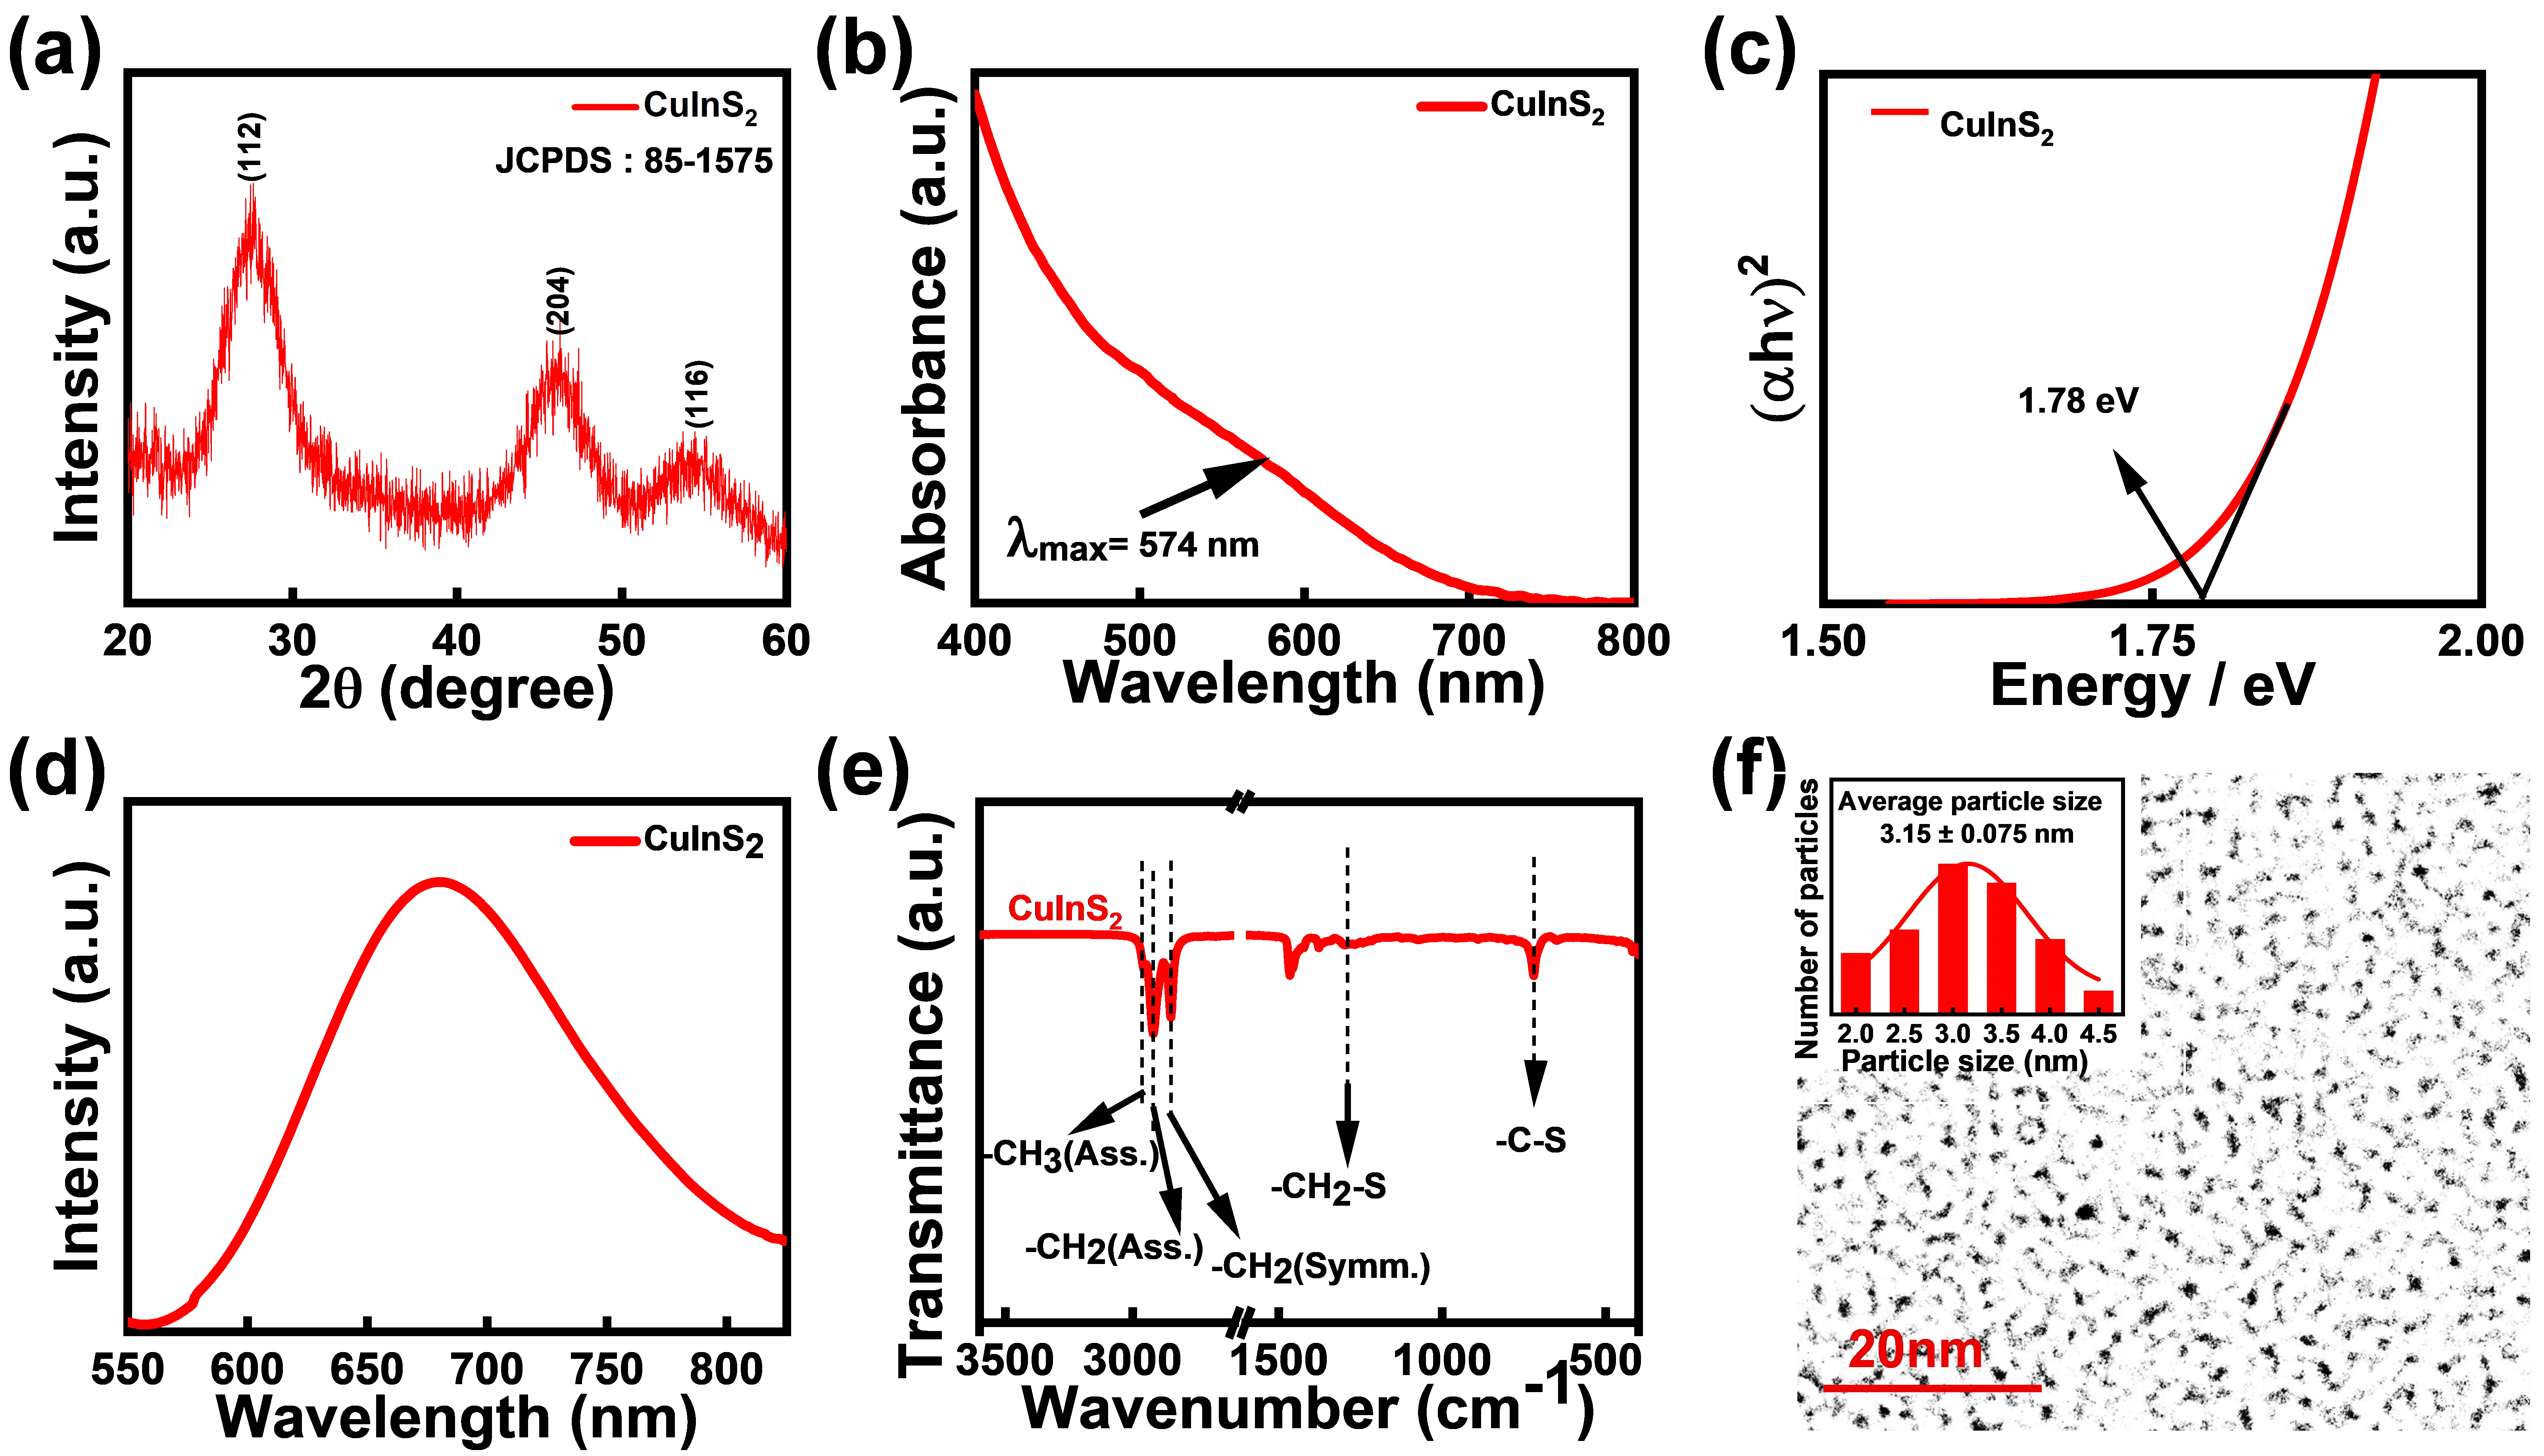
Figure 2. (a) Indicates the crystalline structure of CuInS2 QDs; (b) UV-vis absorption spectra of CuInS2 QDs; (c) optical band measurement of CuInS2 QDs; (d) Photoluminescence (PL) spectrum of CuInS2 QDs (at 680 nm); (e) FTIR spectra of the synthesized CuInS2 QDs; (f) TEM image and particle size distribution histogram (inset) of CuInS2 QDs.
Figure 2d shows the photoluminescence (PL) spectrum of the CuInS2 QDs, revealing efficient radiative recombination of photoexcited charge carriers, with a strong, broad emission band at approximately 680 nm. The emission of CuInS2 QDs at 680 nm is consistent with values reported in the literature [48].
The FTIR spectrum of the CuInS2 quantum dots (QDs) capped with DDT is shown in Figure 2e. The spectra show three main absorption bands at 2968, 2925, and 2857 cm−1. These bands correspond to the asymmetric stretching vibration of –CH3, the asymmetric stretching vibration of –CH2, and the symmetric stretching vibration of –CH2, respectively. Moreover, the bands at 722 cm−1 are attributed to the wagging vibration of –CH₂–S, and those at 1292 cm−1 to the stretching vibration of C–S. The successful synthesis of DDT-capped CuInS2 QDs is indicated by these characteristic vibrational bands, which confirm the presence of DDT as the surface ligand [34].
Figure 2f shows the TEM image of the synthesized CuInS2 nanoparticles, which confirms the uniformly dispersed nanoparticles with almost spherical size and without agglomeration. The average particle size of CuInS2 QDs is 3.15 nm (inset, Figure 2f), confirming the effective synthesis of ultrasmall CuInS2 quantum dots with a limited size distribution. Their ultrasmall size gives a high surface-to-volume ratio, which is helpful for greater light harvesting, efficient charge transfer, and improved interfacial interactions, consequently making these nanoparticles suitable for photovoltaic and other optoelectronic applications [49,50].
3.3. Electrical Characterization of QDSSCs
3.3.1. Ionic Transport Nature of Pure Polymer and Functionalized Polymer
The electrical conductivity of the polymeric gel electrolytes has a significant impact on the photovoltaic performance of the fabricated devices. Therefore, the strong ionic conductivity of polymer electrolytes enables efficient hole transport during device operation. Electrochemical impedance spectroscopy (EIS) was used to assess the ionic conductivity of the synthesized polymers, and fitting and simulation techniques were applied to the associated Nyquist plots to determine the polarization resistance (Figure 3a and Figure S1g). The resistance values of pure polyurethane, SPU-1, and SPU-2 films were found to be 5.1 × 10⁶ Ω, 2.1 × 10³ Ω, and 51 Ω, respectively. Using Equation (3), the ionic conductivities of pure polyurethane, SPU-1, and SPU-2 were calculated as 1.1 × 10⁻¹⁰ S·cm−1, 4.76 × 10⁻⁶ S·cm−1, and 3.7 × 10⁻⁴ S·cm−1, respectively, as shown in Figure 3b. SPU-2 is appropriate as a hole transport layer for solar applications since its ionic conductivity is within the semiconducting range. This has happened because by adding ionizable sulfate groups creates mobile charge carriers and interconnected ionic pathways, thereby increasing polyurethane’s ionic conductivity. It facilitates effective ion transport and lowers the polymer matrix’s overall resistance [51,52].
3.3.2. Cyclic Voltammetry and Energy Profile Diagram
The HOMO and LUMO energy levels of functionalized polymer and ETLs, and the valence band (VB) and conduction band (CB) locations of the active layer (CIS QDs) were measured using cyclic voltammetry (CV). The oxidation onset potentials of SPU-2 and CIS QDs were recorded at 0.60 V and 0.85 V, respectively (Figure 3c,d). The HOMO energy levels of SPU-2 and CIS QDs were calculated to be −5.00 eV and −5.25 eV, respectively, using Equation (1) and the optical band gaps derived from the Tauc plots (Figure 2c and Figure S1d). Based on the optical band gaps of SPU-2 (3.05 eV) and CIS QDs (1.78 eV), the corresponding LUMO energy levels were determined to be −1.95 eV and −3.47 eV, respectively (Figure 3g,h) [15,53]. Likewise, the reduction onset potentials of TiO2 and SnO2 were measured at −0.50 V and −0.26 V, respectively (Figure 3e,f). Applying Equation (2) and the optical band gaps derived from the Tauc plots (Figure S1h), the LUMO energy levels of TiO2 and SnO2 were calculated to be −3.9 eV and −4.2 eV, respectively. Their corresponding HOMO energy levels, obtained from the respective optical band gaps (TiO2 is 3.28 eV and SnO2 is 3.63 eV), were determined to be −7.18 eV and −7.83 eV, respectively [54,55], as illustrated in Figure 3g,h.
The energy band alignment suggests favorable hole transport in both Device-1 and Device-2. The valence band (VB) of the CuInS2 quantum dots (QDs) is well aligned with the HOMO level of the polymer gel electrolyte, with a small energy offset of 0.25 eV, which promotes efficient hole extraction. In addition, the energy difference of 0.30 eV between the HOMO level of the gel electrolyte and the Ag counter electrode supports rapid hole transfer, thereby ensuring efficient hole transport in both devices [56].
In contrast, there are significant differences in the electron transport route. In Device-1, the energy difference between the TiO2 LUMO and the FTO electrode is 0.50 eV, whereas the energy offset between the conduction band (CB) of the CuInS2 QDs and the LUMO level of the TiO2 electron transport layer (ETL) is 0.43 eV. These relatively high energy barriers make it difficult for electrons to be injected and transported, thereby increasing charge buildup, reducing photocurrent density, and eventually lowering power conversion efficiency, as reflected in the case of Device-1 (Figure 3g) [57,58]. A more advantageous cascade energy-level alignment is established for Device-2 by adding a SnO2 interlayer between the FTO substrate and TiO2. The energy offset between the LUMO levels of TiO2 and SnO2 reduces to 0.30 eV, but the energy difference between SnO2 and the FTO electrode is just 0.20 eV. By facilitating more effective electron transport from TiO2 to SnO2 and then to the FTO electrode, these lower energy barriers minimize charge recombination, enhance electron collecting, raise photocurrent density, and eventually provide a higher PCE than Device-1 (Figure 3h) [59].
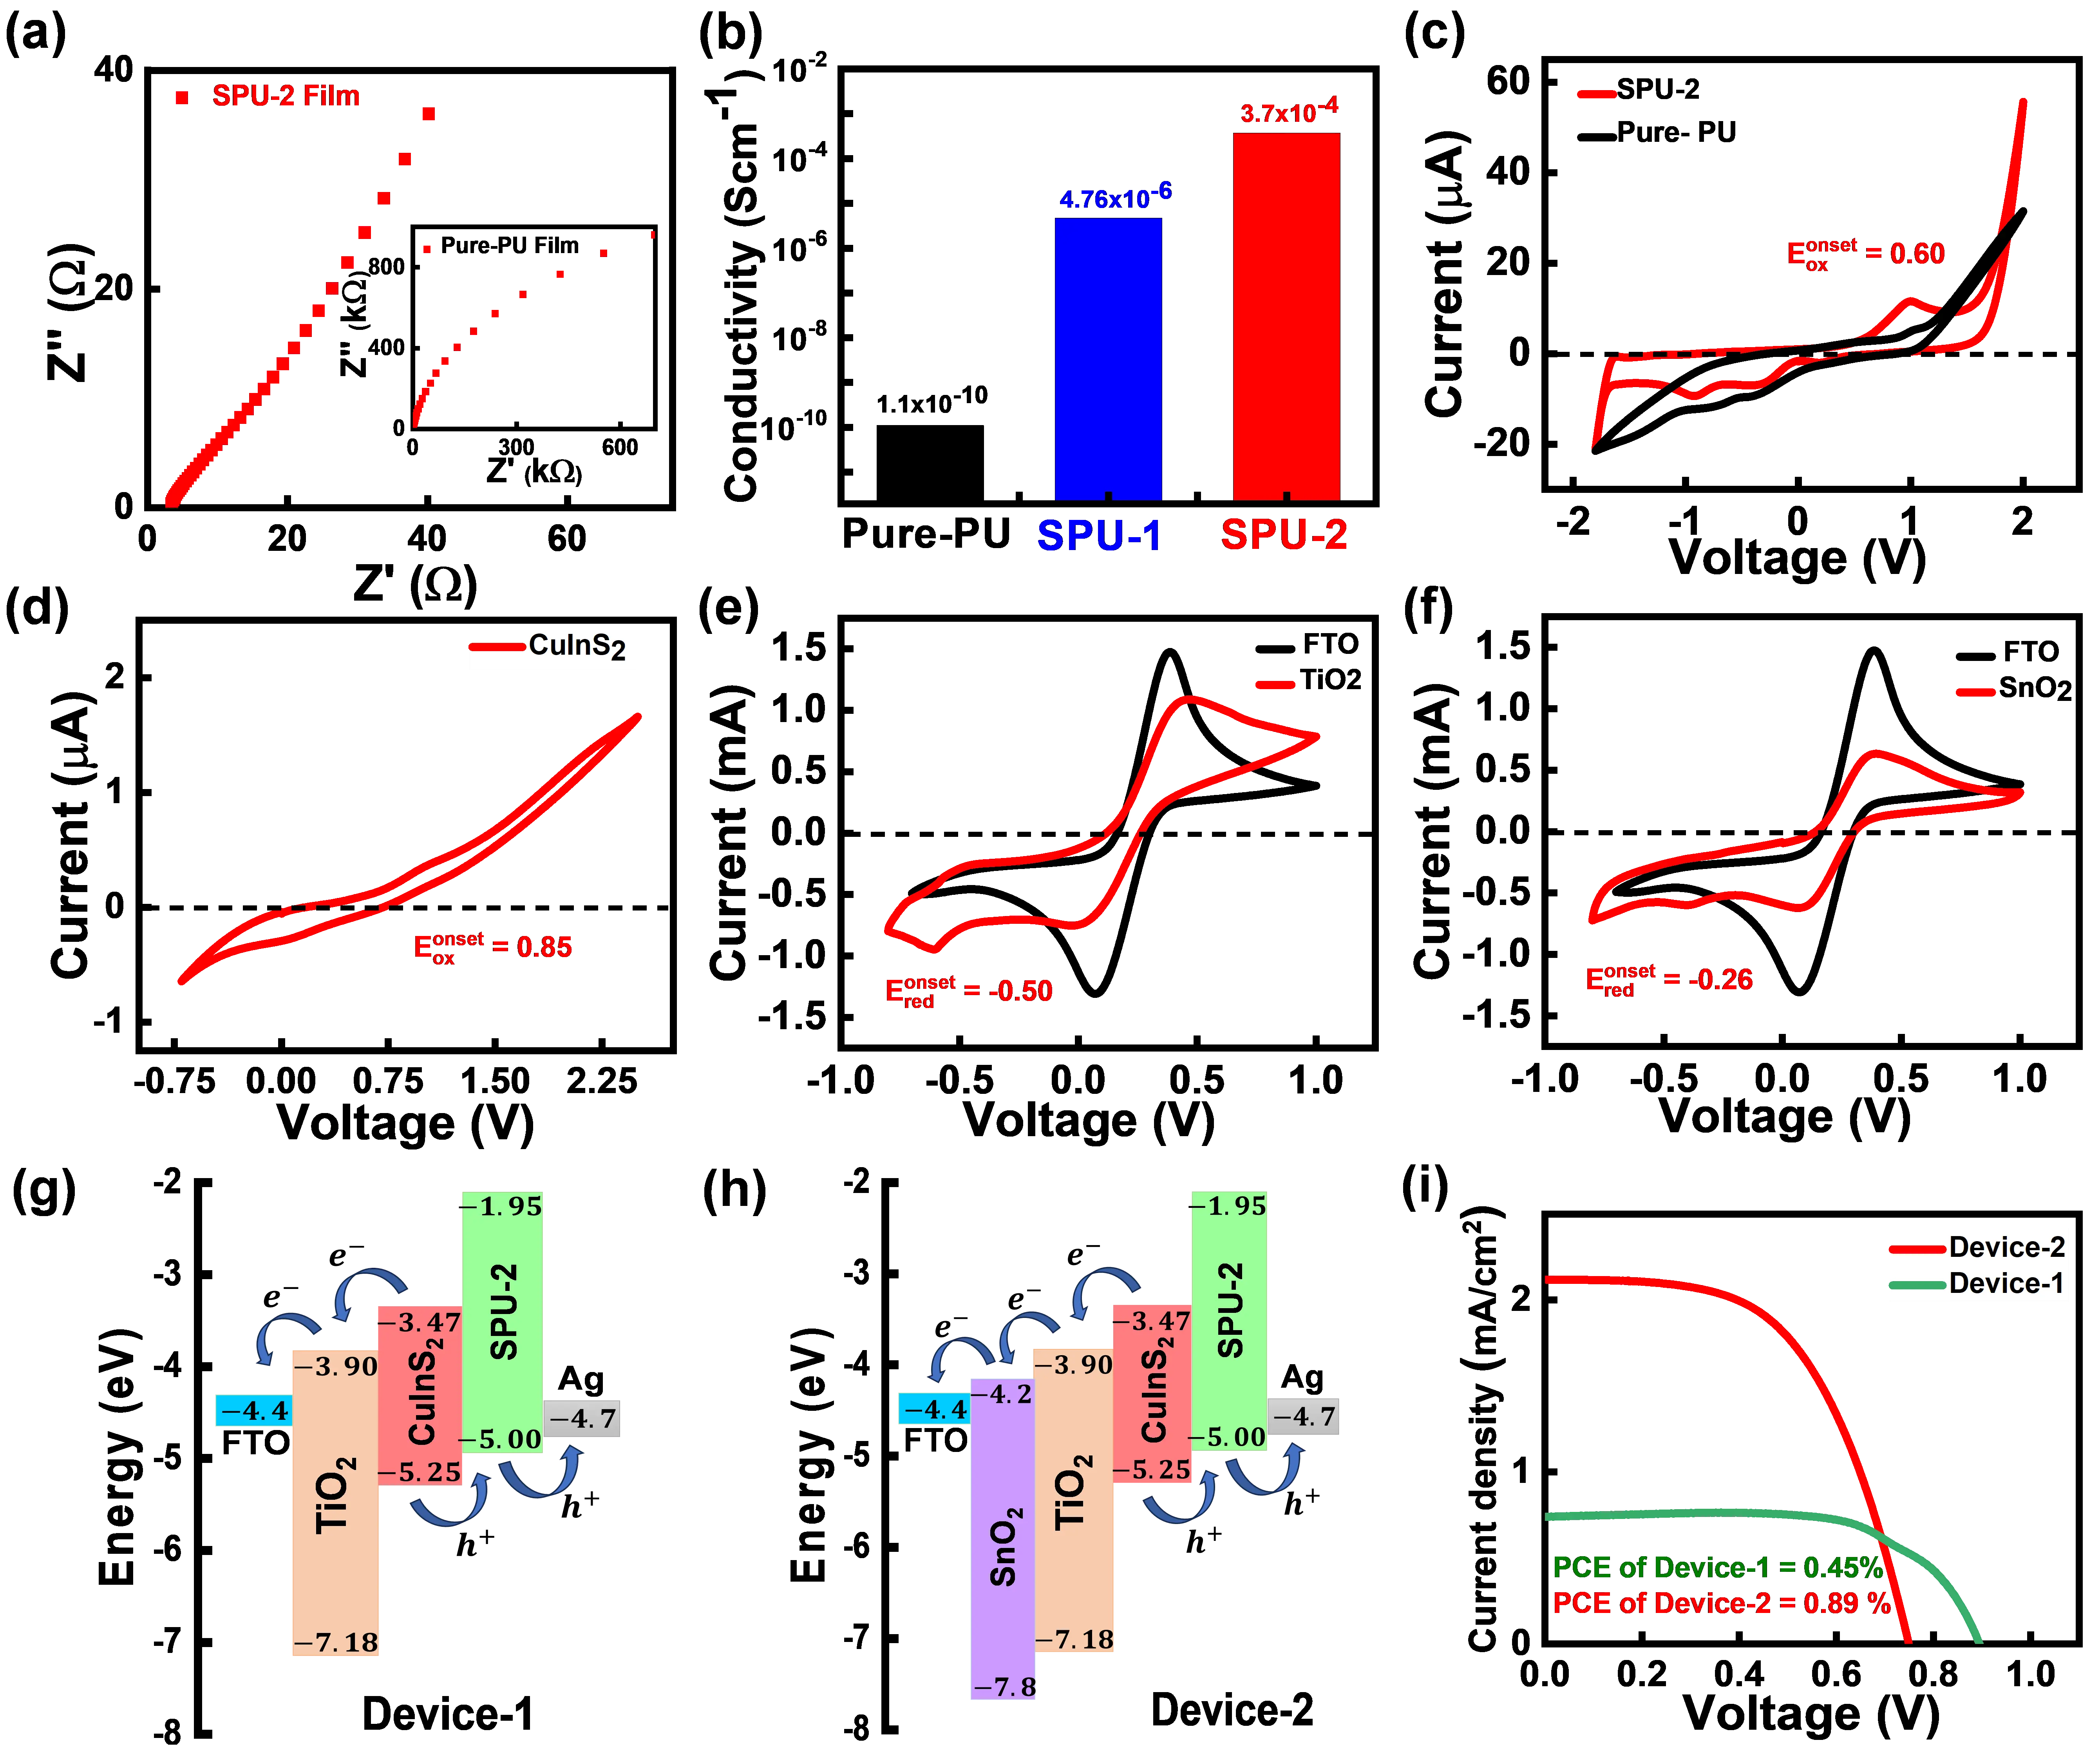
Figure 3. (a) Nyquist plots for SPU-2 and pure PU (inset); (b) histogram plot for ionic conductivity of pure-PU, SPU-1 and SPU-2 polymers; (c) CV measurement of indicated pure PU and SPU-2; (d) CV curve of CuInS2 QDs; (e,f) CV curve of TiO2 and SnO2 film on FTO; (g,h) band diagram of Device-1 and Device-2; (i) J-V characteristic curve of Device-1 and Device-2.
3.3.3. Photovoltaic Performance
The J–V characteristics of the fabricated devices under standard AM 1.5G illumination appear in Figure 3i, and the corresponding photovoltaic parameters are summarized in Table 1 below. Device-1, which uses TiO2 as ETL, delivers a PCE of 0.45%, along with FF of 67%, Jsc of 0.74 mA/cm2, and Voc of 0.89 V. But Device-2, by incorporating SnO2/TiO2 bilayer ETL, records higher performance, achieving a PCE of 0.89%, FF of 56%, Jsc of 2.12 mA/cm2, and Voc of 0.75 V. And the dark current of Device-1 and Device-2 is shown in Figure S1i.
Table 1. Experimental values of the different parameters of Device-1 and Device-2.
|
HTL |
QDs |
Jsc (mA/cm2) |
Voc (V) |
FF (%) |
PCE (%) |
Refs. |
|---|---|---|---|---|---|---|
|
P3HT: PCBM |
CuInS2 |
4.48 |
0.539 |
34.7 |
0.84 |
[60] |
|
PCBM |
CuInS2 |
1.69 |
0.46 |
46.3 |
0.36 |
[60] |
|
PEDOT: PSS |
CuInS2 |
7.76 × 10⁻³ |
0.62 |
22.7 |
0.0068 |
[61] |
|
$${\mathrm{S}}_{\mathrm{n}}^{2-}$$/$${\mathrm{S}}^{2-}$$ |
CuInS2 |
9.87 |
0.57 |
48 |
2.61 |
[62] |
|
$${\mathrm{S}}_{\mathrm{n}}^{2-}$$/$${\mathrm{S}}^{2-}$$ |
CuInS2 |
26.93 |
0.53 |
57 |
8.1 |
[63] |
|
SPU-2 |
CuInS2 |
0.74 |
0.89 |
67 |
0.45 |
This work (Device-1) |
|
SPU-2 |
CuInS2 |
2.12 |
0.75 |
56 |
0.89 |
This work (Device-2) |
The incorporation of the SnO2/TiO2 bilayer ETL significantly increased the photocurrent density from 0.74 to 2.12 mA·cm−2, due to enhanced electron extraction, higher electron mobility, and improved charge transport. Although the device exhibited a lower Voc (0.75 V) and FF (56%), likely because of the lower conduction-band edge of SnO2 and increased interfacial recombination at the SnO2/TiO2 interface, the marked improvement in Jsc outweighed these losses. Consequently, the power conversion efficiency nearly doubled from 0.45% to 0.89% [59,64]. Hence, by using SPU as HTL, the PCE of Device-1 and Device-2 is lower than that of the inorganic hole transport layers. Inorganic HTLs have higher charge mobility, better chemical stability, and greater resistance to heat and moisture [65]. However, when SPU is used as the HTL, PCE is comparable to or higher than that of several previously reported CuInS2 QDSSCs that use polymeric hole transport layers.
4. Conclusions
The successful functionalization of PU is confirmed by 1H NMR, FTIR, and UV-vis spectroscopy. Quantitative analysis of the 1H NMR spectra, based on relative peak areas, revealed a maximum degree of sulfonation of 64%. The introduction of sulfonate groups into the PU resulted in a hydrophilic, electrically conductive ionomer, making it suitable for use as a polymer gel electrolyte in QDSSCs. The HOMO and LUMO energy levels of the gel electrolytes were systematically tuned by modulating the degree of sulfonation as obtained from cyclic voltammetry (CV) and optical band-gap measurements from UV-vis absorption spectroscopy. The increasing degree of functionalization also led to a higher melting temperature than pristine PU, which could be explained by stronger specific interactions between the sulfonate ionic groups and the urethane (>N–H) moieties along the polymer backbone.
The polymer gel electrolyte reduced electron back transfer and charge recombination at the surface while limiting electrolyte leakage and improving the built-in potential of the device. This led to notable high gains in open-circuit voltage and fill factor. Device-1 had a Voc of 0.89 V and an FF of 67%. In contrast, Device-2 had a Voc of 0.75 V and FF of 56%. To control nanocrystal growth and ensure colloidal stability, DDT was used as a capping agent during the synthesis of capping ligands, yielding CuInS2 QDs with an average particle size of 3.15 nm. Device-1 used a TiO2 electron transport layer (ETL), while Device-2 used a bilayer SnO2/TiO2 ETL. Using Tauc plot analyses and CV measurements, the energy band alignment of functionalized polymer gel electrolytes, CuInS2 QD sensitizers and ETLs was investigated and an optimum energy level alignment diagram of the photoanode, the gel electrolyte, and the Ag counter electrode was constructed by appropriately tuning the size of the QDs, the PU functionalization and the ETL structure to study the electron and hole movement behaviour of electrons and holes.
For Device-2 (FTO/SnO2/TiO2/CuInS2/SPU-2/Ag), by introduced a SnO2/TiO2 bilayer ETL between FTO and CuInS2 ETL, which enhanced the photocurrent density from 0.74 mA·cm−2 (Device-1) to 2.12 mA·cm−2 owing to effective electron transport and extraction. Which led to a higher PCE value of 0.89% as compare to Device-1 (FTO/TiO2/CuInS2/SPU-2/Ag) PCE, 0.45%. Finally, these results indicated that the functionalized polyurethane HTL, when used together with a SnO2/TiO2 bilayer ETL, can effectively promote charge transfer and enhance photovoltaic performance in CuInS2-based QDSSCs.
Supplementary Materials
The following supporting information can be found at: https://www.sciepublish.com/article/pii/1188, Figure S1: (a) show digital photographs of unetched and etched FTO-coated glass; (b) digital photograph of Ag and TiO2 coated FTO; (c) digital photograph of Device-1 and Device-2; (d) zetapotential graph of Pre-PU, PU, and SPU-2; (e) graph of relative frequency and zetapotential of Pre-PU, PU and SPU-2; (f) histogram of the zetapotential of Pre-PU, PU and SPU-2; (g) Nyquist plots for SPU-1; (h) UV-vis absorbance spectra and Tauc plot curve (inset) of TiO2 and SnO2; (i) Dark I-V curve of Device-1 & Device-2; Figure S2: (a) 1H NMR spectra of PU; (b) 1H NMR spectra of SPU-1 andSPU-2.
Acknowledgements
The authors are grateful to IIT (BHU) and its Central Instrument Facility; U.P. thanks IIT (BHU) for providing the PMRF fellowship (ID-1103081); A.K. is thankful to UGC, India, for providing the SRF; A.D. acknowledges the receipt of a research fellowship from the institute (IIT BHU).
Author Contributions
Conceptualization, P.M. and U.P.; Methodology, U.P.; Validation, U.P., S.K., A.K. and A.D.; Formal Analysis, U.P.; Investigation, U.P.; Data Curation, U.P.; Writing—Original Draft Preparation, U.P. and A.K.; Writing—Review & Editing, U.P. and P.M.; Visualization, U.P.; Supervision, P.M.
Ethics Statement
This study did not involve human participants, animals, or any biological samples requiring ethical approval.
Informed Consent Statement
This study did not involve human participants.
Data Availability Statement
The data presented in this study are available from the corresponding author upon reasonable request.
Funding
This research was funded by the Prime Minister’s Research Fellowship (PMRF), Government of India.
Declaration of Competing Interest
The authors declare that they have no known competing financial interests or personal relationships that could have appeared to influence the work reported in this paper.
References
- Yu Y, Ma T, Huang H. Semiconducting Quantum Dots for Energy Conversion and Storage. Adv. Funct. Mater. 2023, 33, 2213770. DOI:10.1002/adfm.202213770 [Google Scholar]
- Duan L, Hu L, Guan X, Lin C, Chu D, Huang S, et al. Quantum Dots for Photovoltaics: A Tale of Two Materials. Adv. Energy Mater. 2021, 11, 2100354. DOI:10.1002/aenm.202100354 [Google Scholar]
- Kokilavani S, Selopal GS. Advanced Surface Engineering and Passivation Strategies of Quantum Dots for Breaking Efficiency Barrier of Clean Energy Technologies: A Comprehensive Review. Adv. Funct. Mater. 2026, 36, e12718. DOI:10.1002/adfm.202512718 [Google Scholar]
- Buitrago E, Novello AM, Meyer T. Third‐Generation Solar Cells: Toxicity and Risk of Exposure. Helv. Chim. Acta. 2020, 103, e2000074. DOI:10.1002/hlca.202000074 [Google Scholar]
- Gidwani B, Sahu V, Shukla SS, Pandey R, Joshi V, Jain VK, et al. Quantum dots: Prospectives, toxicity, advances and applications. J. Drug Deliv. Sci. Technol. 2021, 61, 102308. DOI:10.1016/j.jddst.2020.102308 [Google Scholar]
- Dong C, Liu R, Cao W, Meng W, Wang M. 6.56% Efficient CuInS2 Superstrate Solar Cells Enabled by an Amorphous Tin Oxide Interlayer. ACS Appl. Energy Mater. 2026, 9, 2884–2891. DOI:10.1021/acsaem.6c00146 [Google Scholar]
- Peng Z, Gu Y, Li X, Lu B, Zhang X, Zhang Y, et al. High‐Performance CuInS2 Quantum Dot Sensitized Solar Cells Through I−/MPA Dual‐Ligands Passivation. Chem. Asian J. 2024, 19, e202400836. DOI:10.1002/asia.202400836 [Google Scholar]
- Shishodia S, Rinnert H, Balan L, Jasniewski J, Bruyère S, Medjahdi G, et al. Microwave-assisted synthesis of highly photoluminescent core/shell CuInZnSe/ZnS quantum dots as photovoltaic absorbers. Nanoscale Adv. 2025, 7, 1326–1334. DOI:10.1039/D4NA00893F [Google Scholar]
- Peng Z, Sun Z, Chen J, Li W, Chen J, Liu Y, et al. Enhanced charge generation and transfer performance of the conical bamboo-like TiO2 nanotube arrays photo-electrodes in quantum dot sensitized solar cells. Sol. Energy 2020, 205, 161–169. DOI:10.1016/j.solener.2020.05.026 [Google Scholar]
- Rahman A, Jennings JR, Khan MM. CuInS2 and CuInS2-based nanostructures as photocatalysts. Mater. Sci. Semicond. Process. 2024, 169, 107930. DOI:10.1016/j.mssp.2023.107930 [Google Scholar]
- Yoon N, Joo O, Chae S, Park E. Recent Advances in CuInS2-Based Photocathodes for Photoelectrochemical H2 Evolution. Nanomaterials 2023, 13, 1361. DOI:10.3390/nano13081361 [Google Scholar]
- Shilpa G, Kumar PM, Kumar DK, Deepthi PR, Sadhu V, Sukhdev A, et al. Recent advances in the development of high efficiency quantum dot sensitized solar cells (QDSSCs): A review. Mater. Sci. Energy Technol. 2023, 6, 533–546. DOI:10.1016/j.mset.2023.05.001 [Google Scholar]
- Guan S, Cao M, Jiao S, Ma R, Xi R, Hu C, et al. Dye‐Sensitized Solar Cells With Quasi‐Solid‐State Electrolytes Based on Freeze‐Dried Hydrogel Porous Structures. ChemistrySelect 2025, 10, e01854. DOI:10.1002/slct.202501854 [Google Scholar]
- Daems K, Yadav P, Dermenci KB, Van Mierlo J, Berecibar M. Advances in inorganic, polymer and composite electrolytes: Mechanisms of Lithium-ion transport and pathways to enhanced performance. Renew. Sustain. Energy Rev. 2024, 191, 114136. DOI:10.1016/j.rser.2023.114136 [Google Scholar]
- Kumar S, Maurya IC, Prakash O, Srivastava P, Das S, Maiti P. Functionalized Thermoplastic Polyurethane as Hole Conductor for Quantum Dot-Sensitized Solar Cell. ACS Appl. Energy Mater. 2018, 1, 4641–4650. DOI:10.1021/acsaem.8b00783 [Google Scholar]
- Kumar S, Maiti P. Review on Functional Electrolyte, Redox Polymers, and Solar Conversions in 3G Emerging Photovoltaic Technologies: Progress and Outlook. Energy Fuels 2023, 37, 14473–14511. DOI:10.1021/acs.energyfuels.3c01695 [Google Scholar]
- Ogundeji TS, Alamu GA, Oyewole OJ, Johnson MJ, Olaoye AO, Vyas S, et al. Review of recent progress in enhanced quantum dot solar cells via plasmonic nanostructures. Next Mater. 2026, 11, 101599. DOI:10.1016/j.nxmate.2026.101599. [Google Scholar]
- Prakash R, Maiti P. Functionalized Thermoplastic Polyurethane Gel Electrolytes for Cosensitized TiO2/CdS/CdSe Photoanode Solar Cells with High Efficiency. Energy Fuels 2020, 34, 16847–16857. DOI:10.1021/acs.energyfuels.0c03250 [Google Scholar]
- Li L, Pandey A, Werder DJ, Khanal BP, Pietryga JM, Klimov VI. Efficient Synthesis of Highly Luminescent Copper Indium Sulfide-Based Core/Shell Nanocrystals with Surprisingly Long-Lived Emission. J. Am. Chem. Soc. 2011, 133, 1176–1179. DOI:10.1021/ja108261h [Google Scholar]
- Wang Z, Zhang X, Xin W, Yao D, Liu Y, Zhang L, et al. Facile Synthesis of Cu–In–S/ZnS Core/Shell Quantum Dots in 1-Dodecanethiol for Efficient Light-Emitting Diodes with an External Quantum Efficiency of 7.8%. Chem. Mater. 2018, 30, 8939–8947. DOI:10.1021/acs.chemmater.8b04282 [Google Scholar]
- Aldakov D, Sajjad MT, Ivanova V, Bansal AK, Park J, Reiss P, et al. Mercaptophosphonic acids as efficient linkers in quantum dot sensitized solar cells. J. Mater. Chem. A 2015, 3, 19050–19060. DOI:10.1039/C5TA04021C [Google Scholar]
- Kumagai S, Motokucho S, Yabuki R, Anzai A, Kameda T, Watanabe A, et al. Effects of hard- and soft-segment composition on pyrolysis characteristics of MDI, BD, and PTMG-based polyurethane elastomers. J. Anal. Appl. Pyrolysis 2017, 126, 337–345. DOI:10.1016/j.jaap.2017.05.012 [Google Scholar]
- Santra A, Prakash R, Maity S, Nilawar S, Chatterjee K, Maiti P. Core–Shell Structure of Photopolymer-Grafted Polyurethane as a Controlled Drug Delivery Vehicle for Biomedical Application. ACS Appl. Mater. Interfaces 2024, 16, 17193–17207. DOI:10.1021/acsami.3c19155 [Google Scholar]
- Pramanik S, Chakraborty R, Maurya PP, Suman S, Swaminathan P, Pal BN. Oxide Memristor of Ag/Ag+ Doped V2O5 and SnO2 Bilayer Thin Film for Energy Efficient Memory, Logic and Neuromorphic Device Application. Adv. Funct. Mater. 2026, 36, e14732. DOI:10.1002/adfm.202514732 [Google Scholar]
- Peng S, Cheng F, Liang J, Tao Z, Chen J. Facile solution-controlled growth of CuInS2 thin films on FTO and TiO2/FTO glass substrates for photovoltaic application. J. Alloys Compd. 2009, 481, 786–791. DOI:10.1016/j.jallcom.2009.03.084 [Google Scholar]
- Parcheta P, Głowińska E, Datta J. Effect of bio-based components on the chemical structure, thermal stability and mechanical properties of green thermoplastic polyurethane elastomers. Eur. Polym. J. 2020, 123, 109422. DOI:10.1016/j.eurpolymj.2019.109422 [Google Scholar]
- Polo ML, Spontón ME, Jaramillo F, Estenoz DA, Meira GR. Linear segmented polyurethanes: I. A kinetics study. J. Appl. Polym. Sci. 2018, 135, 45747. DOI:10.1002/app.45747 [Google Scholar]
- Tang Q, Gao K. Structure analysis of polyether-based thermoplastic polyurethane elastomers by FTIR, 1H NMR and 13C NMR. Int. J. Polym. Anal. Charact. 2017, 22, 569–574. DOI:10.1080/1023666X.2017.1312754 [Google Scholar]
- Stefanović IS, Špírková M, Poręba R, Steinhart M, Ostojić S, Tešević V, et al. Study of the Properties of Urethane–Siloxane Copolymers Based on Poly(propylene oxide)-b-poly(dimethylsiloxane)-b-poly(propylene oxide) Soft Segments. Ind. Eng. Chem. Res. 2016, 55, 3960–3973. DOI:10.1021/acs.iecr.5b04975 [Google Scholar]
- Xiao Y, Huang H, Peng X. Synthesis of self-healing waterborne polyurethanes containing sulphonate groups. RSC Adv. 2017, 7, 20093–20100. DOI:10.1039/C6RA28416G [Google Scholar]
- Bauri S, Tripathi S, Garg KA, Maiti P. Modulation of Drug Release: Exploring the Influence of Diisocyanate Variants on Polyurethane Matrix. ACS Appl. Polym. Mater. 2024, 6, 9499–9511. DOI:10.1021/acsapm.4c01231 [Google Scholar]
- Prakash R, Maurya IC, Srivastava P, Mondal S, Ray B, Maiti P. Functionalized polyurethane composite gel electrolyte with cosensitized photoanode for higher solar cell efficiency using a passivation layer. Nanoscale Adv. 2022, 4, 1199–1212. DOI:10.1039/D1NA00801C [Google Scholar]
- Zhang M, Song X, Zhou C, Liu L, Wu G. Sulphonated hyperbranched wholly bio-based waterborne polyurethane sizing agents for strengthening the wettability and mechanical properties of carbon fibres. Polymer 2025, 330, 128510. DOI:10.1016/j.polymer.2025.128510 [Google Scholar]
- Prakash R, Das S, Maiti P. Non-toxic CuInS2 quantum dot sensitized solar cell with functionalized thermoplast polyurethane gel electrolytes. Polymer 2023, 269, 125708. DOI:10.1016/j.polymer.2023.125708 [Google Scholar]
- Erekath S, Kalpathy SK. Red-shifted optical absorption in films of azo-polyurea-polystyrene blends: Structural correlations and implications. Opt. Mater. 2022, 126, 112155. DOI:10.1016/j.optmat.2022.112155 [Google Scholar]
- Liu G, Zhang S, Xu L, Hu Y, Li X, Zhang S, et al. Recent advances of eco-friendly quantum dots light-emitting diodes for display. Prog. Quantum Electron. 2022, 86, 100415. DOI:10.1016/j.pquantelec.2022.100415 [Google Scholar]
- Ismoilov K, Akram W, Chauhan S, Ergasheva K, Artikboeva R, Islomova Z, et al. Synthesis and Evaluation of Properties of a Novel Cationic Waterborne Polyurethane Finishing Agent. J. Chem. Eng. Process Technol. 2019, 10, 398. DOI:10.35248/2157-7048.19.10.398 [Google Scholar]
- Luo YL, Gao WT, Luo ZY, Li CH. Toward mechanically robust self-healing polyurethanes using dynamics chemistry. Mater. Chem. Front. 2024, 8, 1767–1791. DOI:10.1039/D3QM01251D [Google Scholar]
- Wu HC, Shao SR, Dong SH, Wang A, Li Z, Han XL, et al. Influence of Hydrogen Bonding on the Temperature-Accelerated Hydrolysis of Silicone Based Polyetherurethane. Chin. J. Polym. Sci. 2023, 41, 1230–1237. DOI:10.1007/s10118-023-2957-8 [Google Scholar]
- Mandal SS, Choudhury AM, Gupta A, Maiti P. An injectable cyclodextrin extended polyurethane/carboxymethyl cellulose hydrogel for controlled release of insulin: In-vitro and in-vivo diabetic animal model study. Carbohydr. Polym. 2025, 356, 123396. DOI:10.1016/j.carbpol.2025.123396 [Google Scholar]
- Puskás I, Szemjonov A, Fenyvesi É, Malanga M, Szente L. Aspects of determining the molecular weight of cyclodextrin polymers and oligomers by static light scattering. Carbohydr. Polym. 2013, 94, 124–128. DOI:10.1016/j.carbpol.2013.01.025 [Google Scholar]
- Zhang J, Lv S, Zhao X, Ma S, Zhou F. Functional Zwitterionic Polyurethanes: State‐of‐the‐Art Review. Macromol. Rapid Commun. 2024, 45, 2300606. DOI:10.1002/marc.202300606 [Google Scholar]
- Zhang J, Lv S, Zhao X, Ma S, Zhou F. Surface functionalization of polyurethanes: A critical review. Adv. Colloid Interface Sci. 2024, 325, 103100. DOI:10.1016/j.cis.2024.103100 [Google Scholar]
- Lu SH, Chen TF, Wang AJ, Zheng D, Li YL, Wang YS. Modulation of structures of CuInS2 nanoparticles grown with ethylxanthate salts. Mater. Sci. Eng. B 2016, 203, 19–26. DOI:10.1016/j.mseb.2015.09.001 [Google Scholar]
- Dong X, Ren J, Li T, Wang Y. Synthesis, characterization and application of red-emitting CuInS2/ZnS quantum dots for warm white light-emitting diodes. Dye. Pigment. 2019, 165, 273–278. DOI:10.1016/j.dyepig.2019.02.035 [Google Scholar]
- Nam DE, Song WS, Yang H. Noninjection, one-pot synthesis of Cu-deficient CuInS2/ZnS core/shell quantum dots and their fluorescent properties. J. Colloid Interface Sci. 2011, 361, 491–496. DOI:10.1016/j.jcis.2011.05.058 [Google Scholar]
- Richardson A, Alster J, Khoroshyy P, Psencik J, Valenta J, Tuma R, et al. Direct Synthesis and Characterization of Hydrophilic Cu-Deficient Copper Indium Sulfide Quantum Dots. ACS Omega 2024, 9, 17114–17124. DOI:10.1021/acsomega.3c09531 [Google Scholar]
- Wu Q, Cai C, Zhai L, Wang J, Kong F, Yang Y, et al. Zinc dopant inspired enhancement of electron injection for CuInS2 quantum dot-sensitized solar cells. RSC Adv. 2017, 7, 39443–39451. DOI:10.1039/C7RA06659G [Google Scholar]
- Alayeto I, Gutierrez-Gonzalez P, Dongmei Q, Pallarés Vilar A, Hamraoui K, Civera C, et al. Ion-Mediated Photoluminescence Enhancement in CuInS2 Quantum Dots and Its Use as Heavy Metal Ion Sensor. ACS Appl. Nano Mater. 2025, 8, 14461–14469. DOI:10.1021/acsanm.5c02927 [Google Scholar]
- Yan R, Zhang W, Wu W, Dong X, Wang Q, Fan J. Optical spectroscopy reveals transition of CuInS2/ZnS to CuxZn1−xInS2/ZnS:Cu alloyed quantum dots with resultant double-defect luminescence. APL Mater. 2016, 4, 126101. DOI:10.1063/1.4971353 [Google Scholar]
- Yu Y, Zeng Z, Gao X, Xiong C, Zhu H, Cen H, et al. A Maximization of the Proton Conductivity of Sulfonated Poly(Ether Ether Ketone) with Grafted Segments Containing Multiple, Flexible Propanesulfonic Acid Groups. Macromol. Rapid Commun. 2023, 44 ,2200926. DOI:10.1002/marc.202200926 [Google Scholar]
- Li X, He B, Li P, Tang S. In Situ-Doped Sulfonated Schiff-Base Networks in SPEEK Composite Membranes with Enhanced Proton Conductivity. ACS Appl. Mater. Interfaces 2023, 15, 25584–25593. DOI:10.1021/acsami.3c03885 [Google Scholar]
- Tithito T, Kondee S, Seekaew Y, Traiwatcharanon P, Chaloeipote G, Seesaard T, et al. CuInS2 quantum dots-based electrochemical sensor for indole detection. J. Alloys Compd. 2026, 1062, 187552. DOI:10.1016/j.jallcom.2026.187552 [Google Scholar]
- Milinković E, Cvetanović K, Bošković MV, Conić N, Jovanov V, Stanisavljev D, et al. The Comprehensive Study of TiO2 Blocking Layer with Complementary Electrochemical and SPM Methods for the Application in Photovoltaics. Inorganics 2025, 13, 270. DOI:10.3390/inorganics13080270 [Google Scholar]
- Raj DV, Ponpandian N, Viswanathan C. Electrodeposition of SnO2 nanostructures onto copper substrates and their electrochemical properties. Mater. Sci. Technol. 2023, 39, 1414–1424. DOI:10.1080/02670836.2023.2171766 [Google Scholar]
- Bertens K, Fan JZ, Biondi M, Rasouli AS, Lee S, Li P, et al. Colloidal Quantum Dot Solar Cell Band Alignment using Two-Step Ionic Doping. ACS Mater. Lett. 2020, 2, 1583–1589. DOI:10.1021/acsmaterialslett.0c00379 [Google Scholar]
- Deo M, Möllmann A, Haddad J, Ünlü F, Kulkarni A, Liu M, et al. Tantalum Oxide as an Efficient Alternative Electron Transporting Layer for Perovskite Solar Cells. Nanomaterials 2022, 12, 780. DOI:10.3390/nano12050780 [Google Scholar]
- Krishna BG, Ghosh DS, Tiwari S. Hole and electron transport materials: A review on recent progress in organic charge transport materials for efficient, stable, and scalable perovskite solar cells. Chem. Inorg. Mater. 2023, 1, 100026. DOI:10.1016/j.cinorg.2023.100026 [Google Scholar]
- Patel U, Kumar A, Pramanik S, Devi A, Pal BN, Maiti P. SnO2 as Electron Transport Layer in CsPbBr3 Perovskite Solar Cells: Experimental and Simulation Approaches. ACS Appl. Energy Mater. 2026, 9, 593–605. DOI:10.1021/acsaem.5c03357 [Google Scholar]
- Liu M, Yan N, Zhang C, Li L. Integrated solar cells with non‐toxic inorganic nanocrystals and polymer bulk heterojunction. Appl. Surf. Sci. Adv. 2021, 3, 100052. DOI:10.1016/j.apsadv.2020.100052 [Google Scholar]
- Yue W, Han S, Peng R, Shen W, Geng H, Wu F, et al. CuInS2 quantum dots synthesized by a solvothermal route and their application as effective electron acceptors for hybrid solar cells. J. Mater. Chem. 2010, 20, 7570. DOI:10.1039/c0jm00611d [Google Scholar]
- Karkhaneh A, Marandi M. Modified synthesis of CuInS2 nanoparticles for enhancement of the efficiency of corresponding quantum dot-sensitized solar cells: A simplified aqueous approach. Emergent Mater. 2025, 8, 3529–3543. DOI:10.1007/s42247-024-00987-5 [Google Scholar]
- Du Z, Ma D. Recent progress in I-III-VI colloidal quantum dots-integrated solar cells. Curr. Opin. Colloid Interface Sci. 2025, 75, 101890. DOI:10.1016/j.cocis.2024.101890 [Google Scholar]
- Du B, He K, Tian G, Che X, Song L. Robust electron transport layers of SnO2 for efficient perovskite solar cells: Recent advances and perspectives. J. Mater. Chem. C 2023, 11, 13625–13646. DOI:10.1039/D3TC02445H [Google Scholar]
- Cai X, Hu T, Hou H, Zhu P, Liu R, Peng J, et al. A review for nickel oxide hole transport layer and its application in halide perovskite solar cells. Mater. Today Sustain. 2023, 23, 100438. DOI:10.1016/j.mtsust.2023.100438 [Google Scholar]