
Research on the Mooring System of Fishery-Photovoltaic Complementary Integrated Structure Under Wave Action

Research on the Mooring System of Fishery-Photovoltaic Complementary Integrated Structure Under Wave Action
Yun Pan 1,* Jiaqi Zhang 2 Shiyu Zhao 3 Lei Li 3 Dawen Xue 3 Can Liu 1 Shiang Mei 1
Received: 30 June 2026 Revised: 22 July 2026 Accepted: 13 August 2026 Published: 26 August 2026

© 2026 The authors. This is an open access article under the Creative Commons Attribution 4.0 International License (https://creativecommons.org/licenses/by/4.0/).
1. Introduction
Driven by the intensive utilization of marine spatial resources, the development of offshore photovoltaics (PV) is accelerating its expansion into deep-sea areas. Constrained by marine management policies and spatial limitations, integrating floating offshore photovoltaics (FPVs) with marine ranching, forming a “power generation above, aquaculture below” three-dimensional complementary model, has become an inevitable trend to enhance the comprehensive economic and ecological benefits of marine spaces [1,2,3]. Concurrently, the international concept of Multi-Use Platforms (MUPs) is driving the deep integration of offshore renewable energy and aquaculture [4,5]. However, the harsh and complex deep-sea environment poses severe challenges to the structural safety and mooring stability of these novel multi-industry integrated platforms, urgently requiring in-depth research on fundamental mechanics and engineering technologies.
To date, extensive research has been conducted on the hydrodynamic evolution laws and mooring characteristics of standalone FPV platforms and marine aquaculture cages. In the field of FPV platforms, the research focus has gradually shifted from still-water conceptual designs to nonlinear hydrodynamic analyses under complex sea states [6,7]. Researchers generally employ three-dimensional potential flow theory, combined with the Morison equation or Computational Fluid Dynamics (CFD) methods, to analyze in depth the shielding effects of multi-body floater arrays, second-order wave drift forces, and wave run-up phenomena under extreme conditions [8,9,10]. Some studies have also investigated the constraint mechanisms of different mooring configurations on the six-degree-of-freedom (6-DoF) motions of truss and semi-submersible platforms [11,12]. Regarding deep-sea aquaculture cages, as cage dimensions scale up, the fluid-structure interaction (FSI) mechanisms of flexible nets have become a focal point of research [13,14]. Numerous studies have utilized the lumped mass method and porous media models to quantify the nonlinear amplification effects of net solidity and biofouling on drag coefficients [15,16,17]. Furthermore, the wake hysteresis effect induced by wave-current fields penetrating the cages, velocity attenuation distribution laws, and their dynamic excitation effects on mooring systems have been systematically validated through numerical simulations and physical model tests [18,19,20]. These studies indicate that highly porous cage systems not only generate massive fluid viscous damping but also significantly alter the boundary conditions of the surrounding hydrodynamic flow field, triggering a redistribution of local wave loads on the structure [21,22].
Despite the comprehensive studies on standalone structures, integrated hydrodynamic research on multi-scale rigid-flexible coupled structures, such as the “FPV-aquaculture cage” system, remains in the exploratory stage. In recent years, studies on integrated structures like “offshore wind turbine-cages” have revealed that the addition of lower flexible nets significantly increases the added mass and low-frequency damping of the system, thereby altering the natural frequencies and resonant response characteristics of the upper floating platform [23,24,25]. Under severe wave conditions, the strong nonlinear coupled interference between the net deformation and the rigid body motion of the upper floater leads to a substantial increase in the extreme tension of mooring lines over the full time domain, potentially inducing tension abruptions and fatigue failures [26,27,28]. However, compared with offshore wind platforms, semi-submersible truss-type FPV platforms have distinct characteristics, such as shallow drafts and large wave-facing areas. Existing independent mooring design theories struggle to directly evaluate the drag amplification phenomenon under multi-body rigid-flexible coupling in such integrated structures [29]. Directly transplanting traditional FPV mooring design schemes to complementary fishery-PV platforms not only fails to achieve optimal multi-objective structural configurations but also runs a high risk of underestimating extreme tensions [30].
Huaneng “Huanghai No. 1”, the first independently developed wave-resistant FPV platform in China, adopts a hexagonal truss structure combined with a “truss + buoyancy block” floater design, serving as a benchmark for the engineering application of deep-sea FPV technology. To achieve the complementary fishery-PV function, technical space was reserved for installing aquaculture cages at the lower part of the platform. However, its existing catenary mooring system was designed solely for standalone PV operational conditions, neglecting the hydrodynamic effects post-cage coupling. This has become a critical technical bottleneck restricting the platform’s safe upgrade to the integrated model.
Building on this context, the study takes the semi-submersible truss-type complementary fishery-PV integrated platform, formed by adding aquaculture cages to Huaneng “Huanghai No. 1”, as the research object to systematically investigate the mechanisms by which the mooring system influences the hydrodynamic characteristics of the integrated platform under wave action. By establishing a multi-body rigid-flexible, fully coupled numerical analysis model of the integrated platform-mooring system and precisely tracking the maximum mooring tensions over the full time domain, this study rigorously compares and analyzes the regulatory effects of different mooring layouts and key parameters on the platform’s motion responses and structural wave loads. This study aims to reveal the coupled interaction mechanisms between the mooring system and the “PV-cage” integrated structure, propose optimal mooring schemes adapted to complementary fishery-PV scenarios, and provide solid theoretical support for the engineering application and safe operation of deep-sea multi-use integrated platforms.
2. Modelling Method
OrcaFlex frequency domain analysis is based on linear time invariant (LTI) system theory and the stationary Gaussian random process hypothesis. The core is to solve the frequency domain response of the structure under wave action by transfer function (RAO), which is suitable for small-amplitude wave weak nonlinear scenes. It is the core tool for preliminary design and parameter sensitivity analysis of marine engineering. The core assumptions mainly include: (1) Linear system assumption: the structural response is linearly related to the wave input, and all nonlinear terms need to be equivalently linearized. (2) Fluid hypothesis: the potential flow theory is used for the floating body, and the linearized Morrison equation is used for the slender pipeline/riser. (3) Random process hypothesis: The wave is a stationary, ergodic Gaussian random process, which is completely described by the wave energy spectrum. OrcaFlex supports second-order frequency domain analysis, which is used to solve the slow drift motion of mooring system. The core is the quadratic transfer function (QTF), which supports the full QTF matrix and Newman approximation simplification algorithm.
2.1. Frequency Domain Governing Equations and Fourier Transform
The time-domain motion control equation of the floating body-mooring-pipeline coupling system is:
|
```latexM\ddot{x}\left(t\right)+C\dot{x}\left(t\right)+K\dot{x}\left(t\right)={F}_{wave}\left(t\right)``` |
(1) |
Among them, M = Ms + Ma(ω) is called the total mass moment, including the structural dry mass including the structural dry mass Ms and the frequency-dependent added mass Ma(ω) (which can be calculated by the built-in Morrison formula or imported into the potential flow solution results, such as WAMIT/AQWA). C = Cr(ω) + Cυ is called the total damping matrix, including frequency-dependent radiation damping Cr(ω) and linearized viscous damping Cυ (Morrison drag linearization, structural damping, mooring damping). $$K={K}_{hydrostatic}+{K}_{mooring}+{K}_{structural}\,$$is the total stiffness matrix, including hydrostatic stiffness, mooring, pipeline linearization tangent stiffness, and structural stiffness. Fwave(t) is the first-order time-series wave excitation force, and the complex amplitude Fwave(ω) in the frequency domain.
2.2. Fourier Transform and Frequency Domain Algebraic Equations
The Fourier transform of the time domain equation (using the angular frequency form) is performed, and the differential forms $$F\left[\dot{x}\left(t\right)\right]=i\omega X\left(\omega \right)$$ and $$F\left[\ddot{x}\left(t\right)\right]=-{\omega }^{2}X\left(\omega \right)$$ are used to obtain the frequency domain core algebraic equation:
|
```latex\left[-{\omega }^{2}\left({M}_{s}+{M}_{a}\left(\omega \right)\right)+i\omega \left({C}_{r}\left(\omega \right)+{C}_{\upsilon }\right)+K\right]X\left(\omega \right)=F\left(\omega \right)``` |
(2) |
The left side of Equation (2) is denoted by the frequency domain impedance matrix (dynamic stiffness matrix), then it can be simplified to$$\,Z\left(\omega \right)\cdot X\left(\omega \right)=F\left(\omega \right)$$, where Z(ω) is the complex matrix, the real part corresponds to the inertia and stiffness term, and the imaginary part corresponds to the damping term.
2.3. Response Amplitude Operator (RAO) Solution
RAO is the core output of OrcaFlex frequency domain analysis, which is defined as the frequency domain complex response of the structure under unit amplitude and is the transfer function connecting wave input and structural response. RAO is a complex value, including amplitude (unit: m/m or rad/m, corresponding to displacement/rotation response) and phase (unit: rad, phase difference of response relative to wave surface), and the corresponding RAO complex value is solved for each discrete frequency point. Combined with the impedance matrix inversion, the final RAO expression is:
|
```latexRAO(\omega) = Z(\omega)^{-1} \cdot \Lambda(\omega)``` |
(3) |
Among them $$\Lambda \left(\omega \right)$$ is the transfer function of the wave excitation force under unit wave amplitude. For the complex amplitude $$\eta \left(\omega \right)$$ of the wave surface, the wave excitation force satisfies $$F\left(\omega \right)=\Lambda \left(\omega \right)\eta \left(\omega \right)$$.
2.4. Frequency Domain Solution Process and Details
2.4.1. Frequency Domain Analysis
Frequency domain analysis only supports linear systems, and the core nonlinear terms are linearized, including Morrison drag force linearization and mooring stiffness linearization. The nonlinear drag term $${F}_{d}=0.5\rho {C}_{d}D\left|{u}_{r}\right|{u}_{r}$$ is equivalent to the linear damping term $${F}_{d,linear}={C}_{d,linear}\dot{x}$$, and the equivalent damping coefficient is based on the stochastic process mean square iterative convergence solution$$\,{C}_{d,linear}=\sqrt{8/\pi }\rho {C}_{d}D{\sigma }_{\dot{x}}$$, where $${\sigma }_{\dot{x}}$$ is the root mean square (RMS) of the relative velocity of the fluid. The static analysis of the mooring line/riser is carried out, and the tangent stiffness matrix of the equilibrium position is extracted as the equivalent linear stiffness in the frequency domain.
2.4.2. Wave Spectrum Discretization
OrcaFlex supports a full series of wave spectra, such as JONSWAP, P-M, ITTC, and ISSC, and discretizes the continuous wave spectrum into N harmonic components (the default is an integer power of 1024/2048; 2 is adapted for IFFT acceleration).
2.4.3. Solving by Frequency Point
For each discrete frequency, perform the following calculation: The wave parameters (wavelength, wavenumber, water particle velocity, and acceleration distribution along the water depth) at this frequency are calculated. The transfer functions of additional mass, radiation damping, and wave excitation force are calculated. The impedance matrix is assembled and inverted to obtain the RAO complex value at this frequency.
2.4.4. Response Spectrum and Statistics Calculation
After obtaining the RAO, the power spectral density (PSD) of the structural response is calculated. The calculation formula is:
|
```latex{S}_{x}\left(\omega \right)={\left|RAO\left(\omega \right)\right|}^{2}{S}_{\eta }\left(\omega \right)``` |
(4) |
Based on the response spectrum, key statistics are calculated, including the n-order spectral moment, response root mean square, response extreme value, etc.
2.5. Conversion of Frequency Domain to Time Domain Results
In OrcaFlex, the frequency domain to time domain is divided into two core scenarios: Wave spectrum to time domain irregular wave time history (for time domain simulation environment input). Structural response spectrum to time domain response time history (for linear response verification and fast time history generation). For large floating bodies in marine engineering, the harmonic superposition method based on RAO is often selected.
The response amplitude of each harmonic is equal to the RAO amplitude multiplied by the harmonic amplitude, and the response phase is equal to the RAO phase plus the initial phase of the wavefront, which completely restores the input and output relationship of the linear system.
|
```latexx\left(t\right)={\sum }_{k=1}^{N}\left|RAO\left({\omega }_{k}\right)\right|{A}_{k}\mathit{cos}\left({\omega }_{k}t+{\phi }_{k}+\angle RAO\left({\omega }_{k}\right)\right)``` |
(5) |
where A is the amplitude of the RAO at the k-th frequency point, and B is the phase of the RAO at the k-th frequency point (the phase difference of the response relative to the wavefront).
2.6. Hydrodynamic Calculation of Netting and Mooring Line
The optical complementary integrated structure is a typical multi-body rigid-flexible coupling system composed of the upper rigid photovoltaic platform and the lower flexible cage and mooring cable. Among them, the upper large-scale rigid platform solves its wave excitation force and other hydrodynamic parameters based on the three-dimensional potential flow theory. For the flexible net and mooring line with feature sizes much smaller than the wavelength, the lumped mass method is used to solve the structural discretization, and the corresponding hydrodynamic load is calculated by the modified Morison equation.
2.6.1. Concentrated Mass Method
Flexible components such as mooring lines and netting lines are discretized. The model uses massless springs with particles at both ends to simulate these lines, and the physical properties, such as mass, gravity, and buoyancy, are concentrated at these nodes [9]. In order to obtain the overall dynamic response of the system, it is necessary to establish and solve the motion equations of each discrete element in the local coordinate system (Equation (6)). The solution uses a fixed time step, updates the node acceleration at the beginning of each time step, and updates the spatial position of the element over time. At the same time, the transient load is applied to the deformed structural element.
|
```latexM\left(p, a\right) + C\left(p, v\right) + K\left(p\right) = F\left(p, v, t\right)``` |
(6) |
In the formula, M(p, a), C(p, v), and K(p) represent the inertial term, damping term, and stiffness term, respectively. F(p, v, t) denotes the external environmental load. t is the simulation time. p, v, and a correspond to position, velocity, and acceleration vectors, respectively.
In order to obtain the overall dynamic response of the system, it is necessary to establish and solve the motion equations of each discrete element in the local coordinate system (Equation (6)). The solution uses a fixed time step, updates the node acceleration at the beginning of each time step, and updates the spatial position of the element over time. At the same time, the transient load is applied to the deformed structural element.
2.6.2. Morison Equation
Because the mooring line and the net line are far less than the wavelength, based on the assumption of small-scale structure, the wave force is mainly manifested as viscous resistance and additional mass force. The modified Morrison equation is used to calculate the load acting on the structure:
|
```latexF=\frac{1}{2}{C}_{d}\rho A\left(v-u\right)\left|v-u\right|+\rho V\dot{v}+{C}_{m}\rho V\left(\dot{v}-\dot{u}\right)``` |
(7) |
In the equation, Cd and Cm represent the resistance coefficient and the added mass coefficient, respectively. ρ is seawater density. A is the projected area of a structural unit perpendicular to the flow direction. ν and $$\dot{v}$$ denote the velocity and acceleration of fluid particles. u and $$\dot{u}$$ represent the velocity and acceleration of the structural unit. V is the immersed volume of the structure.
The Reynolds number Re directly affects the drag coefficient in the Morison equation. The drag coefficient is decomposed into two components: the axial Ct and the normal Cn [8]. The calculation method of the normal component is as follows (Equation (8)):
|
```latexC_n= \begin{cases} \displaystyle \frac{8\pi}{s\,\mathrm{Re}}\big(1-0.87s^{-2}\big), & 0<\mathrm{Re}<1 \\[1em] \displaystyle 1.45 + 8.55\times \frac{1}{\mathrm{Re}^{0.9}}, & 1<\mathrm{Re}<30 \\[1em] \displaystyle 1.1 + 4\times \frac{1}{\mathrm{Re}^{0.5}}, & 30<\mathrm{Re}<2.3\times 10^{5} \\[1em] \displaystyle -3.41\times\Big(\frac{\mathrm{Re}}{10^{6}} - 0.578\Big), & 2.3\times 10^{5}<\mathrm{Re}<4.9\times 10^{5} \\[1em] \displaystyle 0.599 + e^{-\frac{\mathrm{Re}}{5.99\times 10^{5}}}, & 4.9\times 10^{5}<\mathrm{Re}<10^{7} \end{cases}``` |
(8) |
where, s = −0.077215665 + ln(8/Re), fluid viscosity μ is 1.01 × 10³ Pa·s.
2.7. Detailing the Time-Domain Solution Process
In summary, the computational framework adopted in this study employs a hybrid approach to evaluate the integrated fishery-PV platform. The frequency-domain analysis and the subsequent reconstruction of linear time histories based on RAOs are primarily applied to calculate the hydrodynamic responses of the upper floating body (the PV platform). Conversely, the modeling of the aquaculture cage and the mooring system is executed using fully coupled nonlinear time-domain simulations in OrcaFlex. Within this fully coupled nonlinear time-domain framework, the fifth-order Stokes wave theory is implemented to capture the nonlinear wave kinematics accurately; the nonlinear mooring stiffness is inherently resolved through the dynamic finite-element formulation of the multi-component lines; and the Morison-type hydrodynamic resistance is explicitly applied to calculate the viscous drag loads on the flexible cage net and the slender structural elements.
To ensure the fidelity and reproducibility of the coupled hydrodynamic analysis, the detailed numerical discretization and solver settings are explicitly defined. For the rigid upper platform, the wet surface is discretized into 15,936 hydrodynamic panels to accurately resolve the wave radiation and diffraction potentials in the frequency domain.
The frequency-domain hydrodynamic calculations for the floating platform were performed over a pre-computed period range from 0.1 s to 30 s with a constant interval of 0.1 s, ensuring that all wave-component frequencies used for time-history reconstruction lay within this pre-evaluated range, and only internal interpolation was adopted. During the spectral analysis, the continuous wave spectrum is discretized into N = 200 harmonic components, spanning a frequency range from 0.0482 Hz to 0.9632 Hz. The upper bound covers up to 10 times the peak frequency, although the wave energy is negligible for frequencies higher than 0.4 Hz.
In the fully coupled time-domain simulation utilizing the lumped mass method, a fixed time step of ∆t = 0.1 s is adopted, which is sufficiently small to capture the high-frequency dynamic responses of the system. The total physical simulation duration is set to 300 s. To eliminate numerical start-up oscillations, the initial 200 s is treated as the ramp-up transient period and is therefore discarded prior to any statistical analysis. Detailed numerical values and specific settings are listed in Table 1.
Table 1. Summary of key numerical and discretization parameters for the fully coupled time-domain simulation.
|
Numerical Parameter |
Value/Setting |
|---|---|
|
Hydrodynamic panels for a rigid platform |
15,936 |
|
Equivalent mesh nodes/line elements for cage net |
2741/5340 |
|
Frequency discretization range |
0.0482–0.9632 Hz |
|
Number of wave components (N) |
200 |
|
Fixed time step (Δt) |
0.1 s |
|
Total time-domain simulation duration |
300 s |
|
Initial transient period discarded |
200 s |
|
Statistical duration for data extraction |
100 s |
3. Model Verification
The Fishery-Photovoltaic complementary integrated structure is composed of a rigid floating body, flexible netting, and mooring. In order to ensure the reliability of the hydrodynamic calculation results, the hydrodynamic solution method of the floating body and the mesh group method of the flexible net are verified by the model.
3.1. Verification of the Hydrodynamic Solution Method of a Floating Body
In view of the limited flume test data of the open photovoltaic-cage integrated structure, and the potential flow solution process of the photovoltaic platform is consistent with that of the conventional offshore platform, this section selects the CFPSO with detailed physical test data as the reference object to verify the accuracy of the hydrodynamic numerical calculation method.
To validate the hydrodynamic characteristics of the CFPSO, this study references the 1:60 scaled physical model tests previously conducted in the Deepwater Wave Basin at Shanghai Jiao Tong University (measuring 50.0 m × 40.0 m, with a maximum effective depth of 10.0 m). The experimental campaign utilized a wooden CFPSO model characterized by a variable-diameter profile; specifically, the diameter of the bilge box was designed to be 1.25D, where D represents the diameter at the mean waterline. High precision was maintained during fabrication and calibration, limiting geometric deviations to within 1% and keeping errors in critical inertial parameters (including the center of gravity and the roll and pitch radii of gyration) strictly below 2% of their target values.
For the station-keeping system, the platform was constrained by a 12-line spread mooring configuration arranged in a 3 × 4 grouped layout. Within each of the three mooring bundles, the four individual lines were separated by a 2° angular spacing. Each mooring line was deployed as a composite assembly comprising an upper platform chain, a middle polyester rope segment, and a bottom anchor chain. The experiments primarily investigated the platform’s dynamic responses under two representative draft conditions across isolated and coupled wave-current environments. For comprehensive schematic diagrams and detailed parameter tables regarding the experimental setup, readers are referred to the original publication [31]. The physical model and the CFPSO hydrodynamic model developed using OrcaFlex are illustrated in Figure 1.
The main parameters of the model are as follows: the diameter of the water line surface is 1.2 m, the draft is 0.38 m, the displacement is 0.457 t, and the center of gravity is 0.285 m from the baseline. The rolling and pitching inertia radius are 0.354 m, and the yawing inertia radius is 0.450 m. The geometric and quality properties of the numerical model are strictly configured according to this parameter to ensure consistency with the system’s inherent properties.
The RAO of the three degrees of freedom of surge (a), heave (b), and pitch (c) of the numerical model is extracted and compared with the pool test results. The results are shown in Figure 2.
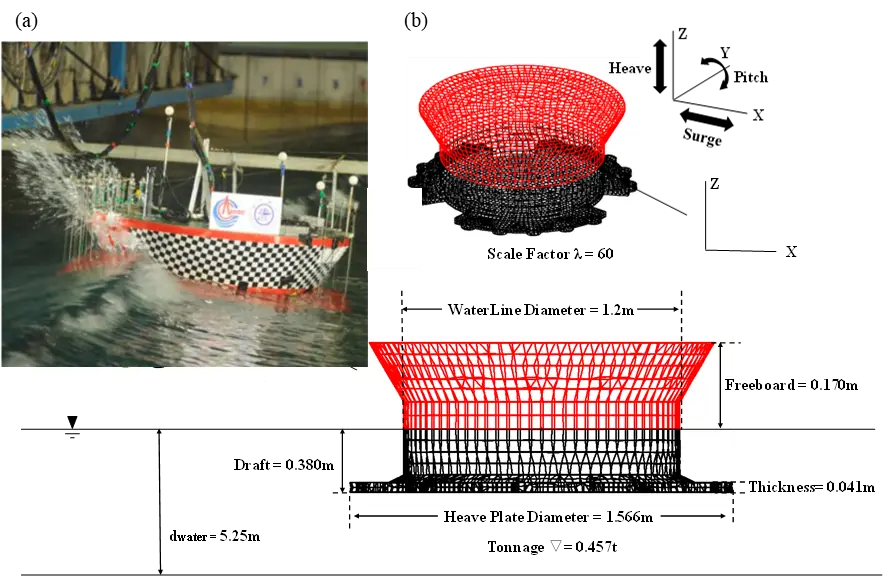
Figure 1. Illustrations of the CFPSO models: (a) scaled physical model; (b) hydrodynamic numerical model in OrcaFlex.
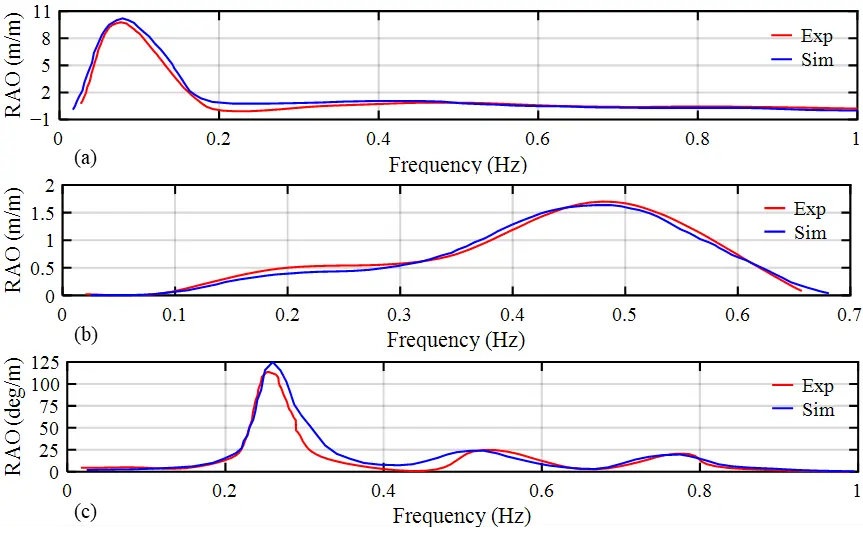
The results show that the numerical calculation and the experimental results have good consistency in the trend of RAO curve, peak frequency and amplitude level, and the overall error is within the acceptable range. This verifies the reliability of the grid division scheme and the potential flow solution method in this paper, which can be used for the hydrodynamic analysis of the subsequent photovoltaic platform.
3.2. Feasibility Verification of the Mesh Group Method for Flexible Cage
The actual cage contains a large number of flexible net lines, and modeling directly according to the real size will lead to excessive calculation. Therefore, the mesh grouping method is usually used in engineering to simplify (that is, multiple small meshes are equivalent to a large mesh). This section refers to the uniform flow flume test data published by Moe-Føre et al. to verify the accuracy of the method in simulating the force and deformation of flexible mesh lines [32].
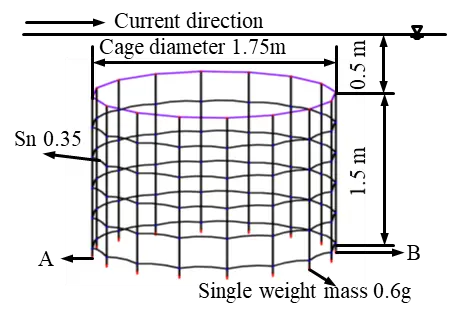
The cage condition with a density Sn of 0.35 was selected for the test. The material of the netting wire of the test cage is polyamide 6; in order to maintain the same force characteristics, the numerical model Sn is also set to 0.35. The single mesh after grouping is 0.3 m high and 0.3443 m long. After calculation, the equivalent mesh diameter is 0.055 m. The material density and Young’s modulus are consistent with the test. Because the mesh is a slender component, the bending stiffness is not considered in the calculation. The schematic diagram of the cage model after mesh grouping is shown in Figure 3a.
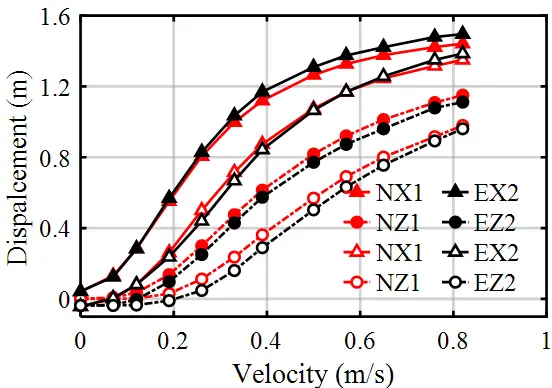
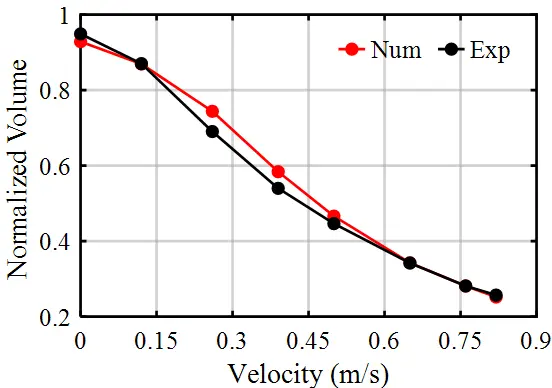
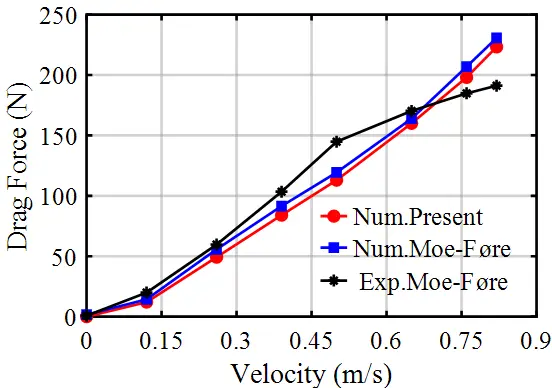
To evaluate the agreement of the nodal displacements between the numerical model and the experimental results, two characteristic observation points were selected at the bottom of the cage. As illustrated in Figure 3a, Node A and Node B correspond to the lower-left (upstream) and lower-right (downstream) corners in the front view of the cage, respectively. Figure 3b presents the displacement comparison of these two characteristic nodes in the X and Z directions between the physical and numerical models. Furthermore, the volume loss and drag force of the cage under various flow velocities were also compared and analyzed, with the results depicted in Figure 3c,d, respectively.
 |
 |
|
(a) |
(b) |
 |
 |
|
(c) |
(d) |
Figure 3. Cage model and comparison with test results. (a) Cage numerical model; (b) Characteristic node displacement; (c) Cage normalized volume; (d) Horizontal drag force of cage.
As the flow rate increases, the cage as a whole drifts backward and rises accordingly. The average error in the displacement of the two observation points between the numerical calculation and the test is 6.67%. According to Equation (7), the resistance of the net line should be proportional to the square of the flow velocity. However, under the action of water flow, the continuous lifting of the bottom of the cage leads to a decrease in the actual inflow area, so that the horizontal drag force increases approximately linearly with the flow velocity. The numerical simulation successfully reproduced the force change caused by this deformation, and the average error between the calculated drag force and the experimental data was 5.82%. Finally, the internal volume of the cage decreases due to deformation, and the average error between the volume retention rate calculated by the numerical model and the test results is 3.09%.
In summary, under the premise of maintaining the consistency of the mesh density, the mesh group method can accurately simulate the deformation law and stress characteristics of the flexible cage in water, which is suitable for the establishment and analysis of the cage model in the subsequent integrated structure.
3.3. Mesh-Size Sensitivity and Convergence Analysis
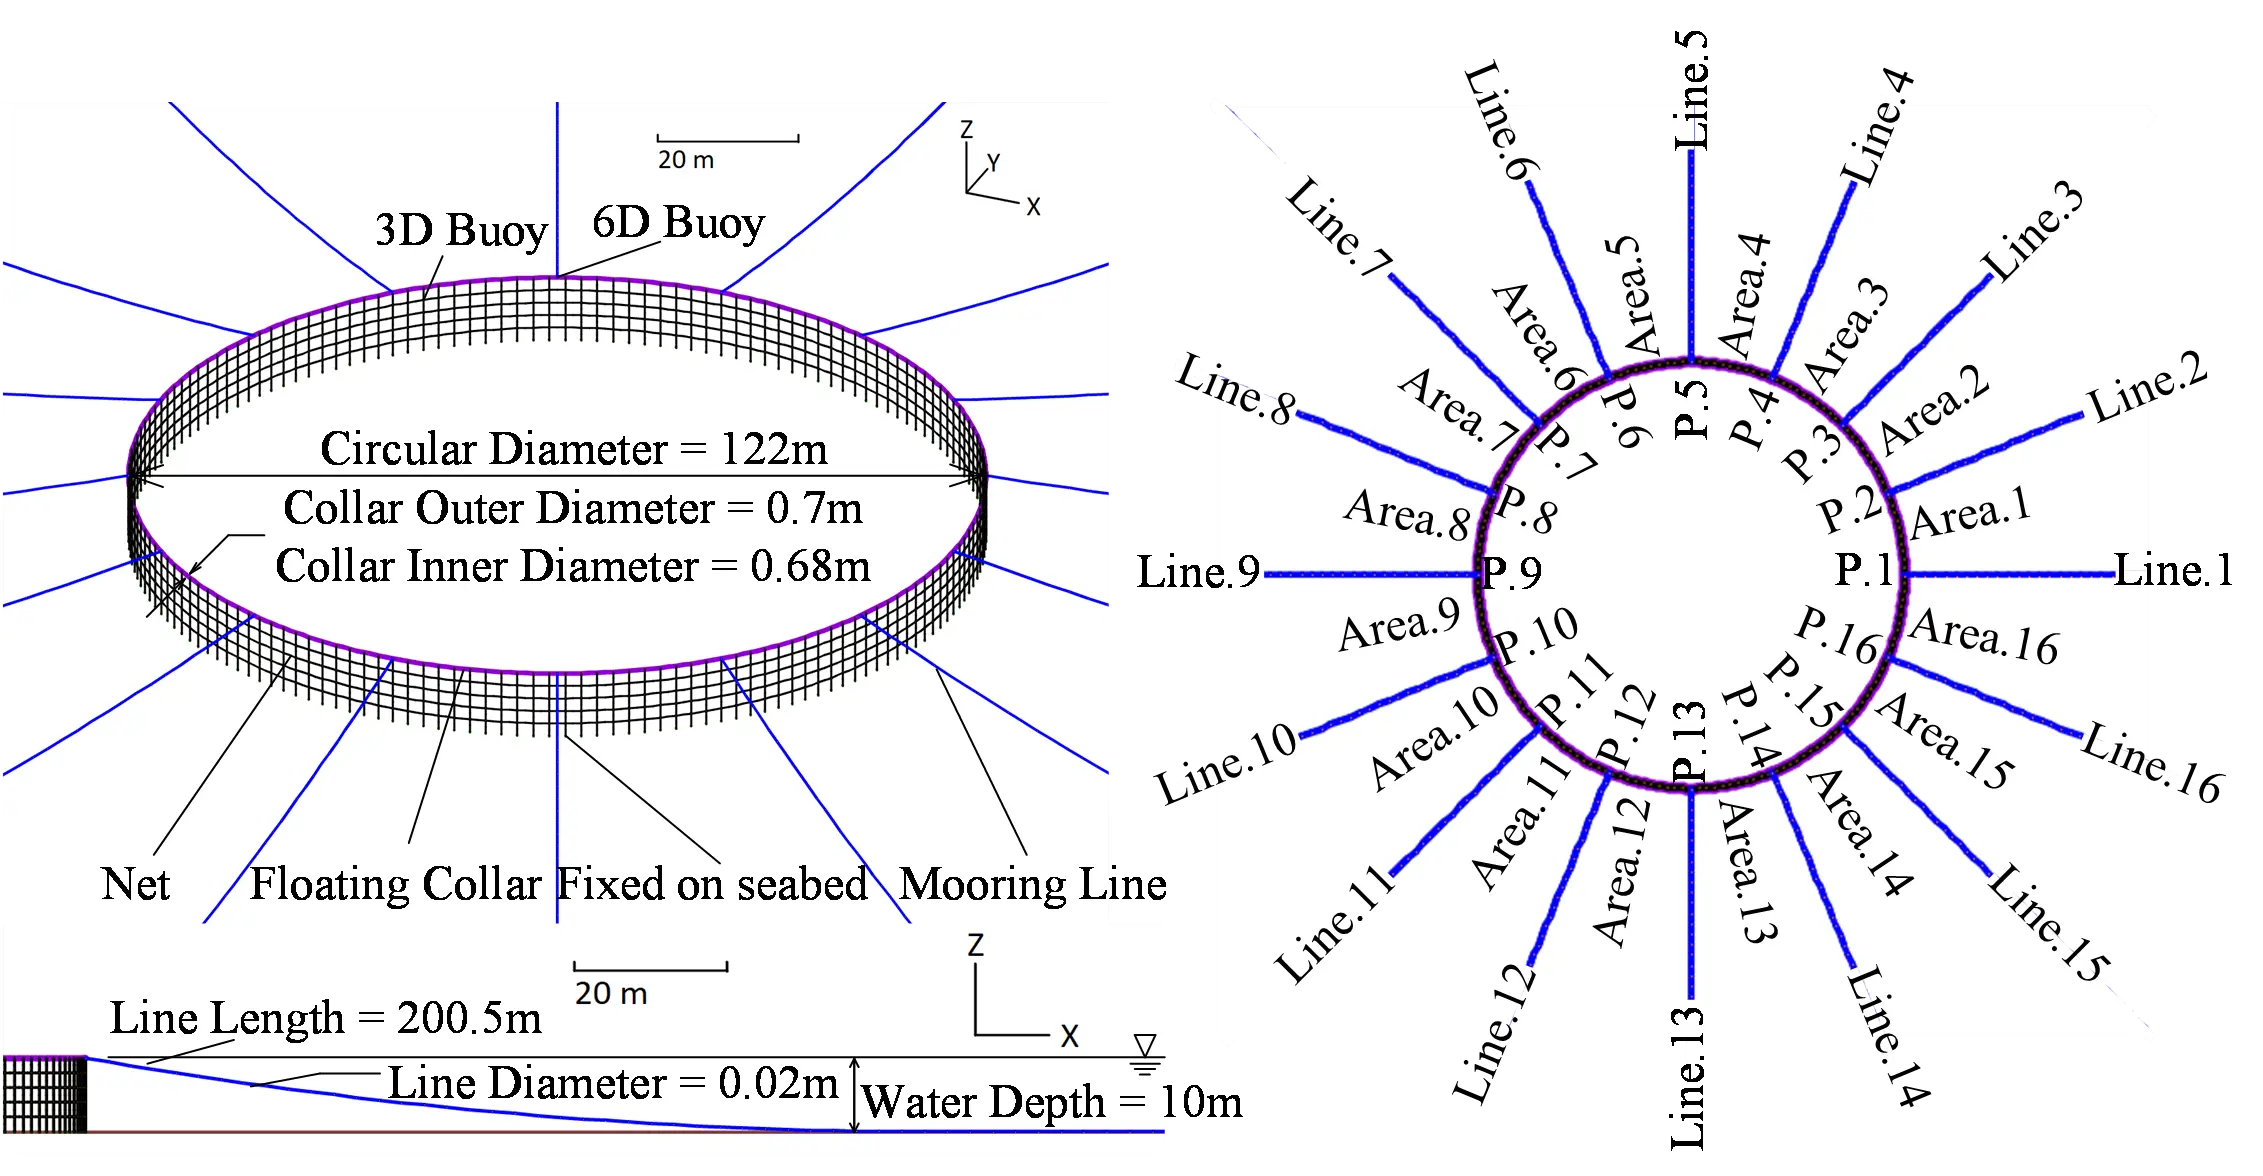
To balance computational efficiency and precision for the ultra-large diameter aquaculture cage (ULDAC), a mesh-size sensitivity and convergence analysis was performed following the methodology outlined in Pan et al. (2025) [33]. Maintaining a constant net solidity (Sn = 0.35), six mesh discretization schemes (NetCase.1 to NetCase.6) were evaluated, with horizontal-to-vertical mesh ratios ranging from 168:5 (coarsest) to 336:10 (finest). Three key performance indicators, namely nodal displacement, normalized cage volume, and horizontal drag, were analyzed under uniform currents (0–0.82 m/s) and fifth-order Stokes waves (T = 6–12 s, H = 2–4 m). The model configuration and mooring scheme of the ULDAC are illustrated in Figure 4.
The results indicated that coarse meshes (NetCase.1 to NetCase.3) produced notable errors and unstable force fluctuations. In contrast, clear convergence was observed across NetCase.4, NetCase.5, and NetCase.6, demonstrating that further mesh refinement beyond a certain density does not significantly alter the predicted net-cage deformation, hydrodynamic loads, or dynamic responses. Considering both accuracy and computational efficiency, NetCase.5 (mesh ratio 302:9) was chosen as the recommended baseline configuration for subsequent numerical modeling of the integrated structure.
4. Results and Analysis
In the verification work, it has been confirmed that the mesh group method accurately simulates the hydrodynamic force and deformation characteristics of the flexible net while maintaining compactness (Sn = 0.35). However, the research object of this study is the complementary integrated structure of fishing and photovoltaic, and the scale of the aquaculture cage (circumference of more than 100 m, depth of nearly 10 m) is far larger than that of the flume test model. If the mesh density of the previous small-scale model is directly applied to full-scale three-dimensional modeling, a large number of mesh nodes will be generated, resulting in a high time-domain coupling calculation cost, which is difficult to meet the calculation requirements of subsequent working conditions.
In order to control the calculation amount of the full-scale coupling model, based on the verification of the previous method, this paper carries out a large-scale group processing of the lower hanging cage according to the criterion of constant equivalent projection area and compactness (Sn = 0.35). Considering the calculation efficiency and the accuracy of the deformation simulation of the cage, the equivalent mesh size of the full-size cage is finally set to 1.25 m × 1.0923 m, and the equivalent net diameter is calculated to be 0.2131 m (the material is still polyamide). The subsequent rigid-flexible coupling dynamic analysis is based on this netting parameter configuration. The integrated structure model after mesh clustering is shown in Figure 5; The specific mooring conditions are shown in Figure 6. The Stokes 5th nonlinear wave is simulated. The wave height H is set to 5 m and the wave period T is set to 6~12 s.
For the evaluation of the mooring system’s structural responses, the maximum mooring tension values are extracted through a comprehensive, full-range search over the entire valid statistical duration. It should be noted that the extreme tension values are determined by evaluating the complete simulated time history (with appropriate filtering applied to eliminate high-frequency noise), rather than restricting the maximum value tracking to specifically isolated time windows. Furthermore, to provide a consistent and rigorous reference standard for the parametric analysis, the baseline configuration parameters for the mooring anchor distances are established using the difference value relative to the unstretched mooring line length, rather than absolute coordinate numbers. This approach ensures a more accurate representation of the mooring system’s geometric configurations and tension variations under complex wave conditions.
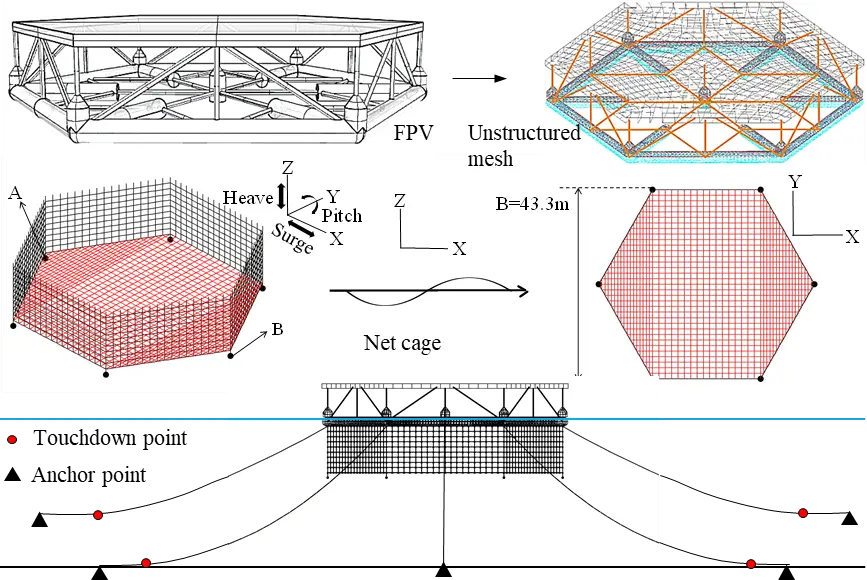
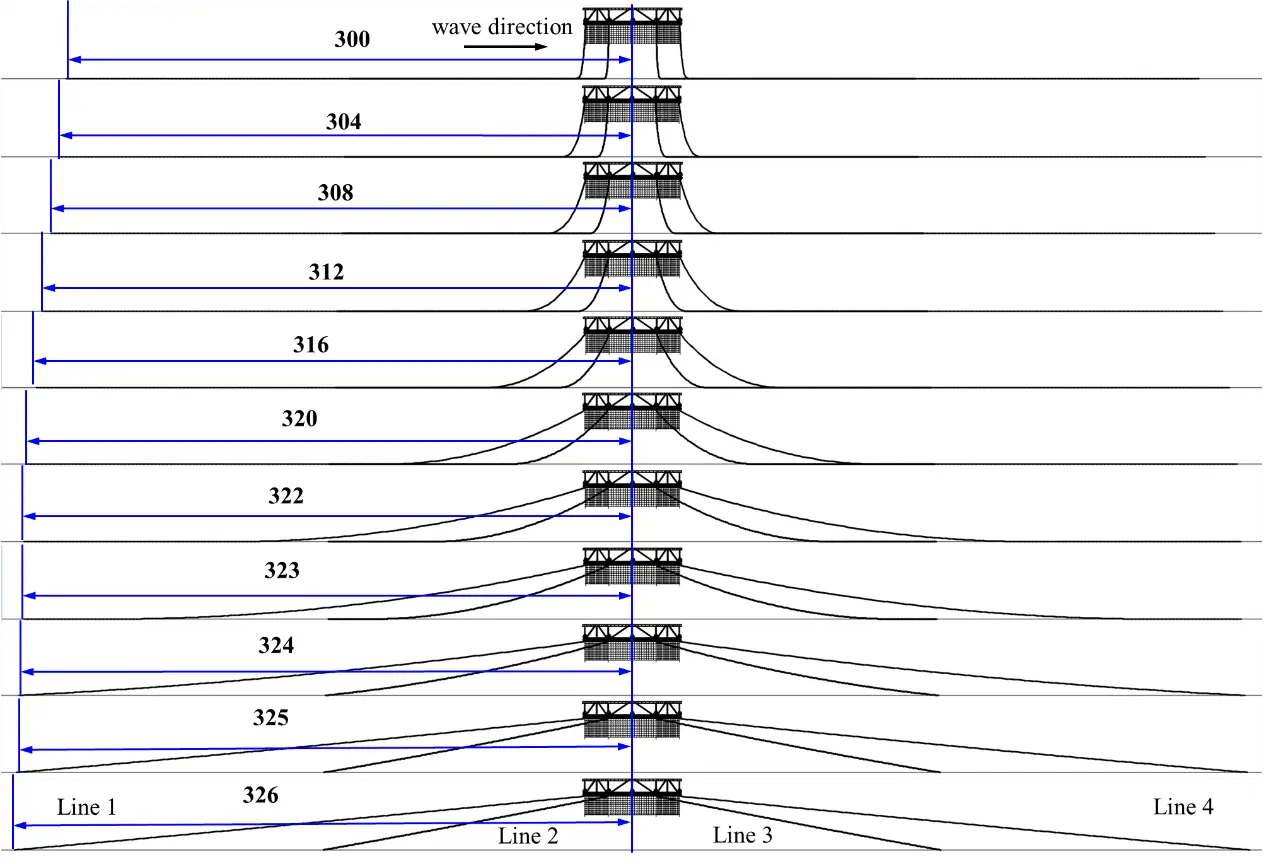
In this study, a series of gradient mooring radius conditions is set up: Taking the center of the hexagonal platform as the origin, the length of a single mooring line is fixed at 300 m, and the initial mooring radius is 300 m. Then, the anchoring point is gradually moved outward along the radiation direction. Firstly, the step length is increased from 300 m to 320 m with 4 m as the step length, and then the step length is 4 m in the 320~324 m interval, and then the step length is densely encrypted with 0.2 m in the 324~326 m interval, a total of 17 working conditions. The parameters of the counterweight and mooring group are shown in Table 2.
Table 2. Ballast and mooring configuration parameters.
|
Weight Configuration (t) |
Mooring Chain Length (m) |
Anchor Point (m) |
Relative Coefficient |
Anchor Point (m) |
Relative Coefficient |
|---|---|---|---|---|---|
|
18.3333 |
300 |
300 |
0 |
304 |
0.133 |
|
308 |
0.267 |
312 |
0.400 |
||
|
316 |
0.533 |
320 |
0.667 |
||
|
324 |
0.800 |
324.2 |
0.807 |
||
|
324.4 |
0.813 |
324.6 |
0.820 |
||
|
324.8 |
0.827 |
325 |
0.833 |
||
|
325.2 |
0.840 |
325.4 |
0.847 |
||
|
325.6 |
0.853 |
325.8 |
0.860 |
||
|
326 |
0.867 |
Note: The calculation method of the relative coefficient is 10 × (Anchor point − Mooring chain length)/Mooring chain length.
4.1. Motion Response Analysis of Photovoltaic Structure
In order to systematically study the influence of mooring radius change on the hydrodynamic performance of the platform, this section calculates the response amplitude operator of each degree of freedom of the platform under different relative mooring lengths based on the working condition setting scheme described in Section 3. The results are shown in Figure 7.
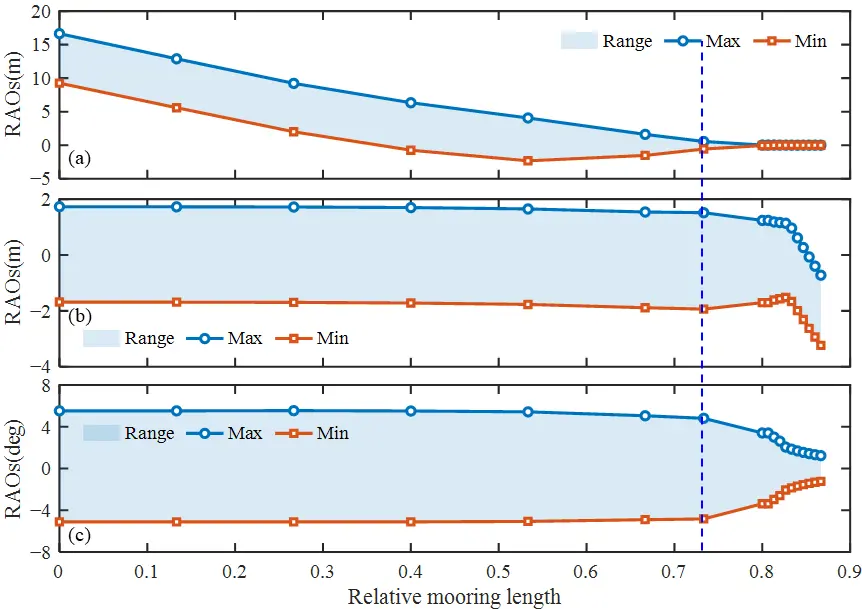
Figure 7. Response amplitude operators of each degree of freedom of the platform under different relative mooring lengths: (a) Surge; (b) Heave; (c) Pitch.
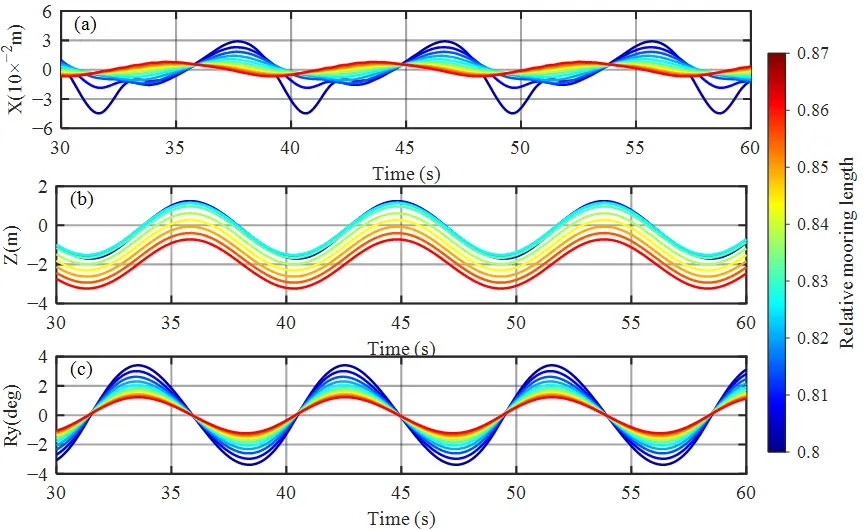
From the diagram, it can be seen that in the stage of small mooring radius (relative mooring length is about 0.73 or less), the heave, pitch and roll RAO change gently, the mooring line is in the catenary dominant state, the horizontal recovery stiffness of the system is low, and the constraint effect on the platform motion is weak; When the relative mooring length increases to about 0.73 (the critical position shown by the dashed line in the figure), the mooring line transits from the overhanging state to the tensioning state, the horizontal stiffness increases sharply, and the motion response of each degree of freedom changes significantly. Since then, as the mooring radius continues to increase, the mooring line is further tightened, the degree of freedom of platform motion is strongly constrained, and the RAO amplitude decays rapidly and tends to be stable. In order to further analyze the transient evolution characteristics of the platform motion in the over-tensioning stage, this study selects typical working conditions in the mooring radius encryption interval (324~326 m) for time history calculation. The results are shown in Figure 8.
In order to reveal the transient evolution characteristics of the motion response of the platform with the increase of the mooring radius, this study further selects the typical working conditions in the mooring radius encryption interval (324~326 m) for time history analysis. As shown in the diagram, as the anchorage point continues to move outward (the relative anchorage position increases from 0.80 to 0.87), the amplitude of the time history curves of the vertical motion (a), heave (b), and pitch (c) of the platform shows a monotonic decreasing trend, and the phase characteristics of the motion of each degree of freedom are consistent. Specifically, when the mooring line tends to be taut, the horizontal recovery stiffness of the mooring system is significantly enhanced, and the constraint on the vertical and rotational degrees of freedom of the platform is gradually strengthened, resulting in the gradual convergence of the motion amplitude. At the same time, due to the small variation of the mooring radius between the encryption conditions (0.2 m), the motion response of the adjacent working conditions is smooth, and there is no nonlinear jump phenomenon in the above critical mutation interval. It is verified that the motion response of the platform decreases steadily with the increase of the mooring radius after the mooring system enters the over-tensioning stage.
4.2. Mooring Cable Tension Response Analysis
Based on the analysis of the platform motion response, this section further calculates the effective tension response of each mooring cable under different relative mooring lengths. The results are shown in Figure 9.
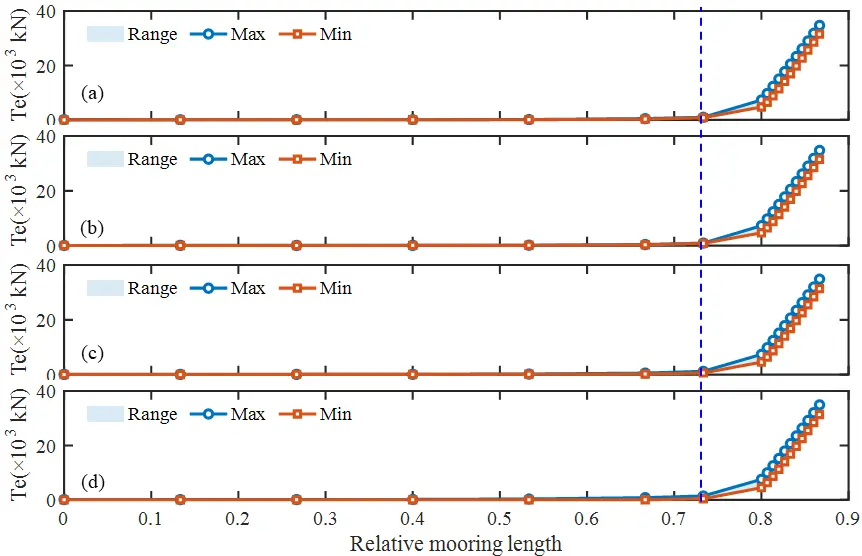
Figure 9. The effective tension of each mooring line under different relative mooring lengths: (a) Line 1; (b) Line 2; (c) Line 3; (d) Line 4.
It can be seen from the figure that the effective tension of the four mooring cables (Line 1~4) is maintained at a low level in the stage of small mooring radius (relative to the mooring length of about 0.73). The maximum and minimum values are basically coincident, and the tension fluctuation range is very small, indicating that the mooring line is in a relaxed and overhanging state at this time. The cable mainly bears the static tension from self-weight, while the dynamic tension from wave loads contributes little. When the relative mooring length exceeds about 0.73, the tension of each cable begins to increase significantly, and the difference between the maximum and minimum values gradually expands, and the tension fluctuation range increases sharply. The mooring line transits from the overhanging state to the tensioning state, and the horizontal stiffness of the system increases nonlinearly, resulting in a sharp amplification of the dynamic tension response of the cable. After entering the over-tensioning stage (the relative mooring length is greater than 0.73), the cable tension shows an approximately exponential growth trend. In addition, as the mooring radius increases, the degree of separation between the maximum and minimum cable tensions tends to remain stable, indicating that the mooring system is under strong tension. Although the absolute value of the cable tension rises sharply, the proportion of its fluctuation amplitude is relatively fixed, and the tension response enters a stable oscillation mode.
To further reveal the transient evolution characteristics of cable tension during the over-tensioning stage, this study selects typical working conditions within the mooring radius encryption interval (324–326 m) for time-history analysis. The results are shown in Figure 10.
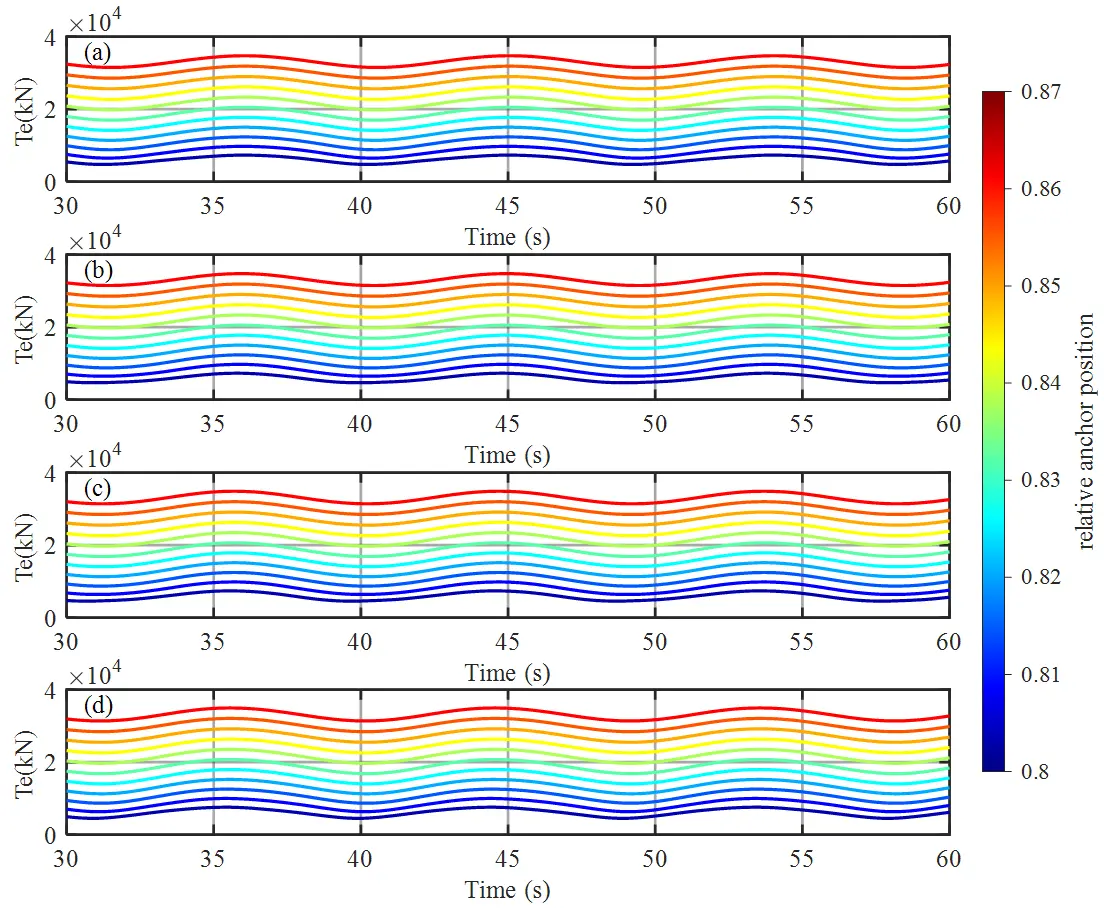
Figure 10. Mooring tension time history of tension stage: (a) Line 1; (b) Line 2; (c) Line 3; (d) Line 4.
From the comparative analysis of the motion response RAO and the cable tension response, it can be seen that the two show significant coupling mutation characteristics at the critical position (relative mooring length is about 0.73, corresponding mooring radius is about 320 m, as shown by the dotted line in the figure): Before the critical position, the mooring line is in the dominant state of the catenary, the horizontal recovery stiffness of the system is low, and the RAO of each degree of freedom of the platform changes gently. However, the absolute value of the mooring cable tension is small, the mooring system has insufficient constraint ability on the platform, and the platform motion amplitude is large. At the critical position, the mooring line transits from the overhanging state to the tensioning state, the horizontal stiffness of the system increases sharply, the motion response of each degree of freedom of the platform changes significantly, and the amplitude of RAO decreases rapidly. At the same time, although the mooring cable tension begins to increase significantly, its absolute value remains within the controllable range, and the relative proportion of the tension fluctuation amplitude has not reached an extreme level. This position is the best balance between improving platform motion performance and controlling mooring tension. After the critical position, the mooring line enters the over-tensioned state, the degree of freedom of platform motion is strongly constrained, and the RAO amplitude tends to be stable and low. However, the tension of the mooring cable increases approximately exponentially, and the average tension continues to rise. At this time, the safety risk of the mooring system increases significantly, and the continued increase in mooring radius yields limited benefits for improving platform motion performance, resulting in uneconomical use of mooring materials. Based on the above coupling characteristics, the position shown by the dotted line in the figure is determined as the favorable mooring radius.
4.3. Cage Normalized Volume Response Analysis
The normalized volume response analysis of the cage. In order to evaluate the influence of mooring radius change on the effective culture space inside the cage, this section calculates the normalized volume response of the cage under different relative mooring lengths. The results are shown in Figure 11.
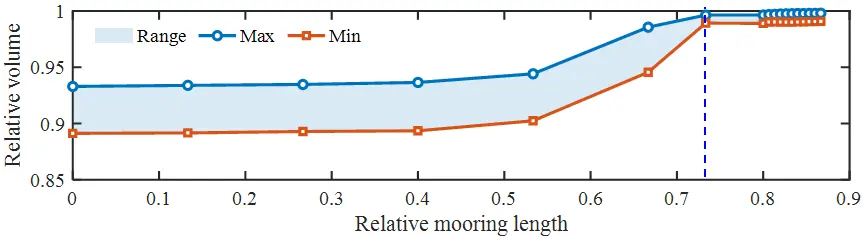
It can be seen from the figure that in the stage of small mooring radius (relative mooring length is about 0.73 or less), the maximum and minimum values of the normalized volume of the cage are separated to a large extent, and the volume fluctuation range is significant, indicating that the mooring line is in a relaxed and overhanging state at this time. The cage produces large periodic deformation under the action of waves, and the effective culture space changes drastically, which is not conducive to the stable habitat of cultured organisms. When the relative mooring length increases to the critical position shown by the dotted line in the figure, the maximum and minimum values of the normalized volume of the cage tend to converge, the range of volume fluctuation narrows sharply, the mooring line transits from the overhanging state to the tensioning state, the horizontal stiffness of the system increases significantly, the geometric shape of the cage tends to be stable, and the periodic change of the effective breeding space is effectively suppressed. Since then, as the mooring radius continues to increase, the maximum and minimum values of the normalized volume of the cage basically coincide, the volume fluctuation range is maintained at a very small level, and the cage shape tends to be rigidly fixed, but the continuous increase of the mooring radius has limited benefits for the improvement of the volume stability.
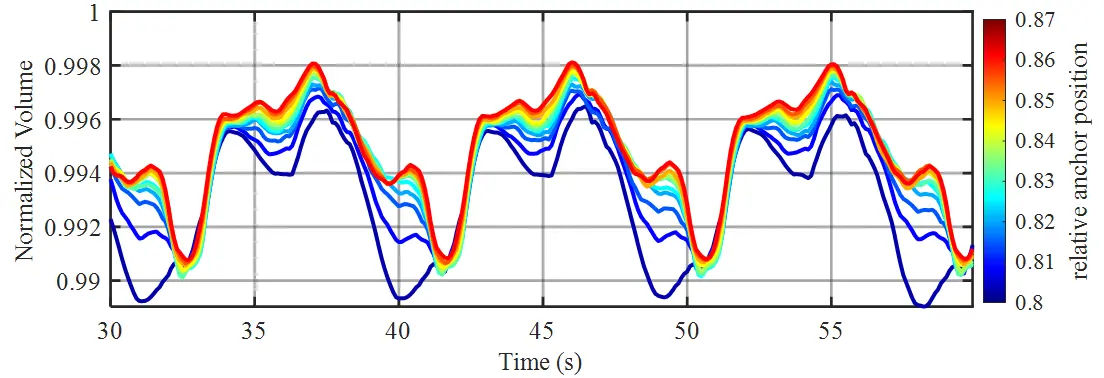
In order to further reveal the transient evolution characteristics of the cage volume in the critical transition interval, this study further selects the typical working conditions in the relative mooring length encryption interval for time history analysis, and the results are shown in Figure 12. As the mooring radius increases (the relative anchoring position increases from 0.80 to 0.87), the fluctuation amplitude of the normalized volume time history curve of the cage gradually decreases, and the mean value of each working condition curve gradually rises and tends to be stable. Specifically, when the mooring line tends to be tightened, the cage skeleton is strongly constrained by the mooring system, the deformation of the cage caused by the wave is suppressed, and the amplitude of the periodic fluctuation of the volume is attenuated; At the same time, due to the small variation of the mooring radius between the encryption conditions, the volume response of the adjacent conditions is smooth, and there is no nonlinear jump phenomenon in the critical mutation interval. The above results show that selecting the position shown in the dotted line in the figure (relative to the mooring length of about 0.73) as the favorable mooring radius can ensure the stability of the effective culture volume of the cage, and avoid the safety problems such as the sharp increase of tension caused by the mooring system entering the over-tensioned state, taking into account the culture performance and structural safety.
5. Conclusions
- (1)
-
The stiffness characteristics of the mooring system change essentially at the critical position. When the relative mooring length increases to about 0.73, the mooring line transits from catenary dominant state to taut cable state, and the horizontal recovery stiffness of the system increases sharply, which causes the synchronous mutation of platform motion response, cable tension, and cage volume. It is revealed that the nonlinear evolution of mooring stiffness is the internal mechanism driving the mutation in the hydrodynamic response of the Fishery-Photovoltaic fusion structure.
- (2)
-
The critical position (relative to the mooring length of about 0.73) is the favorable mooring radius that takes into account multi-objective performance. At this position, the platform motion response has completed the main attenuation, the absolute value of cable tension is still in the controllable range, and the cage volume fluctuation is significantly narrowed, which realizes the triple goals of platform motion control, mooring tension safety, and aquaculture volume stability. Although further increasing the mooring radius can further improve the motion and volume performance slightly, the cable tension increases exponentially, the cost performance ratio decreases sharply, and the difficulty and cost of engineering implementation increase significantly.
- (3)
-
The evolution law and quantitative parameters of platform motion, cable tension, and cage volume with mooring radius revealed in this paper can provide parameter reference and result verification basis for subsequent multi-objective optimization research of the mooring system based on an artificial intelligence algorithm.
Statement of the Use of Generative AI and AI-Assisted Technologies in the Writing Process
During the preparation of this manuscript, the authors used Doubao in order to polish and refine the language of the manuscript. After using this tool/service, the authors reviewed and edited the content as needed and take full responsibility for the content of the published article.
Author Contributions
Y.P.: Funding acquisition, Conceptualization, Methodology. J.Z.: Software, Validation, Writing—original draft. S.Z.: Software, Validation, Writing—review & editing. L.L.: Funding acquisition, Writing—review & editing, Supervision. D.X.: Methodology. C.L.: Methodology. S.M.: Software.
Ethics Statement
Not applicable.
Informed Consent Statement
Not applicable.
Data Availability Statement
Data will be made available on request.
Funding
This research was funded by Natural Science Foundation of Zhejiang Province grant number LGEY25E090013; LMS26E090001, and Central Guidance Funds for Science and Technology Local Development Projects, China, grant number 2025ZY01091.
Declaration of competing interest
The authors declare that they have no known competing financial interests or personal relationships that could have appeared to influence the work reported in this paper.
Reference
- Fang Z, Wang P, Zhou J, Xu H, Zheng K, Chan NW, et al. Marine Photovoltaic Industry Development: A Review of its Impact on Aquatic Environmental Elements and Future Perspectives. Environ. Manag. 2025, 75, 3707–3720. DOI:10.1007/s00267-025-02275-2 [Google Scholar]
- Ruan Z, Xu J, Yao H, Yin P, Zhao J, Chen X, et al. Innovative aquaculture-photovoltaic recirculating aquaculture system: Design, performance and microbial ecological mechanisms. Aquaculture 2026, 613, 743337. DOI:10.1016/j.aquaculture.2025.743337 [Google Scholar]
- Cazzaniga R, Cicu M, Rosa-Clot M, Rosa-Clot P, Tina GM, Ventura C. Floating photovoltaic plants: Performance analysis and design solutions. Renew. Sustain. Energy Rev. 2018, 81, 1730–1741. DOI:10.1016/j.rser.2017.05.269 [Google Scholar]
- Abhinav KA, Collu M, Benjamins S, Cai H, Hughes A, Jiang B, et al. Offshore multi-purpose platforms for a Blue Growth: A technological, environmental and socio-economic review. Sci. Total Environ. 2020, 734, 138256. DOI:10.1016/j.scitotenv.2020.138256 [Google Scholar]
- Buck BH, Nevejan N, Wille M, Chambers MD, Chopin T. Offshore and Multi-Use Aquaculture with Extractive Species: Seaweeds and Bivalves. In Aquaculture Perspective of Multi-Use Sites in the Open Ocean: The Untapped Potential for Marine Resources in the Anthropocene; Springer International Publishing: Cham, Switzerland, 2017; pp. 23–69. DOI:10.1007/978-3-319-51159-7_2 [Google Scholar]
- Jia X, Guo S, Wang K, Zhao Y, Du J, Peng W. Offshore Floating Photovoltaics in China: Structural Concepts, Hydrodynamic Challenges, and Future Perspectives. J. Mar. Sci. Eng. 2026, 14, 1269. DOI:10.3390/jmse14141269 [Google Scholar]
- Ji C, Hao Y, Xu S. Experimental and numerical study on the hydrodynamic responses of a novel offshore floating photovoltaic system. Ocean. Eng. 2024, 315, 119797. DOI:10.1016/j.oceaneng.2024.119797 [Google Scholar]
- Tang Y, Chen X, Huang G, Chen M, Zhang K, Jiang Y, et al. Dynamic analysis of multi-module floating photovoltaic platforms with composite mooring system by considering tidal variation and platform configuration. Ocean Eng. 2024, 312, 119243. DOI:10.1016/j.oceaneng.2024.119243 [Google Scholar]
- Zhang P, Qi X, Cheng Z, Zhao Y, Li J, Zhang L, et al. Field trial research of a semisubmersible floating photovoltaic platform. Sol. Energy 2025, 301, 113982. DOI:10.1016/j.solener.2025.113982 [Google Scholar]
- Zhu K, Shi H, Tao J, Gong H, Han Z, Cao F. Analytical study on hydrodynamic performance of co-located offshore wind–solar farms. Phys. Fluids 2024, 36, 013325. DOI:10.1063/5.0187178 [Google Scholar]
- Kim SJ, Jin C, Kim M. Time-dependent responses and mooring tensions of a moored floating structure in tsunami waves. Mar. Struct. 2024, 93, 103538. DOI:10.1016/j.marstruc.2023.103538 [Google Scholar]
- Tay ZY. Three-Dimensional Hydroelasticity of Multi-Connected Modular Offshore Floating Solar Photovoltaic Farm. J. Mar. Sci. Eng. 2023, 11, 1968. DOI:10.3390/jmse11101968 [Google Scholar]
- Martin T, Tsarau A, Bihs H. A numerical framework for modelling the dynamics of open ocean aquaculture structures in viscous fluids. Appl. Ocean Res. 2021, 106, 102410. DOI:10.1016/j.apor.2020.102410 [Google Scholar]
- Bi CW, Zhao YP, Dong GH, Xu TJ, Gui FK. Experimental investigation of the reduction in flow velocity downstream from a fishing net. Aquac. Eng. 2014, 57, 71–81. DOI:10.1016/j.aquaeng.2013.08.002 [Google Scholar]
- Cheng T, Fu S, Xu Y, Peng Y, Jiang Z. Numerical study of the hydrodynamic load of a fish net considering the effects of diffraction waves. Ocean Eng. 2025, 326, 120865. DOI:10.1016/j.oceaneng.2025.120865 [Google Scholar]
- Zhao Y, Guan C, Bi C, Liu H, Cui Y. Experimental Investigations on Hydrodynamic Responses of a Semi-Submersible Offshore Fish Farm in Waves. J. Mar. Sci. Eng. 2019, 7, 238. DOI:10.3390/jmse7070238 [Google Scholar]
- Qu X, Hu F, Kumazawa T, Takeuchi Y, Dong S, Shiode D, et al. Deformation and drag force of model square fish cages in a uniform flow. Ocean Eng. 2019, 171, 619–624. DOI:10.1016/j.oceaneng.2018.12.016 [Google Scholar]
- Zhao YP, Bi CW, Liu YX, Dong GH, Gui FK. Numerical Simulation of Interaction Between Waves and Net Panel Using Porous Media Model. Eng. Appl. Comput. Fluid Mech. 2014, 8, 116–126. DOI:10.1080/19942060.2014.11015502 [Google Scholar]
- Hu B, Li J, Ruan J, Hao J, Huang J. Characterization of the Internal and External Flow Field of a Semi-Submersible Aquaculture Platform with Multiple Net Cage Configuration. J. Mar. Sci. Eng. 2025, 13, 1373. DOI:10.3390/jmse13071373 [Google Scholar]
- Zhao YP, Bi CW, Dong GH, Gui FK, Cui Y, Xu TJ. Numerical simulation of the flow field inside and around gravity cages. Aquac. Eng. 2013, 52, 1–13. DOI:10.1016/j.aquaeng.2012.06.001 [Google Scholar]
- Huang XH, Guo GX, Tao QY, Hu Y, Liu HY, Wang SM, et al. Dynamic deformation of the floating collar of a net cage under the combined effect of waves and current. Aquac. Eng. 2018, 83, 47–56. DOI:10.1016/j.aquaeng.2018.08.002 [Google Scholar]
- Xu Z, Qin H. Fluid-structure interactions of cage based aquaculture: From structures to organisms. Ocean Eng. 2020, 217, 107961. DOI:10.1016/j.oceaneng.2020.107961 [Google Scholar]
- Chen P, Kang Y, Xu S, Liu L, Cheng Z. Numerical modeling and dynamic response analysis of an integrated semi-submersible floating wind and aquaculture system. Renew. Energy 2024, 225, 120355. DOI:10.1016/j.renene.2024.120355 [Google Scholar]
- Yang C, Hu A, Zhang H, Chen H. Numerical study on flow characteristics, hydrodynamics, and structural response of an integrated aquaculture platform with WECs and wind turbine. Ocean Eng. 2026, 343, 123423. DOI:10.1016/j.oceaneng.2025.123423 [Google Scholar]
- Zhang DQ, Tian HW, Yuan ZM, Yu SR, Du JF, Li HJ. Dynamic characteristics of a novel floating offshore photovoltaic system with flexible rope-net connection. Ocean Eng. 2025, 342, 123155. DOI:10.1016/j.oceaneng.2025.123155 [Google Scholar]
- Xie S, He J, Zhang C, Kan Y, Ma J, Zhang Z. Aero-hydro-servo-elastic coupled modeling and dynamics analysis of a four-rotor floating offshore wind turbine. Ocean Eng. 2023, 272, 113724. DOI:10.1016/j.oceaneng.2023.113724 [Google Scholar]
- Liu HF, Liu Y. Numerical investigation on the dynamic response of the semi-submersible aquaculture platform in regular waves. Ocean Eng. 2024, 294, 116718. DOI:10.1016/j.oceaneng.2024.116718 [Google Scholar]
- Wang G, Zhang J, Lu B, Lin X, Wang F, Liu S. Experimental investigation of motion response and mooring load of semi-submersible tidal stream energy turbine under wave-current interactions. Ocean Eng. 2024, 300, 117445. DOI:10.1016/j.oceaneng.2024.117445 [Google Scholar]
- Wen X, Yin G, Liu T, Ong MC, Wang C, Wang K. An optimization framework for mooring design of floating offshore wind turbines using a genetic algorithm based on a surrogate model. Renew. Energy 2025, 245, 122807. DOI:10.1016/j.renene.2025.122807 [Google Scholar]
- Hou HM, Liu Y. An accurate and efficient method to analyze the short-term extreme tension distribution of mooring line under irregular waves. Ocean Eng. 2024, 304, 117891. DOI:10.1016/j.oceaneng.2024.117891 [Google Scholar]
- Huo S, Deng S, Song Z, Zhao W, Wan D. On the hydrodynamic response and slamming impact of a cylindrical FPSO in combined wave-current flows. Ocean Eng. 2023, 275, 114139. DOI:10.1016/j.oceaneng.2023.114139 [Google Scholar]
- Moe-Føre H, Lader PF, Lien E, Hopperstad OS. Structural response of high solidity net cage models in uniform flow. J. Fluids Struct. 2016, 65, 180–195. DOI:10.1016/j.jfluidstructs.2016.05.013 [Google Scholar]
- Pan Y, Zhang J, Li L, Liu C, Sun Z, Hong J. Numerical simulation of hydrodynamic characteristics of ultra-large diameter aquaculture cages under waves action. Ocean Eng. 2025, 338, 121981. DOI:10.1016/j.oceaneng.2025.121981 [Google Scholar]