
Digital Economy and Regional Carbon Equity: Evidence from Chinese Cities

Digital Economy and Regional Carbon Equity: Evidence from Chinese Cities
Jinguang Guo 1 Jiafei Teng 2,*
Received: 23 May 2026 Revised: 17 June 2026 Accepted: 10 July 2026 Published: 28 July 2026

© 2026 The authors. This is an open access article under the Creative Commons Attribution 4.0 International License (https://creativecommons.org/licenses/by/4.0/).
1. Introduction
Against the backdrop of intensifying global climate change, carbon emission reduction and low-carbon transition have become central concerns for the international community [1,2]. In this study, carbon equity is defined as the degree to which regional carbon-emission responsibility is aligned with ecological carrying capacity, particularly carbon-sink capacity. Unlike environmental efficiency metrics, which generally assess how efficiently economic activities generate desirable outputs while reducing undesirable emissions, the city-level carbon equity index compares each city’s relative carbon-emission responsibility with its relative carbon-sink contribution. It therefore evaluates whether the spatial distribution of carbon burdens is commensurate with the ecological support provided by different cities. By shifting attention from emission-reduction efficiency to the spatial correspondence between carbon burdens and carbon-sink capacity, this perspective complements efficiency-based assessments by incorporating the distributive and interregional implications of low-carbon transition [3,4]. An imbalance in carbon equity may not only weaken the overall effectiveness of interregional collaborative emission reduction [5] but also exacerbate regional development disparities, thereby constraining the orderly advancement of China’s carbon-peaking and carbon-neutrality goals [6]. Owing to differences in resource endowments, industrial structures, urbanization processes, and ecological baseline conditions, substantial spatial disparities exist in carbon equity across Chinese cities, and the mismatch between carbon-emission responsibility and ecological carrying capacity remains pronounced [7]. In this context, identifying the key determinants of carbon equity and clarifying their underlying mechanisms have become important issues for promoting coordinated regional emission reduction and improving low-carbon governance systems [8].
As a new economic form driven by data as a key input and supported by digital technologies, the digital economy is reshaping resource allocation, industrial organization, and environmental governance [9,10]. In recent years, digital technologies have been increasingly embedded in key processes such as carbon-emission monitoring, carbon accounting, carbon-sink trading, green technology diffusion, and the realization of ecological value [11], providing technical support for more refined, intelligent, and coordinated environmental governance [12]. In terms of its potential effects, the digital economy may improve carbon equity by enhancing information transparency, accelerating the diffusion of green technologies, optimizing resource allocation, and reducing the costs of low-carbon transition, thereby narrowing interregional disparities in carbon governance capacity [13]. However, the uneven distribution of digital infrastructure, data resources, and technological absorptive capacity across regions may also reinforce factor agglomeration and developmental divergence, further aggravating carbon equity imbalances [14]. This suggests that the effect of the digital economy on carbon equity is not necessarily unidirectional or linear; rather, its direction, transmission mechanisms, and spatial manifestations require further empirical examination [15].
Existing studies provide an important foundation for understanding the environmental consequences of the digital economy, yet research on the relationship between the digital economy and carbon equity remains relatively limited [16]. Most prior studies have adopted an environmental efficiency perspective, focusing mainly on the effects of the digital economy on carbon-emission intensity, pollution reduction, and green development efficiency, while paying insufficient attention to carbon equity as a matter that combines ecological and distributional attributes. The limited literature related to carbon equity has primarily examined traditional policy instruments, such as fiscal transfers and environmental regulation [17]. However, systematic theoretical analysis and empirical evidence remain insufficient regarding how the digital economy affects carbon equity through channels such as industrial structure upgrading, green technological innovation, and market integration [18]. Moreover, carbon equity is characterized by significant spatial dependence: neighboring regions interact closely in terms of carbon emissions, carbon-sink functions, and environmental governance [19]. Nevertheless, few studies have incorporated the digital economy into an analytical framework that accounts for regional interaction and spatial spillovers, leaving the spatial transmission mechanism through which the digital economy affects carbon equity insufficiently understood. China provides a particularly suitable empirical setting for this inquiry. It is not only a major arena for the rapid development of the digital economy, but also a key country in advancing carbon-peaking and carbon-neutrality goals [20]. At the same time, Chinese cities differ substantially in digital infrastructure, industrial foundations, and ecological conditions [21], providing a representative context and an appropriate sample for examining the impact of the digital economy on carbon equity. However, city-level empirical evidence on this issue remains scarce.
Accordingly, using panel data for 281 prefecture-level cities in China from 2010 to 2023, this study employs two-way fixed-effects models, mechanism-test models, and a spatial Durbin model to systematically examine the direct effect, transmission mechanisms, and spatial spillover effects of the digital economy on carbon equity. The marginal contributions of this study are threefold. First, this study develops a city-level carbon equity index that directly compares each city’s relative carbon-emission responsibility with its relative carbon-sink contribution. By moving beyond conventional emission-reduction efficiency and green development performance measures, the index evaluates the spatial alignment between carbon burdens and ecological carrying capacity. This perspective extends the literature on the environmental consequences of the digital economy to the distributive and interregional implications of low-carbon transition. Second, this study develops a mechanism framework that links the digital economy to carbon equity through industrial structure upgrading, green technological innovation, and market integration, thereby revealing the internal transmission pathways through which digitalization shapes carbon equity. Third, by incorporating spatial spillover effects into a unified analytical framework, this study identifies the spatially uneven effects of the digital economy on carbon equity and provides empirical evidence to optimize the spatial allocation of digital resources, strengthen interregional coordination in low-carbon governance, and promote improvements in carbon equity.
2. Theoretical Analysis and Research Hypotheses
2.1. Direct Impact of the Digital Economy on Carbon Equity
Carbon equity emphasizes the proper alignment between regional carbon-emission responsibility and ecological carrying capacity. Its realization depends not only on resource endowments and development stages, but also on information-identification capacity, the availability of governance resources, and differences in emission-reduction costs. As a new economic form supported by data elements and digital technologies [22], the digital economy may exert an important influence on carbon equity by improving information transparency, expanding access to low-carbon resources, and reducing the costs of emission reduction.
First, from the perspective of information transparency, the digital economy helps improve carbon-emission monitoring, accounting, and traceability, thereby enhancing the accuracy of identifying regional carbon-emission responsibility [23]. Traditional carbon accounting methods rely heavily on macro-level statistical data and empirical emission factors, and are therefore constrained by limited timeliness, insufficient spatial granularity, and incomplete identification of emission sources. The application of digital technologies such as the Internet of Things, big data, and blockchain can increase the frequency of dynamic monitoring for key emission sources and improve the precision of carbon-footprint accounting [24]. These technologies also enhance the timeliness, verifiability, and traceability of carbon-emission data. As carbon-emission information becomes more transparent, ambiguity and information asymmetry in the allocation of regional carbon responsibility are likely to decline, providing a more reliable data foundation for the evaluation and governance of carbon equity.
Second, from the perspective of resource accessibility, the digital economy can facilitate the cross-regional dissemination of green and low-carbon technologies, knowledge on emissions reduction, and experience in environmental governance, thereby narrowing disparities in low-carbon governance capacity across regions [25]. In practice, regions differ substantially in their access to green technologies, adoption of cleaner production methods, and environmental governance capacity [26], which constitutes an important source of carbon equity imbalance. By improving the efficiency of environmental information transmission and technology supply–demand matching, digital platforms can accelerate the diffusion and application of energy-saving technologies, energy-management solutions, and cleaner production processes [27]. This enables regions with relatively weak technological foundations to access key low-carbon resources at lower thresholds, thereby strengthening their carbon governance capacity and improving the mismatch between carbon-emission responsibility and ecological carrying capacity.
Third, from the perspective of emission-reduction costs, the digital economy can reduce the marginal cost of emission reduction through digital management and behavior-based incentive mechanisms, thereby improving the feasibility of low-carbon transition [28]. For firms and regions, data-driven tools such as the industrial Internet and energy-management systems can optimize energy allocation and production processes, reducing the carbon-emission intensity of unit output [29]. For residents, digital mechanisms such as personal carbon-account systems and inclusive carbon-reduction programs can quantify, record, and provide feedback-based incentives for green consumption and low-carbon travel, thereby strengthening individuals’ motivation to participate continuously in emission-reduction activities [30,31]. As the coverage and implementation efficiency of multi-actor emission-reduction practices increase, the alignment between regional carbon-emission responsibility and ecological carrying capacity is also expected to improve.
Accordingly, this study proposes the following hypothesis:
Hypothesis 1 (H1). The digital economy has a positive effect on carbon equity.
2.2. Mechanisms Through Which the Digital Economy Affects Carbon Equity
The digital economy may not only exert a direct effect on carbon equity but also indirectly influence the alignment between regional carbon-emission responsibility and ecological carrying capacity through industrial structure upgrading, green technological innovation, and market integration.
First, the digital economy may improve carbon equity by promoting industrial structure upgrading. Once digital technologies are embedded in production and circulation processes, they can improve the efficiency of factor allocation and guide production factors such as capital and labor toward sectors with higher technological content, lower resource consumption, and lower environmental burdens [32]. This process helps reduce the share of energy-intensive and high-emission industries, promotes the development of modern services and advanced manufacturing, and ultimately lowers the carbon intensity of regional economic activities. Meanwhile, new business models generated by the digital economy, such as remote services, platform-based collaboration, and cloud manufacturing [33], provide relatively low-carbon development pathways for regions with heterogeneous resource endowments [34]. These pathways can help mitigate the lock-in effect of the traditional industrialization model characterized by “high growth and high emissions”, thereby improving the regional pattern of carbon equity [35].
Second, the digital economy may enhance carbon equity by stimulating green technological innovation. Digital platforms reduce the costs of knowledge dissemination, technology transactions, and innovation collaboration, thereby strengthening the openness and networked nature of green technological innovation. The application of big data, artificial intelligence, and other digital technologies can not only improve the R&D efficiency of key technologies related to clean energy utilization, energy conservation, carbon reduction, and carbon capture [36] but also accelerate the diffusion and transformation of advanced green technologies across regions [37]. When green technological innovation capacity increases and generates cross-regional spillovers, late-developing regions can obtain emission-reduction technologies at lower costs, thereby narrowing regional gaps in low-carbon governance capacity [38] and improving the coordination between carbon responsibility and ecological carrying capacity.
Third, the digital economy may improve carbon equity by advancing market integration. The digital economy can reduce transaction costs and information asymmetry, weaken the constraints imposed by traditional market segmentation on factor mobility and resource allocation [39,40], and strengthen market linkages across regions. In fields such as carbon-emissions trading, green finance, and environmental rights allocation [41], digital technologies can improve the liquidity and pricing efficiency of environmental rights products through real-time data exchange and intelligent execution mechanisms. As market integration improves, resources such as carbon allowances, green capital, and low-carbon technologies can be allocated more efficiently across a wider spatial scale [42]. These resources may flow toward regions with lower marginal abatement costs and higher emission-reduction efficiency, which not only improves overall emission-reduction efficiency but also facilitates a more reasonable interregional sharing of emission-reduction costs, thereby enhancing carbon equity. The conceptual framework is presented in Figure 1.
Accordingly, this study proposes the following hypotheses:
Hypothesis 2 (H2). The digital economy improves carbon equity by promoting industrial structure upgrading.
Hypothesis 3 (H3). The digital economy improves carbon equity by stimulating green technological innovation.
Hypothesis 4 (H4). The digital economy improves carbon equity by advancing market integration.
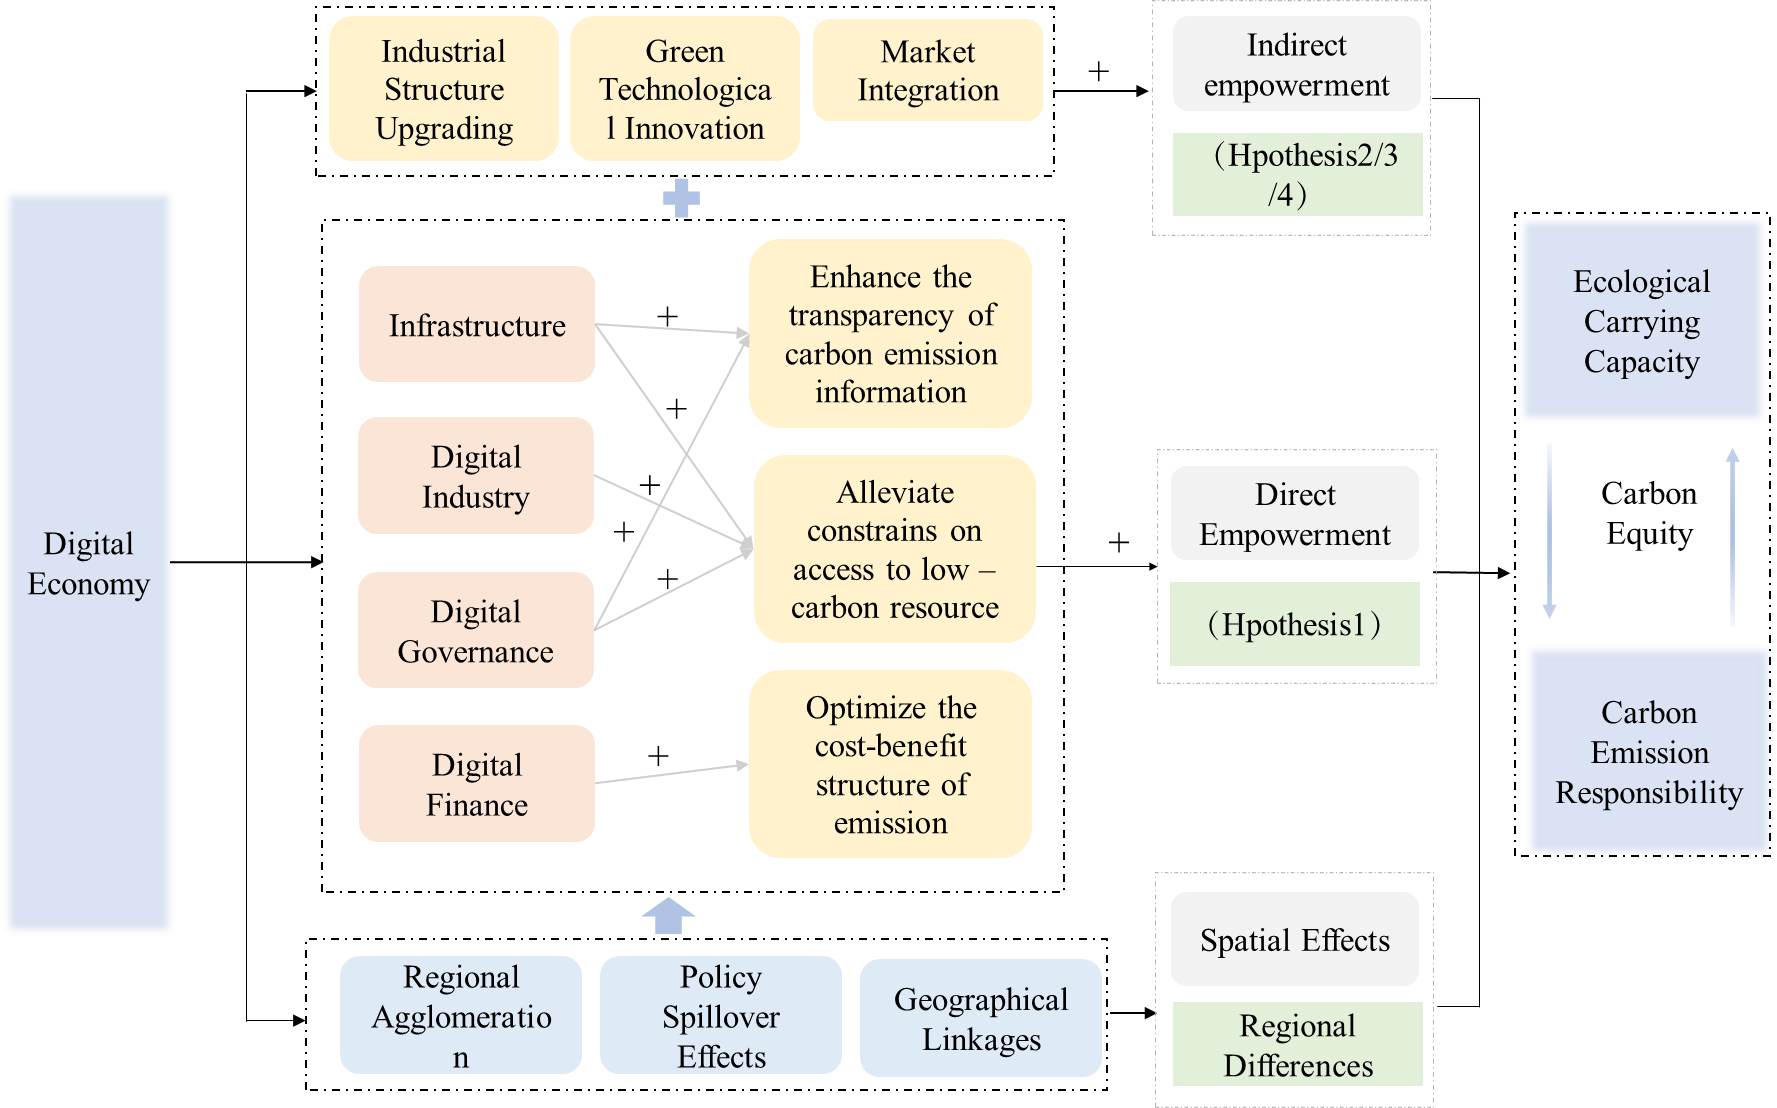
Figure 1. Conceptual framework of the digital economy and regional carbon equity. (Note: “+” indicates a positive effect).
3. Research Design
3.1. Model Specification
To examine the impact of the digital economy on carbon equity, this study first estimates a two-way fixed-effects model based on the preceding theoretical analysis:
|
```latexC{E}_{it}={\beta }_{0}+{\beta }_{1}D{E}_{it}+{\beta }^{\mathrm{\prime}}{X}_{it}+{\mu }_{i}+{\lambda }_{t}+{\epsilon }_{it}``` |
(1) |
where $$C{E}_{it}$$ denotes the level of carbon equity in city $$i$$ in year $$t$$; $$D{E}_{it}$$ is the level of digital economy development and serves as the core explanatory variable; $${X}_{it}$$ is a vector of control variables; $${\mu }_{i}$$ and $${\lambda }_{t}$$ denote city and year fixed effects, respectively; and $${\epsilon }_{it}$$ is the error term.
To further examine the potential mechanisms through which the digital economy affects carbon equity, this study estimates the following mechanism-test models:
|
```latex{M}_{it}={\alpha }_{0}+{\alpha }_{1}D{E}_{it}+{\alpha }^{\mathrm{\prime}}{X}_{it}+{\mu }_{i}+{\lambda }_{t}+{\epsilon }_{it}``` |
(2) |
|
```latexC{E}_{it}={\gamma }_{0}+{\gamma }_{1}D{E}_{it}+{\gamma }_{2}{M}_{it}+{\gamma }^{\mathrm{\prime}}{X}_{it}+{\mu }_{i}+{\lambda }_{t}+{\epsilon }_{it}``` |
(3) |
where $${M}_{it}$$ denotes the mediating variable, including industrial upgrading ($$Upgrading$$), green technological innovation ($$GT$$), and market integration ($$MI$$). All other variables are defined as in Equation (1). A mediating role is suggested if $${\alpha }_{1}$$ in Equation (2) is statistically significant, $${\gamma }_{2}$$ in Equation (3) is statistically significant, and the absolute value of $${\gamma }_{1}$$ in Equation (3) is smaller than the benchmark estimate in Equation (1).
Given the pronounced spatial dependence of carbon equity and the possibility that the digital economy may generate cross-regional effects through factor mobility, technology diffusion, and regional competition, this study further estimates a spatial Durbin model:
|
```latexC{E}_{it}=\rho WC{E}_{it}+{\beta }_{1}D{E}_{it}+{\theta }_{1}WD{E}_{it}+{\beta }^{\mathrm{\prime}}{X}_{it}+{\phi }^{\mathrm{\prime}}W{X}_{it}+{\mu }_{i}+{\lambda }_{t}+{\epsilon }_{it}``` |
(4) |
where $$W$$ is the spatial weight matrix, specified in this study as an inverse geographic distance matrix. $$WC{E}_{it}$$ denotes the spatial lag of carbon equity; $$WD{E}_{it}$$ denotes the spatial lag of digital economy development; and $$W{X}_{it}$$ denotes the spatial lags of the control variables. $$\rho$$ is the spatial autoregressive coefficient, while $${\theta }_{1}$$ and $$\phi$$ capture the spatial spillover effects of the explanatory and control variables, respectively. The definitions of the remaining variables are consistent with those provided above.
3.2. Definition of Variables
3.2.1. Dependent Variable: Carbon Equity
Carbon equity is used to measure the degree of alignment between regional carbon-emission responsibility and ecological carrying capacity, reflecting the relative balance between carbon emissions and carbon absorption across regions [43]. If a region’s share of national carbon emissions exceeds its share of national carbon-sink contribution, this indicates that the region may be appropriating external ecological rights through excessive ecological-resource consumption. Conversely, if a region contributes more to carbon absorption than to carbon emissions, it has a relative advantage in carbon sequestration and makes a net contribution to the national carbon burden. Based on this logic, this study constructs a city-level carbon equity index as follows:
|
```latexC{E}_{it}=\frac{C{A}_{it}/\sum _{k=1}^{N}{CA}_{kt}}{{E}_{it}/\sum _{k=1}^{N}{E}_{kt}}``` |
(5) |
where $$C{A}_{it}$$ denotes the carbon-sink amount of city $$i$$ in year $$t$$, and $${E}_{it}$$ denotes the corresponding carbon emissions. To enhance comparability across cities, the carbon equity index is further standardized to the range of 0 to 1. A larger value indicates a higher level of carbon equity.
For the measurement of carbon sinks, considering that forests and grasslands are the main carbon-sequestration carriers in terrestrial ecosystems [44,45], this study adopts a spatially explicit accounting method. Referring to the parameter system developed by Fang and colleagues based on national biomass inventory data, this study spatially integrates carbon absorption coefficients and corresponding land-use areas across different ecological regions to estimate regional carbon sinks:
|
```latexCA=\sum _{j=1}^{m}\left({S}_{forest,j}×{K}_{forest,j}+{S}_{grassland,j}×{K}_{grassland,j}\right)``` |
(6) |
where $$CA$$ denotes total carbon sinks in the region; $${S}_{forest,j}$$ and $${S}_{grassland,j}$$ are the areas of forestland and grassland in grid cell $$j$$, respectively; $${K}_{forest,j}$$ and $${K}_{grassland,j}$$ are the corresponding carbon-sequestration coefficients; and $$m$$ is the total number of grid cells in the study area.
3.2.2. Core Explanatory Variable: Digital Economy
The digital economy is a multidimensional concept encompassing digital infrastructure, information services, digital finance, industrial digitalization, platform-based activities, and digital governance. In city-level panel research, its measurement should balance conceptual relevance with the availability of consistent and comparable data across cities and years. Accordingly, this study constructs an index based on two complementary dimensions: Internet development and digital financial inclusion. The selection of indicators follows three principles: relevance to the mechanisms through which digitalization may affect carbon equity, complementarity across dimensions, and long-term data comparability.
Internet development represents the technological and informational foundation of digitalization. Following Zhao et al. [46], this dimension is measured using four indicators: broadband Internet subscribers per 100 persons, the share of employees in computer services and software in total urban-unit employment, per capita telecommunications business volume, and mobile phone subscribers per 100 persons. These indicators respectively capture fixed-network coverage, digital-industry human capital, the intensity of information and telecommunications services, and mobile-terminal access. Taken together, they reflect whether a city possesses the connectivity, information-processing capacity, and digital-service foundation required for digital technologies to support carbon-emission monitoring, green technology diffusion, and environmental governance.
Digital financial inclusion represents the resource-allocation dimension of the digital economy. Drawing on Guo et al. [47], this study uses the Peking University Digital Financial Inclusion Index of China to capture the coverage breadth and service depth of digital financial services. Digital finance can reduce transaction and financing barriers, improve the matching of capital with green technologies and low-carbon projects, and broaden access to transition-related financial resources across cities with heterogeneous development conditions. It therefore complements the infrastructure- and connectivity-oriented indicators of Internet development.
Drawing on the multidimensional index-construction logic of Liu et al. [48], the five indicators are aggregated using the entropy-weighted TOPSIS method. This approach assigns weights according to the informational variation of individual indicators and evaluates cities according to their relative proximity to the ideal level of digital economy development. The resulting indicator system is reported in Table 1.
Table 1. Comprehensive evaluation index of digital economy development.
|
Primary Indicator |
Secondary Indicator |
Definition |
Direction |
Data Source |
|---|---|---|---|---|
|
Internet development |
Broadband Internet subscribers per 100 persons |
Reflects the access scale and coverage of fixed broadband networks |
+ |
China City Statistical Yearbook |
|
Internet development |
Employees in computer services and software as a share of urban unit employment |
Reflects the share and specialization level of the digital information industry in human-resource allocation |
+ |
China City Statistical Yearbook |
|
Internet development |
Per capita telecommunications business volume |
Reflects the output scale of telecommunications and information services and the usage intensity of residents and firms |
+ |
China City Statistical Yearbook |
|
Internet development |
Mobile phone subscribers per 100 persons |
Reflects the penetration of mobile terminals and residents’ access capacity to digital networks |
+ |
China City Statistical Yearbook |
|
Digital financial inclusion |
Peking University Digital Financial Inclusion Index of China |
Reflects the coverage breadth and depth of digital financial services, including digital payment, digital credit, and digital investment |
+ |
Institute of Digital Finance, Peking University |
Note: “+” indicates a positive contribution to the composite index.
3.2.3. Mechanism Variables
This study selects industrial structure upgrading ($$Upgrading$$), green technological innovation ($$GT$$), and market integration ($$MI$$) as mechanism variables. Specifically, industrial structure upgrading (Upgrading) is measured by the ratio of the value added of the tertiary industry to that of the secondary industry. This indicator captures the relative shift of the regional industrial structure from secondary industry toward tertiary industry. Green technological innovation is measured by the natural logarithm of the number of authorized green invention patents plus one. Market integration is measured with reference to existing studies by calculating regional relative price variance based on the retail price index of commodities and then applying reverse treatment. A larger value indicates a lower degree of market segmentation and a higher level of market integration.
3.2.4. Control Variables
Carbon equity is shaped not only by digital development but also by differences in cities’ stages of development, production structures, urban spatial organization, and public governance conditions. These factors may simultaneously affect the capacity of a city to develop the digital economy and the extent to which its carbon-emission responsibility is aligned with its ecological carrying capacity. To reduce potential omitted-variable bias, this study controls for economic development, industrial structure, urbanization, government intervention, fiscal pressure, and population density. The selection of these variables follows the broader literature on urban low-carbon transition, environmental governance, and regional carbon allocation [5,17,18,32].
The natural logarithm of GDP per capita measures economic development (Economic). Economic development may influence carbon equity through two countervailing channels. On the one hand, higher income levels are often accompanied by greater production scale, energy demand, consumption intensity, and transport activity, which may increase local carbon-emission responsibility. On the other hand, economically developed cities generally possess stronger fiscal capacity, technological resources, and environmental-service provision, which may support cleaner production, ecological restoration, and low-carbon governance. Controlling for economic development, therefore, helps distinguish the effect of digital economy development from the broader effects of a city’s development stage and resource endowments.
Industrial structure (Industrial) is measured by the share of value added generated by the tertiary industry in GDP. The sectoral composition of a city directly affects its energy-use pattern, carbon-emission intensity, and ecological pressure. Cities with a relatively high share of energy-intensive manufacturing and resource-processing activities may face greater difficulty in reconciling carbon-emission responsibility with local ecological carrying capacity. By contrast, a larger service-sector share may be associated with lower direct carbon intensity and a relatively less emission-intensive growth pattern. This variable is included to account for baseline differences in economic composition across cities. It is conceptually distinct from the mechanism variable of industrial structure upgrading, which is measured by the ratio of tertiary-industry value added to secondary-industry value added and captures the relative shift from secondary to tertiary activities.
Urbanization (Urbanization) is measured by the share of the urban population in the total population. Urbanization may affect carbon equity through changes in land use, infrastructure demand, residential energy consumption, and the spatial concentration of economic activities. Urban expansion can increase pressure on energy systems [49] and ecological space, whereas population agglomeration may also improve the efficiency of infrastructure provision, public transport, and environmental-service delivery. The overall direction of its effect is therefore theoretically indeterminate and requires empirical control.
Government intervention (Government) is measured by the ratio of local fiscal expenditure to GDP. This variable captures the role of local governments in providing public services, financing environmental infrastructure, implementing environmental regulation, and supporting ecological protection. Greater fiscal involvement may strengthen a city’s capacity for carbon emissions monitoring, pollution control, ecological restoration, and low-carbon technology deployment. Fiscal pressure (Fiscal), measured by the ratio of local fiscal deficit to fiscal revenue, is additionally controlled for because constrained fiscal conditions may limit environmental expenditure and alter local governments’ incentives to balance short-term growth objectives with long-term ecological responsibilities.
Finally, population density (Population density) is measured by the natural logarithm of population per unit of land area. Population concentration is closely related to urban spatial form, infrastructure-use intensity, and pressure on local ecological resources. Higher population density may generate scale economies in energy supply, public transport, and environmental-service provision; however, it may also increase congestion, energy demand, and the intensity of land development. Controlling for population density helps isolate the effect of digital economy development from the influence of urban agglomeration and spatial concentration. Descriptive statistics for all variables are reported in Table 2.
Table 2. Descriptive statistics.
|
Variable |
Obs. |
Mean |
Std. Dev. |
Min. |
Max. |
|---|---|---|---|---|---|
|
CE |
3934 |
0.5155 |
0.1971 |
0.0253 |
0.9990 |
|
DE |
3934 |
0.3611 |
0.1297 |
0.0001 |
0.9400 |
|
Upgrading |
3934 |
1.0829 |
0.6227 |
0.1087 |
6.3874 |
|
GT |
3934 |
2.3082 |
0.1445 |
0.0000 |
5.8461 |
|
MI |
3934 |
0.4520 |
0.2191 |
0.0559 |
1.5413 |
|
Economic |
3934 |
10.7654 |
0.7112 |
8.5553 |
13.1851 |
|
Industrial |
3934 |
0.4286 |
0.1029 |
0.0976 |
0.8485 |
|
Urbanization |
3934 |
0.3996 |
0.2117 |
0.0958 |
1.0000 |
|
Government |
3934 |
0.1977 |
0.0989 |
0.0439 |
0.9155 |
|
Fiscal |
3934 |
0.1224 |
0.1021 |
−0.0671 |
0.8217 |
|
Population density |
3934 |
5.7569 |
0.9248 |
1.6193 |
8.1756 |
To assess potential multicollinearity among the explanatory variables, this study further examines the pairwise Pearson correlations and variance inflation factors (VIFs) for the digital economy index and the control variables used in the baseline specification. As reported in Table 3, the explanatory variables exhibit moderate correlations, which is consistent with the fact that digital development is embedded in broader processes of economic development, urbanization, industrial restructuring, and fiscal governance. The largest absolute pairwise correlation coefficient is 0.567, observed between economic development and fiscal pressure. This value remains below the level (0.70) commonly associated with severe pairwise collinearity.
The VIF results further indicate that multicollinearity is not a material concern. The VIF values range from 1.33 to 4.12, with a mean VIF of 2.26. The largest VIF is observed for fiscal pressure, while the VIF for the digital economy variable is only 1.33. All values remain below the conservative threshold of 5 and are substantially lower than the conventional threshold of 10. These results suggest that the explanatory variables do not exhibit serious multicollinearity and that the estimated coefficient of the digital economy is not materially affected by excessive linear dependence among the regressors.
Table 3. Correlation matrix and multicollinearity diagnostics.
|
Variable |
DE |
Economic |
Industrial |
Urbanization |
Government |
Fiscal |
Population Density |
VIF |
|---|---|---|---|---|---|---|---|---|
|
DE |
1.000 |
1.33 |
||||||
|
Economic |
0.380 *** |
1.000 |
2.72 |
|||||
|
Industrial |
0.184 *** |
0.375 *** |
1.000 |
1.61 |
||||
|
Urbanization |
0.330 *** |
0.565 *** |
0.345 *** |
1.000 |
1.56 |
|||
|
Government |
−0.183 *** |
−0.529 *** |
0.109 *** |
−0.219 *** |
1.000 |
2.90 |
||
|
Fiscal |
−0.282 *** |
−0.567 *** |
0.023 |
−0.288 *** |
0.466 *** |
1.000 |
4.12 |
|
|
Population density |
0.188 *** |
0.205 *** |
0.188 *** |
0.088 *** |
−0.477 *** |
−0.499 *** |
1.000 |
1.56 |
Notes: The table reports Pearson correlation coefficients among the explanatory variables included in the baseline regression. VIF statistics are calculated using the same explanatory variables. *** indicates significance at the 1% level.
3.3. Data Sources
This study uses panel data for 281 Chinese cities from 2010 to 2023. Socioeconomic data are mainly obtained from the China City Statistical Yearbook, the China Energy Statistical Yearbook, and provincial and municipal statistical yearbooks. Forestland and grassland area data are obtained from the National Tibetan Plateau Data Center. Digital financial inclusion data are obtained from the Institute of Digital Finance, Peking University. Carbon-emission data are calculated by integrating information from the China Energy Statistical Yearbook and the Carbon Emission Accounts and Datasets database. For a small number of missing values, this study applies moving-average interpolation. To reduce the effects of heteroscedasticity and improve the robustness of the estimates, selected continuous control variables are transformed into natural logarithms.
4. Results and Analysis
4.1. Distributional Characteristics of the Digital Economy and Carbon Equity
4.1.1. Distributional Characteristics of the Digital Economy
As shown in Figure 2 and Figure 3, the digital economy of Chinese cities exhibited an evolutionary pattern characterized by continuous improvement and a gradient of diffusion from 2010 to 2023. From the perspective of kernel density distribution, the curve for the digital economy shifted continuously to the right, indicating an overall increase in the level of digital economy development across the sample cities. The peak of the distribution gradually moved from the low-value range to the medium- and high-value ranges, suggesting that the proportion of cities with low levels of digital economy development declined, while the number of cities at medium and high levels increased. This indicates that digital economy development gradually shifted from early-stage localized breakthroughs to broader spatial diffusion.
Further examination shows that the kernel density curve evolved from a relatively concentrated, low-level unimodal distribution in the early period to a more pronounced multi-peak structure in the medium- and high-value ranges. This suggests that, although the overall level of digital economy development increased, cities did not converge synchronously. Instead, digital economy development displayed a certain degree of gradient differentiation and club-style agglomeration. In terms of spatial distribution, high-value areas of the digital economy gradually evolved from point-like concentrations in a few core cities into contiguous expansion patterns driven by coastal urban agglomerations and regional central cities. The eastern coastal region remained in a leading position overall, while provincial capitals and nodal cities in central China accelerated their catch-up process. By contrast, western cities and some resource-based cities remained at relatively low levels.
4.1.2. Distributional Characteristics of Carbon Equity
Compared with the digital economy, the spatiotemporal evolution of carbon equity showed stronger ecological constraints and spatial heterogeneity. As shown in Figure 2, the kernel density curve for carbon equity shifted slowly to the right from 2010 to 2023, indicating that the alignment between carbon-emission responsibility and ecological carrying capacity improved overall among the sample cities. However, the magnitude of this shift was much smaller than that observed for the digital economy, and the density peak remained concentrated in the medium-to-high range for a prolonged period. This suggests that improvements in carbon equity were gradual and path-dependent, making short-term leapfrog improvement difficult.
Meanwhile, the distribution of carbon equity formed a relatively clear main peak in the medium-to-high range. The low-value left tail narrowed to some extent, whereas the high-value right tail expanded only modestly. This pattern indicates that most cities gradually moved toward medium or higher levels of carbon equity, but the expansion of cities with high carbon equity remained constrained by differences in ecological baseline conditions, resource endowments, and development intensity.
The spatial distribution in Figure 3 further shows that high-value areas of carbon equity were mainly concentrated in regions with favorable ecological conditions and strong carbon-sink capacity, especially the southwestern ecological barrier and the northeastern forest region. Some mountainous and hilly cities in southern China also exhibited relatively high levels of carbon equity. In contrast, low-value areas were more commonly located in regions with higher levels of urbanization and more intensive land development. Overall, the evolution of the digital economy was more expansionary, whereas ecological foundations more strongly constrained the evolution of carbon equity. This contrast provides an empirical basis for further identifying the effect of the digital economy on carbon equity.
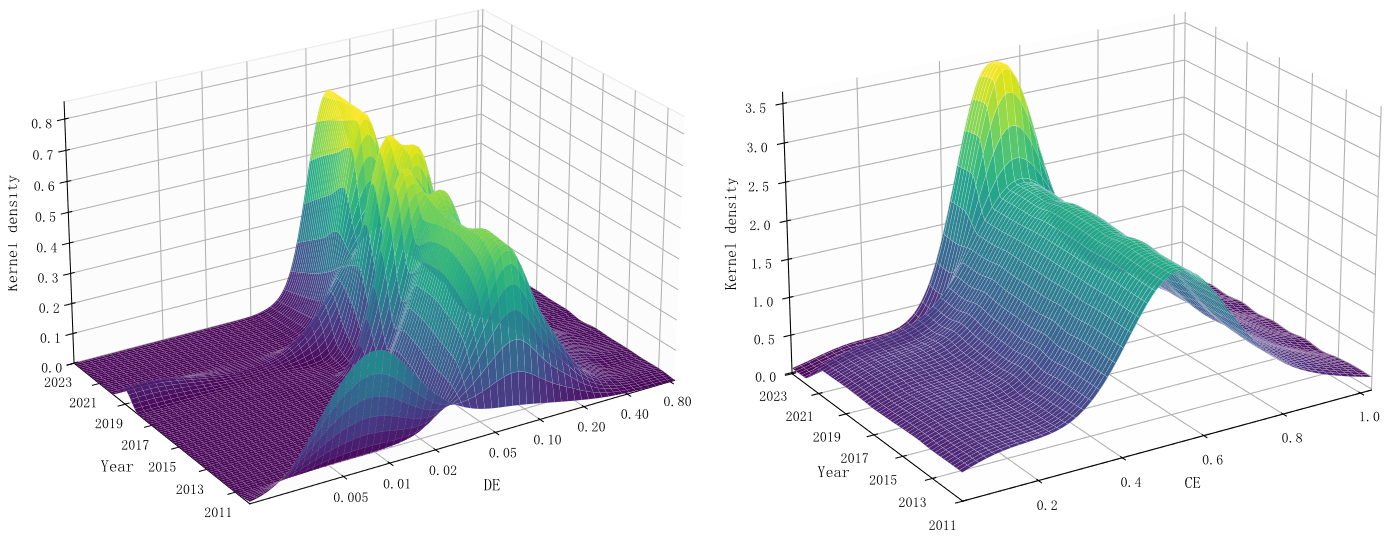
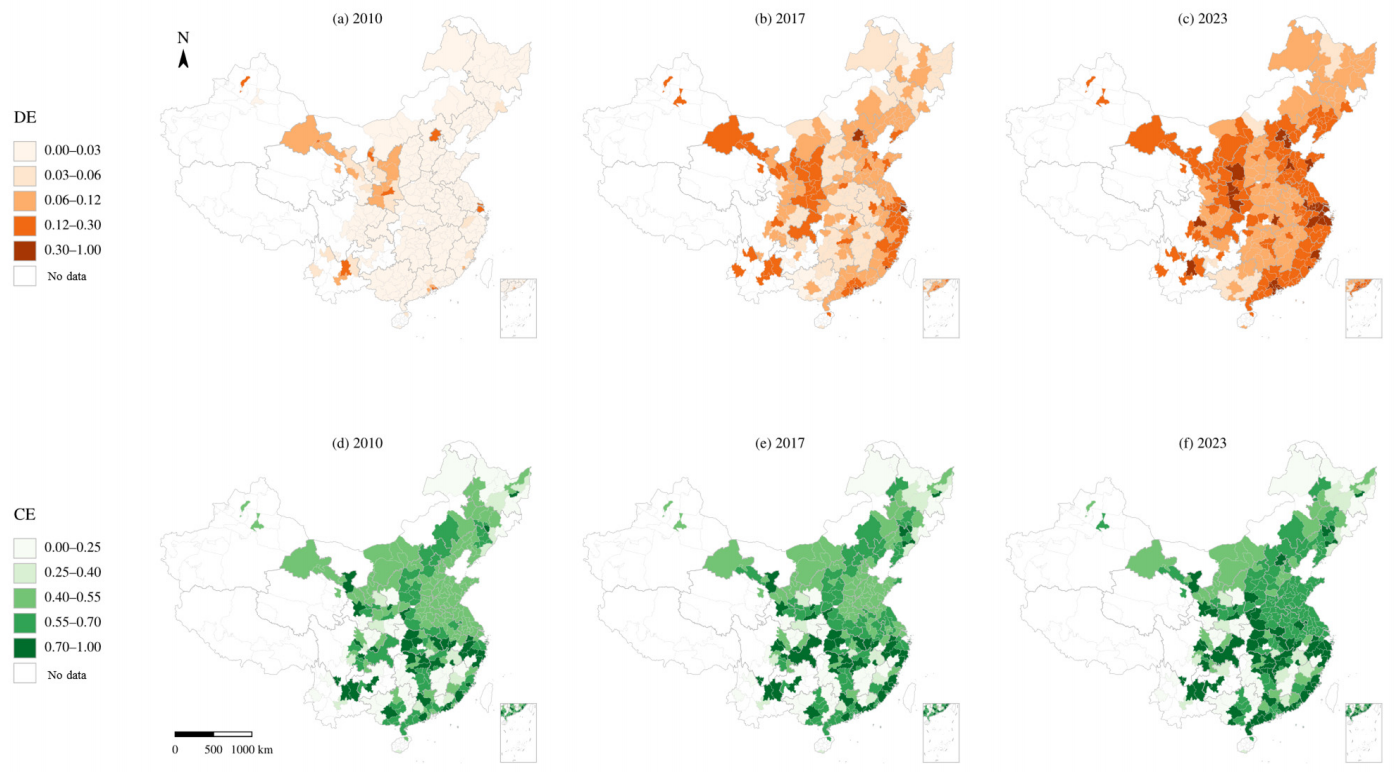
Figure 3. Spatial distribution of the digital economy and carbon equity, 2010–2023. The map is based on the standard map approved by the Ministry of Natural Resources (Approval No. GS (2024) 0650), and the base map remains unaltered. (a) Digital economy, 2010; (b) Digital economy, 2017; (c) Digital economy, 2023; (d) Carbon equity, 2010; (e) Carbon equity, 2017; (f) Carbon equity, 2023.
4.2. Baseline Regression
Table 4 reports the baseline regression results for the effect of the digital economy on urban carbon equity. Columns (1) and (2) present the full-sample estimates without and with control variables, respectively. Columns (3)–(5) further report the subsample estimates for eastern, central, and western China. All models control for city fixed effects and year fixed effects.
For the full sample, the estimated coefficient of the digital economy is consistently positive and statistically significant across different model specifications. Specifically, when only the core explanatory variable is included and city and year fixed effects are controlled for, the coefficient on the digital economy is 0.628 and significant at the 1% level. After further controlling for economic development, industrial structure, urbanization, government intervention, fiscal pressure, and population density, the coefficient decreases to 0.167 but remains significant at the 1% level. This indicates that the development of the digital economy generally contributes to improving urban carbon equity. In other words, the digital economy helps improve the alignment between urban carbon-emission responsibility and ecological carrying capacity. Therefore, H1 is supported.
The regional subsample results reveal clear spatial heterogeneity in the effect of the digital economy on carbon equity. In eastern China, the coefficient of the digital economy is 0.088 and significant at the 10% level, indicating that the digital economy has a positive but relatively limited effect on carbon equity in eastern cities. In central China, the coefficient is 0.635 and significant at the 1% level, representing the strongest effect among the three regions. This suggests that, under the combined conditions of industrial relocation, low-carbon transition pressure, and greater scope for governance improvement, the digital economy in central China is more likely to be translated into carbon equity gains. By contrast, in western China, the coefficient on the digital economy is 0.186 but not statistically significant, suggesting that its positive effect has not yet fully materialized. A possible explanation is that Western cities remain constrained by relatively weak digital infrastructure, limited industrial support capacity, insufficient absorptive capacity for green technologies, and lower levels of marketization. These constraints may weaken the role of the digital economy in reallocating low-carbon governance resources and adjusting carbon-emission responsibility.
Table 4. Baseline Regression Results.
|
Variables |
(1) |
(2) |
(3) |
(4) |
(5) |
|---|---|---|---|---|---|
|
CE |
CE |
CE |
CE |
CE |
|
|
DE |
0.628 *** |
0.167 *** |
0.088 * |
0.635 *** |
0.186 |
|
(0.056) |
(0.058) |
(0.048) |
(0.205) |
(0.168) |
|
|
Economic |
−0.221 *** |
−0.185 *** |
−0.225 *** |
−0.205 *** |
|
|
(0.014) |
(0.017) |
(0.028) |
(0.028) |
||
|
Industrial |
0.328 *** |
0.336 *** |
0.882 *** |
0.065 |
|
|
(0.074) |
(0.114) |
(0.133) |
(0.139) |
||
|
Urbanization |
0.098 * |
0.096 * |
0.014 |
−0.074 |
|
|
(0.058) |
(0.055) |
(0.113) |
(0.167) |
||
|
Government |
1.869 *** |
1.226 *** |
1.880 *** |
2.530 *** |
|
|
(0.246) |
(0.288) |
(0.464) |
(0.522) |
||
|
Fiscal |
−1.331 *** |
−1.172 *** |
−1.054 ** |
−1.634 *** |
|
|
(0.265) |
(0.315) |
(0.496) |
(0.556) |
||
|
Population density |
0.295 *** |
0.054 |
0.385 *** |
0.081 |
|
|
(0.064) |
(0.064) |
(0.133) |
(0.179) |
||
|
Constant |
0.601 *** |
1.155 *** |
1.880 *** |
0.667 |
2.484 *** |
|
(0.005) |
(0.375) |
(0.384) |
(0.797) |
(0.938) |
|
|
Observations |
3934 |
3934 |
1400 |
1246 |
1288 |
|
R-squared |
0.033 |
0.188 |
0.193 |
0.250 |
0.195 |
|
Number of city |
281 |
281 |
100 |
89 |
92 |
|
City/Year FE |
YES |
YES |
YES |
YES |
YES |
|
F-statistic |
126.560 |
105.480 |
38.710 |
47.840 |
35.960 |
Notes: Standard errors are reported in parentheses. ***, **, and * indicate significance at the 1%, 5%, and 10% levels, respectively.
4.3. Robustness Tests
To examine the reliability of the baseline regression results, this study conducts robustness tests from four perspectives: lagging the core explanatory variable, replacing the dependent variable, excluding extreme observations, and adjusting the sample period. The results are reported in Table 5. Column (1) reports the baseline regression result with control variables and serves as the benchmark for comparison.
Column (2) replaces the core explanatory variable with the one-period lagged level of digital economy development to alleviate the potential simultaneity between the digital economy and carbon equity. The result shows that the coefficient of lagged digital economy development is 0.335 and significant at the 1% level, indicating that the positive effect of the digital economy on carbon equity has a certain degree of persistence.
Column (3) replaces the dependent variable. To reduce potential estimation bias arising from the construction of the carbon equity indicator, this study uses an alternative balanced carbon equity index. This index takes the complete consistency between regional carbon emissions and equitable carbon shares as the ideal state and is defined as:
|
```latexCE\_fairness1=\frac{1}{1+\mid CE-1\mid }``` |
The coefficient of the digital economy is 0.056 and significant at the 5% level, suggesting that the baseline conclusion does not depend on a single measurement of carbon equity.
Column (4) re-estimates the model after excluding extreme observations at the top and bottom 1% of the main continuous variables. The coefficient of the digital economy is 0.305 and significant at the 1% level, indicating that outliers do not drive the baseline result. Column (5) restricts the sample period to 2015–2019 to reduce the potential influence of insufficient early-stage digital economy development and the COVID-19 shock on the estimation results. The coefficient of the digital economy is 0.035 and significant at the 5% level. Overall, after considering the lagged effect of the explanatory variable, replacing the measurement of carbon equity, excluding extreme observations, and adjusting the sample period, the effect of the digital economy on urban carbon equity remains significantly positive. These results indicate that the baseline conclusion is robust.
Table 5. Robustness Test Results.
|
(1) |
(2) |
(3) |
(4) |
(5) |
|
|---|---|---|---|---|---|
|
Baseline |
Lagged DE |
Alternative CE |
Excluding Outliers |
Robust_Recent |
|
|
Variables |
CE |
CE |
CE_fairness1 |
CE |
CE |
|
DE |
0.167 *** |
0.056 ** |
0.305 *** |
0.035 ** |
|
|
(0.058) |
(0.022) |
(0.089) |
(0.016) |
||
|
L1_DE |
0.335 *** |
||||
|
(0.088) |
|||||
|
Controls |
Yes |
Yes |
Yes |
Yes |
Yes |
|
Observations |
3934 |
3653 |
3934 |
3775 |
1405 |
|
City/Year FE |
Yes |
Yes |
Yes |
Yes |
Yes |
|
R-squared |
0.188 |
0.203 |
0.020 |
0.197 |
0.250 |
|
Number of city |
281 |
281 |
281 |
279 |
281 |
Notes: Standard errors are reported in parentheses. *** and ** indicate significance at the 1% and 5% levels, respectively.
4.4. Endogeneity Test
Although the baseline regressions control for city fixed effects and year fixed effects, potential endogeneity may still exist between the digital economy and carbon equity. On the one hand, cities with higher levels of carbon equity may have stronger industrial foundations, governance capacity, and infrastructure conditions, which may also facilitate digital economy development and thereby lead to reverse causality. On the other hand, unobservable factors such as low-carbon governance capacity, the innovation environment, and policy implementation capacity may simultaneously affect digital economy development and carbon equity, resulting in omitted-variable bias. To alleviate these concerns, this study employs an instrumental variable approach.
Specifically, this study uses the interaction term between provincial telephone penetration in 1984 and the one-period lagged digital economy index as the instrumental variable and estimates the model using two-stage least squares. The rationale is that regions with better historical communication infrastructure tend to have stronger first-mover advantages in the diffusion of subsequent digital technologies and the construction of digital infrastructure, implying a strong correlation with current digital economy development. Meanwhile, early communication conditions are unlikely to have a direct effect on current urban carbon equity; instead, they are more likely to affect carbon equity indirectly through digital economy development. Therefore, the instrument is theoretically plausible.
Table 6 reports the instrumental variable estimation results. Column (1) presents the baseline regression result with control variables, column (2) reports the first-stage regression result, and column (3) presents the second-stage estimate. The first-stage result shows that the coefficient of the instrumental variable is 0.213 and significant at the 1% level, indicating a strong correlation between the instrument and digital economy development. The second-stage result shows that, after using the instrumental variable approach to address potential endogeneity, the coefficient of the digital economy is 0.708 and significant at the 5% level. This result indicates that the positive effect of the digital economy on urban carbon equity remains valid after accounting for potential endogeneity, further supporting the conclusion that the digital economy improves the alignment between urban carbon-emission responsibility and ecological carrying capacity.
Table 6. Endogeneity Test Results.
|
Variables |
(1) |
(2) |
(3) |
|---|---|---|---|
|
CE |
First-Stage |
IV (2SLS) |
|
|
IV |
0.213 *** |
||
|
(0.027) |
|||
|
DE |
0.167 *** |
0.708 ** |
|
|
(0.058) |
(0.352) |
||
|
Controls |
Yes |
Yes |
Yes |
|
Observations |
3934 |
3653 |
3653 |
|
R-squared |
0.188 |
0.505 |
0.283 |
|
Number of city |
281 |
281 |
281 |
|
City FE |
Yes |
Yes |
Yes |
|
Year FE |
Yes |
Yes |
Yes |
Notes: Standard errors are reported in parentheses. *** and ** indicate significance at the 1% and 5% levels, respectively.
4.5. Mechanism Tests
To further identify the pathways through which the digital economy affects urban carbon equity, this study conducts mechanism tests from three dimensions: industrial structure upgrading, green technological innovation, and market integration. The results are reported in Table 7. Columns (1), (3), and (5) examine the effects of the digital economy on the three mechanism variables, respectively, while columns (2), (4), and (6) further include the corresponding mechanism variables in the carbon equity model.
4.5.1. Industrial Structure Upgrading
As shown in column (1) of Table 7, the coefficient of the digital economy on industrial structure upgrading is 0.237 and significant at the 1% level, indicating that digital economy development significantly promotes industrial structure upgrading. In column (2), the coefficient of industrial structure upgrading is 0.013 and significant at the 5% level, while the coefficient of the digital economy remains positive and significant at the 1% level, with a value of 0.135. Compared with the baseline regression, the coefficient of the digital economy decreases after industrial structure upgrading is included, suggesting that industrial structure upgrading constitutes an important pathway through which the digital economy improves carbon equity.
This finding indicates that the digital economy can facilitate the reallocation of industrial activities from energy-intensive and high-emission sectors toward sectors with higher technological content and lower environmental burdens. By reducing the carbon pressure associated with regional economic activities, this structural adjustment helps improve the alignment between carbon-emission responsibility and ecological carrying capacity. Therefore, H2 is supported.
4.5.2. Green Technological Innovation
Column (3) of Table 7 shows that the coefficient of the digital economy on green technological innovation is 0.086 and significant at the 1% level, suggesting that the digital economy effectively stimulates green technological innovation. In column (4), the coefficient of green technological innovation is 0.058 and significant at the 1% level, while the coefficient of the digital economy remains positive and significant at the 1% level, with a value of 0.141.
This result indicates that the digital economy not only directly improves carbon equity but also exerts an indirect effect by enhancing green technological innovation capacity. Improvements in digital infrastructure and the mobility of data elements can reduce the information and coordination costs of green innovation, accelerate the diffusion and application of energy-saving and carbon-reduction technologies, and thereby strengthen urban low-carbon governance capacity. Through this mechanism, the digital economy contributes to improving carbon equity. Therefore, H3 is supported.
4.5.3. Market Integration
Column (5) of Table 7 shows that the coefficient of the digital economy on market integration is 0.073 and significant at the 1% level, indicating that digital economy development helps reduce regional market segmentation and improve factor mobility and resource allocation efficiency. In column (6), the coefficient of market integration is 0.179 and significant at the 1% level, while the coefficient of the digital economy remains positive and significant at the 1% level, with a value of 0.144.
This result suggests that market integration is another important mechanism through which the digital economy improves carbon equity. As market integration increases, green capital, low-carbon technologies, and environmental governance resources can be allocated more efficiently across a broader spatial scale. This helps alleviate the mismatch between carbon-emission responsibility and ecological carrying capacity across cities. Therefore, H4 is supported.
Table 7. Mechanism Test Results.
|
(1) |
(2) |
(3) |
(4) |
(5) |
(6) |
|
|---|---|---|---|---|---|---|
|
Variables |
Upgrading |
CE |
GT |
CE |
MI |
CE |
|
DE |
0.237 *** |
0.135 *** |
0.086 *** |
0.141 *** |
0.073 *** |
0.144 *** |
|
(0.091) |
(0.035) |
(0.015) |
(0.035) |
(0.013) |
(0.035) |
|
|
Upgrading |
0.013 ** |
|||||
|
(0.006) |
||||||
|
GT |
0.058 *** |
|||||
|
(0.014) |
||||||
|
MI |
0.179 *** |
|||||
|
(0.041) |
||||||
|
Controls |
Yes |
Yes |
Yes |
Yes |
Yes |
Yes |
|
Observations |
3934 |
3934 |
3934 |
3934 |
3934 |
3934 |
|
City/Year FE |
Yes |
Yes |
Yes |
Yes |
Yes |
Yes |
|
R-squared |
0.618 |
0.307 |
0.716 |
0.306 |
0.653 |
0.541 |
|
Number of city |
281 |
281 |
281 |
281 |
281 |
281 |
Notes: Standard errors are reported in parentheses. *** and ** indicate significance at the 1% and 5% levels, respectively.
5. Spatial Spillover Effects of the Digital Economy on Carbon Equity
5.1. Spatial Correlation Test
To examine the spatial dependence of carbon equity, this study first conducts a global spatial autocorrelation test for the carbon equity index (CE) of 281 Chinese cities from 2010 to 2023. The results are reported in Table 8.
As shown in Table 8, the global Moran’s I values for carbon equity are positive in all years during the sample period and significant at the 1% level. This indicates that carbon equity across Chinese cities is not randomly distributed, but exhibits significant positive spatial autocorrelation. Specifically, the global Moran’s I range from 0.093 to 0.127, reaching its maximum value of 0.127 in 2019. From 2010 to 2019, Moran’s I increased from 0.112 to 0.127, suggesting that the spatial clustering of urban carbon equity strengthened during the early part of the sample period. After 2020, Moran’s I declined, falling to 0.093 and 0.096 in 2022 and 2023, respectively, but remained significantly positive. This pattern indicates that the spatial dependence of urban carbon equity gradually shifted from intensified clustering to relative moderation. Overall, these results suggest that neighboring cities are spatially correlated in terms of carbon-emission responsibility, ecological carrying capacity, and low-carbon governance conditions.
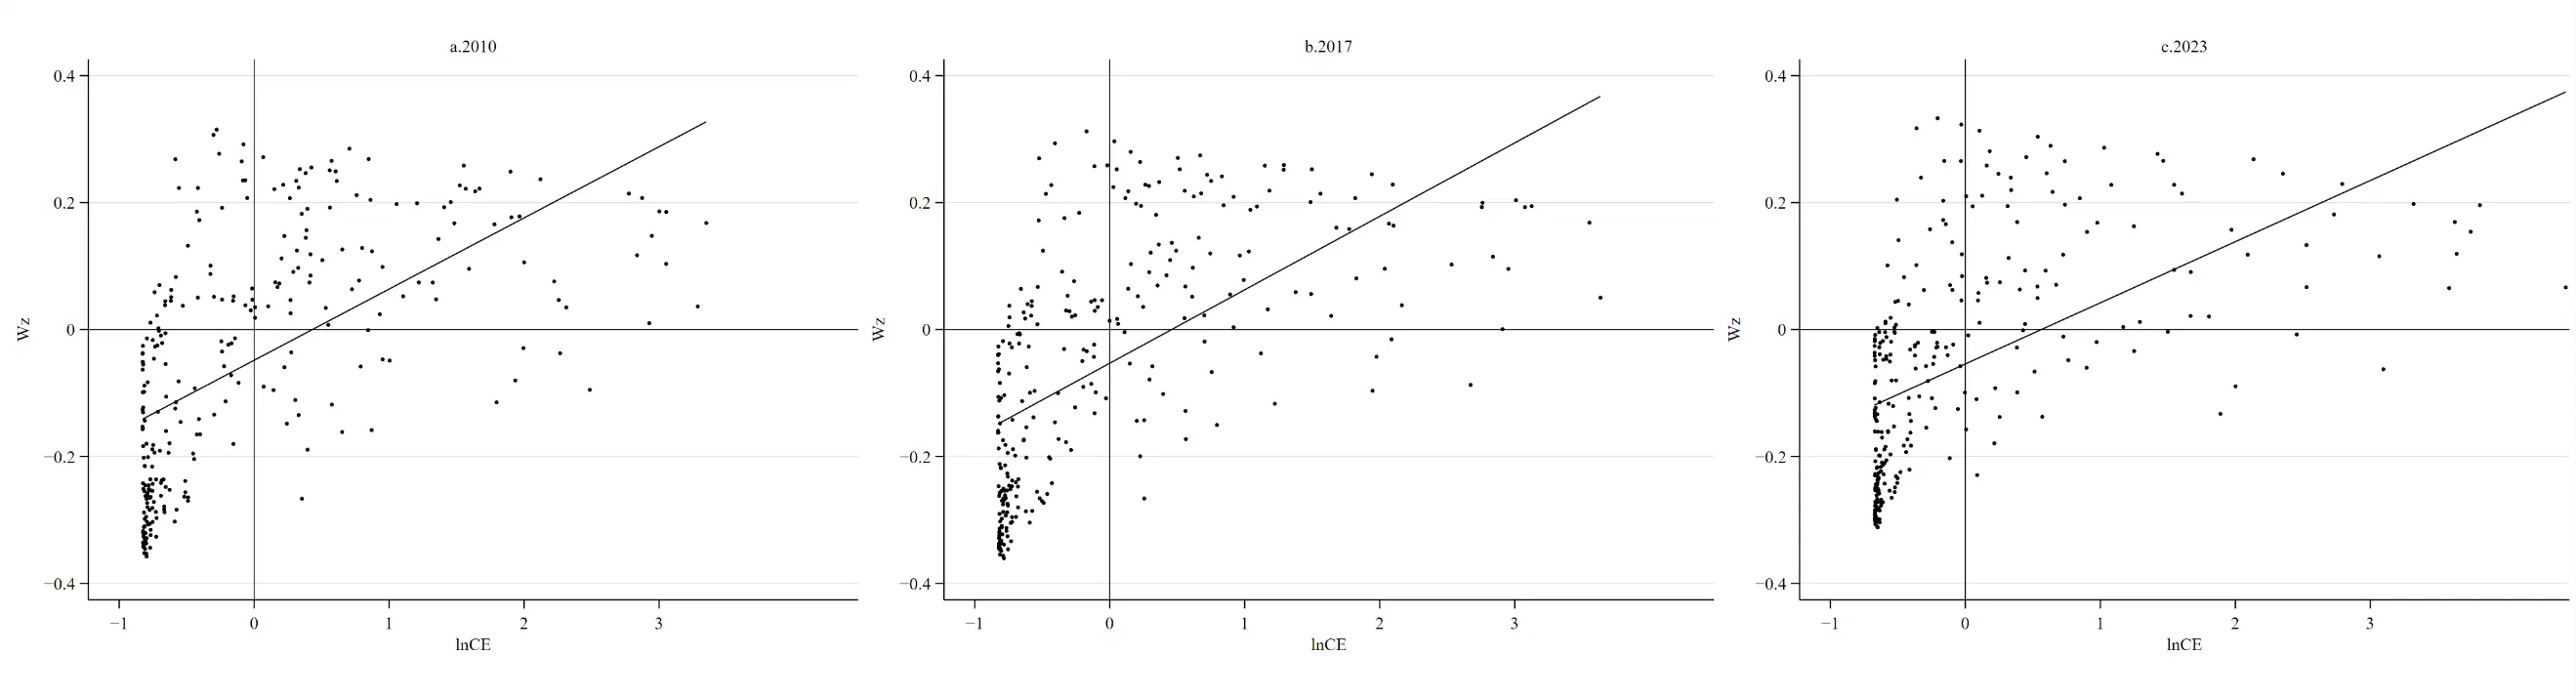
To further identify the local structure of spatial dependence in carbon equity, this study plots local Moran scatterplots for three representative years: 2010, 2017, and 2023. The results are shown in Figure 4. The local Moran scatterplot classifies cities into four types of spatial association: high–high clustering, low–low clustering, high–low differentiation, and low–high differentiation. Figure 4 shows that observations in all three years are mainly distributed in the first and third quadrants, indicating that the local spatial pattern of urban carbon equity is dominated by high–high and low–low clustering. High–high clustering means that cities with high levels of carbon equity tend to be adjacent to cities with similarly high levels, whereas low–low clustering means that cities with low levels of carbon equity are more likely to be surrounded by other low-level cities. This finding is consistent with the global Moran’s I results and further confirms the pronounced spatial clustering of urban carbon equity.
From a dynamic perspective, the spatial clustering pattern of carbon equity had already begun to emerge in 2010, with some cities located in the high–high and low–low quadrants. By 2017, observations became more concentrated in the first and third quadrants, suggesting a strengthening of spatial clustering. By 2023, the scatter distribution became more dispersed than in 2017, which is consistent with the decline in global Moran’s I after 2020. This indicates that the spatial pattern of urban carbon equity experienced a transition from strengthened clustering to marginal moderation during the sample period, although positive spatial correlation persisted throughout.
Table 8. Global Moran’s I of Carbon Equity.
|
Year |
I |
z |
p-Value |
|---|---|---|---|
|
2010 |
0.112 |
22.460 |
0.000 |
|
2011 |
0.108 |
21.810 |
0.000 |
|
2012 |
0.109 |
21.850 |
0.000 |
|
2013 |
0.113 |
22.680 |
0.000 |
|
2014 |
0.112 |
22.410 |
0.000 |
|
2015 |
0.120 |
23.900 |
0.000 |
|
2016 |
0.117 |
23.470 |
0.000 |
|
2017 |
0.116 |
23.160 |
0.000 |
|
2018 |
0.122 |
24.300 |
0.000 |
|
2019 |
0.127 |
25.330 |
0.000 |
|
2020 |
0.118 |
23.590 |
0.000 |
|
2021 |
0.119 |
23.860 |
0.000 |
|
2022 |
0.093 |
18.880 |
0.000 |
|
2023 |
0.096 |
19.490 |
0.000 |
5.2. Spatial Spillover Effect Test
Given the significant global and local spatial dependence of carbon equity identified above, this study employs a spatial Durbin model with city and year fixed effects to examine the spatial effects of the digital economy on carbon equity. By incorporating spatial interaction in both carbon equity and the explanatory variables, the model provides an appropriate framework for distinguishing the local association of digital development from its cross-city spatial influence. The results are reported in Table 9. Column (1) reports the estimated coefficients of the local variables X, while column (2) reports the estimated coefficients of the corresponding spatially lagged variables W×X. The spatial weight matrix is constructed from the inverse of the geographic distance matrix.
The results in Table 9 show that the coefficient of the local digital economy variable is 0.151 and significant at the 1% level, indicating that digital economy development significantly improves local carbon equity. In other words, after accounting for spatial dependence, the positive effect of the digital economy on the alignment between urban carbon-emission responsibility and ecological carrying capacity remains valid. This suggests that the digital economy can improve local carbon equity by enhancing information-identification capacity, increasing the efficiency of resource allocation for low-carbon governance, and improving the conditions for the green transition.
Meanwhile, the coefficient of the spatially lagged digital economy variable is −0.132 and significant at the 10% level, indicating that digital economy development in neighboring cities exerts a certain inhibitory effect on local carbon equity. This result suggests that the effect of the digital economy on carbon equity does not simply take the form of positive cross-regional diffusion, but instead exhibits spatially uneven characteristics. One possible explanation is that the development of the digital economy has a strong resource-agglomeration effect. Digital infrastructure, green technologies, platform resources, and highly skilled labor are more likely to concentrate in cities with stronger digital foundations and larger market sizes. As a result, while the digital economy improves local carbon equity, it may also impose competitive constraints on neighboring cities by weakening their access to low-carbon governance resources and their capacity for industrial green transformation.
Taken together, the spatial Durbin model results reveal a policy-relevant pattern of “local promotion and neighboring suppression”. Digital economy development is positively associated with carbon equity within the focal city, whereas its benefits do not automatically extend to neighboring cities. This pattern suggests that the environmental gains associated with digitalization may remain spatially concentrated when digital infrastructure, green technologies, platform resources, and skilled labor are unevenly distributed across cities.
Table 9. Spatial Spillover Effects of the Digital Economy on Carbon Equity.
|
Variables |
(1) |
(2) |
|---|---|---|
|
X |
W×X |
|
|
DE |
0.151 *** |
−0.132 * |
|
(0.038) |
(0.072) |
|
|
Controls |
Yes |
Yes |
|
Observations |
3934 |
3934 |
|
R-squared |
0.240 |
|
|
sigma_e |
0.087 |
|
|
rho |
0.644 |
|
|
Number of city |
281 |
281 |
|
City/Year FE |
Yes |
Yes |
Notes: Standard errors are reported in parentheses. *** and * indicate significance at the 1% and 10% levels, respectively.
6. Conclusions and Policy Implications
Using panel data for 281 Chinese cities from 2010 to 2023, this study constructs a city-level carbon equity index and employs two-way fixed-effects models to systematically examine the effect of the digital economy on regional carbon equity, its underlying mechanisms, and its spatial spillover effects. The main findings are as follows. First, carbon equity in Chinese cities shows an overall upward trend, although regional disparities and spatial clustering remain pronounced. Second, the digital economy significantly improves urban carbon equity, and this conclusion remains valid after a series of robustness checks and endogeneity tests. Third, the regional heterogeneity analysis shows that the positive effect of the digital economy on carbon equity is strongest in central China, relatively weaker in eastern China, and not yet fully evident in western China. Fourth, the mechanism tests indicate that the digital economy improves carbon equity by promoting industrial structure upgrading, stimulating green technological innovation, and enhancing market integration. Finally, the spatial Durbin model further shows that the digital economy has a significant positive effect on local carbon equity but exerts a certain inhibitory effect on neighboring cities, revealing a spatially uneven pattern characterized by “local promotion and neighboring suppression”.
Based on these findings, this study proposes the following policy implications.
First, differentiated digital economy development strategies should be promoted based on regional development stages and the foundations of low-carbon governance. Eastern China has a relatively strong foundation for digital economy development and should place greater emphasis on the deep application of digital technologies in carbon-emission monitoring, carbon accounting, green manufacturing, and cross-regional governance. Its digital economy development should shift from scale expansion toward quality improvement. In central China, where the marginal effect of the digital economy on carbon equity is more pronounced, policy efforts should rely on industrial relocation and demand for green transition to promote the coordinated development of industrial digitalization and low-carbon transformation. In western China, greater priority should be given to strengthening digital infrastructure, public digital services, and absorptive capacity for green technology, thereby improving the basic conditions for the digital economy to participate in low-carbon governance.
Second, the synergy between the digital economy, industrial green transformation, green technological innovation, and market integration should be strengthened. The empirical results show that the digital economy improves carbon equity through industrial structure upgrading, green technological innovation, and market integration. Therefore, policy efforts should promote digital transformation and low-carbon upgrading in energy-intensive, high-emission industries, enhance energy management, optimize production processes, and improve carbon-emission monitoring capacity. At the same time, incentive mechanisms for green technological innovation should be further strengthened to facilitate the effective interregional flow of low-carbon technologies, green capital, and environmental governance resources, thereby enhancing the digital economy’s role in advancing carbon equity.
Third, cross-regional digital low-carbon governance mechanisms should be improved to address the spatially uneven effects of the digital economy on carbon equity. The finding of “local promotion and neighboring suppression” suggests that the digital dividends generated by the digital economy do not automatically translate into shared regional benefits. Therefore, spatial units such as urban agglomerations, metropolitan areas, and key river basins should be used as platforms to promote cross-regional environmental information sharing, coordination of carbon-emission monitoring standards, and the joint development of data factor markets and carbon markets. These measures can help reduce interregional gaps in digital resource allocation and in low-carbon governance capacity, preventing the digital economy’s development from further reinforcing the spatial differentiation of carbon equity.
This study has three limitations. First, the measurement of carbon equity mainly focuses on the alignment between carbon-emission responsibility and carbon-sink capacity, while broader dimensions such as interpersonal equity, intergenerational equity, and consumption-based carbon responsibility are not fully incorporated. Second, this study identifies the effect of the digital economy on carbon equity mainly at the city level, while the micro-level mechanisms related to firm low-carbon transition [50], industrial chain adjustment, and cross-regional factor mobility require further investigation. Third, owing to the availability of consistent long-term city-level data, the digital economy index primarily captures Internet development and digital financial inclusion. Other potentially relevant dimensions are not directly incorporated. Future research may combine firm-level data, industrial chain network data, more comprehensive measures of digital development, and multiple spatial weight matrices to further identify the boundary conditions and implementation mechanisms through which the digital economy affects carbon equity.
Statement of the Use of Generative AI and AI-Assisted Technologies in the Writing Process
During the preparation of this manuscript, the authors used ChatGPT to improve the language quality, grammar, readability, and clarity of expression. After using this tool, the authors carefully reviewed and edited the content as needed and take full responsibility for the content of the published article.
Acknowledgments
The authors wish to thank all who assisted in conducting this work.
Author Contributions
Conceptualization, J.G. and J.T.; methodology, J.G.; software, J.G.; validation, J.G. and J.T.; formal analysis, J.G.; investigation, J.G.; resources, J.G. and J.T.; data curation, J.G.; writing—original draft preparation, J.T.; writing—review and editing, J.G. and J.T.; visualization, J.G.; supervision, J.T.; project administration, J.T. All authors have read and agreed to the published version of the manuscript.
Ethics Statement
Not applicable.
Informed Consent Statement
Not applicable.
Data Availability Statement
The data are available from the corresponding author upon reasonable request.
Funding
This research was funded by the National Natural Science Foundation of China through the project “Nudge Mechanisms and Policy Design for Enhancing the Agency and Subjective Value of Relatively Poor Rural Populations” (grant number 72274029); the Humanities and Social Sciences Planning Fund of the Ministry of Education of China through the project “Overcoming and Reconstructing the Paradox of Organizational Identity Inertia during the Digital Transformation of Producer-Service Enterprises” (grant number 24YJA630022); and the National Social Science Fund of China through the key project “Strategies for Enhancing Industrial-Chain Resilience and Security in Major Grain-Producing Areas under Decoupling Risks” (grant number 24AGL006).
Declaration of Competing Interest
The authors declare that they have no known competing financial interests or personal relationships that could have appeared to influence the work reported in this paper.
References
- Lin BQ, Teng YQ. The association of new quality productive forces with carbon peak/neutrality goals and challenges to be resolved: A perspective on low-carbon energy transition. J. Sichuan Univ. (Philos. Soc. Sci. Ed.) 2024, (5), 35–46. Available online: https://wkxb.scu.edu.cn/zh/article/77642363/ (accessed on 23 June 2026).
- Markard J. The next phase of the energy transition and its implications for research and policy. Nat. Energy 2018, 3, 628–633. DOI:10.1038/s41560-018-0171-7 [Google Scholar]
- Wang W, Kong X. Provincial carbon quota allocation in China under the 2030 carbon peaking target. J. Quant. Technol. Econ. 2022, 39, 113–132. DOI:10.13653/j.cnki.jqte.2022.07.002 [Google Scholar]
- Carley S, Konisky DM. The justice and equity implications of the clean energy transition. Nat. Energy 2020, 5, 569–577. DOI:10.1038/s41560-020-0641-6 [Google Scholar]
- He WJ, Zhang B. A comparative analysis of Chinese provincial carbon dioxide emissions allowance allocation schemes in 2030: An egalitarian perspective. Sci. Total Environ. 2021, 765, 142705. DOI:10.1016/j.scitotenv.2020.142705 [Google Scholar]
- Zou XQ, Zheng ZL, Gu JW, Zhang Y. Interprovincial carbon emission rights allocation in China under a sustainable framework: Based on the 2030 dual-control carbon reduction target. China Popul. Resour. Environ. 2025, 35, 50–65. Available online: https://www.cprepublishing.cn/thesisDetails#10.12062/cpre.20241005&lang=zh (accessed on 23 June 2026).
- Cui J, Wang C, Zhang J, Zheng Y. The effectiveness of China’s regional carbon market pilots in reducing firm emissions. Proc. Natl. Acad. Sci. USA 2021, 118, e2109912118. DOI:10.1073/pnas.2109912118 [Google Scholar]
- Zhou CY, Wang Z, Zheng Y, Zhang Z, Wu YQ. Spatial differentiation of carbon quotas in county-level “collaborative carbon governance alliances” from the perspective of rescaling: Evidence from carbon reduction potential in Zhejiang Province. Geogr. Res. 2023, 42, 1545–1559. Available online: https://www.dlyj.ac.cn/CN/10.11821/dlyj020220833 (accessed on 23 June 2026).
- Jiang XJ. Order reconstruction and governance cooperation in the digital-intelligent era: The dual goals of rationality and acceptability. Manag. World 2025, 41, 1–14, 58. Available online: https://glsj.cbpt.cnki.net/WKB2/WebPublication/paperDigest.aspx?paperID=8ef0a619-0f4b-475e-9c32-dcc03b788126 (accessed on 23 June 2026).
- Xie D, Wei W, Li Y. Data and computing power economy: A general equilibrium theory of the digital economy. Manag. World 2026, 42, 37–56, 77. DOI:10.19744/j.cnki.11-1235/f.2026.0033 [Google Scholar]
- Venmans F, Ellis J, Nachtigall D. Carbon pricing and competitiveness: Are they at odds? Clim. Policy 2020, 20, 1070–1091. DOI:10.1080/14693062.2020.1805291 [Google Scholar]
- Ma S, Chen Y, Zhang H. Industrial digitalization and production globalization: From the perspective of the geographical distribution of value added. Manag. World 2024, 40, 1–23. DOI:10.19744/j.cnki.11-1235/f.2024.0129 [Google Scholar]
- Zhang S, Wang Y, Hao Y, Liu Z. Shooting two hawks with one arrow: Could China’s emission trading scheme promote green development efficiency and regional carbon equality? Energy Econ. 2021, 101, 105412. DOI:10.1016/j.eneco.2021.105412 [Google Scholar]
- Pandey B, Brelsford C, Seto KC. Infrastructure inequality is a characteristic of urbanization. Proc. Natl. Acad. Sci. USA 2022, 119, e2119890119. DOI:10.1073/pnas.2119890119 [Google Scholar]
- Chen ZF, Zhang X, Chen FL. Do carbon emission trading schemes stimulate green innovation in enterprises? Evidence from China. Technol. Forecast. Soc. Change 2021, 168, 120744. DOI:10.1016/j.techfore.2021.120744 [Google Scholar]
- Wei L, Hou Y. The impact of the digital economy on urban green development in China. J. Quant. Technol. Econ. 2022, 39, 60–79. DOI:10.13653/j.cnki.jqte.2022.08.005 [Google Scholar]
- Zhang Y, Huang H. The impact of digital economy development on carbon emission inequality. Resour. Sci. 2023, 45, 1223–1238. DOI:10.18402/resci.2023.06.10 [Google Scholar]
- Deng R, Zhang A. The impact and mechanism of digital economy development on environmental pollution in Chinese cities. South China J. Econ. 2022, 2, 18–37. DOI:10.19592/j.cnki.scje.390724 [Google Scholar]
- Sun CW, Chen ZL, Sun BW. Carbon emissions trading system, industrial green transformation, and externalities. Econ. Res. J. 2025, 60, 134–151. Available online: https://erj.ajcass.com/#/issue?id=121029&year=2025&issue=6 (accessed on 23 June 2026).
- Wang CY, Li JY. Does the digital economy effectively promote energy conservation and carbon emission reduction? China Popul. Resour. Environ. 2022, 32, 83–95. Available online: https://www.cprepublishing.cn/thesisDetails#10.12062/cpre.20221022&lang=zh (accessed on 23 June 2026).
- Wang S, Teng T, Hu S, Li W. Evolution and driving factors of the spatial network structure of China’s digital economy. Sci. Geogr. Sin. 2024, 44, 743–753. Available online: http://geoscien.neigae.ac.cn/CN/10.13249/j.cnki.sgs.20230132 (accessed on 23 June 2026).
- Xu WX, Zhou JP, Liu CJ. Spatial effects of digital economy development on urban carbon emissions. Geogr. Res. 2022, 41, 111–129. Available online: https://www.dlyj.ac.cn/CN/10.11821/dlyj020210459 (accessed on 23 June 2026).
- Zheng YM, Lv Q, Wang YD. Economic development, technological progress, and provincial carbon emissions intensity: Empirical research based on the threshold panel model. Appl. Econ. 2022, 54, 3495–3504. DOI:10.1080/00036846.2021.2009760 [Google Scholar]
- Guo Y, Ye Y, Wang C, Liu Z, Lu Q. Spatial transfer of carbon emissions from data centers in China under the “Eastern Data and Western Computing” strategy. Sci. Geogr. Sin. 2025, 45, 459–471. DOI:10.13249/j.cnki.sgs.20230568 [Google Scholar]
- Wang Y, Dong H. Mechanisms and spillover effects of the digital economy on urban carbon emission performance. Sci. Geogr. Sin. 2025, 45, 506–517. DOI:10.13249/j.cnki.sgs.20230649 [Google Scholar]
- Chen ZM, Chen ZH, Ma JH. Fossil energy rebound effects and the regulation of carbon emissions trading policy: From the perspective of endogenous adjustments of production networks. Econ. Res. J. 2025, 60, 191–214. Available online: https://erj.ajcass.com/#/issue?id=122004&year=2025&issue=11 (accessed on 23 June 2026).
- Lin BQ, Zhao HS. Global climate games and “unconventional” trade frictions against the background of energy security and low-carbon transition. J. Xiamen Univ. (Arts Soc. Sci.) 2025, 75, 114–122. Available online: http://61.181.120.82:8080/kcms/detail/detail.aspx?filename=XMDS202501010&dbcode=CJFD&dbname=CJFD2025 (accessed on 23 June 2026).
- Zhu J, Fan Y, Deng X, Xue L. Low-carbon innovation induced by emissions trading in China. Nat. Commun. 2019, 10, 4088. DOI:10.1038/s41467-019-12213-6 [Google Scholar]
- Yu BB, Liu XJ. Digital technology reshaping the geographical pattern of enterprises: From the perspective of capital structure optimization and skill structure reshaping. Econ. Res. J. 2026, 61, 167–189. Available online: https://erj.ajcass.com/#/issue?id=122552&year=2026&issue=2 (accessed on 23 June 2026).
- Yang G, Wang H, Fan H, Yue Z. The carbon emission reduction effect of the digital economy: Theoretical analysis and empirical evidence. China Ind. Econ. 2023, 5, 80–98. DOI:10.19581/j.cnki.ciejournal.2023.05.005 [Google Scholar]
- Creutzig F, Roy J, Lamb WF, Azevedo IML, Bruine de Bruin W, Dalkmann H, et al. Towards demand-side solutions for mitigating climate change. Nat. Clim. Change 2018, 8, 260–263. DOI:10.1038/s41558-018-0121-1 [Google Scholar]
- Liao X, Shen Y. Impact mechanism and effects of the digital economy on low-carbon urban transition in China. Econ. Geogr. 2024, 44, 31–41. [Google Scholar]
- Shi W, Ma H. Digital technology embeddedness, grassroots governance evolution, and community building: A case study of the national intelligent social governance experimental base in County P. Manag. World 2026, 42, 125–143. DOI:10.19744/j.cnki.11-1235/f.2026.0001 [Google Scholar]
- Padilla E, Serrano A. Inequality in CO2 emissions across countries and its relationship with income inequality: A distributive approach. Energy Policy 2006, 34, 1762–1772. DOI:10.1016/j.enpol.2004.12.014 [Google Scholar]
- Aghion P, Dechezleprêtre A, Hémous D, Martin R, Van Reenen J. Carbon taxes, path dependency, and directed technical change: Evidence from the auto industry. J. Political Econ. 2016, 124, 1–51. DOI:10.1086/684581 [Google Scholar]
- Pudjianto D, Ameli H, Giannelos S. Holistic evaluation of the roles and values of electrolysers in a net-zero energy system. IET Conf. Proc. 2025, 2025, 432–440. DOI:10.1049/icp.2025.3872 [Google Scholar]
- Wei LL, Hou YQ, Cao HY. Urban carbon emission performance in China: Dynamic decomposition, spatial differences, and influencing factors. Stat. Inf. Forum 2024, 39, 69–83. Available online: https://tjlt.cbpt.cnki.net/portal/journal/portal/client/paper/ed5ffbd67295313a842215963c7fa6ce (accessed on 23 June 2026).
- Sun Y, Liu H. Spatiotemporal co-evolution and influencing factors of green development and common prosperity in the Yangtze River Delta region. Econ. Geogr. 2025, 45, 23–35. DOI:10.15957/j.cnki.jjdl.2025.11.003 [Google Scholar]
- Dechezleprêtre A, Gennaioli C, Martin R, Muûls M, Stoerk T. Searching for carbon leaks in multinational companies. J. Environ. Econ. Manag. 2022, 112, 102601. DOI:10.1016/j.jeem.2021.102601 [Google Scholar]
- Goldfarb A, Tucker C. Digital economics. J. Econ. Lit. 2019, 57, 3–43. DOI:10.1257/jel.20171452 [Google Scholar]
- Zeng Y, Ren S, Zhuang R. Formation, structure, and evolution of the industrial digital finance ecosystem. Manag. World 2026, 42, 73–93. DOI:10.19744/j.cnki.11-1235/f.2026.0018 [Google Scholar]
- Zhang C, Cui S, Zhu Z, Zhang H. Impact and mechanism of market integration on regional energy efficiency. Resour. Sci. 2023, 45, 1208–1222. DOI:10.18402/resci.2023.06.09 [Google Scholar]
- Fang J, Yang Y, Ma W, Maimaiti A, Shen H. Carbon pools and changes in grassland ecosystems in China. Sci. Sin. Vitae 2010, 40, 566–576. DOI:10.1360/zc2010-40-7-566 [Google Scholar]
- Fang J, Yu G, Ren X, Liu G, Zhao X. Carbon sequestration in China’s terrestrial ecosystems: Progress of the ecosystem carbon sequestration task group under the Strategic Priority Research Program of the Chinese Academy of Sciences on carbon budget certification and related issues in response to climate change. Bull. Chin. Acad. Sci. 2015, 30, 848–857, 875. DOI:10.16418/j.issn.1000-3045.2015.06.019 [Google Scholar]
- Fang JY, Guo ZD, Piao SL, Chen AP. Terrestrial vegetation carbon sinks in China, 1981–2000. Sci. China Ser. D Earth Sci. 2007, 50, 1341–1350. DOI: 10.1007/s11430-007-0049-1. [Google Scholar]
- Zhao T, Zhang Z, Liang S. Digital economy, entrepreneurial activity, and high-quality development: Empirical evidence from Chinese cities. Manag. World 2020, 36, 65–76. DOI:10.19744/j.cnki.11-1235/f.2020.0154 [Google Scholar]
- Guo F, Wang J, Wang F, Kong T, Zhang X, Cheng Z. Measuring China’s digital financial inclusion: Index compilation and spatial characteristics. China Econ. Q. 2020, 19, 1401–1418. DOI:10.13821/j.cnki.ceq.2020.03.12 [Google Scholar]
- Liu J, Yang Y, Zhang S. Measurement and driving factors of China’s digital economy. Shanghai J. Econ. 2020, 6, 81–96. DOI:10.19626/j.cnki.cn31-1163/f.2020.06.008 [Google Scholar]
- Amann G, Escobedo Bermúdez VR, Boskov-Kovacs E, Gallego Amores S, Giannelos S, Iliceto A, et al. E-Mobility Deployment and Impact on Grids: Impact of Electric Vehicle and Charging Infrastructure on European Transmission and Distribution Grids: Innovation Needs; Publications Office of the European Union: Luxembourg, 2022. DOI:10.2833/937755 [Google Scholar]
- Giannelos S, Konstantelos I, Strbac G. A new class of planning models for option valuation of storage technologies under decision-dependent innovation uncertainty. In Proceedings of the 2017 IEEE Manchester PowerTech, Manchester, UK, 18–22 June 2017; pp. 1–6. DOI:10.1109/PTC.2017.7979750 [Google Scholar]