
The Threshold Effect and Mechanism of Environmental Tax Driving Agricultural Innovation and Productivity Development

The Threshold Effect and Mechanism of Environmental Tax Driving Agricultural Innovation and Productivity Development
Ziyi Zhang
Yan Gao
*
Shi Yin
*

Received: 20 March 2026 Revised: 09 June 2026 Accepted: 14 July 2026 Published: 24 July 2026

© 2026 The authors. This is an open access article under the Creative Commons Attribution 4.0 International License (https://creativecommons.org/licenses/by/4.0/).
1. Introduction
China is an agricultural powerhouse, but its agricultural development is facing multiple pressures. Whether in crop or livestock farming, the production process releases gaseous and solid pollutants, including fertilizers, pesticides, hormones, agricultural plastic films, greenhouse gases generated during the use of agricultural machinery, and pollution from livestock carcasses and manure. These are all significant sources of environmental pollution. Additionally, China is the only major fishing nation in the world where the total output of aquaculture exceeds that of wild capture fisheries, and aquaculture has caused severe water pollution. According to data from China’s “Second National Pollutant Source Census Bulletin”, among agricultural water pollutants, chemical oxygen demand (COD) accounts for 10.6713 million tons, ammonia nitrogen 216,200 tons, total nitrogen 1.4149 million tons, and total phosphorus 212,000 tons, respectively accounting for 49.77%, 22.44%, 46.52%, and 67.22% of national water pollutant emissions, respectively [1]. The root causes include the excessive use of fertilizers, pesticides, and agricultural films, which not only pollute the air, soil, and water sources but also hinder the application of efficient agricultural technologies and the production of high-value-added agricultural products. The discharge of livestock and poultry manure and over-farming lead to water and soil eutrophication and other forms of pollution, further exacerbating the deterioration of the agricultural ecological environment. These factors collectively constrain the sustainable development of agriculture. In addition, China’s agricultural industry layout is showing a trend toward intensification and is facing new challenges, such as the cultivation and development of agricultural production and management entities and changes in agricultural labor demand. Traditional labor-intensive agriculture is gradually shifting toward technology-intensive agriculture, and the overall effectiveness of agricultural science and technology innovation needs further improvement [2]. Developing agricultural innovation productivity is therefore particularly important. Agricultural innovation productivity refers to the continuous updating and optimization of the three elements of agricultural laborers, agricultural labor resources, and agricultural labor objects, as well as their combination methods, through scientific and technological innovation and digital transformation. This aims to fundamentally transform agricultural production methods, promote the transition of agriculture from a resource-intensive model to a resource-efficient one, and achieve green transformation and high-quality development in the agricultural sector. However, agricultural innovation productivity has a strong public good attribute. Combined with the diversity and weakness of innovation entities, this makes it difficult to establish effective interest linkage mechanisms among various entities, resulting in slow improvements in innovation efficiency and hindering the development of green agriculture. How to effectively enhance agricultural innovation productivity to promote green and high-quality agricultural development is the issue this paper aims to explore. Porter et al. (1996) noted that appropriate environmental regulations can stimulate green technological innovation [3]. However, the response of productivity to environmental regulations is complex and controversial, depending on the classification of regulations, their stage of development, and the field of study [4]. The standard neoclassical paradigm suggests that strict emission standards and restrictions may lead to producers being unable to afford the high costs of pollution control, thereby affecting resource allocation [5]. The high costs of pollution control may also exert a “negative incentive” on corporate innovation, inhibiting both the quantity and quality of economic growth and suppressing the development of agricultural innovation productivity [6]. The “Porter Hypothesis” (PH) posits that stricter but well-designed environmental regulations can drive technological innovation, thereby enhancing competitiveness [7]. Among environmental regulatory measures, environmental taxes are designed by the government based on the “polluter pays” principle, utilizing fiscal and tax measures to implement macroeconomic regulation on polluting entities. It can provide economic entities with space for choice and action while also enhancing their enthusiasm for innovation in pollution reduction and emissions reduction technologies [8]. In the strict legal sense, China’s Environmental Protection Tax Law came into force in 2018, transforming the earlier pollution-discharge-fee system into a tax system.
However, most studies focus on industrial firms, green total factor productivity, or carbon emission reduction, while the specific relationship between environmental tax and agricultural innovation productivity remains underexplored. In particular, little is known about whether environmental taxes improve AIP through agricultural carbon emissions reduction, whether upgrading the agricultural industrial structure strengthens this relationship, and whether the effect changes after carbon emissions cross a threshold.
Compared with the existing literature, the marginal contribution of this study is threefold. First, it constructs an evaluation framework for agricultural innovation productivity from the perspectives of agricultural laborers, labor objects, material means of production, and intangible means of production, thereby extending the outcome variable from conventional agricultural output or green productivity to innovation-oriented productivity. Second, it identifies the mechanism through which environmental taxes affect agricultural innovation productivity by incorporating agricultural carbon emissions as a mediating variable and agricultural industrial structure upgrading as a moderating variable. Third, it further examines regional heterogeneity and the threshold effect of agricultural carbon emissions, which helps explain when and where environmental taxes can more effectively promote agricultural innovation productivity.
The remainder of this paper is organized as follows: Section 2 reviews the relevant literature, Section 3 raises questions based on theoretical analysis, Section 4 constructs a model and outlines the data sources, Section 5 discusses the model results with a focus on the implications, and finally, Section 6 summarizes the results and proposes corresponding policy recommendations.
2. Literature Review
2.1. Definition of Agricultural Innovation Productivity
Revolutionary technological breakthroughs, innovative allocation of production factors, and deep-seated industrial transformation and upgrading drive innovative productivity. Its core essence lies in the leap-forward development of workers, means of production, objects of labor, and their optimized combination, with a significant increase in total factor productivity as the key indicator. Based on the definition of the essence of agricultural innovative productivity, some scholars have measured its development level, calculating it from the aspects of “high-quality” agricultural workers, “new medium” agricultural means of production, and “new material” agricultural objects of labor [9]. First, from the perspective of laborers, new-type laborers with higher cultural literacy, advanced agricultural technical skills, outstanding agricultural management wisdom, and refined agricultural management capabilities are the most dynamic factor driving agricultural innovation and productivity. The essence of agricultural innovation-driven development is talent-driven development. Second, from the perspective of labor tools, Marx wrote in Capital that “in the labor tools themselves, mechanical labor tools reveal the decisive characteristics of a social production era far more than labor tools that merely serve as containers for labor objects” [10]. It is evident that production tools are an important indicator of a society’s level of productive capacity. More intelligent, efficient, low-carbon, and safe labor tools are the driving force behind agricultural innovation and productivity. Finally, from the perspective of the object of labor, a more diverse and abundant range of labor objects serves as the material foundation for agricultural innovation and productivity [11], as without such objects, neither laborers nor labor tools can fulfill their functions. The widespread application of scientific and technological innovation in the agricultural sector has led to a greater diversity and plurality of new forms and types of labor objects. Building on traditional labor objects, these include newly discovered natural objects resulting from technological progress, raw materials infused with more technical elements, and non-material objects such as data. Through the efficient synergy of agricultural elements such as labor, knowledge, technology, management, data, and capital, the agricultural and rural sectors can unleash stronger productive capacity, thereby significantly improving resource allocation efficiency and agricultural productivity [11]. Mainstream measurement methods for agricultural productivity include total factor productivity, DEA and SBM efficiency models, green total factor productivity, and composite-index approaches. Because this paper focuses on the multidimensional connotation of agricultural innovation productivity rather than only input-output efficiency, it adopts the entropy method to build a comprehensive index. This method is suitable for integrating heterogeneous indicators and assigning weights according to information variation, thereby reducing the subjectivity that may arise in a purely judgment-based weighting system.
2.2. Agricultural Innovation Productivity, and Environmental Tax
The development of agricultural innovation productivity cannot be separated from effective environmental regulation. Environmental tax, as a market-based regulatory instrument, changes the cost–benefit structure of agricultural producers and guides them to reduce pollution emissions, improve resource-use efficiency, and adopt cleaner production technologies. However, the productivity effect of environmental tax is not theoretically uniform. Existing studies can be organized into three strands: the inhibition effect, the promotion effect, and the nonlinear effect.
First, the inhibition-effect view emphasizes that environmental taxes and related environmental regulations may increase compliance costs and reduce agricultural productivity in the short run. This view argues that when producers face higher environmental costs, part of their production and investment resources may be shifted from productive activities to pollution control, thereby weakening output growth and innovation investment. Bourne et al. examined the effects of environmental regulation on CO2 emissions in Spanish agriculture and found that such policies may reduce agricultural output, increase agricultural product prices, and lower farmers’ income [12]. Meng analyzed the introduction of a carbon tax in Australian agriculture and showed that although the policy reduced emissions [13], its costs could spread to other sectors and lead to declines in output, employment, and income. Mackenzie et al. studied pig farming systems and found that fees targeting specific emissions may increase the overall environmental burden of animal production, suggesting that poorly designed tax instruments may generate unintended environmental and production consequences [14]. Mardones and Lipski assessed agricultural CO2-equivalent emission taxes and concluded that such taxes may reduce agricultural competitiveness and output without necessarily achieving significant emission reductions. These studies suggest that when agricultural producers have weak technological capacity, limited financial resources, or insufficient policy support [15], environmental taxes may operate primarily through the compliance-cost channel and exert a suppressive effect on agricultural production and innovation.
Second, the promotion-effect view argues that properly designed environmental regulation can stimulate technological innovation and productivity improvement through an innovation-compensation mechanism. Huang et al. found that environmental regulation can influence agricultural green growth by stimulating innovation and improving productivity, providing direct evidence linking environmental regulation to agricultural innovation and productivity [16]. Säll and Gren evaluated Sweden’s environmental tax on meat and dairy consumption and found that it reduced greenhouse gas, nitrogen, ammonia, and phosphorus emissions from livestock farming [17]. Indicating that tax-based instruments can guide producers and consumers toward environmentally friendly adjustment. Lin et al. showed that the greening of the tax system can affect corporate environmental, social, and governance performance, suggesting that tax incentives may reshape producer behavior through institutional pressure and green strategic responses [18]. Shi et al. demonstrated that environmental regulation can influence pollution reduction and carbon-reduction synergies, indicating that environmental policy may generate broader coordinated benefits beyond single pollution-control outcomes [19]. From this perspective, environmental tax can internalize pollution costs, encourage the adoption of cleaner technologies, improve factor allocation efficiency, and create favorable conditions for the development of agricultural innovation productivity [20].
Third, the nonlinear-effect view suggests that the impact of environmental tax and environmental regulation may vary across development stages, policy intensities, regional conditions, and production structures. Suchkov et al. proposed a linear programming framework for transforming policy objectives into sustainability requirements, showing that the effectiveness of agricultural environmental policy depends on how policy goals are translated into production constraints and development strategies [21]. Rahman et al. analyzed the links among climate, production environment, socioeconomic factors, and global agricultural productivity, indicating that productivity change is shaped by multiple interacting conditions rather than by a single policy factor [22]. Wang et al. examined the coordination between agricultural production and environmental protection in Kazakhstan and highlighted the importance of balancing environmental governance with agricultural production management [23]. Bokusheva et al. analyzed Swiss farm productivity during environmental policy reforms and found that environmental compliance subsidies significantly affected the productivity of inputs such as land, labor, and fertilizers, suggesting that policy effects may depend on input structure and institutional arrangements [24]. These studies imply that the effect of environmental tax may be nonlinear and conditional: under some circumstances, it may create cost pressure, whereas under other circumstances, it may stimulate innovation, improve resource allocation, and enhance productivity [25].
2.3. Research Gaps and Marginal Contribution
The literature review indicates three gaps. First, the concept and measurement of agricultural innovation productivity have not been sufficiently connected with environmental tax policy. Second, the literature has not fully reconciled the compliance-cost, Porter-hypothesis, and nonlinear perspectives in the agricultural sector. Third, empirical studies often examine either average effects or emission effects, while paying less attention to mediating, moderating, heterogeneous, and threshold mechanisms. By addressing these gaps, this paper provides a more targeted theoretical and empirical contribution to the study of agricultural green transformation.
3. Theoretical Analysis and Research Hypotheses
3.1. The Impact of Environmental Taxes on Agricultural Innovation Productivity
There is a debate between the “inhibition theory” and the “promotion theory” regarding the emissions reduction effects of environmental regulations [26]. In the short term, environmental regulations have a “compliance cost” effect, meaning that they increase costs, displace productive investments, and reduce innovative inputs, thereby hindering green development [27], and generate a “green paradox” effect. The “green paradox” was first proposed by SINN, referring to the phenomenon where unreasonable environmental regulation policies exacerbate carbon emissions [28]. Environmental regulations exhibit an “innovation compensation” effect in the long term, where appropriate environmental regulations can stimulate innovation activities, offset the negative effects of “compliance costs”, and promote the innovation of green and low-carbon technologies [29]. In the agricultural sector, environmental taxes also follow this theoretical logic. Environmental taxes, through the collection of pollution fees and environmental taxes, send signals for resource allocation, guiding agricultural resources toward environmentally friendly and efficient production, and stimulating the adoption of green innovation technologies in agriculture. Under such regulations, agricultural product processing enterprises and large-scale livestock farmers that adopt green, environmentally friendly technologies may face significant initial investments, including the purchase of intelligent precision irrigation equipment, organic fertilizer production facilities, and manure resource utilization systems. However, in the long term, these investments can reduce water waste, lower soil pollution remediation costs, and enable enterprises to obtain price premiums for producing high-quality agricultural products, thereby driving the updating and iteration of agricultural production technologies [30]. Environmental taxes not only help reduce environmental pollution but also incentivize entrepreneurs to develop new technologies, thereby driving the development of green innovation. In the long run, environmental taxes act as a catalyst, prompting companies to recognize that green transformation is more advantageous than incurring such costs. In particular, due to the punitive nature of environmental taxes, it is theoretically expected that high-polluting enterprises will seek to develop green energy in the long term, while high-energy-consuming enterprises will increasingly utilize renewable energy [31]. Attracting agricultural product production and processing enterprises to increase investment in research and development (R&D) programs to promote the development of agricultural innovation productivity. Additionally, Li Y, and Liu W. (2023) point out that environmental regulations can generate a “demonstration learning effect”, meaning that when one region increases the intensity of environmental regulations, other regions follow suit, which promotes technological spillovers and knowledge spillovers in the agricultural sector, thereby forming a virtuous cycle of collaborative carbon emissions governance [32]. Regional differences in environmental taxes influence technological innovation and productivity [33]. Different regions, different economic entities, and different types of agricultural industries exhibit significant differences in agricultural productivity development when faced with environmental taxes. Developed regions have accumulated substantial financial reserves, enabling them to easily provide financial support for agricultural enterprises to purchase advanced intelligent agricultural equipment and environmental protection facilities, thereby promoting the development of agricultural innovative productivity. Regions with large-scale livestock and poultry farming and concentrated waste disposal face significant environmental regulatory pressures, which will compel large-scale farms to invest resources in research and development of manure resource utilization technologies and facility construction, driving industrial green upgrading and enhancing agricultural innovative productivity. Based on this, the following hypotheses are proposed.
Hypothesis H1a (H1a). Environmental taxes have a significant promotional effect on the development of agricultural innovative productivity.
Hypothesis H1b (H1b). Environmental taxes exhibit regional heterogeneity in their impact on the development of agricultural innovative productivity.
3.2. Driving Agricultural Innovation Productivity by Reducing Agricultural Carbon Emissions
Agricultural carbon emissions primarily stem from greenhouse gas emissions generated by human agricultural production activities [34]. Inefficient agricultural development models and smallholder farming systems are the direct causes of China’s high agricultural carbon emissions [35]. Extensive production methods have led to a continuous increase in greenhouse gas emissions. The “positive incentive” effect of environmental taxes has suppressed agricultural carbon emissions. Tian et al. (2021) pointed out that subsidy policies have been used to suppress agricultural carbon emissions. The government has provided subsidies for the purchase of green agricultural machinery, encouraging farmers to shift away from the use of polluting inputs and increase the use of green and low-carbon agricultural machinery [36]. High-carbon agricultural production methods often come with inefficient resource use and environmental damage, which hinder the development of agricultural innovation productivity. Adopting low-carbon agricultural technologies and models, such as precision fertilization, conservation tillage, and comprehensive utilization of livestock manure, can improve agricultural resource efficiency, protect the agricultural ecological environment, enhance the service functions of agricultural ecosystems, and foster agricultural innovation productivity [37]. Based on this, the following hypotheses are proposed in this paper.
Hypothesis 2 (H2). Environmental taxes drive agricultural innovation and productivity growth by curbing agricultural carbon emissions.
3.3. The Regulatory Effect of Agricultural Industrial Structure Upgrading
According to the “Porter Hypothesis”, reasonable environmental regulations can achieve a win-win outcome of industrial structure upgrading and carbon emissions reduction [38]. Upgrading the agricultural industrial structure can promote the transformation of the agricultural industry from a traditional single-production structure to a diversified structure encompassing agricultural product processing, agricultural tourism, and other sectors, thereby increasing technological exchange and cooperation among different industrial segments and facilitating the synergistic integration of the industrial chain. Under the implementation of environmental tax policies, all links in the industrial chain need to cooperate closely to address the dual challenges posed by environmental and fiscal policies. Specifically, upstream suppliers will be driven to optimize raw material selection and supply, reduce the use of high-pollution and high-energy-consuming raw materials, and mitigate environmental risks from the source; midstream manufacturers will improve production processes, enhance resource utilization efficiency, reduce waste and pollutant generation, and actively adopt environmental technologies to meet environmental tax policy requirements; downstream distributors and retailers will strengthen the promotion and sales of green products, guide consumers to adopt environmentally friendly consumption concepts, and facilitate the market circulation of green agricultural products. Enterprises at all stages will collectively address the cost pressures arising from environmental taxes by optimizing supply chain management and reasonably sharing environmental costs, thereby achieving sustainable development of the industrial chain. This will drive the transformation of the agricultural industry structure from traditional processing models to green processing models, thereby promoting the development of innovative agricultural productivity [39]. Based on this, the following hypotheses are proposed in this paper.
Hypothesis 3 (H3). Upgrading the agricultural industrial structure plays a positive regulatory role in driving agricultural innovation and productivity development through environmental taxes.
3.4. Threshold Effect of Agricultural Carbon Emissions
During phases of relatively low agricultural carbon emissions, more lenient environmental tax policies may have limited effectiveness in promoting agricultural innovation and productivity. However, once agricultural carbon emissions exceed a certain threshold, stricter environmental tax policies are necessary to drive progress in agricultural innovation and productivity. When carbon emissions surpass ecological thresholds, a nonlinear, stepwise relationship emerges between environmental taxes and agricultural innovation and productivity. Cumulative environmental damage, such as soil degradation and biodiversity loss, amplifies the marginal losses from climate shocks. At this point, stringent environmental tax policies not only directly enhance productivity through technological innovation but also internalize the externalities of agricultural low-carbon innovation through institutional coordination, such as incorporating carbon sinks into the ecological product value realization mechanism. This forms a positive feedback loop of “emission reduction-increased production-ecological restoration”, ultimately achieving the resilient restructuring and productivity leap of the agricultural system under high carbon stress. Based on this, the following hypotheses are proposed in this paper.
Hypothesis 4 (H4). Agricultural carbon emissions have a threshold effect on the impact of environmental taxes on agricultural innovation and productivity development.
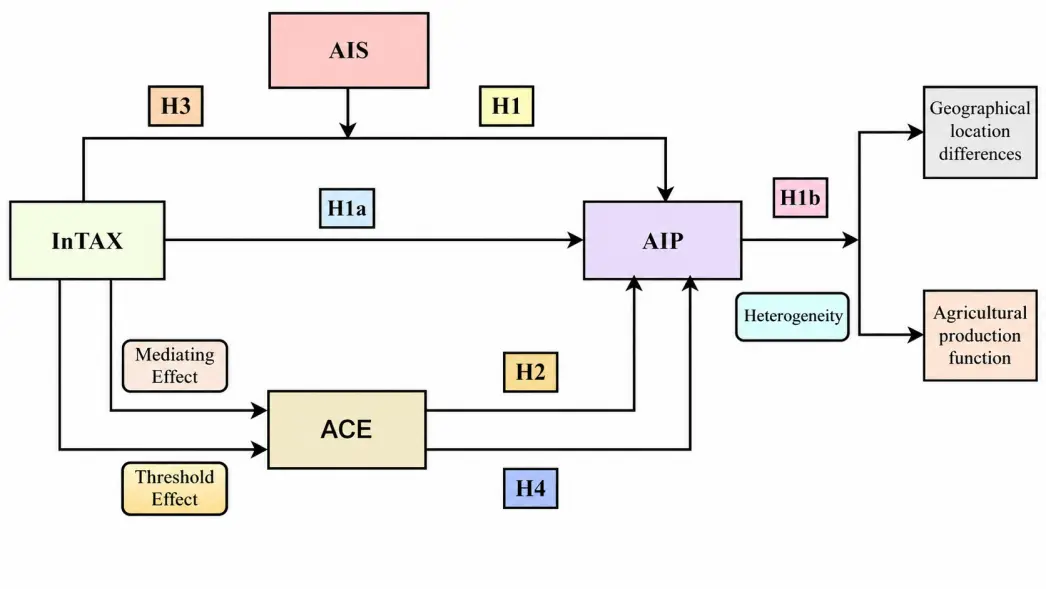
Based on the above theoretical analysis and proposed hypotheses, the overall conceptual framework of this study is presented in Figure 1:
4. Research Design
4.1. Model Construction
4.1.1. Benchmark Model
In order to comprehensively portray the impact of environmental taxes on agricultural innovation productivity, this paper constructs the following benchmark model:
In Equation (1), $$AIP$$ is agricultural innovation productivity, $$\mathit{ln}tax$$ is environmental taxes measured in logarithmic form, and$$\,\mathrm{ }{X}_{it}$$ denotes a series of control variables. $${u}_{i}$$, $${\gamma }_{t}\,$$represent individual and time fixed effects, respectively, and $${\epsilon }_{it}\,$$it is a random difference term.
4.1.2. Models of Mediating Effects
Examining the mechanism of the role of environmental taxes in promoting agricultural innovation productivity on the basis of Equation (1), the following equation is constructed:
In Equation (2), $${ACE}_{it}\mathrm{ }\,$$is agricultural carbon emissions. The interpretation of each other variable is the same as Equation (1). A significantly positive coefficient of the interaction term indicates that agricultural industrial structure upgrading strengthens the effect of environmental tax on AIP.
4.1.3. Moderating Effects Model
In order to test the moderating effect of upgrading the structure of the agricultural industry on the environmental tax on agricultural innovation productivity, the following model is constructed:
In Equation (3), $${w}_{it}$$ is the upgrading of agricultural industry structure, and the other variables are explained as in Equation (1).
4.1.4. Threshold Effects Model
To regress and analyze the panel data, and to further explore whether agricultural carbon emissions have a threshold effect on market-incentivized environmental regulation to drive agricultural innovation productivity, the following threshold model is established with agricultural carbon emissions as the threshold variable, and the model is set up as follows (with a single threshold as an example).
In Equation (4), agricultural carbon emission ($${ACE}_{it}$$) is the threshold effect variable; $$I$$ is the indicator function, which takes the value of 1 when the condition is satisfied, otherwise it takes the value of 0; $${\gamma }_{1}$$ is the threshold value. The interpretation of other variables is the same as Formula (1). According to the existence test of the threshold effect, it can be seen that there is a single threshold effect of environmental regulation on the development of agricultural innovation productivity, with agricultural carbon emission as the threshold.
4.2. Description of the Variables
4.2.1. Explained Variables
Agricultural innovation productivity (AIP) was measured using the entropy method to assess the level of agricultural innovation productivity development [40], as shown in Table 1.
Table 1. Comprehensive Evaluation Indicator System for Agricultural Innovation Productivity.
|
Target Level |
Standardized Layer |
Level 1 Indicators |
Secondary Indicators |
Measurement Method |
Causality |
|---|---|---|---|---|---|
|
Agricultural innovation productivity |
Agricultural laborers |
Worker skills |
Educational attainment |
Years of schooling per rural laborer |
+ |
|
Proportion of rural adults trained in technology |
Number of students graduating from rural adult cultural and technical training schools/rural workers |
+ |
|||
|
Agricultural Labor Objects |
labor productivity |
Output per capita in the primary sector |
Output of the primary sector/number of employees in the primary sector |
+ |
|
|
Per capita income of rural residents |
Per capita disposable income of rural residents |
+ |
|||
|
Workers’ concept of employment |
Rural labor mobility |
Migrant labor force/rural workers |
− |
||
|
Agricultural labor information |
ecological environment |
green |
forest cover |
+ |
|
|
Fiscal expenditure on environmental protection/government expenditure on public finance |
+ |
||||
|
Innovative industries |
pollution control |
Percentage of COD pollution emissions from agriculture/primary sector output |
− |
||
|
Percentage of ammonia emissions from agriculture/primary sector production value |
− |
||||
|
Innovation in the agricultural industry |
Number of specialized farmers’ cooperatives/Employees in primary industry |
+ |
|||
|
Number of State Key Leading Enterprises in Agricultural Specialization |
+ |
||||
|
Situation of agricultural, forestry and fishery services |
Value added of agriculture, forestry, animal husbandry and fishery services |
+ |
|||
|
Material means of production |
Traditional infrastructure |
Miles of rural roads/rural population |
+ |
||
|
Digital infrastructure |
Number of rural broadband access subscribers/number of rural households |
+ |
|||
|
Cable line length per square meter |
+ |
||||
|
Energy consumption |
Energy consumption in agriculture, forestry, and fisheries/gross value of production in agriculture, forestry, and fisheries |
− |
|||
|
Rural electricity consumption per capita |
+ |
||||
|
Intangible means of production |
Technological innovation |
Agricultural science and technology practitioners |
+ |
||
|
Stock of agricultural R&D inputs |
+ |
||||
|
Rural Financial Inclusion Investment Index |
+ |
||||
|
Level of digitization |
Rural Digital Financial Inclusion Mobile Payments Index |
+ |
Note: “+” denotes a positive indicator, indicating that a higher value contributes positively to agricultural innovation productivity; “−” denotes a negative indicator, indicating that a higher value has an adverse effect on agricultural innovation productivity.
4.2.2. Core Explanatory Variables
Environmental tax (lntax) is measured using the natural logarithm of market-based environmental regulation revenue. For 2012–2017, pollution discharge fees were used because China had not yet implemented the Environmental Protection Tax Law. For 2018–2022, environmental protection tax revenue is used because the former fee system was converted into the tax system after the Environmental Protection Tax Law took effect. This pre/post-2018 treatment ensures institutional continuity while also respecting the legal distinction between pollution discharge fees and environmental protection tax [41].
4.2.3. Control Variables
Referring to the relevant literature [42], the following indicators were selected: marketization rate, capital level, urban-rural consumption gap, dual contrast coefficient, agricultural product foreign trade dependency ratio, industrialization level, and urbanization rate. Among these, capital level (cap) is expressed as the number of college students divided by the total population; urban-rural consumption gap (consume) is expressed as the per capita disposable income of urban residents divided by the per capita disposable income of rural residents; dual-sector comparison coefficient (dual) is expressed as the comparative labor productivity of the primary sector divided by the comparative labor productivity of the secondary and tertiary sectors; agricultural product foreign trade dependency ratio (open) is expressed as the total value of agricultural product imports and exports (in billions of yuan) divided by the total agricultural output value (in billions of yuan); industrialization level (indust) is calculated by dividing industrial added value (in billions of yuan) by regional gross domestic product (GDP) (in billions of yuan), and urbanization rate (urban) is calculated by dividing the number of permanent urban residents (in millions) by the total number of permanent residents (in millions).
4.2.4. Mediating Variables
Agricultural carbon emissions (ACE) are calculated from six carbon sources: fertilizers, pesticides, agricultural films, diesel fuel, tillage, and irrigation [43]. These sources are widely used to measure agricultural carbon emissions in Chinese provincial studies and are well-suited to capturing the main fossil-energy and material-input emissions in agricultural production. The results are transformed into natural logarithms to reduce scale differences across provinces. The specific calculation formula is as follows:
|
```latexE=\sum {E}_{i}=\sum {T}_{i}*{\epsilon }_{i}``` |
In this formula, $$E\,$$is the total amount of agricultural carbon emissions, $${T}_{i}$$ denotes the input of the i-th carbon source, $${\epsilon }_{i}$$ denotes the carbon emission coefficient of the i-th carbon source, and the agricultural carbon emissions obtained from the above calculations will be taken as the natural logarithm in the empirical evidence. The main carbon emission sources and carbon emission coefficients of agriculture are shown in Table 2. These data are drawn from widely used sources, including Oak Ridge National Laboratory, IPCC guidelines, and Chinese agricultural carbon accounting studies. Although these coefficients are national or internationally recognized averages rather than province-specific coefficients, they are appropriate for interprovincial panel analysis because the aim is to capture comparable relative changes across provinces and years. To reduce measurement bias, the same coefficient system is applied consistently to all provinces and all years.
Table 2. Carbon Emission Factors for Agricultural Production Activities.
|
Agricultural Carbon Emission Factor |
||
|---|---|---|
|
Carbon Source |
Carbon Emission Factor |
References |
|
Fertilizer |
0.8956 kg/kg |
Oak Ridge National Laboratory, USA [43]. |
|
Pesticides |
4.9341 kg/kg |
Oak Ridge National Laboratory, USA [43]. |
|
Diesel fuel |
0.5927 kg/kg |
IPCC [44]. |
|
Agricultural film |
5.18 kg/kg |
Institute of Agricultural Resources and Ecological Environment, Nanjing Agricultural University [45]. |
|
Tillage |
312.6 kg/hm |
Huang et al. [46]. |
|
Irrigation |
20.476 kg/hm |
Wu et al. [47]. |
4.2.5. Regression Variables
As shown in Table 3, agricultural industrial structure upgrading (AIS) is measured as the natural logarithm of the proportion of the output value of agriculture, forestry, animal husbandry, and fishery services in the total output value of agriculture, forestry, animal husbandry, and fishery, following Liu et al. [48].
Table 3. Variable Definitions and Summary Statistics.
|
Variables |
Calculation Method |
Sample |
Averages |
Standard |
|
|---|---|---|---|---|---|
|
Explanatory |
AIP |
A system of indicators was constructed from three dimensions: agricultural workers, labor objects, and labor materials, and measured by the entropy method. |
330 |
0.19 |
0.089 |
|
Core explanatory |
lntax |
Sewage charges and environmental protection tax take natural logarithms |
330 |
10.68 |
0.921 |
|
Control |
Cpa |
Number of students enrolled in higher education (10,000)/total (10,000) |
330 |
0.02 |
0.006 |
|
Consume |
Per capita disposable income of urban residents/per capita disposable income of rural residents |
330 |
2.07 |
0.289 |
|
|
Dual |
Comparative Labor Productivity in Primary Industry/Comparative Labor Productivity in Secondary and Tertiary Industries |
330 |
0.42 |
0.139 |
|
|
open |
Total import and export of agricultural products (billions of yuan)/total agricultural output (billions of yuan) |
330 |
0.89 |
2.641 |
|
|
Indust |
Value added of industry (billion yuan)/Gross regional product (billion yuan) |
330 |
0.33 |
0.076 |
|
|
Urban |
population (10,000)/total resident population (10,000) |
330 |
0.61 |
0.117 |
|
|
Market |
Marketization index |
330 |
8.25 |
1.905 |
|
|
Intermediary |
AEC |
Carbon emissions from agriculture are measured in six dimensions: fertilizers, pesticides, agricultural films, diesel, tillage and irrigation, and the results are taken in natural logarithms |
330 |
5.45 |
1.045 |
|
Moderator variable |
AIS |
Share of total output value of agriculture, forestry, livestock and fishery services in total output value of agriculture, forestry, livestock and fishery in natural logarithms |
330 |
−3.23 |
0.468 |
4.3. Data Source
Based on the principles of data continuity and accessibility, the study period was set from 2012 to 2022, using panel data from 30 provinces in China (excluding Tibet, Hong Kong, Macao, and Taiwan) as the research sample. The study empirically analyzed the impact of environmental taxes on agricultural innovation productivity and its underlying mechanisms. The relevant data were sourced from China Rural Statistical Yearbook, China Energy Statistics Yearbook, China Business Management Statistics Annual Report, China Science and Technology Statistics Yearbook, China Environmental Statistics Yearbook, Annual Report on Rural Cooperative Economy Statistics in China, China Agricultural Economics Information Network, Guotai An Database, Peking University Digital Finance Research Center, EPS Database, and provincial statistical yearbooks. Missing data were supplemented using linear interpolation.
5. Empirical Test Results
5.1. Analysis of Benchmark Regression Results
Based on systematic diagnostic tests, including the F-test, the Lagrange Multiplier (LM) test, and the Hausman test, this paper adopts the two-way fixed effects model to examine the impact of environmental tax on agricultural innovation productivity. The baseline regression results reveal that the regression coefficient of environmental tax remains significantly positive at the 5% statistical level regardless of whether control variables are added incrementally, indicating that environmental tax exerts a significant promoting effect on agricultural innovation productivity and thus verifying research Hypothesis H1a. In addition, the Variance Inflation Factor (VIF) test is employed to check for multicollinearity among variables, and the results confirm the absence of severe multicollinearity in the Table 4.
Table 4. Baseline Regression Results.
|
(1) |
(2) |
(3) |
(4) |
(5) |
(6) |
(7) |
(8) |
|
|---|---|---|---|---|---|---|---|---|
|
AIP |
||||||||
|
lntax |
0.012 ** |
0.012 ** |
0.012 ** |
0.015 *** |
0.015 *** |
0.014 *** |
0.014 *** |
0.014 *** |
|
(0.005) |
(0.005) |
(0.005) |
(0.005) |
(0.005) |
(0.005) |
(0.005) |
(0.005) |
|
|
cap |
−1.139 |
−1.312 |
−6.303 *** |
−6.071 *** |
−5.048 ** |
−4.939 ** |
−5.054 ** |
|
|
(1.955) |
(1.974) |
(2.274) |
(2.319) |
(2.351) |
(2.346) |
(2.359) |
||
|
indusit |
−0.082 |
−0.123 |
−0.118 |
−0.124 |
−0.106 |
−0.116 |
||
|
(0.123) |
(0.120) |
(0.121) |
(0.120) |
(0.120) |
(0.122) |
|||
|
urban |
0.822 *** |
0.889 *** |
0.932 *** |
0.962 *** |
1.034 *** |
|||
|
(0.200) |
(0.238) |
(0.237) |
(0.237) |
(0.272) |
||||
|
open |
0.002 |
0.003 |
0.004 |
0.004 |
||||
|
(0.003) |
(0.003) |
(0.003) |
(0.003) |
|||||
|
consume |
0.056 ** |
0.051 ** |
0.052 ** |
|||||
|
(0.026) |
(0.026) |
(0.026) |
||||||
|
dual |
0.109 |
0.104 |
||||||
|
(0.072) |
(0.072) |
|||||||
|
market |
−0.003 |
|||||||
|
(0.006) |
||||||||
|
_cons |
0.025 |
0.059 |
0.072 |
−0.489 *** |
−0.564 *** |
−0.761 *** |
−0.802 *** |
−0.834 *** |
|
(0.054) |
(0.079) |
(0.082) |
(0.158) |
(0.212) |
(0.229) |
(0.230) |
(0.238) |
|
|
control |
YES |
YES |
YES |
YES |
YES |
YES |
YES |
YES |
|
id |
YES |
YES |
YES |
YES |
YES |
YES |
YES |
YES |
|
year |
YES |
YES |
YES |
YES |
YES |
YES |
YES |
YES |
|
N |
330.000 |
330.000 |
330.000 |
330.000 |
330.000 |
330.000 |
330.000 |
330.000 |
|
r2_a |
0.7948 |
0.7950 |
0.7953 |
0.8067 |
0.8069 |
0.8101 |
0.8116 |
0.8118 |
Note: ** p < 0.05, *** p < 0.01.
5.2. Robustness Testing
5.2.1. Replacing Core Explanatory Variables
The environmental tax (Otax) collected in the agricultural sector was selected as the core explanatory variable, calculated by taking the natural logarithm of the result obtained by dividing the total value of agricultural, forestry, animal husbandry, and fishery production by the gross domestic product (GDP) and multiplying it by the environmental tax. The regression results are shown in Table 5, Column (2). After replacing the core explanatory variable, the regression coefficient remains significantly positive at the 5% level, indicating that the intensity of environmental taxes in the agricultural sector can also significantly promote the development of agricultural innovation productivity.
5.2.2. Exclusion of Exceptional Years
According to the “Guiding Opinions on Further Promoting the Pilot Program for the Paid Use and Trading of Pollution Discharge Rights” issued by the General Office of the State Council in 2014, by 2017, pilot regions had basically established a system for the paid use and trading of pollution discharge rights, and the pilot program had been largely completed. This laid the foundation for the full implementation of the system for the paid use and trading of pollution discharge rights. Therefore, after excluding data from 2012 to 2016, the results show that the environmental tax still significantly impacts the development of agricultural innovative productivity at the 1% level. The regression results are shown in Table 5, Column (3).
5.2.3. Exclusion of Municipalities
Municipalities directly under the central government differ significantly from ordinary provinces in terms of administrative level, economic structure, and resource allocation capabilities. Their agricultural development is often influenced by stronger urban economic radiation, policy preferences, and unique industrial integration models. Therefore, data from municipalities may introduce heterogeneity interference and obscure the general relationship between environmental taxes and agricultural innovation productivity in other regions. After excluding municipalities, environmental taxes were still found to significantly promote agricultural innovation productivity at the 5% level, as shown in Column (4) of Table 5. Furthermore, to mitigate the possible influence of extreme values, this study winsorized the main continuous variables at the 1% and 99% levels and re-estimated the benchmark model. The results, reported in Column (5) of Table 5, show that the coefficient of environmental tax remains significantly positive. This indicates that the positive effect of environmental tax on agricultural innovation productivity is not driven by extreme observations, further confirming the robustness of the baseline conclusion.
Table 5. Robustness Test Results.
|
(1) |
(2) |
(3) |
(4) |
(5) |
|
|---|---|---|---|---|---|
|
AIP |
AIP |
AIP |
AIP |
AIP |
|
|
Intax |
0.014 *** (0.005) |
||||
|
Otax |
0.008 ** (0.004) |
||||
|
Year of deletion |
0.028 *** (0.007) |
||||
|
Excluding municipalities |
0.015 ** (0.006) |
||||
|
Winsorize (1% & 99%) |
0.013 ** (0.005) |
||||
|
_cons |
−0.834 *** (0.238) |
−0.790 *** (0.238) |
−1.468 ** (0.633) |
−0.523 *** (0.180) |
−0.807 *** (0.241) |
|
control |
YES |
YES |
YES |
YES |
YES |
|
id |
YES |
YES |
YES |
YES |
YES |
|
year |
YES |
YES |
YES |
YES |
YES |
|
N |
330.000 |
330.000 |
180.000 |
286.000 |
330.000 |
|
R-squared |
0.8118 |
0.8100 |
0.8788 |
0.7997 |
0.8124 |
Note: ** p < 0.05, *** p < 0.01.
5.3. Endogeneity Test
In the benchmark regression analysis, we controlled for fixed province and time effects, replaced explanatory variables, excluded municipalities, and reduced the number of years to enhance the reliability of the regression results. However, due to the influence of other unobservable factors, the impact of environmental taxes on agricultural innovation productivity may be subject to endogeneity issues. This study adopted the research methodology proposed by Cai et al. [49]. We select the lagged environmental regulation as the instrumental variable and use two-stage least squares regression. As shown in Table 6, in the first-stage regression results, the regression coefficient of the instrumental variable L. Tax is positive and passes the 1% significance level test, indicating that the effect of environmental taxes on agricultural innovation productivity remains significant at the 1% level. Further tests for instrumental variable under-identification and weak identification were conducted. In the tests, LM passed the 1% significance test, and the Wald F statistic exceeded the 10% critical value, indicating that the instrumental variable is reasonable. Hypothesis H1a is further supported.
Table 6. Results of Endogeneity Tests.
|
(1) |
(2) |
|
|---|---|---|
|
Firstct |
Second |
|
|
Variables |
lntax |
Ogronewpro |
|
L. lntax |
0.7456 *** |
|
|
(18.79) |
||
|
Intax |
0.0485 *** |
|
|
(8.36) |
||
|
cap |
3.2151 |
−2.0522 ** |
|
(0.43) |
(−2.52) |
|
|
indust |
1.1917 * |
−0.2297 *** |
|
(1.96) |
(−3.34) |
|
|
urban |
−0.3665 |
−0.2308 *** |
|
(−0.68) |
(−3.91) |
|
|
open |
0.0333 |
−0.0014 |
|
(0.78) |
(−0.31) |
|
|
consume |
−0.0747 |
−0.0656 *** |
|
(−0.52) |
(−4.17) |
|
|
dual |
−0.1595 |
0.0732 * |
|
(−0.47) |
(1.96) |
|
|
market |
0.0198 |
0.0274 *** |
|
(0.74) |
(9.28) |
|
|
Constant |
2.5233 *** |
−0.1893 ** |
|
(3.57) |
(−2.21) |
|
|
Phase I F-value |
31.4784 |
|
|
Cragg-DonaldWaldF statistics |
352.92 {16.38} |
|
|
Andersoncanon.corr.LM statistics |
167.95 [0.0000] |
|
|
N |
300 |
300 |
|
R-squared |
0.7891 |
0.568 |
Note: * p < 0.1, ** p < 0.05, *** p < 0.01.
5.4. Heterogeneity Analysis
Table 7 reports the results of heterogeneity tests based on a dual perspective of geographical location and agricultural functional zones. The results show that the enabling effect of environmental taxes on agricultural innovation productivity exhibits significant regional differences: the driving effect of environmental taxes on agricultural innovation productivity manifests spatially as a gradient characteristic of insignificant effects in the east, significant promotion in the central region, and inhibition in the west, and functionally as a differentiated pattern of “strong promotion in major production areas, weak inhibition in major consumption areas, and no effect in balanced areas.” Hypothesis H1b is validated.
5.4.1. Specific Analysis Based on Geographical Location Differences
Based on the classification criteria for geographical regional differences established by the National Bureau of Statistics, the sample was divided into three major regions: eastern, central, and western. This study examined the heterogeneous characteristics of the impact of environmental taxes on agricultural innovation productivity. The results are presented in columns (1) to (3) of Table 7 on the following page. The possible reason why environmental taxes have a limited effect in the eastern region is that the industrial structure in this region is relatively complex, with a higher proportion of industry and services, resulting in relatively limited resource allocation to agriculture. Compared to the central and western regions, agriculture in the eastern region accounts for a lower proportion of the overall economic system. From the perspective of factor markets, the prices of factors such as land and labor are higher in the eastern region. High-cost production factors may restrict the investment enthusiasm of agricultural enterprises and producers, thereby affecting the effectiveness of enhancing agricultural innovation productivity.
The possible reasons for the significant promotion in the central region are that the central region has rich agricultural resources, vast arable land, high grain production, abundant agricultural labor resources, and a relatively mature agricultural production system. It is faster in agricultural industrial restructuring and agricultural resource integration, and is more inclined to promote the transformation of agricultural technology to green and efficient when faced with environmental taxes.
This finding for western China should not be interpreted as evidence that environmental tax is inherently harmful to agricultural innovation. Rather, it indicates a mismatch between tax pressure and regional innovation capacity. In western provinces, ecological fragility, weak agricultural industrial foundations, limited fiscal support, and lower technology absorption capacity may cause environmental tax to operate mainly through the compliance-cost channel. In this context, producers may reduce production or postpone innovation investment instead of adopting cleaner technologies. Therefore, complementary policies, such as green credit, technical extension, ecological compensation, and subsidies for low-carbon equipment, are needed to transform tax pressure into innovation incentives.
5.4.2. Analysis Based on Differences in Agricultural Production Functions
Based on the differences in the functional positioning of agricultural production outlined in the National Medium- and Long-Term Plan for Food Security (2008–2020), the sample areas were categorized into three types: grain-producing regions, grain-consuming regions, and regions with balanced grain production and consumption. The test results are presented in columns 4 to (6) of Table 7. The possible reason for the significant promotion of environmental taxes in grain-producing regions is that these regions typically have vast and contiguous farmland, with relatively concentrated agricultural production entities, which provide ideal conditions for large-scale, mechanized agricultural production. After the implementation of environmental tax policies that promote new production technologies and business models, unit costs have decreased, economies of scale have become evident, and the driving role of agricultural innovation in productivity has been significantly enhanced.
Environmental taxes have had little impact on agricultural innovation and productivity in major grain-producing regions. This may be because these regions have developed economies, with industry and services as the main pillars of their economies. Agriculture accounts for a relatively small proportion of the total economic output in these regions, and land resources are primarily allocated to urban development, industrial land use, and commercial development. Limited land is prioritized for urban expansion, industrial park construction, and other projects, leading to a continuous reduction in the area of land available for grain production. This limits the scale of grain production, making it difficult to achieve economies of scale that could effectively leverage the productivity-enhancing measures facilitated by environmental taxes. Additionally, the grain market is relatively stable, with minimal price fluctuations, and, compared with cash crops or other high-value-added agricultural products, the profit margin for grain cultivation is narrower. In such circumstances, agricultural producers, after considering input costs and expected returns, find the return on technical investments low and are therefore unwilling to actively respond to relevant regulatory measures.
The lack of a significant production-sales balance zone may be attributed to the fact that such regions neither rely primarily on agriculture-particularly grain production—as their main industry, like grain-producing regions, nor have highly developed industries and services, like grain-consuming regions. Agricultural enterprises in production-consumption balanced regions are at a disadvantage in terms of capital, technology, and information, and their market scale is relatively small. Under these constraints, agricultural enterprises face high risks in adopting new technologies and uncertain returns, leading them to adopt a cautious, wait-and-see attitude, thereby suppressing the potential incentive effect of environmental taxes on agricultural innovation and productivity.
Table 7. Heterogeneity Analysis Results.
|
(1) |
(2) |
(3) |
(4) |
(5) |
(6) |
|
|---|---|---|---|---|---|---|
|
Regional Division |
Eastern Part |
Middle Part |
West Part |
Producing Areas |
Marketing Areas |
Balanced Areas |
|
AIP |
AIP |
AIP |
AIP |
AIP |
AIP |
|
|
lntax |
0.018 |
0.017 *** |
−0.027 ** |
0.030 ** |
−0.016 |
0.003 |
|
(0.013) |
(0.006) |
(0.013) |
(0.015) |
(0.011) |
(0.008) |
|
|
_cons |
−1.014 * |
−0.579 * |
0.304 |
−0.731 * |
−0.580 |
−0.087 |
|
(0.574) |
(0.339) |
(0.440) |
(0.426) |
(0.515) |
(0.432) |
|
|
control |
YES |
YES |
YES |
YES |
YES |
YES |
|
id |
YES |
YES |
YES |
YES |
YES |
YES |
|
Year |
YES |
YES |
YES |
YES |
YES |
YES |
|
N |
121.000 |
88.000 |
121.000 |
143.000 |
77.000 |
110.000 |
|
R-squared |
0.8471 |
0.8018 |
0.8432 |
0.7997 |
0.8626 |
0.7951 |
Note: * p < 0.1, ** p < 0.05, *** p < 0.01.
5.5. Testing the Mediating Effect of Agricultural Carbon Emissions
It can be known from the estimation results in column (2) of Table 8 that the regression coefficient of environmental tax on agricultural carbon emissions is −0.016, and it is significant at the 5% level. That is, for every 1% increase in environmental regulations, agricultural carbon emissions will decrease by 1.6%. This result indicates that the environmental tax plays a role through the “innovation compensation—emission reduction” path: on the one hand, it stimulates agricultural technological innovation. On the other hand, the environmental tax significantly reduces carbon emissions. Through policy measures, it prompts agricultural production and processing enterprises and other entities to increase research and application of low-carbon agricultural technologies, thereby curbing agricultural carbon emissions. This means that the agricultural production process is more environmentally friendly and efficient, creating conditions for the development of agricultural innovative productivity. Suppose H2 is verified.
Table 8. Results of the Mediation Effect Test.
|
(1) |
(2) |
|
|---|---|---|
|
AIP |
ACE |
|
|
lntax |
0.014 *** |
−0.016 ** |
|
(0.005) |
(0.007) |
|
|
_cons |
−0.834 *** |
2.157 *** |
|
(0.238) |
(0.324) |
|
|
control |
YES |
YES |
|
id |
YES |
YES |
|
year |
YES |
YES |
|
N |
330.000 |
330.000 |
|
R-squared |
0.8118 |
0.9975 |
Note: ** p < 0.05, *** p < 0.01.
To further enhance the robustness of the mechanism test results, this study adopts the Bootstrap method to examine the mediating effect of agricultural carbon emissions, and conducts 5000 repeated samples to construct bias-corrected confidence intervals. The Bootstrap test results show that the indirect effect of agricultural carbon emissions is positive, and its 95% confidence interval does not include 0, indicating that agricultural carbon emissions play a significant mediating role in the effect of environmental tax on agricultural innovation productivity. Furthermore, the direct effect is also significant, suggesting that the environmental tax can not only directly promote improvements in agricultural innovation productivity but also indirectly enhance it by reducing agricultural carbon emissions. Therefore, the promoting effect of environmental tax on agricultural innovation productivity operates through a significant “emission reduction and efficiency improvement” mechanism, thereby verifying Hypothesis H2.
5.6. Testing the Regulatory Effects of Agricultural Industrial Structure Upgrading
To examine whether the impact of environmental taxes on agricultural innovation productivity is affected by agricultural industrial structure upgrading. Based on the baseline model, regression analysis was conducted by incorporating the interaction term between the environmental tax and agricultural industrial structure upgrading, as shown in Table 9. The estimation results indicate that the interaction term between the environmental tax and agricultural industrial structure upgrading is significantly positive at the 1% statistical level, suggesting that agricultural industrial structure upgrading plays a positive regulatory role in the process by which the environmental tax drives agricultural innovation productivity. That is, the higher the level of agricultural industrial structure upgrading, the stronger the effect of the environmental tax in driving agricultural innovation productivity. Agricultural industrial structure upgrading promotes the flow of resources from traditional, inefficient agricultural production sectors to efficient new agricultural sectors, reduces environmental pollution, drives supply chain integration, and accelerates the development of agricultural innovative productivity. Hypothesis H3 is thus validated.
Table 9. Moderating Effect Test Results for Agricultural Industrial Structure Upgrading.
|
Effect Type |
Effect Value |
Boot SE |
95% Boot CI |
|---|---|---|---|
|
Indirect effect |
0.0025 |
0.0011 |
[0.0006, 0.0051] |
|
Direct effect |
0.0115 |
0.0047 |
[0.0024, 0.0208] |
|
Total effect |
0.0140 |
0.0050 |
[0.0042, 0.0236] |
5.7. Threshold Effect Analysis
Various factors influence the impact of environmental taxes on agricultural innovation productivity, and their driving effects may exhibit nonlinear characteristics. Following Hansen’s method [50], a multi-threshold panel model was constructed to explore further the nonlinear impact of environmental taxes on agricultural innovation productivity. Through 300 repeated bootstrap samples, the results are shown in Table 10. Table 10 indicates that the impact of environmental taxes on agricultural innovation productivity failed the two-threshold and three-threshold tests but passed the single-threshold test at the 10% significance level.
Table 10. Moderating Effect Test Results for Agricultural Industrial Structure Upgrading.
|
(1) |
(2) |
|
|---|---|---|
|
AIP |
AIP |
|
|
lntax |
0.014 *** |
0.010 * |
|
(0.005) |
(0.005) |
|
|
AIS |
0.033 * |
|
|
(0.020) |
||
|
M1 |
0.025 *** |
|
|
(0.010) |
||
|
_cons |
−0.702 *** |
−0.589 ** |
|
(0.250) |
(0.252) |
|
|
control |
YES |
YES |
|
id |
YES |
YES |
|
year |
YES |
YES |
|
N |
330.000 |
330.000 |
|
R-squared |
0.8137 |
0.8180 |
Note: * p < 0.1, ** p < 0.05, *** p < 0.01.
Based on the results of the panel threshold effect test, a threshold regression analysis was further conducted, with the results of the threshold regression analysis presented in Table 11. The impact of the effect of environmental tax on agricultural innovation productivity varies significantly depending on the level of agricultural carbon emissions. Specifically, when agricultural carbon emissions are less than 5.8779, the impact coefficient of the effect of environmental tax on agricultural innovation productivity is 0.007; when agricultural carbon emissions exceed 5.8779, the coefficient further increases to 0.041, indicating a more significant positive effect of the environmental tax on the development of agricultural innovation productivity. Both coefficients passed the significance test at the 10% level, and the coefficients exhibit an increasing trend. Therefore, it can be concluded that there is a threshold effect of agricultural carbon emissions on the impact of the effect of environmental tax on agricultural innovation productivity, and Hypothesis H4 is validated.
Table 11. Threshold Effect Test Results for Agricultural Carbon Emissions.
|
Threshold Type |
F |
P |
10% Threshold |
5% Threshold |
1% Threshold |
|---|---|---|---|---|---|
|
Single Threshold |
19.54 |
0.0733 |
18.3086 |
21.7256 |
26.8484 |
|
Double Threshold |
7.46 |
0.7100 |
22.8465 |
27.4555 |
38.8335 |
|
Triple Threshold |
6.71 |
0.7200 |
18.7499 |
23.6713 |
28.2805 |
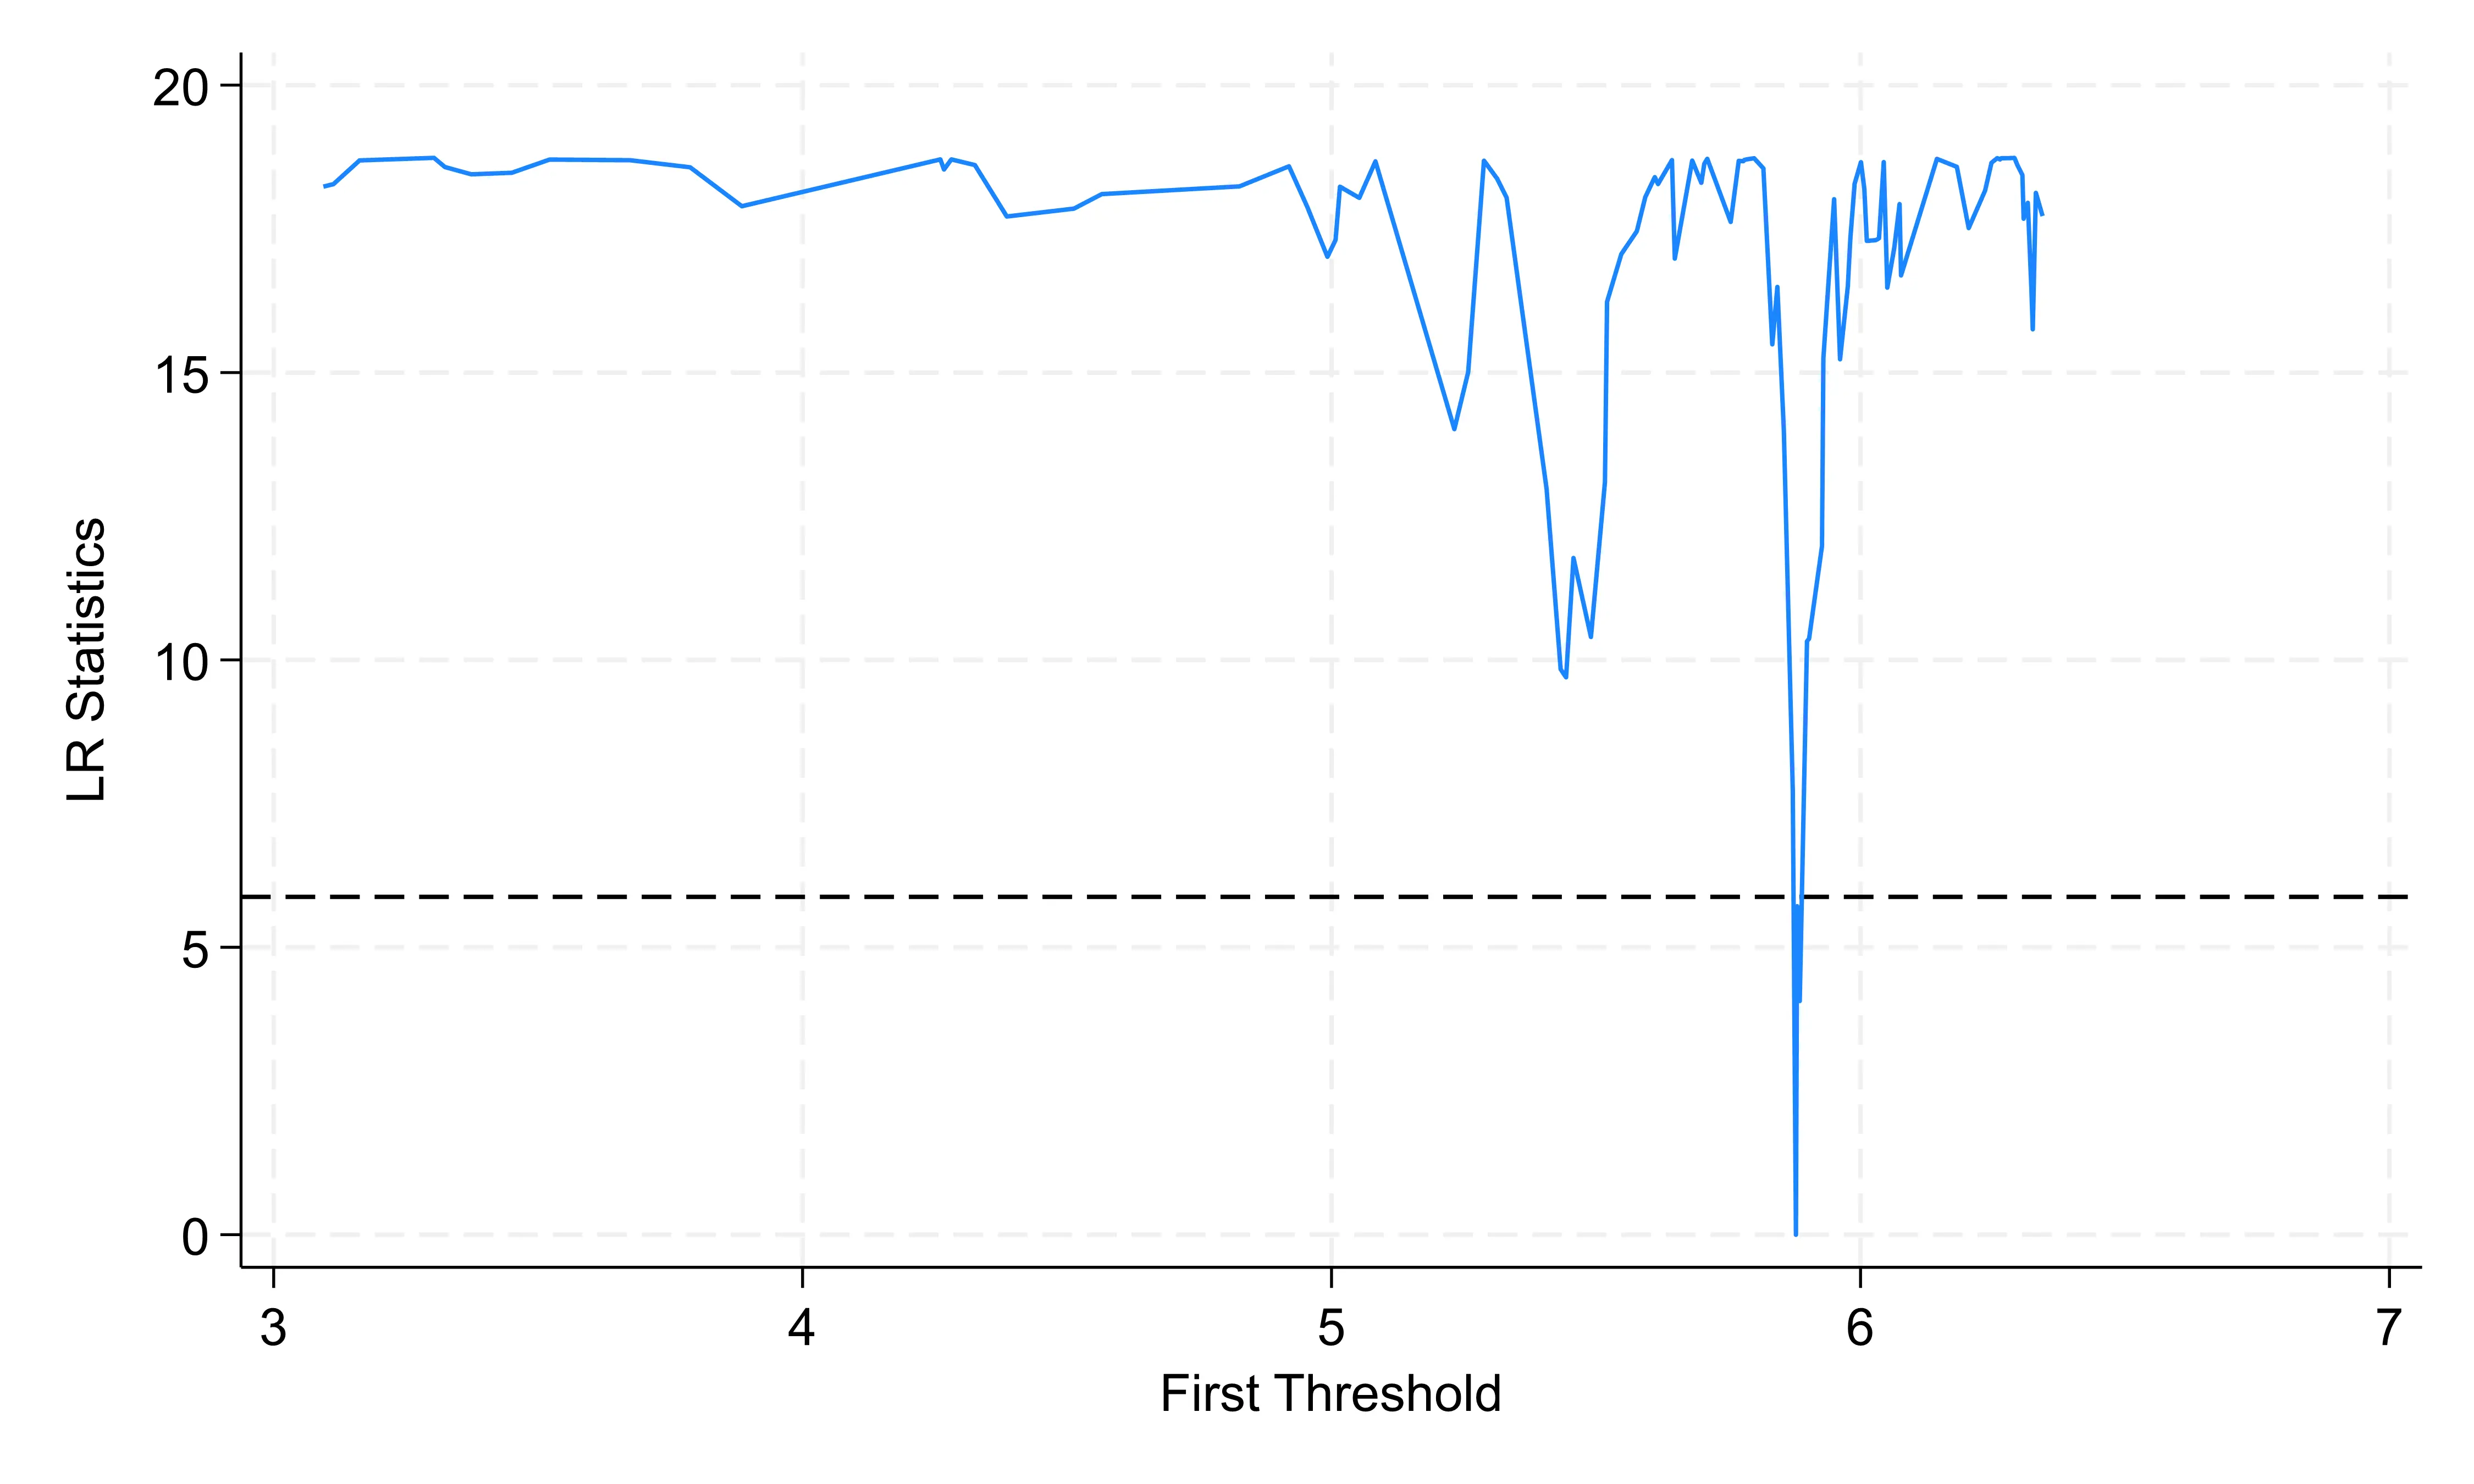
The threshold regression results are reported in Table 12, while the estimated threshold value and its corresponding confidence interval are presented in Table 13. Figure 2 further illustrates the likelihood-ratio profile of the first threshold estimate. The LR statistic reaches its minimum at approximately 5.8779, visually supporting the estimated threshold value and its corresponding confidence interval. The threshold value of 5.8779 has a clear economic meaning. It suggests that when agricultural carbon emissions are below the threshold, the environmental tax has a relatively moderate incentive effect because pollution pressure and regulatory urgency are limited. Once emissions exceed the threshold, the marginal productivity return to environmental tax increases substantially, meaning that tax policy becomes more effective when combined with stronger emission-reduction pressure. This finding supports differentiated policy design: provinces above the threshold should strengthen tax enforcement and low-carbon technology support, whereas provinces below the threshold should focus on preventive governance and stable incentives [51].
Table 12. Regression Results for the Threshold Effect of Agricultural Carbon Emissions.
|
(1) |
|
|---|---|
|
AIP |
|
|
lntax (ACE ≤ 5.8779) |
0.007 * |
|
(0.004) |
|
|
lntax (ACE > 5.8779) |
0.041 *** |
|
(0.012) |
|
|
_cons |
−0.958 ** |
|
(0.441) |
|
|
control |
YES |
|
id |
YES |
|
year |
YES |
|
N |
185.000 |
|
R-squared |
0.616 |
Note: * p < 0.1, ** p < 0.05, *** p < 0.01.
Table 13. Threshold Values for Agricultural Carbon Emissions.
|
Threshold Variables |
Threshold |
Estimated Value |
Confidence Interval (Math.) |
|---|---|---|---|
|
Ocarbon |
Single Threshold |
0.004 |
(0.0066925, 0.0312295) |
6. Conclusions and Policy Implications
6.1. Main Conclusions
This paper uses panel data from 30 Chinese provinces from 2012 to 2022 to examine how environmental tax affects agricultural innovation productivity. The main conclusions can be summarized as follows. First, environmental tax significantly promotes AIP, and this conclusion remains robust after alternative variable measurement, sample exclusions, endogeneity treatment, and additional diagnostic checks. Second, agricultural carbon-emission reduction is an important mechanism: an environmental tax reduces high-carbon agricultural inputs, thereby supporting cleaner factor allocation and green technological upgrading. Third, upgrading the agricultural industrial structure strengthens the positive effect of environmental taxes by improving the agricultural sector’s capacity to adopt green technologies and extend value chains. Fourth, the effect of environmental tax is heterogeneous. It is more evident in central China and major grain-producing areas, but the western region faces stronger compliance-cost pressure. Fifth, agricultural carbon emissions exhibit a single-threshold effect. Above the threshold of 5.8779, the effect of environmental tax on AIP becomes stronger, indicating that tax incentives are more effective when emission-reduction pressure is sufficiently high.
6.2. Policy Implications
The following policy implications are therefore proposed. First, clarify the institutional boundary of environmental tax in agricultural policy. For the post-2018 period, the Environmental Protection Tax Law should serve as the legal basis for tax collection, while the continuity between pollution discharge fees and environmental protection tax should be considered in policy evaluation. Tax rules should be refined for agricultural planting, livestock farming, aquaculture, and agricultural product processing, with clearer standards for fertilizer and pesticide use, livestock manure treatment, wastewater discharge, agricultural film recycling, and green equipment adoption [52]. At the same time, environmental tax revenues can be partially redirected to agricultural green technology extension, low-carbon machinery subsidies, and digital monitoring systems, thereby converting tax pressure into innovation capacity [53]. Second, implement differentiated policies according to regional heterogeneity and agricultural functional zones. In eastern regions, environmental tax should be combined with market-based certification, digital traceability, cold-chain logistics, and the integration of agriculture with secondary and tertiary industries. In central regions and major grain-producing areas, tax incentives should support precision fertilization, conservation tillage, water-saving irrigation, green storage, and grain-processing technology. In western regions, tax enforcement should be accompanied by ecological compensation, green credit, fiscal subsidies, and technology-extension services to avoid excessive compliance-cost pressure. For grain-consuming and production-consumption balanced regions, policy should emphasize green consumption guidance, organic product certification, and agricultural service-sector upgrading [54].
Third, combine environmental tax with carbon-market and cap-and-trade instruments. Cap-and-trade schemes and environmental taxes are not substitutes; they can be complementary instruments [55]. Cap-and-trade can set an overall emissions cap and improve the certainty of emission-reduction targets, whereas environmental tax can provide continuous marginal incentives for pollution reduction and technological upgrading [56]. Following recent discussions on emissions trading and broad-based climate instruments, China should gradually explore agricultural carbon accounting, voluntary agricultural carbon credits, and cross-regional carbon trading pilots, while ensuring that economic instruments are applied as broadly as possible across regions, sectors, and agricultural activities [57]. Fourth, incorporate the threshold effect into policy design. Provinces above the agricultural carbon-emission threshold should adopt stronger tax enforcement and support for low-carbon technologies, while provinces below the threshold should focus on preventive regulation, stable incentives, and the cultivation of early-stage innovation [58]. These measures can improve the precision and operability of environmental-tax policy and better support agricultural green transformation and high-quality development [59].
6.3. Limitations and Future Research
This study still has limitations. First, the environmental tax variable is constructed from province-level fiscal statistics and thus cannot fully capture farm-level behavioral responses. Future studies can combine enterprise, cooperative, or household microdata with policy data. Second, agricultural carbon emissions are calculated using commonly used coefficients; future research can improve measurement by incorporating region-specific emission factors and remote sensing data. Third, although this study considers regional and functional heterogeneity, further work can examine spatial spillovers, dynamic policy effects, and interactions between environmental tax, carbon trading, green finance, and digital agriculture.
Author Contributions
Z.Z.: Conceptualization, Methodology, Software, Formal Analysis, Data Curation, Writing—Original Draft, Visualization, Validation. Y.G.: Writing—Review & Editing, Supervision, Project Administration, Funding Acquisition, Resources. S.Y.: Writing—Review & Editing, Supervision, Methodology Validation, Investigation Guidance, Resources.
Ethics Statement
Not applicable.
Informed Consent Statement
Not applicable.
Data Availability Statement
The data presented in this study are available on request from the corresponding author.
Funding
This research was funded by Hebei Provincial Social Science Foundation Project (HB22YJ056).
Declaration of Competing Interest
The authors declare that they have no known competing financial interests or personal relationships that could have appeared to influence the work reported in this paper.
References
- Segerson K. Uncertainty and incentives for nonpoint pollution control. J. Environ. Econ. Manag. 1988, 15, 87–98. DOI:10.1016/0095-0696(88)90030-7 [Google Scholar]
- Xinhua News Agency. Strengthen Agricultural Science and Technology Equipment Innovation and Develop New Agricultural Productive Forces. 2025. Available online: https://zzny.zhengzhou.gov.cn/xxlb/9215874.jhtml (accessed on 22 July 2026).
- Porter M. America’s Green Strategy. Business and the Environment: A Reader; Scientific American: New York, NY, USA, 1996. [Google Scholar]
- Zhao X, Liu C, Yang M. The effects of environmental regulation on China's total factor productivity: An empirical study of carbon-intensive industries. J. Clean. Prod. 2018, 179, 325–334. DOI:10.1016/j.jclepro.2018.01.100 [Google Scholar]
- Matthews RCO, Denison EF. Accounting for Slower Economic Growth: The United States in the 1970s. Econ. J. 1981, 91, 1044. DOI:10.2307/2232516 [Google Scholar]
- Zhao Z, Zhao Y, Lv X, Li X, Zheng L, Fan S, et al. Environmental regulation and green innovation: Does state ownership matter? Energy Econ. 2024, 136, 107762. DOI:10.1016/j.eneco.2024.107762. [Google Scholar]
- Porter ME, Linde CVD. Toward a New Conception of the Environment-Competitiveness Relationship. J. Econ. Perspect. 1995, 9, 97–118. DOI:10.1257/jep.9.4.97 [Google Scholar]
- Shi S, Jing Y, Zhai T. Study on the Role of Market-Incentive Environmental Regulation in the Development of Low-Carbon Agriculture and Its Implementation Path. Adm. Trib. 2021, 27, 139–144. DOI:10.3969/j.issn.1005-460X.2021.01.019 [Google Scholar]
- Zhang S, Luo Y, Xiong C. Research on empowering agricultural high quality development through new quality productivity mechanisms. J. Yunnan Agric. Univ. 2025, 19, 16–24. DOI:10.12371/j.ynau(s).202412027 [Google Scholar]
- Marx K. Capital; Volume I; People’s Publishing House: Beijing, China, 2018. [Google Scholar]
- McGowan D, Vasilakis C. Reap what you sow: Agricultural technology, urbanization and structural change. Res. Policy 2019, 48, 103794. DOI:10.1016/j.respol.2019.05.003 [Google Scholar]
- Bourne M, Childs J, Philippidis G, Feijoo M. El control de las emisiones de gases de efecto invernadero en España: Costes para los sectores agrarios. Span. J. Agric. Res. 2012, 10, 567–582. DOI:10.5424/sjar/2012103-564-11 [Google Scholar]
- Meng S. Is the agricultural industry spared from the influence of the Australian carbon tax? Agric. Econ. 2015, 46, 125–137. DOI:10.1111/agec.12145 [Google Scholar]
- Mackenzie SG, Wallace M, Kyriazakis I. How effective can environmental taxes be in reducing the environmental impact of pig farming systems? Agric. Syst. 2017, 152, 131–144. DOI:10.1016/j.agsy.2016.12.012 [Google Scholar]
- Mardones C, Lipski M. A carbon tax on agriculture? A CGE analysis for Chile. Econ. Syst. Res. 2020, 32, 262–277. DOI:10.1080/09535314.2019.1676701 [Google Scholar]
- Huang L, Zhou X, Chi L, Meng H, Chen G, Shen C, et al. Stimulating innovation or enhancing productivity? The impact of environmental regulations on agricultural green growth. J. Environ. Manag. 2024, 370, 122706. DOI:10.1016/j.jenvman.2024.122706 [Google Scholar]
- Säll S, Gren IM. Effects of an environmental tax on meat and dairy consumption in Sweden. Food Policy 2015, 55, 41–53. DOI:10.1016/j.foodpol.2015.05.008 [Google Scholar]
- Lin C, Lu S, Su X, Wen C. Retracted article: Can the greening of the tax system improve enterprises’ ESG performance? Evidence from China. Econ. Change Restruct. 2024, 57, 127. DOI:10.1007/s10644-024-09687-w [Google Scholar]
- Shi W, Wang W, Tang W, Qiao F, Zhang G, Pei R, et al. How Environmental Regulation Affects Pollution Reduction and Carbon Reduction Synergies—An Empirical Analysis Based on Chinese Provincial Data. Sustainability 2024, 16, 5331. DOI:10.3390/su16135331 [Google Scholar]
- He B, Ma C. Can the Inclusiveness of Foreign Capital Improve Corporate Environmental, Social, and Governance (ESG) Performance? Evidence from China. Sustainability 2024, 16, 9626. DOI:10.3390/su16229626 [Google Scholar]
- Suchkov DK, Aygumov TG, Rudnev SG, Yu Michurina N. The influence of environmental factors on the development of agricultural production. IOP Conf. Ser. Earth Environ. Sci. 2022, 1045, 012095. DOI:10.1088/1755-1315/1045/1/012095 [Google Scholar]
- Rahman S, Anik AR, Sarker JR. Climate, Environment and Socio-Economic Drivers of Global Agricultural Productivity Growth. Land 2022, 11, 512. DOI:10.3390/land11040512 [Google Scholar]
- Wang D, Li S, Toktarbek S, Jiakula N, Ma P, Feng Y. Research on the Coordination between Agricultural Production and Environmental Protection in Kazakhstan Based on the Rationality of the Objective Weighting Method. Sustainability 2022, 14, 3700. DOI:10.3390/su14063700 [Google Scholar]
- Bokusheva R, Kumbhakar SC, Lehmann B. The effect of environmental regulations on Swiss farm productivity. Int. J. Prod. Econ. 2012, 136, 93–101. DOI:10.1016/j.ijpe.2011.09.017 [Google Scholar]
- Zhang J, Yang Z, Zhang X, Sun J, He B. Institutional Configuration Study of Urban Green Economic Efficiency—Analysis Based on fsQCA and NCA. Pol. J. Environ. Stud. 2025, 34, 1457–1467. DOI:10.15244/pjoes/187130 [Google Scholar]
- He B, Yu X, Ho SE, Zhang X, Xu D. Does China’s Two-Way FDI Coordination Improve Its Green Total Factor Productivity? Pol. J. Environ. Stud. 2023, 33, 173–183. DOI:10.15244/pjoes/171681 [Google Scholar]
- Rubashkina Y, Galeotti M, Verdolini E. Environmental regulation and competitiveness: Empirical evidence on the Porter Hypothesis from European manufacturing sectors. Energy Policy 2015, 83, 288–300. DOI:10.1016/j.enpol.2015.02.014 [Google Scholar]
- Sinn HW. Public policies against global warming: A supply side approach. Int. Tax Public Financ. 2008, 15, 360–394. DOI:10.1007/s10797-008-9082-z [Google Scholar]
- Chen L, Bai X, Chen B, Wang J. Incentives for Green and Low-Carbon Technological Innovation of Enterprises Under Environmental Regulation: From the Perspective of Evolutionary Game. Front. Energy Res. 2022, 9, 793667. DOI:10.3389/fenrg.2021.793667 [Google Scholar]
- Wu Y, Wu B, Liu X, Zhang S. Digital finance and agricultural total factor productivity—From the perspective of capital deepening and factor structure. Financ. Res. Lett. 2025, 74, 106449. DOI:10.1016/j.frl.2024.106449 [Google Scholar]
- Rasheed MQ, Yuhuan Z, Ahmed Z, Haseeb A, Saud S. Information communication technology, economic growth, natural resources, and renewable energy production: Evaluating the asymmetric and symmetric impacts of artificial intelligence in robotics and innovative economies. J. Clean. Prod. 2024, 447, 141466. DOI:10.1016/j.jclepro.2024.141466 [Google Scholar]
- Li Y, Liu W. Spatial effects of environmental regulation on high-quality economic development: From the perspective of industrial upgrading. Front. Public Health 2023, 11, 1099887. DOI:10.3389/fpubh.2023.1099887 [Google Scholar]
- Tombe T, Winter J. Environmental policy and misallocation: The productivity effect of intensity standards. J. Environ. Econ. Manag. 2015, 72, 137–163. DOI:10.1016/j.jeem.2015.06.002 [Google Scholar]
- Hu YH, Zhang KY, Hu NY, Wu LP. Review on measurement of agricultural carbon emission in China. Chin. J. Eco-Agric. 2023, 31, 163–176. DOI:10.12357/cjea.20220777 [Google Scholar]
- Rong G. Spatiotemporal Patterns and Underlying Drivers of Provincial Agricultural Green Total Factor Productivity in China. Sci. Rep. 2026, 16, 22367. DOI:10.1038/s41598-026-52686-2 [Google Scholar]
- Tian X, Li W, Li R. The environmental effects of agricultural mechanization: Evidence from agricultural machinery purchase subsidy policy. China Econ. Transit. 2023, 6, 483. DOI:10.3868/s060-016-023-0029-5 [Google Scholar]
- He B, Ding W, Zhang D. Does the Digital Economy Matter for Carbon Emissions in China? Mechanism and Path. Pol. J. Environ. Stud. 2025, 34, 7123–7135. DOI:10.15244/pjoes/193384 [Google Scholar]
- Wang Z, Fu Y, Wu J. The Impact of Environmental Regulation on Collaborative Innovation Efficiency: Is the Porter Hypothesis Valid in Chengdu–Chongqing Urban Agglomeration? Sustainability 2024, 16, 2223. DOI:10.3390/su16052223 [Google Scholar]
- Zhang C, Tang J, Zhang S, He B. From Responsibility to Renewal: How Does ESG Practice Promote Sustainable Business Model Innovation? Sustainability 2025, 17, 7965. DOI:10.3390/su17177965 [Google Scholar]
- Zhu D, Ye LX. Agricultural New Quality Productive Force in China: Level Measurement and Dynamic Evolution. Stat. Decis. 2024, 40, 24–30. DOI:10.13546/j.cnki.tjyjc.2024.09.004 [Google Scholar]
- Qin K, Yao C, Niu R. The Impact of Environmental Regulation on Enterprise Green Innovation. Econ. Anal. Policy 2024, 84, 1933–1944. DOI: 10.1016/j.eap.2024.11.008 [Google Scholar]
- Zhang Y, Yin Q, Wu Y, Ma K. Impact of Formal and Informal Environmental Regulations on Agricultural Carbon Emissions: Empirical Evidence from China. Agric. Econ. Czech 2026, 72, 19–36. DOI:10.17221/467/2024-AGRICECON [Google Scholar]
- Ma T. Evaluation of the Present Situation of Agricultural Carbon Sources and Carbon Sinks in Shanghai and Analysis of the Potential for Increasing Carbon Sinks. Agro-Environ. Dev. 2011, 28, 38–41. DOI:10.3969/j.issn.1005-4944.2011.05.009 [Google Scholar]
- Denman KL. Climate Change 2007: The Physical Science Basis; Contribution of Working Group I to the Fourth Assessment Report of the Intergovernmental Panel on Climate Change; Cambridge University Press: Cambridge, UK, 2007. [Google Scholar]
- Wang BY, Zhang WG. A Research of Agricultural Eco-Efficiency Measurement in China and Its Spatiotemporal Differences. China Popul. Resour. Environ. 2016, 26, 11–19. DOI:10.3969/j.issn.1002-2104.2016.06.002 [Google Scholar]
- Huang X, Wu X, Guo X, Shen Y. Agricultural carbon emissions in China: Measurement, spatiotemporal evolution, and influencing factors analysis. Front. Environ. Sci. 2024, 12, 1488047. DOI: 10.3389/fenvs.2024.1488047 [Google Scholar]
- Wu H, Ding B, Liu L, Zhou L, Meng Y, Zheng X. Have agricultural land-use carbon emissions in China peaked? An analysis based on decoupling theory and spatial EKC model. Land 2024, 13, 585. DOI: 10.3390/land13050585 [Google Scholar]
- Liu Y, Han H, Wang L. Digital inclusive finance, digital literacy, and agricultural industrial structure upgrading in China. Front. Sustain. Food Syst. 2026, 10, 1849998. DOI: 10.3389/fsufs.2026.1849998 [Google Scholar]
- Cai Z, Ding X, Zhou Z, Han A, Yu S, Yang X, et al. Fiscal decentralization’s impact on carbon emissions and its interactions with environmental regulations, economic development, and industrialization: Evidence from 288 cities in China. Environ. Impact Assess. Rev. 2025, 110, 107681. DOI:10.1016/j.eiar.2024.107681 [Google Scholar]
- Hansen BE. Threshold effects in non-dynamic panels: Estimation, testing, and inference. J. Econom. 1999, 93, 345–368. DOI:10.1016/S0304-4076(99)00025-1 [Google Scholar]
- Zhou R, Lou J, He B. Greening Corporate Environmental, Social, and Governance Performance: The Impact of China’s Carbon Emissions Trading Pilot Policy on Listed Companies. Sustainability 2025, 17, 963. DOI:10.3390/su17030963 [Google Scholar]
- Chen Z, Zhang X, Chen F. Do carbon emission trading schemes stimulate green innovation in enterprises? Evidence from China. Technol. Forecast. Soc. Change 2021, 168, 120744. DOI:10.1016/j.techfore.2021.120744 [Google Scholar]
- Gollop FM, Roberts MJ. Environmental Regulations and Productivity Growth: The Case of Fossil-fueled Electric Power Generation. J. Political Econ. 1983, 91, 654–674. DOI:10.1086/261170 [Google Scholar]
- Qi T, Chen L. Heterogeneous environmental regulations and firm financial performance: The moderating effects of marketization. Environ. Dev. Sustain. 2024, 28, 2741–2777. DOI:10.1007/s10668-024-05088-1 [Google Scholar]
- Wang Y, Yao J. Innovation or introduction? Impacts of the low-carbon city pilot policy on the pathways toward green technology progress. Heliyon 2024, 10, e28745. DOI:10.1016/j.heliyon.2024.e28745 [Google Scholar]
- Sheng Y, Xu X, Rozelle S. Market structure, resource allocation, and industry productivity growth: Firm-level evidence from China’s steel industry. China Econ. Rev. 2024, 83, 102102. DOI:10.1016/j.chieco.2023.102102 [Google Scholar]
- Hamid S, Wang Q, Wang K. The spatiotemporal dynamic evolution and influencing factors of agricultural green total factor productivity in Southeast Asia (ASEAN-6). Environ. Dev. Sustain. 2023, 27, 2469–2493. DOI:10.1007/s10668-023-03975-7 [Google Scholar]
- Xiong H, Zhan J, Xu Y, Zuo A, Lv X. Challenges or Drivers? Threshold Effects of Environmental Regulation on China’s Agricultural Green Productivity. J. Clean. Prod. 2023, 429, 139503. DOI:10.1016/j.jclepro.2023.139503. [Google Scholar]
- Xie JL, Wang ZF. Threshold Effect and Spatial Differences of Environmental Regulation on Tourism Eco-Efficiency in the Yangtze River Economic Belt. Geogr. Geo-Inf. Sci. 2023, 39, 117–125. DOI:10.3969/j.issn.1672-0504.2023.02.015 [Google Scholar]