
Spatial Suitability Assessment and Differentiated Pathways for Ecological Products Value Realization
Spatial Suitability Assessment and Differentiated Pathways for Ecological Products Value Realization
Received: 24 April 2026 Revised: 17 June 2026 Accepted: 14 July 2026 Published: 23 July 2026

© 2026 The authors. This is an open access article under the Creative Commons Attribution 4.0 International License (https://creativecommons.org/licenses/by/4.0/).
1. Introduction
Ecosystem services provide annual benefits worth approximately USD 125 trillion per year globally (2011 USD) [1], yet many ecological values remain unrealized because ecological resources and development capacity are distributed unevenly [2]. This challenge has intensified amid climate change and post-pandemic recovery needs, making the translation of ecological values into economic and social benefits important for sustainable development [3,4,5,6]. The challenge is particularly acute in rapidly developing regions where ecological providers remain economically disadvantaged while resource consumers capture a larger share of benefits. The Yellow River Basin supports approximately 420 million people and contributes about 23% of China’s GDP, while facing ecological degradation and a reported 13% decline in water resources since 2000 [7,8,9,10]. Despite generating approximately USD 2.1 billion in annual ecological-product value, regions with high ecological-function importance remain economically underdeveloped, while intensive industrial areas depend on ecological resources supplied across space [11,12,13]. This spatial mismatch can threaten ecological security and social stability. It should not be treated as an inevitable development-versus-conservation divide; ecological civilization instead requires coordinated protection, resource-efficient economic activity, social well-being, cultural continuity, and institutional governance [14].
Existing valuation studies apply broadly comparable methods across diverse landscapes, although ecological-product realization capacity varies by geographic location [15,16,17]. Policy research examines mechanisms such as payments for ecosystem services and ecological compensation, but often gives less attention to spatial differences in implementation capacity [18,19,20]. International experience indicates that successful value realization requires location-specific strategies. Costa Rica’s Payment for Ecosystem Services program and spatially differentiated agri-environment measures in the European Union provide examples of policy instruments adapted to heterogeneous landscapes. However, no single framework can identify optimal zones and pathways across all large temperate river basins [21,22,23]. This gap has led to costly failures: China’s USD 70 billion Grain-for-Green program achieved mixed results due to inadequate spatial targeting, while globally, an estimated 40% of conservation finance fails to meet objectives because of similar spatial-heterogeneity challenges [14,24,25]. Chinese cases include land ecological consolidation and value realization in a Yangtze riverside industrial park [20] and zoning of ecological-product realization models in the Shibing karst area [26]. Internationally, landscape management in south-east Australia integrates changing ecosystem goods and services into planning [27], while a spatial-planning study in Türkiye links economically valuable provisioning services to differentiated land-use decisions [28]. These studies demonstrate why methods cannot be transferred mechanically to the Yellow River Basin, with its water constraints, ecological headwaters, upstream-downstream benefit flows, and major fossil-energy and industrial base.
This study addresses the gap through a problem-oriented application of multi-criteria decision analysis (MCDA). Conventional MCDA commonly aggregates normalized criteria into one score; that operation can conceal whether a location scores highly because of development capacity, ecological importance, or compensation between them [29,30]. Our framework keeps development capacity and ecological function importance as separate dimensions, making their spatial tension visible before linking each combination to a bounded policy pathway. This does not eliminate normative judgment: indicator selection, thresholds, and pathway design still require ecological safeguards and local participation. The contribution is therefore a transparent two-dimensional diagnostic for 76 cities, not a universal optimization rule. CRITIC supplies reproducible statistical weights, while its limits as a non-participatory weighting method are addressed in Sections 2.4.4 and 4.2.
Applied to 76 cities across the Yellow River Basin using multi-source data (remote sensing, land use, and socioeconomic indicators), our framework identifies four distinct suitability zones and proposes spatially differentiated realization pathways tailored to each zone’s characteristics. This approach links ecological-product valuation to spatial planning and provides a method that may be tested in other regions facing development-conservation trade-offs.
2. Materials and Methods
2.1. Analytical Framework
Ecological-product value realization is an operational component of ecological civilization aimed at improving ecological functions and quality of life while establishing a positive relationship between environmental protection and economic development. Ecosystem-service classifications organize biophysical and cultural benefits for accounting purposes, whereas ecological civilization has a broader governance objective that encompasses environmental integrity, resource-efficient economic activity, social well-being, cultural values, and political-institutional arrangements [14]. Natural conditions include terrain, geographic position, biodiversity, and conservation areas [31], while ecological-product accounting groups supply, regulating, and cultural products [32]. In this study, the basin-wide strategic objective is ecological protection combined with high-quality development, but pathways and safeguards are location specific. The measured development-capacity dimension is narrower than comprehensive social development because it primarily uses topography, accessibility, per-capita GDP, industrial structure, and supply/cultural-product values. Education, health, equity, cultural attachment, participation, and governance quality are not measured and are treated as limitations.
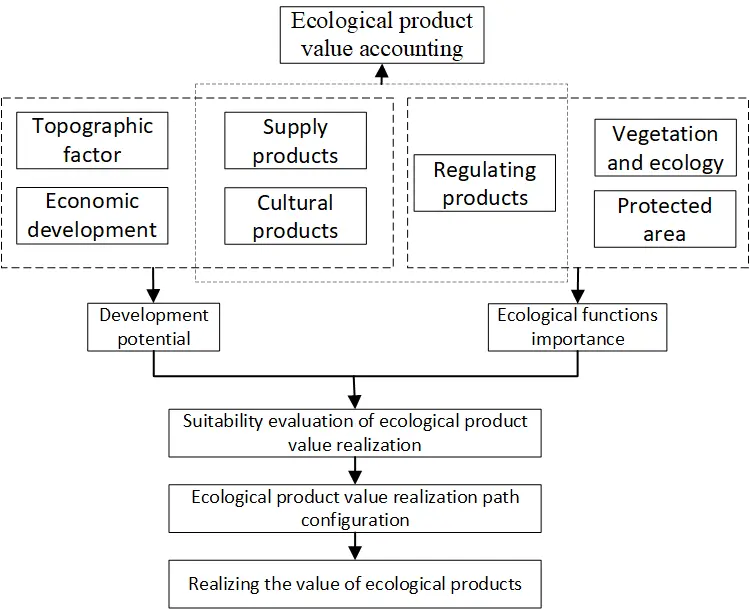
As shown in Figure 1, the suitability framework retains two measured dimensions: development capacity and ecological-function importance. Development capacity reflects a region’s ability to support ecological-product initiatives based on natural and economic conditions, including topography, accessibility, economic structure, supply products, and cultural products. Ecological-function importance reflects the irreplaceability of regional functions such as climate regulation, energy conservation, biological activity, vegetation condition, and protected areas; regions with greater ecological-function importance require stricter protection [33,34]. Together, these dimensions form the basis for evaluating ecological-product value-realization suitability [35]. A high development-capacity score does not authorize development, and a lower measured ecological importance does not imply ecological dispensability. All zones remain subject to ecological baselines, while higher ecological importance strengthens the priority for protection, restoration, and compensation.
Based on the two-dimensional matrix, regions are classified as suitable, marginally suitable, marginally unsuitable, or unsuitable [36]. Suitable zones have higher development capacity and lower relative ecological-function importance and may test ecologically safeguarded green-industry, certification, and service mechanisms [37]. Marginally suitable zones combine restoration with tightly bounded livelihood opportunities. Marginally unsuitable zones prioritize ecological protection and minimal-impact activities. Unsuitable zones focus on maintaining natural environments and strengthening ecological-compensation mechanisms [38]. By linking the four categories to differentiated pathways, the framework seeks to improve the realization of supply, regulating, and cultural-product values while supporting a positive protection-development feedback loop [39]. These labels describe conditional feasibility for ecological-product instruments; they are not general land-development permissions.
2.2. Research Area
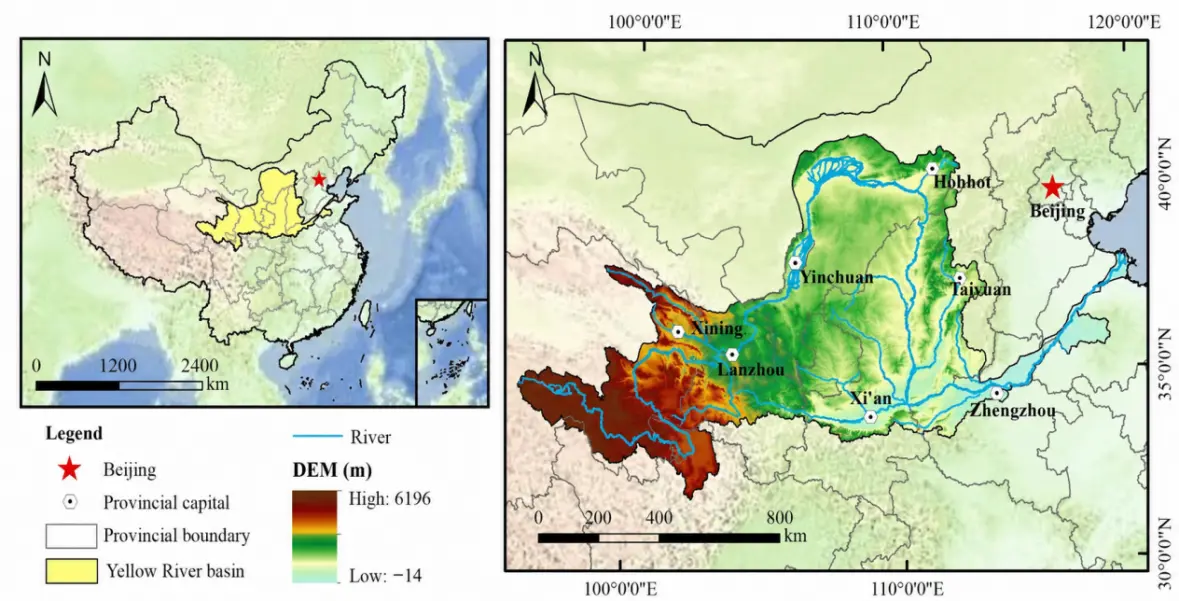
The Yellow River Basin (95°53′–119°05′ E, 32°10′–41°50′ N) spans nine provinces in eastern, central, and western China [33], covering approximately 795,000 km2 with a main-stem length of 5464 km [34]. The basin has diverse natural conditions, including a mean annual precipitation of approximately 466 mm, a three-level descending terrain pattern, and ecological zones such as the Sanjiangyuan grasslands and Qilian Mountains [37]. It is also a major coal, petroleum, natural-gas, and industrial base [40], with a reported 2020 GDP of USD 142.1 billion and an urbanization rate of 56.16%. These fossil resources are geological material stocks rather than ecosystem services; their extraction and use create economic capacity as well as environmental pressure. Renewable biological production, water provision, and regulating functions are treated separately as ecological products. The coexistence of ecological fragility, water constraints, uneven regional development, and energy-intensive industry makes the basin a critical setting for ecological-civilization governance.
Figure 2 shows the location and spatial extent of the Yellow River Basin research area.
2.3. Data Sources
The Yellow River flows through 9 provinces and regions, including Qinghai, Sichuan, Gansu, Ningxia, Inner Mongolia, Shaanxi, Shanxi, Henan, and Shandong. According to administrative divisions, all 76 cities in these nine provinces (regions) are selected as research objects, as shown in Table 1.
Table 1. Cities in the Yellow River Basin.
|
City Name |
|---|
|
Aba Tibetan and Qiang Autonomous Prefecture, Alxa League, Ankang City, Anyang City, Bayannur City, Baiyin City, Baotou City, Baoji City, Binzhou City, Datong City, Dezhou City, Dingxi City, Dongying City, Ordos City, Gannan Tibetan Autonomous Prefecture, Garze Tibetan Autonomous Prefecture, Guyuan City, Guoluo Tibetan Autonomous Prefecture, Haibei Tibetan Autonomous Prefecture, Haidong City, Hainan Tibetan Autonomous Prefecture, Haixi Mongolian and Tibetan Autonomous Prefecture, Hanzhong City, Heze City, Hebi City, Hohhot City, Huangnan Tibetan Autonomous Prefecture, Jinan City, Jiyuan City, Jiaozuo City, Jincheng City, Jinzhong City, Kaifeng City, Lanzhou City, Liaocheng City, Linfen City, Linxia Hui Autonomous Prefecture, Linyi City, Longnan City, Luoyang City, Lvliang City, Nanyang City, Pingdingshan City, Pingliang City, Puyang City, Qingyang City, Sanmenxia City, Shangluo City, Shizuishan City, Shuozhou City, Taiyuan City, Taian City, Tianshui City, Tongchuan City, Weinan City, Wuhai City, Ulanqab City, Wuzhong City, Wuwei City, Xi’an City, Xining City, Xianyang City, Xinzhou City, Xinxiang City, Yan’an City, Yangquan City, Yinchuan City, Yulin City, Yushu Tibetan Autonomous Prefecture, Yuncheng City, Zhangye City, Changzhi City, Zhengzhou City, Zhongwei City, Zibo City, Jining City |
This study utilizes a variety of datasets to support the evaluation and analysis. Table 2 summarizes the key data sources, their origins, and specific applications in this research. To ensure data consistency and comparability, all spatial datasets underwent standardized preprocessing procedures. Data were projected to the World Geodetic System 1984 (WGS 84) coordinate system, and monthly records were aggregated into annual datasets. MODIS reflectance data were processed using Google Earth Engine (GEE) for cloud removal, annual mosaicking, and median compositing. Additionally, all spatial datasets were reclassified using the ArcGIS platform to meet the specific requirements of this study.
Table 2. Data Sources and Applications.
|
Data Type |
Data Source |
Usage |
|---|---|---|
|
MODIS Remote Sensing Imagery |
MODIS reflectance data (processed via Google Earth Engine, NASA) |
Land use classification and vegetation analysis |
|
NDVI |
Landsat 8 data (United States Geological Survey, USGS) |
Depicting vegetation growth states |
|
Soil Data |
HWSD (Harmonized World Soil Database) |
Soil properties analysis |
|
Temperature and Precipitation |
Terraclimate reanalysis data |
Climate analysis |
|
DEM Data |
ASTER GDEM (Geospatial Data Cloud Platform, https://www.gscloud.cn, accessed on 5 January 2026) |
Slope and elevation analysis |
|
Ecological Protected Areas |
Resource and Environment Data Cloud Platform (Chinese Academy of Sciences, https://www.resdc.cn, accessed on 5 January 2026) |
Identifying ecological zones |
|
Economic Statistics |
National Bureau of Statistics and local statistical yearbooks |
Socioeconomic analysis |
|
Agricultural Production |
Compilation of Cost and Income Data of National Agricultural Products |
Agricultural productivity analysis |
2.4. Research Methods
2.4.1. Accounting for the Value of Ecological Products
Building on the distribution of land types and major grain-production areas in China, Song et al. proposed ecosystem-service values per unit area for different ecosystems [41]. Following this approach, the present study uses one-seventh of the average economic value per unit area of principal grain crops across the 76 cities to localize the standard equivalent factor [26]. Three accounting categories are calculated: supply products (food and raw materials), regulating products (gas regulation, climate regulation, environmental purification, and hydrological regulation), and cultural products (aesthetic landscape value). This service classification supports accounting but does not represent the full environmental, social, cultural, and governance scope of ecological civilization. The computation follows three steps:
Calculation of the Standard Equivalent Factor Value
The standard equivalent factor value of ecological products in the study area is calculated using the following formula:
|
```latexP=\frac{1}{7}\sum_{j=1}^{n}\frac{{b}_{j}{e}_{j}{r}_{j}}{S}``` |
(1) |
where:
$$P$$: Value of 1 standard equivalent factor of ecological products in the research area (yuan/hm2);
$${b}_{j}$$: Planting area of the j-th grain crop (hm2);
$${e}_{j}$$: Average market price of the j-th grain crop (yuan);
$${r}_{j}$$: Yield of the j-th grain crop (kg);
S: Total planting area of grain crops (hm2).
We acknowledge that ecosystem service coefficients exhibit spatial heterogeneity within the basin due to variations in soil quality [42], precipitation patterns, and agricultural practices. To partially address this issue, we adjusted the national-level equivalent factors using city-specific grain productivity data, following the localization approach proposed by Xie et al. (2008). Specifically, one-seventh of each city’s average grain economic value per hectare was used as the local standard equivalent factor, capturing regional differences in agricultural productivity. However, this adjustment primarily reflects economic variations rather than biophysical differences in ecosystem functioning. This represents an inherent limitation of the equivalent factor approach, which prioritizes operational feasibility over spatial precision when assessing large heterogeneous regions. Future studies could integrate spatially-explicit biophysical models such as InVEST or ARIES to provide more accurate estimates of service provision heterogeneity.
The equivalent value of ecosystem service value per unit area is shown in Table 3.
Table 3. Equivalent Value of Ecosystem Service Value per Unit Area.
|
Secondary Classification |
Food Supply |
Raw Material Supply |
Gas Regulation |
Climate Regulation |
Environmental Purification |
Hydrological Regulation |
Aesthetic Landscape |
|---|---|---|---|---|---|---|---|
|
Farmland |
0.85 |
0.40 |
0.67 |
0.36 |
0.10 |
0.27 |
0.06 |
|
Forest Land |
0.30 |
0.69 |
2.26 |
6.77 |
1.96 |
4.13 |
1.10 |
|
Grassland |
0.23 |
0.34 |
1.21 |
3.19 |
1.05 |
2.34 |
0.59 |
|
Unused Land |
0.01 |
0.03 |
0.11 |
0.1 |
0.31 |
0.21 |
0.05 |
|
Water System |
0.8 |
0.23 |
0.77 |
2.29 |
5.55 |
102.24 |
1.89 |
Calculation of the Value Coefficient
The value coefficient of ecological products for each land type is obtained by multiplying the equivalent factor by $${F}_{f}$$:
|
```latex{F}_{f}={V}_{f}×P``` |
(2) |
where:
$${F}_{f}$$: Value coefficient of the $${V}_{f}$$-th ecological product (yuan/hm2);
$$f$$: Value equivalent of the $$f$$-th ecological product;
The value coefficients of ecological products of various land use types in the Yellow River Basin are shown in Table 4.
Table 4. Value Coefficients of Ecological Products in the Yellow River Basin (USD/hm2).
|
Secondary Classification |
Food Supply |
Raw Material Supply |
Gas Regulation |
Climate Regulation |
Environmental Purification |
Hydrological Regulation |
Aesthetic Landscape |
|---|---|---|---|---|---|---|---|
|
Farmland |
258.29 |
121.51 |
203.57 |
109.36 |
30.38 |
82.02 |
18.23 |
|
Forest Land |
91.14 |
208.03 |
686.68 |
2055.47 |
595.29 |
1252.71 |
334.21 |
|
Grassland |
70.88 |
104.26 |
366.68 |
969.00 |
319.98 |
709.75 |
179.23 |
|
Water System |
243.02 |
69.87 |
233.87 |
695.66 |
1686.00 |
31,064.81 |
574.26 |
|
Unused Land |
3.04 |
9.11 |
33.41 |
30.38 |
94.15 |
63.78 |
15.18 |
Total Value Calculation
|
```latexEP{V}_{if}={H}_{i}×{F}_{f}``` |
(3) |
where:
$$EP{V}_{if}$$: Value of the i-th ecological product of the i-th land use type (yuan);
$${H}_{i}$$: Area of the i-th land use type (hm2).
2.4.2. Correlation Analysis of Indicators
To ensure the scientific validity and accuracy of the analysis, the Pearson correlation coefficient is applied to examine the relationships among the indicators. This method helps to identify and eliminate highly correlated variables that might introduce multicollinearity issues into the model. The Pearson correlation coefficient (r) ranges between −1 and +1, where values close to +1 indicate strong positive correlations, values close to −1 indicate strong negative correlations, and values near 0 suggest no meaningful linear relationship [43].
The formula for the Pearson correlation coefficient is as follows:
|
```latexr=\frac{\sum\limits_{i=1}^{n}(x_i-\bar{x})(y_i-\bar{y})}{\sqrt{\sum\limits_{i=1}^{n}(x_i-\bar{x})^2}\sqrt{\sum\limits_{i=1}^{n}(y_i-\bar{y})^2}}``` |
(4) |
where:
$$r$$: Pearson correlation coefficient;
$${x}_{i}{, y}_{i}$$: The $$i$$-th observation of two indicators;
$$\bar{x},\bar{y}$$: Mean values of the two indicators;
$$n$$: Number of observations.
To eliminate the influence of different measurement units, all data were standardized before the analysis. This ensures that the resulting correlation coefficients are not affected by differences in scale.
2.4.3. Suitability Evaluation Framework
The suitability system contains eight indicator categories: topography, development capacity, supply-product value, cultural-product value, location conditions, regulating-product value, vegetation condition, and protected areas (Table 5). The selection follows established multi-criteria land-suitability and ecosystem-service frameworks. Topography and location represent physical and accessibility constraints; per-capita GDP and industrial structure represent economic capacity rather than comprehensive social development. Food and raw materials are supply products, aesthetic landscape value is a cultural product, and gas regulation, climate regulation, environmental purification, and hydrological regulation are currently treated as regulating products. Supply- and cultural-product indicators measure direct and indirect ecological-product contributions [44], while vegetation and protected areas represent ecological condition and conservation priority. This accounting taxonomy is narrower than ecological civilization because it does not directly measure equity, health, education, cultural attachment, participation, or the quality of governance.
This study applies scientific and reasonable classification methods to assign values to these indicators. Protected areas are divided into five levels based on their ecological importance and are assigned values ranging from 0 to 4: core areas of nature reserves are assigned a value of 4, buffer zones 3, ecological function areas 2, experimental areas 1, and other areas 0. For other indicators, the natural break method (Natural Break Method) is applied to divide them into four levels. The natural break method minimizes intra-class variance and maximizes inter-class variance, ensuring the scientific and objective classification of indicators. This assignment approach not only lays a solid foundation for evaluating the suitability of ecological product value realization but also provides a standardized basis for comparative analysis between regions. Table 5 summarizes the constructed indicators along with their classification and scoring criteria.
The indicator categories were chosen to keep the two measured dimensions interpretable rather than to claim a comprehensive ecological-civilization index. Geographic and accessibility variables represent constraints on implementation; economic variables represent organizational and market capacity; supply and cultural values represent products that may enter value-realization pathways; and regulating values, vegetation, and protected areas represent ecological functions and conservation constraints. Correlation analysis is used to identify redundancy, but statistical independence alone does not establish social relevance or policy priority. The unmeasured social, cultural, and institutional dimensions are acknowledged explicitly and require participatory assessment in future applications.
Table 5. Suitability Evaluation Index System for the Value Realization of Ecological Products in the Yellow River Basin.
|
Indicator Layer |
Development Potential/Ecological Function Importance Score |
Weight |
|---|---|---|
|
DEM (m) |
≤854/4, (854, 1788]/3, (1788, 3123]/2, >3123/1 |
0.118 |
|
Slope (°) |
≤5°/4, (5°, 13°]/3, (13°, 22°]/2, >22°/1 |
0.126 |
|
Per Capita GDP (thousand USD) |
>1.99/4, (1.11, 1.99]/3, (0.55, 1.11]/2, ≤0.55/1 |
0.123 |
|
Proportion of Secondary and Tertiary Industries (%) |
>0.929/4, (0.862, 0.929]/3, (0.730, 0.862]/2, ≤0.730/1 |
0.119 |
|
Food Supply (million USD) |
>3100/4, (775, 3100]/3, (155, 775]/2, ≤155/1 |
0.085 |
|
Raw Material Supply (million USD) |
>2325/4, (155, 2325]/3, (31, 155]/2, ≤31/1 |
0.085 |
|
Aesthetic Landscape (million USD) |
>7750/4, (1550, 7750]/3, (155, 1550]/2, ≤155/1 |
0.093 |
|
Water Distance (km) |
≤5/4, (5, 10]/3, (10, 15]/2, >15/1 |
0.126 |
|
Road Distance (km) |
≤5/4, (5, 10]/3, (10, 15]/2, >15/1 |
0.125 |
|
Gas Regulation (million USD) |
>6200/4, (3100, 6200]/3, (93, 3100]/2, ≤93/1 |
0.150 |
|
Climate Regulation (million USD) |
>15,500/4, (1550, 15,500]/3, (155, 1550]/2, ≤155/1 |
0.150 |
|
Environmental Purification (million USD) |
>4650/4, (775, 4650]/3, (310, 775]/2, ≤310/1 |
0.173 |
|
Hydrological Regulation (million USD) |
>15,500/4, (7750, 15,500]/3, (1550, 7750]/2, ≤1550/1 |
0.166 |
|
NDVI |
>0.73/4, (0.55, 0.73]/3, (0.33, 0.55]/2, ≤0.33/1 |
0.238 |
|
Protected Area |
Core area of nature reserve/4, Buffer zone of nature reserve/3, Ecological function area/2, Experimental area of nature reserve/1, Others/0 |
0.122 |
The validity of the indicator system was assessed through multiple approaches. First, indicator selection followed established criteria in multi-criteria decision analysis: relevance, measurability, and independence. Second, a correlation analysis (Section 3.2) was conducted to identify and address potential multicollinearity issues. Third, sensitivity analysis (Section 3.3) demonstrated the robustness of results to changes in individual indicators. This validation approach is consistent with best practices in environmental indicator development.
2.4.4. Calculation of Evaluation Indicators
Calculation of Development Potential
The development-capacity index combines topographic factors, economic structure, supply-product value, cultural-product value, and accessibility. CRITIC (Criteria Importance Through Intercriteria Correlation) assigns objective statistical weights based on two properties of the observed dataset: contrast intensity, represented by the normalized standard deviation, and conflict/redundancy, represented by inter-indicator correlations. CRITIC was selected because it provides a reproducible rule and reduces the influence of highly correlated indicators. The resulting weights describe statistical differentiation among the 76 observations; they do not measure ecological, social, or ethical importance and should not be interpreted as policy preferences.
CRITIC excludes local priorities, distributional effects, cultural values, and community knowledge. Carbon sequestration, for example, may support both conservation and livelihood objectives, but a statistical weight cannot decide how those objectives should be balanced. The method is also sensitive to indicator definition, normalization, sample composition, outliers, and spatial scale. We therefore use CRITIC as a reproducible descriptive weighting procedure, not as a substitute for judgment. Future applications should validate the weights through sensitivity analysis and participatory deliberation with affected communities, local managers, and public decision makers rather than relying only on external expert adjustment.
In CRITIC, a larger standard deviation indicates greater statistical contrast among the sampled cities after normalization; it does not by itself mean that an indicator contains more substantively important information. Correlation is used to reduce weight where indicators vary similarly and therefore contribute redundant statistical patterns. Sampling design, uneven regional representation, and outliers can influence both quantities, so the weights must be interpreted together with sensitivity checks and substantive knowledge. The calculation formulas are as follows:
|
```latex\sigma_j=\sqrt{\frac{1}{n}\sum_{i=1}^{n}\left(x_{ij}-\overline{x}_j\right)^2}``` |
(5) |
|
```latexr_{jk}=\frac{\sum\limits_{i=1}^{n}(x_{ij}-\overline{x}_j)(x_{ik}-\overline{x}_k)}{\sqrt{\sum\limits_{i=1}^{n}(x_{ij}-\overline{x}_j)^2}\sqrt{\sum\limits_{i=1}^{n}(x_{ik}-\overline{x}_k)^2}}``` |
(6) |
|
```latex{w}_{j}=\frac{{\sigma }_{j}\left(1-\frac{1}{m}\sum\limits _{k=1}^{m}{r}_{jk}\right)}{\sum\limits _{j=1}^{m}{\sigma }_{j}\left(1-\frac{1}{m}\sum\limits _{k=1}^{m}{r}_{jk}\right)}``` |
(7) |
|
```latex{S}_{i}=\sum_{j=1}^{m}{w}_{j}{x}_{ij}``` |
(8) |
where:
$${\sigma }_{j}$$: Standard deviation of the $$j$$-th indicator;
$${x}_{ij}$$: Value of the $$j$$-th indicator for the $$i$$-th sample;
$$\overline{x}_j$$: Mean value of the $$j$$-th indicator;
$${r}_{jk}$$: Correlation coefficient between the $$j$$-th and $$k$$-th indicators;
$${w}_{j}$$: Objective weight of the $$j$$-th indicator;
$${S}_{i}$$: Comprehensive score of development potential for the $$i$$-th map patch.
Finally, the development potential index is classified into four levels: low, relatively low, relatively high, and high, using the natural break method.
Calculation of Ecological Function Importance
The same method (CRITIC) is used to calculate the ecological function importance. Key indicators include regulation product value (e.g., gas regulation, climate regulation, hydrological regulation), vegetation and ecology (e.g., NDVI), and protected area types. The weights of these indicators are determined objectively based on their dispersion and correlation. Similar to the development potential index, the ecological function importance is classified into four levels: low, relatively low, relatively high, and high, using the natural break method.
Calculation of Value Realization Suitability
Suitability is evaluated using a two-dimensional matrix of development capacity and the importance of ecological functions. The matrix distinguishes conditional opportunity from ecological constraint: suitable areas combine higher development capacity with lower relative importance of ecological function, but remain subject to ecological baselines; marginally suitable areas require restoration and bounded activity; marginally unsuitable areas prioritize protection and compensation; and unsuitable areas require strict protection. The classification is a screening device for ecological-product instruments, not a ranking of the value of places or authorization for conventional development.
3. Results Analysis
3.1. Spatial Characteristics Analysis of Ecological Product Value
The ecological product values in the Yellow River Basin were calculated using Equation (3), and the results are presented in Table 6. The total ecological product value amounts to USD 2.15 billion, with regulation products contributing the largest share of USD 1.84 billion (85.68%), followed by supply products at USD 0.19 billion (8.62%) and cultural products at USD 0.12 billion (5.7%). Regulation products, particularly those related to gas regulation, climate regulation, hydrological regulation, and environmental purification, dominate the overall value of ecological products. In contrast, supply and cultural products contribute smaller proportions, reflecting the significant role of ecosystem regulatory functions in the basin’s ecological economy.
The contributions of different land use types to ecological product value vary significantly. Grassland makes the highest contribution to the total ecological product value, particularly in regulation functions such as climate regulation (USD 444.8 million) and hydrological regulation (USD 325.9 million). Forest land also plays a vital role, especially in climate regulation and hydrological functions. Although farmland covers a relatively smaller area, it shows higher per-unit contributions in food supply (USD 49.85 million) and raw material supply (USD 23.45 million). Water systems, despite their limited spatial coverage, have significant impacts on hydrological regulation (USD 203.7 million). In contrast, construction land and unused land contribute negligibly to the overall ecological product value due to their minimal ecological functions.
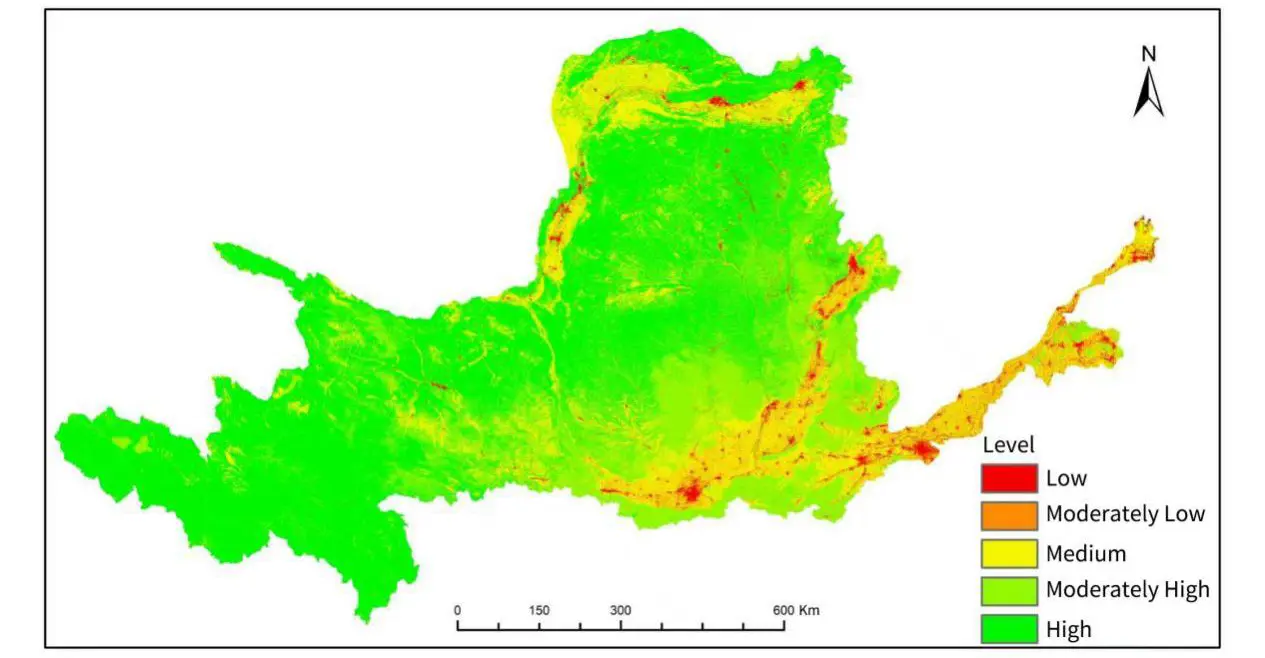
The spatial distribution of ecological product values, as shown in Figure 3, reveals a clear west-to-east gradient across the Yellow River Basin. Using the natural break method, ecological product values are categorized into five levels: low, lower, medium, higher, and high. The analysis indicates that regions with low and lower ecological product values are primarily located in Ningxia, Inner Mongolia, and parts of Shaanxi and Shandong. These areas are often characterized by sparse vegetation, limited cropland, and fragmented grassland, which leads to reduced ecological product values. Conversely, regions with higher and high ecological product values are concentrated in the western and eastern core areas of the basin. These regions benefit from extensive grasslands, abundant water systems, and diverse vegetation, which contribute to higher values in food supply, raw material supply, climate regulation, and hydrological regulation. This spatial analysis provides critical insights into the ecological value dynamics and offers a scientific basis for targeted regional land use and conservation strategies.
Table 6. Value of Ecological Products in the Yellow River Basin (Million USD).
|
Secondary Classification |
Food Supply |
Raw Material Supply |
Gas Regulation |
Climate Regulation |
Environmental Purification |
Hydrological Regulation |
Aesthetic Landscape |
|---|---|---|---|---|---|---|---|
|
Farmland |
49.85 |
23.45 |
39.30 |
21.12 |
5.86 |
15.84 |
3.52 |
|
Forest Land |
8.86 |
20.22 |
66.73 |
199.74 |
57.87 |
121.78 |
32.48 |
|
Grassland |
32.54 |
47.86 |
168.27 |
444.83 |
146.89 |
325.89 |
82.28 |
|
Water System |
1.59 |
0.46 |
1.53 |
4.56 |
11.05 |
203.70 |
3.77 |
|
Construction Land |
0.00 |
0.00 |
0.00 |
0.00 |
0.00 |
0.00 |
0.00 |
|
Unused Land |
0.08 |
0.25 |
0.91 |
0.83 |
2.56 |
1.74 |
0.41 |
3.2. Indicator Correlation Analysis
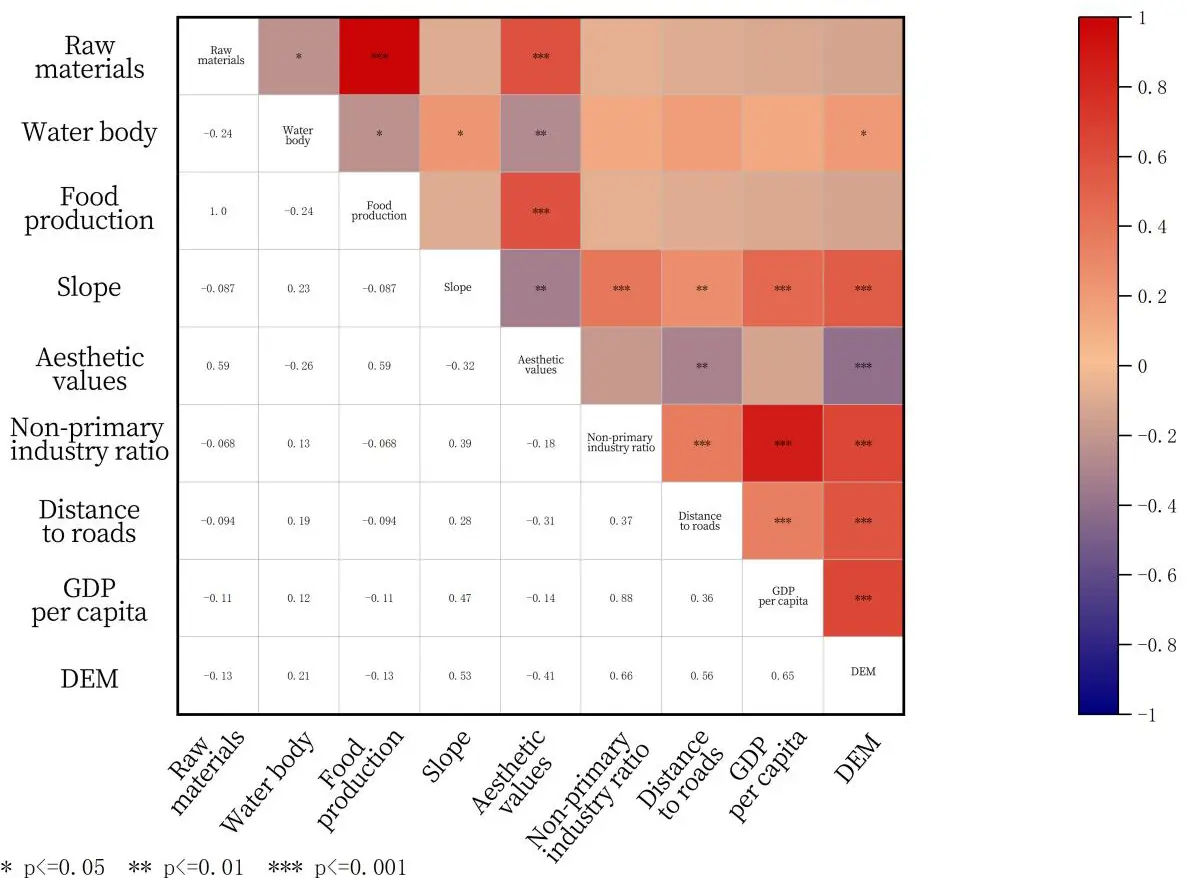
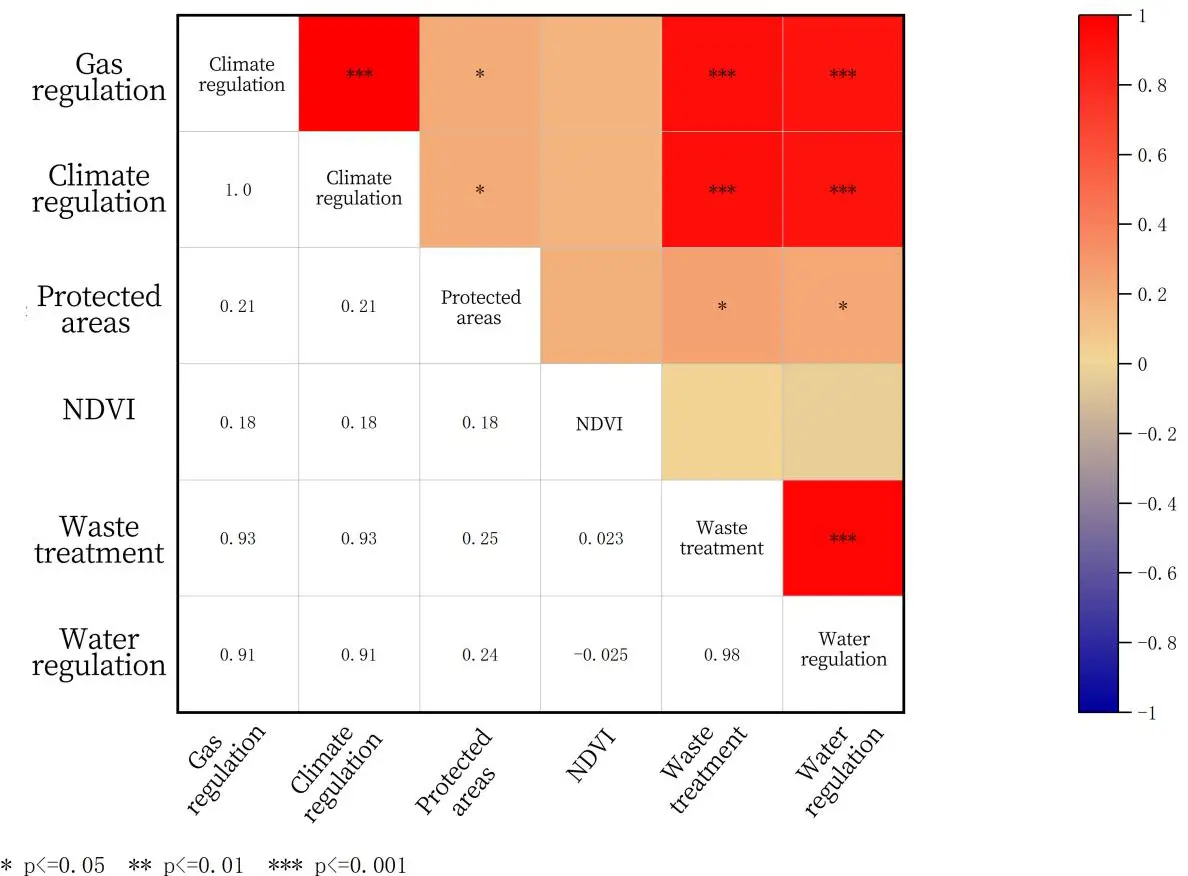
Figure 4 reports Pearson correlations among the selected indicators. Panel (a) shows economic, accessibility, topographic, and product-value indicators; panel (b) shows ecological-function indicators. Red cells indicate positive and blue cells negative associations, with darker shades indicating larger absolute coefficients. The lower triangles report Pearson r, and the upper triangles report significance. For example, per-capita GDP and the non-primary-industry ratio are strongly positively correlated (r = 0.88), while gas regulation and climate regulation are perfectly correlated in the displayed data (r = 1.00), indicating potential redundancy that requires methodological clarification. Climatic and hydrological variables are ecological drivers, not non-ecological residual factors. These correlations describe co-variation only; they do not establish that economic activity causes ecological pressure or that one class of variables is more important for policy.
 |
|
(a) |
 |
|
(b) |
Figure 4. (a) Correlation Analysis of Indicators; (b) Correlation Analysis of Indicators. The color scale ranges from −1 (blue, negative correlation) through 0 (light/neutral) to +1 (red, positive correlation); darker color indicates larger absolute correlation. Lower-triangle cells report Pearson correlation coefficients, upper-triangle cells report significance, and *, **, and *** denote p ≤ 0.05, p ≤ 0.01, and p ≤ 0.001, respectively. Diagonal cells identify variables.
3.3. Sensitivity Index Analysis
Table 7 reports elasticity-style sensitivity indices for modelled ecological-product values with respect to changes in the assigned value coefficients. Grassland has the largest index (0.581), followed by forest land (0.236), water systems (0.105), farmland (0.074), and unused land (0.003). Values below one indicate that, under this local perturbation test, proportional changes in the modelled total are smaller than proportional changes in the corresponding coefficient. They do not establish the accuracy or real-world reliability of the absolute ecological-product values, nor do they test for omitted spatial heterogeneity or the validity of the coefficient sources [45].
Table 7. Sensitivity Indices of the Value of Ecological Products in the Yellow River Basin.
|
Secondary Classification |
Sensitivity |
|---|---|
|
Farmland |
0.074 |
|
Forest Land |
0.236 |
|
Grassland |
0.581 |
|
Water System |
0.105 |
|
Unused Land |
0.003 |
3.4. Analysis on the Suitability of Realizing the Value of Ecological Products
The suitability analysis of realizing the value of ecological products in the Yellow River Basin integrates two core indicators: development potential and ecological function importance, providing a scientific basis for regional ecological development and protection. By classifying the relevant indicators using the natural break method and analyzing spatial distribution characteristics, this study identifies the suitability zones within the basin as well as the potential and limitations of their development and protection.
3.4.1. Development Potential Analysis
The development potential indicator reflects the capacity of a region to realize the value of ecological products based on its natural resources and socio-economic conditions. Development potential in the Yellow River Basin is divided into four levels—low, relatively low, relatively high, and high (Table 8(A)). Areas with low development potential account for 14.06% of the total basin area, relatively low areas for 22.33%, relatively high areas for 35.74%, and high areas for 27.87%.
From the perspective of spatial distribution (Figure 5a), areas with relatively high or high development potential are concentrated in the central and eastern parts of the basin, including urban agglomerations such as the Guanzhong Plain, Central Plains, and Shandong Peninsula city clusters. Representative cities include Jinan (score: 3.977), Dongying (score: 3.973), and Zibo (score: 3.920). These cities, with convenient transportation, strong economic foundations, and abundant resources, are well-suited for further development of ecological product value. Additionally, cities such as Wuhai and Baotou in Inner Mongolia, Yinchuan in Ningxia, Zhengzhou in Henan, and Yulin in Shaanxi also demonstrate significant development potential, reflecting their considerable advantages in resource development.
In contrast, areas with low development potential are primarily located in the western part of the basin, including Qinghai, Gansu, and western Shaanxi. These regions are characterized by alpine grassland ecosystems, limited by high altitudes, poor transportation access, and a single type of ecological resource. For instance, Yushu Tibetan Autonomous Prefecture (score: 2.302) and Golog Tibetan Autonomous Prefecture (score: 2.553) are typical examples of low-potential areas. These regions should prioritize ecological protection and gradually enhance their ecological service capacity through restoration measures, while also focusing on improving infrastructure conditions.
Table 8. Areas of Each Grade of the Development Potential, the Importance of Ecological Functions, and the Suitability of Realizing the Value of Ecological Products of 76 Cities in the Yellow River Basin.
|
Evaluation Grade |
Development Potential (A) |
Ecological Function Importance (B) |
Value Realization Suitability (C) |
|||
|---|---|---|---|---|---|---|
|
Area (hm2) |
Proportion (%) |
Area (hm2) |
Proportion (%) |
Area (hm2) |
Proportion (%) |
|
|
Low (Unsuitable Zone) |
11,356,449 |
14.06% |
5,292,731 |
6.54% |
24,462,793 |
30.28% |
|
Relatively Low (Marginally Unsuitable Zone) |
18,043,260 |
22.33% |
19,889,520 |
24.59% |
31,180,494 |
38.59% |
|
Relatively High (Marginally Suitable Zone) |
28,873,853 |
35.74% |
22,434,121 |
27.74% |
4,936,916 |
6.11% |
|
High (Suitable Zone) |
22,525,337 |
27.88% |
33,257,692 |
41.12% |
20,218,603 |
25.02% |
Figure 5 displays the spatial distribution characteristics of the three core evaluation dimensions across the Yellow River Basin.
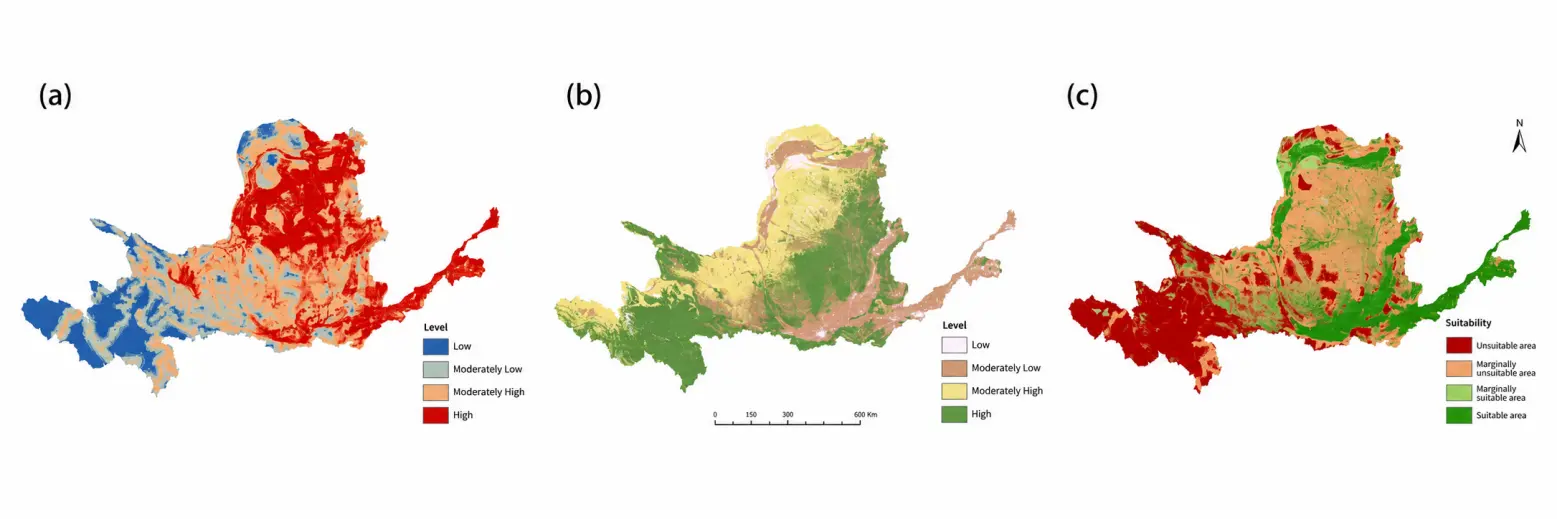
Figure 5. (a) Spatial Distribution Maps of the Development Potential, (b) the Importance of Ecological Functions, and (c) the Suitability of Realizing the Value of Ecological Products in the Yellow River Basin.
3.4.2. Ecological Function Importance Analysis
The ecological function importance indicator evaluates the contribution of a region to ecosystem services. After classification using the natural break method, areas with high or relatively high ecological function importance account for nearly 70% of the total basin area (Table 8(B)). underscoring the basin’s critical role in China’s ecological function system.
From the spatial distribution perspective (Figure 5b), areas with high ecological function importance are concentrated in the western and certain eastern parts of the basin. These regions are dominated by grasslands, forests, and shrubs, which provide significant ecological services, such as water conservation, windbreak and sand fixation, and climate regulation. Representative areas include the Aba Tibetan and Qiang Autonomous Prefecture (score: 3.513), Huangnan Tibetan Autonomous Prefecture (score: 3.477), and Gannan Tibetan Autonomous Prefecture (score: 3.390), which form the core ecological security barrier of the basin.
In contrast, areas with low ecological function importance are mainly distributed in the southern, central, and estuarine regions of the basin. These areas are characterized by a single land use type, primarily cropland and forestland, with weaker ecosystem service functions. Examples include Zhengzhou (score: 1.972), Dongying (score: 2.017), and Zhangye (score: 1.006). For these low-function areas, it is recommended to optimize land use practices, increase forest and shrubland coverage, and strengthen ecological restoration and protection to enhance their ecosystem service capabilities.
3.4.3. Suitability Analysis for Value Realization
The value realization suitability indicator integrates development potential and the importance of ecological functions to assess the feasibility of realizing the value of ecological products in a given region. Suitability zones are classified into four categories based on the relationship between development potential and the importance of ecological functions: suitable, marginally suitable, marginally unsuitable, and unsuitable areas (Table 8(C)). Among these, suitable areas account for 25.02% of the total basin area, marginally suitable areas for 6.11%, marginally unsuitable areas for 38.59%, and unsuitable areas for 30.28%.
Figure 5c shows suitable and marginally suitable areas concentrated mainly in the central and lower reaches, including Yuncheng, Weinan, and Bayannur. Their higher development capacity may support low-impact certification, ecological agriculture, service platforms, or restoration finance. The classification does not imply low ecological value or permit unconstrained industrial expansion. Any initiative must maintain ecological baselines, comply with land and water constraints, and be withdrawn or adjusted if monitoring shows degradation.
In contrast, unsuitable and marginally suitable areas are concentrated in the western part of the basin, including Golog Tibetan Autonomous Prefecture and Yushu Tibetan Autonomous Prefecture in Qinghai, as well as Ordos and Baotou in Inner Mongolia. While some of these areas exhibit relatively high development potential, they also demonstrate high ecological function importance, necessitating prioritization of protection measures to avoid further damage to fragile ecosystems.
The suitability analysis identifies spatial differences in capacity and ecological constraints. Central and lower-reach cities generally have greater organizational and market capacity, while many western headwater and grassland regions have higher ecological-function importance. Ecological civilization should not preserve this separation as a development-versus-conservation binary. It requires low-impact value-realization instruments in higher-capacity areas, protection and restoration where ecological importance is high, and compensation and benefit-sharing between beneficiary and provider regions. The matrix therefore guides differentiated responsibilities rather than assigning development rights.
Figure 6 compares the average development potential and ecological-function importance scores across the 76 cities in the Yellow River Basin.
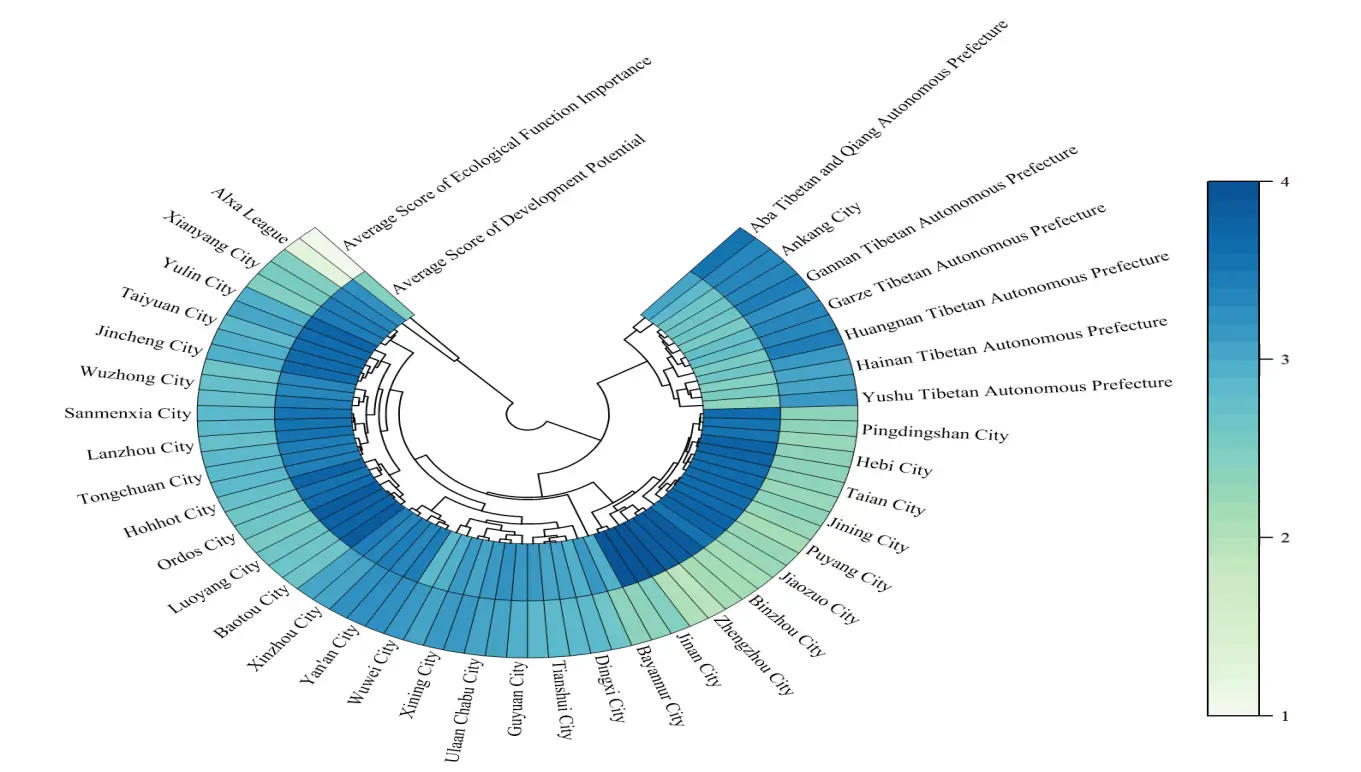
Figure 6. Average Scores of the Development Potential and the Importance of Ecological Functions of 76 Cities in the Yellow River Basin.
Figure 7 summarizes the proportions of areas with high values for development potential and ecological-function importance across the 76 cities.
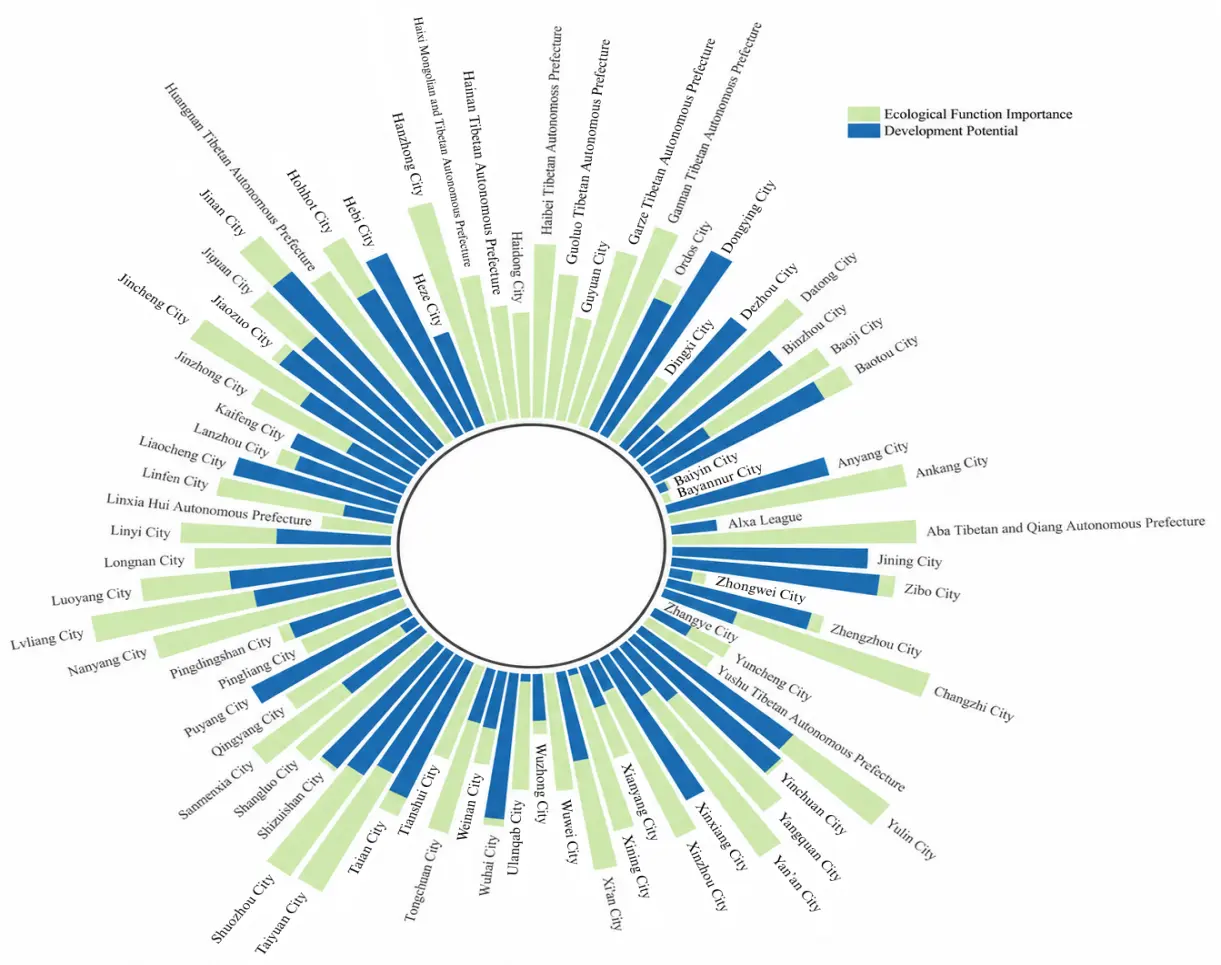
Figure 7. Proportions of the Areas of High Values of the Development Potential and the Importance of Ecological Functions of 76 Cities in the Yellow River Basin in the Yellow River Basin.
3.5. Configuration of the Paths for Realizing the Value of Ecological Products
To promote the realization of ecological product value in the Yellow River Basin, differentiated strategies must be developed based on regional characteristics. This section proposes four specific pathways tailored to the suitability of different regions, aiming to balance ecological protection and sustainable development.
3.5.1. Advancing Ecologically Safeguarded Green Industrial Transformation in Suitable Zones
Suitable zones, characterized by high development potential and relatively low ecological sensitivity, should prioritize green industrial transformation through three mechanisms. First, carbon-sink trading could be piloted in agricultural areas such as Yuncheng and Weinan, subject to verified additionality, monitoring, and market eligibility. Second, eco-labeling and certification programs could be developed for regional agricultural products, drawing on documented programs in comparable Chinese regions. Third, eco-tourism corridors could connect cultural heritage sites with natural landscapes where ecological carrying-capacity safeguards are in place. Implementation would require location-specific feasibility studies, institutional responsibilities, financing arrangements, and monitoring rules.
Critical safeguards must accompany these initiatives: projects must comply with statutory ecological redlines and water constraints; preserve ecological corridors and habitat connectivity; demonstrate additionality and avoid displacement of impacts; establish baseline indicators before implementation; and use periodic monitoring with corrective or exit rules when ecological conditions deteriorate. These safeguards define green industrial transformation as ecological and developmental rather than conventional expansion.
3.5.2. Restoring Ecosystems and Acting as Reserves for Ecological Products in Marginally Suitable Areas
Marginally suitable areas are interspersed among marginally unsuitable and unsuitable regions in Inner Mongolia, Qinghai, Shaanxi, and Ningxia. Many contain desertified or otherwise fragile land [46,47], so restoration should precede value-realization activity. Livelihood initiatives should be limited to practices compatible with restoration objectives, monitored ecological capacity, and local participation. A restoration-benefit evaluation system should track ecological recovery and the distribution of benefits [48].
3.5.3. Prioritizing Protection and Locally Appropriate Livelihoods in Marginally Unsuitable Areas
In marginally unsuitable areas, including parts of Shanxi, Shaanxi, and Ningxia, ecological protection is the primary objective. Any livelihood or value-realization activity must be compatible with local water availability, restoration targets, and ecological carrying capacity. Deforestation, inappropriate reclamation, overgrazing, and water-intensive expansion should be prohibited or tightly controlled. Compensation, restoration employment, and verified low-impact products should be favored over new intensive development.
3.5.4. Strengthening Ecological Compensation Mechanisms in Unsuitable Zones
Unsuitable zones, primarily located in Qinghai’s Sanjiangyuan region and Gansu’s Qilian Mountain areas, serve as critical ecological security barriers for the basin and must be strictly protected from intensive development. A tiered ecological-compensation framework could differentiate support by ecosystem-service type and locally verified opportunity costs. Compensation standards should be calibrated using documented forgone livelihood revenues, replacement costs, ecosystem-service contributions, existing program rules, and community participation. Specific rates require dedicated feasibility analysis and are therefore not estimated in this study.
Funding mechanisms should follow the beneficiary-pays principle. Downstream cities benefiting from water provision services—including Lanzhou (population 3.3 million), Xi’an (12.9 million), and Zhengzhou (12.6 million)—should contribute through inter-provincial fiscal transfers. Based on household willingness-to-pay surveys in similar contexts, a levy of USD 2–5 per capita annually could generate USD 60–150 million for upstream compensation, sufficient to cover protection costs while providing livelihood support for 2.3 million pastoral residents in unsuitable zones [6,49].
The differentiated pathways are intended to connect ecological protection with locally appropriate benefits rather than convert all ecological functions into market commodities. Green industry, restoration, protection, and compensation have different roles across the matrix, but each requires ecological baselines, monitoring, participation, and institutional accountability. This interpretation aligns the spatial framework with the broader ecological-civilization objective of coordinating environmental integrity, livelihoods, cultural values, and governance.
4. Discussion
4.1. Theoretical Contributions and Comparison with Existing Approaches
This study links ecological-product accounting with a two-dimensional spatial diagnosis. Yellow River Basin valuation studies by Zhang et al. and Zhu et al. quantify ecosystem-service values [21,25], while land, vulnerability, and restoration-suitability studies by Wang et al. and Chen et al. demonstrate spatial and MCDA applications [30,33]. Additional MCDA and spatial-planning literature explains how multiple criteria can support land decisions [27,28,29]. A single aggregated score may conceal whether a result arises from development capacity or ecological importance. Retaining the two dimensions makes the tension visible but does not automatically resolve normative choices; ecological thresholds, local participation, and implementation evidence remain necessary.
The reported negative association (−0.73) between the composite development-capacity and ecological-function-importance scores describes a spatial pattern across the sampled cities; it does not demonstrate that economic activity causes ecological decline. High-altitude and headwater regions tend to combine strong ecological functions with limited accessibility and market capacity, whereas several central and lower-reach cities show the reverse pattern. Ecological civilization should address this spatial sorting through safeguards, restoration, compensation, and cross-regional benefit sharing rather than accept a permanent development-conservation divide. Regulating-service values account for a large share of the modeled total, but their monetized estimates and market realizations should be interpreted with caution given the equivalent-factor limitations.
4.2. Methodological Considerations and Limitations
Several methodological limitations warrant discussion. First, CRITIC provides reproducible statistical weights but cannot represent local priorities, cultural values, distributional impacts, or community knowledge. Its contrast and correlation measures are sensitive to indicator definitions, normalization, sample composition, outliers, and spatial scale. Carbon sequestration or biodiversity may support both conservation and livelihood goals, yet CRITIC cannot determine the preferred balance. The weights should therefore be treated as descriptive inputs and validated through sensitivity analysis and participatory deliberation with affected communities, local managers, and public decision makers rather than adjusted only by external experts.
Second, the equivalent factor method for ecosystem service valuation assumes spatial homogeneity within land use categories—an assumption that is clearly violated across the basin’s diverse conditions. Alpine grasslands in Qinghai provide fundamentally different services than temperate grasslands in Inner Mongolia, yet our valuation treats them identically. While we partially addressed this through city-level coefficient adjustments, spatially explicit biophysical modeling (e.g., InVEST, ARIES) would provide more accurate service estimates. However, such models require detailed input data that are often unavailable at the basin scale, creating a trade-off between precision and feasibility.
Third, our analysis relies on 2020 cross-sectional data, preventing assessment of temporal dynamics. Ecosystem services and development pressures evolve over time; a region classified as “suitable” today may become ecologically stressed under continued development. Longitudinal analysis incorporating land use change projections and climate scenarios would strengthen the framework’s policy relevance.
Fourth, our analysis uses administrative boundaries (cities) rather than ecological boundaries (watersheds, ecoregions). This choice was motivated by policy applicability—ecological product value realization policies are implemented through administrative governance structures, making city-level assessment directly relevant for policy design and implementation. However, ecological processes do not respect administrative boundaries; a city may span multiple ecoregions with distinct service provision characteristics. Future studies could adopt hybrid approaches using sub-watershed units nested within administrative boundaries to better capture ecological heterogeneity while maintaining policy relevance.
4.3. Policy Implications
The four zones provide differentiated responsibilities, not a hierarchy of places. Suitable zones (25.02%) represent conditional opportunities for low-impact instruments where ecological baselines and water constraints are respected. The combined share of marginally unsuitable (38.59%) and unsuitable zones (30.28%) indicates that protection, restoration, and compensation must dominate across most of the basin. Ecology-first safeguards apply in every zone, including locations with lower relative ecological-function-importance scores.
The proposed differentiated pathways move beyond generic recommendations by linking suitability categories to specific policy instruments. However, implementation will require institutional innovations, particularly for cross-provincial ecological compensation. The beneficiary-pays mechanisms we propose require coordination among nine provincial governments with divergent interests—a governance challenge that technical frameworks alone cannot resolve.
4.4. Future Research Direction
Future research should prioritize participatory assessment with affected communities, including distributional impacts, cultural attachment, livelihood expectations, and local ecological knowledge. Longitudinal tracking should compare assessed suitability with observed land-use change and value-realization outcomes. Comparative applications in the Yangtze, Pearl, and Hai river basins could test which components are transferable and which require institutional adaptation. Climate scenarios and nested watershed-administrative units would improve long-term ecological relevance.
5. Conclusions
This study assessed ecological-product value-realization suitability across 76 Yellow River Basin cities using separate development-capacity and ecological-function-importance dimensions. The estimated 2020 ecological-product value is illustrative because it depends on equivalent factors and city-level grain-based adjustments. Four zones were identified: suitable (25.02%), marginally suitable (6.11%), marginally unsuitable (38.59%), and unsuitable (30.28%). These labels describe conditional feasibility for ecological-product instruments, not permission for conventional development. The observed negative association between the composite dimensions is interpreted as spatial sorting rather than causation. The principal policy implication is differentiated responsibility: ecological safeguards in all zones, low-impact instruments where capacity exists, and protection, restoration, and compensation where ecological importance is high.
The framework offers a transparent spatial screening structure but does not constitute a complete ecological-civilization assessment. Social equity, health, education, cultural attachment, participation, governance capacity, temporal change, and biophysical service modelling require additional evidence. Future applications should combine spatial indicators with participatory assessment, longitudinal validation, climate scenarios, and nested watershed-administrative analysis before policy implementation. Accordingly, the present results support hypothesis generation and differentiated planning discussion rather than definitive investment or development decisions.
Statement of the Use of Generative AI and AI-Assisted Technologies in the Writing Process
During the preparation of this manuscript, the authors used ChatGPT to improve the readability and linguistic clarity of the manuscript. After using this service, the authors reviewed and edited the content as needed and take full responsibility for the content of the published article.
Acknowledgments
The author is grateful to the Faculty of Science, Hong Kong Baptist University for the academic support, and to herself for her dedicated efforts throughout this study.
Ethics Statement
Not applicable.
Informed Consent Statement
Not applicable.
Data Availability Statement
Data available on request/reasonable request.
Funding
This research was funded by the Major Program of the National Social Science Foundation of China, entitled “Innovation and Policy Research on Agricultural Green Development System under the ‘Dual Carbon’ Goals” (Grant No. 22&ZD083).
Declaration of Competing Interest
The author declares that she has no known competing financial interests or personal relationships that could have appeared to influence the work reported in this paper.This research received no external funding.
References
- Costanza R, de Groot R, Sutton P, van der Ploeg S, Anderson SJ, Kubiszewski I, et al. Changes in the global value of ecosystem services. Glob. Environ. Change 2014, 26, 152–158. DOI:10.1016/j.gloenvcha.2014.04.002 [Google Scholar]
- Huang Z, Wei W, Han Y, Ding S, Tang K. The Coupling Coordination Evolutionary Analysis of Tourism-Ecological Environment-Public Service for the Yellow River Basin of China. Int. J. Environ. Res. Public Health 2022, 19, 9315. DOI:10.3390/ijerph19159315 [Google Scholar]
- Ben F, Li Z, Sun J, Wang H, Zhao X. Ecological product value accounting and analyst behavior. Int. Rev. Financ. Anal. 2024, 94, 103273. DOI:10.1016/j.irfa.2024.103273 [Google Scholar]
- Wang Y, Shataer R, Zhang Z, Zhen H, Xia T. Evaluation and Analysis of Influencing Factors of Ecosystem Service Value Change in Xinjiang under Different Land Use Types. Water 2022, 14, 1424. DOI:10.3390/w14091424 [Google Scholar]
- Liu J, Su X, Liu Y, Shui W. A Review of Research on Progress in the Theory and Practice of Eco-Product Value Realization. Land 2024, 13, 316. DOI:10.3390/land13030316 [Google Scholar]
- Yang B, Zhang Y, Xiong K, Huang H, Yang Y. A Review of Eco-Product Value Realization and Eco-Industry with Enlightenment toward the Forest Ecosystem Services in Karst Ecological Restoration. Forests 2023, 14, 729. DOI:10.3390/f14040729 [Google Scholar]
- Feng H, Lei X, Yu G, Zhang C. Spatio-temporal evolution and trend prediction of urban ecosystem service value based on CLUE-S and GM (1,1) compound model. Environ. Monit. Assess. 2023, 195, 1282. DOI:10.1007/s10661-023-11853-y [Google Scholar]
- Liu G, Yang Z, Chen B, Zhang J, Liu X, Zhang Y, et al. Scenarios for sewage sludge reduction and reuse in clinker production towards regional eco-industrial development: A comparative emergy-based assessment. J. Clean. Prod. 2015, 103, 371–383. DOI:10.1016/j.jclepro.2014.09.003 [Google Scholar]
- Yang Y, Xiong K, Huang H, Xiao J, Yang B, Zhang Y. A Commented Review of Eco-Product Value Realization and Ecological Industry and Its Enlightenment for Agroforestry Ecosystem Services in the Karst Ecological Restoration. Forests 2023, 14, 448. DOI:10.3390/f14030448 [Google Scholar]
- Rong L, Zhang B, Qiu H, Zhang H, Yu J, Yuan Q, et al. Significant generational effects of tetracyclines upon the promoting plasmid-mediated conjugative transfer between typical wastewater bacteria and its mechanisms. Water Res. 2025, 287, 124290. DOI:10.1016/j.watres.2025.124290 [Google Scholar]
- Du W, Yan H, Feng Z, Yang Z, Yang Y. The external dependence of ecological products: Spatial-temporal features and future predictions. J. Environ. Manag. 2022, 304, 114190. DOI:10.1016/j.jenvman.2021.114190 [Google Scholar]
- Huang Y, Ma R, Zhou W, Yuan Y, Ren J, Cao Y. Risk assessment and regulation between the supply and demand of ecological products: A comprehensive framework and case study. Ecol. Indic. 2023, 154, 110617. DOI:10.1016/j.ecolind.2023.110617 [Google Scholar]
- Xu D, Wang Y, Wu L, Zhang W. Evaluation of the Degree of the Value Realization of Ecological Products of the Forest Ecological Bank in Shunchang County. Forests 2023, 14, 2269. DOI:10.3390/f14112269 [Google Scholar]
- Zhang Z, Xiong K, Chang H, Zhang W, Huang D. A Review of Eco-Product Value Realization and Ecological Civilization and Its Enlightenment to Karst Protected Areas. Int. J. Environ. Res. Public Health 2022, 19, 5892. DOI:10.3390/ijerph19105892 [Google Scholar]
- Chen Q, Li Z, Xie H, Wu M, Pan Y, Luo S. How can ecological product value realization contribute to landscape sustainability? Landsc. Ecol. 2024, 39, 15. DOI:10.1007/s10980-024-01802-6 [Google Scholar]
- Wang N, Xu C, Kong F. Value Realization and Optimization Path of Forest Ecological Products—Case Study from Zhejiang Province, China. Int. J. Environ. Res. Public Health 2022, 19, 7538. DOI:10.3390/ijerph19127538 [Google Scholar]
- Lou J, Yang GL, Song L, Liu KD. From resources to capital: Investigating the efficiency of forest ecosystem products value realization in China. Socio-Econ. Plan. Sci. 2024, 96, 102052. DOI:10.1016/j.seps.2024.102052 [Google Scholar]
- Xie X, Chen S, Zhao R. A Preliminary Evaluation of the Effectiveness of Ecological Product Value Realization in China Based on the DPSIR Model. Sustainability 2023, 15, 15572. DOI:10.3390/su152115572 [Google Scholar]
- Yu H, Shao C, Wang X, Hao C. Transformation Path of Ecological Product Value and Efficiency Evaluation: The Case of the Qilihai Wetland in Tianjin. Int. J. Environ. Res. Public Health 2022, 19, 14575. DOI:10.3390/ijerph192114575 [Google Scholar]
- Zhang Q, Shen X, Shen C, Chen Y, Su B, Yin Q, et al. Integration of land ecological consolidation and ecosystem product value realization: A case from the Yangtze riverside industrial park in Changzhou, China. J. Environ. Manag. 2024, 353, 120120. DOI:10.1016/j.jenvman.2024.120120 [Google Scholar]
- Zhang Y, Ma Z, Sun M, Song J, Yang Y, Li Q, et al. Quantitatively Evaluating the Ecological Product Value of Nine Provinces in the Yellow River Basin from the Perspective of the Dual-Carbon Strategy. Land 2023, 12, 516. DOI:10.3390/land12020516 [Google Scholar]
- Xu X, Yang G, Tan Y, Zhuang Q, Li H, Wan R, et al. Ecological risk assessment of ecosystem services in the Taihu Lake Basin of China from 1985 to 2020. Sci. Total Environ. 2016, 554–555, 7–16. DOI:10.1016/j.scitotenv.2016.02.120 [Google Scholar]
- Li L, Fan Z, Xiong K, Shen H, Guo Q, Dan W, et al. Current situation and prospects of the studies of ecological industries and ecological products in eco-fragile areas. Environ. Res. 2021, 201, 111613. DOI:10.1016/j.envres.2021.111613 [Google Scholar]
- Li T, Zhang Q, Wang G, Singh VP, Zhao J, Sun S, et al. Ecological degradation in the Inner Mongolia reach of the Yellow River Basin, China: Spatiotemporal patterns and driving factors. Ecol. Indic. 2023, 154, 110498. DOI:10.1016/j.ecolind.2023.110498 [Google Scholar]
- Zhu M, Zhang X, Elahi E, Fan B, Khalid Z. Assessing ecological product values in the Yellow River Basin: Factors, trends, and strategies for sustainable development. Ecol. Indic. 2024, 160, 111708. DOI:10.1016/j.ecolind.2024.111708 [Google Scholar]
- Zhang Z, Xiong K, Huang D, Zhang W, Chang H. Spatial Zoning of the Value Realization Models for Ecological Products in Shibing Karst Natural World Heritage Site. Forests 2023, 14, 1449. DOI:10.3390/f14071449 [Google Scholar]
- Baral H, Keenan RJ, Stork NE, Kasel S. Measuring and managing ecosystem goods and services in changing landscapes: a south-east Australian perspective. J. Environ. Plan. Manag. 2014, 57, 961–983. DOI:10.1080/09640568.2013.824872 [Google Scholar]
- Karadeniz E, Sekeroglu A, Kaya AY, Zhang M, Adiguzel F. A spatial planning approach for the sustainability of provisioning ecosystem services with economic value: The case of Türkiye. J. Environ. Manag. 2026, 399, 128652. DOI:10.1016/j.jenvman.2026.128652 [Google Scholar]
- Malczewski J. GIS‐based multicriteria decision analysis: A survey of the literature. Int. J. Geogr. Inf. Sci. 2006, 20, 703–726. DOI:10.1080/13658810600661508 [Google Scholar]
- Chen M, Zeng L, Huang Z, Lei L, Shen Y, Xiao W. Evaluating suitability of land for forest landscape restoration: A case study of Three Gorges Reservoir, China. Ecol. Indic. 2021, 127, 107765. DOI:10.1016/j.ecolind.2021.107765 [Google Scholar]
- He S, Ding L, Xiong Z, Spicer RA, Farnsworth A, Valdes PJ, et al. A distinctive Eocene Asian monsoon and modern biodiversity resulted from the rise of eastern Tibet. Sci. Bull. 2022, 67, 2245–2258. DOI:10.1016/j.scib.2022.10.006 [Google Scholar]
- Wang DG, Han FJ, Shen G, Tan YH, Lv DA. Study on the Driving Mechanism of Ecosystem Service Value on Ximen Island Based on STIRPAT Model. E3S Web Conf. 2018, 53, 03036. DOI:10.1051/e3sconf/20185303036 [Google Scholar]
- Zhang X, Liu K, Wang S, Wu T, Li X, Wang J, et al. Spatiotemporal evolution of ecological vulnerability in the Yellow River Basin under ecological restoration initiatives. Ecol. Indic. 2022, 135, 108586. DOI:10.1016/j.ecolind.2022.108586 [Google Scholar]
- Cuo L, Zhang Y, Gao Y, Hao Z, Cairang L. The impacts of climate change and land cover/use transition on the hydrology in the upper Yellow River Basin, China. J. Hydrol. 2013, 502, 37–52. DOI:10.1016/j.jhydrol.2013.08.003 [Google Scholar]
- Xie X, Chen S, Zhao R. An Index System for the Evaluation of the Effectiveness of Forest Ecological Product Value Realization in China. Forests 2024, 15, 1236. DOI:10.3390/f15071236 [Google Scholar]
- Chang H, Xiong K, Zhu D, Zhang Z, Zhang W. Ecosystem Services Value Realization and Ecological Industry Design in Scenic Areas of Karst in South China. Forests 2024, 15, 363. DOI:10.3390/f15020363 [Google Scholar]
- Wang S, Song Q, Zhao J, Lu Z, Zhang H. Identification of Key Areas and Early-Warning Points for Ecological Protection and Restoration in the Yellow River Source Area Based on Ecological Security Pattern. Land 2023, 12, 1643. DOI:10.3390/land12081643 [Google Scholar]
- Wang K, Liu P, Sun F, Wang S, Zhang G, Zhang T, et al. Progress in Realizing the Value of Ecological Products in China and Its Practice in Shandong Province. Sustainability 2023, 15, 9480. DOI:10.3390/su15129480 [Google Scholar]
- Wang Y, Liu G, Cai Y, Giannetti BF, Agostinho F, Almeida CMVB, et al. The Ecological Value of Typical Agricultural Products: An Emergy-Based Life-Cycle Assessment Framework. Front. Environ. Sci. 2022, 10, 824275. DOI:10.3389/fenvs.2022.824275 [Google Scholar]
- Lu C, Liu W, Huang P, Wang Y, Tang X. Effect of Energy Utilization and Economic Growth on the Ecological Environment in the Yellow River Basin. Int. J. Environ. Res. Public Health 2023, 20, 2345. DOI:10.3390/ijerph20032345 [Google Scholar]
- Song M, Du J. Mechanisms for realizing the ecological products value: Green finance intervention and support. Int. J. Prod. Econ. 2024, 271, 109210. DOI:10.1016/j.ijpe.2024.109210 [Google Scholar]
- Pan X, Huang X, Deng N. Short-Chain Carboxylic Acids Influencing Mineralization Mechanisms of Ferrihydrite Transformation to Hematite and Goethite. Environ. Sci. Technol. 2025, 59, 12910–12919. DOI:10.1021/acs.est.5c00455 [Google Scholar]
- Kreuter UP, Harris HG, Matlock MD, Lacey RE. Change in ecosystem service values in the San Antonio area, Texas. Ecol. Econ. 2001, 39, 333–346. DOI:10.1016/S0921-8009(01)00250-6 [Google Scholar]
- Liu S, Dong Y, Liu H, Wang F, Yu L. Review of Valuation of Forest Ecosystem Services and Realization Approaches in China. Land 2023, 12, 1102. DOI:10.3390/land12051102 [Google Scholar]
- Aschonitis VG, Gaglio M, Castaldelli G, Fano EA. Criticism on elasticity-sensitivity coefficient for assessing the robustness and sensitivity of ecosystem services values. Ecosyst. Serv. 2016, 20, 66–68. DOI:10.1016/j.ecoser.2016.07.004 [Google Scholar]
- Shen H, Liu Z, Xiong K, Li L. A Study Revelation on Market and Value-Realization of Ecological Product to the Control of Rocky Desertification in South China Karst. Sustainability 2022, 14, 3060. DOI:10.3390/su14053060 [Google Scholar]
- Hou K, Li X, Zhang J. GIS Analysis of Changes in Ecological Vulnerability Using a SPCA Model in the Loess Plateau of Northern Shaanxi, China. Int. J. Environ. Res. Public Health 2015, 12, 4292–4305. DOI:10.3390/ijerph120404292 [Google Scholar]
- Zhang W, Xu D. Benefits evaluation of ecological restoration projects based on value realization of ecological products. J. Environ. Manag. 2024, 352, 120139. DOI:10.1016/j.jenvman.2024.120139 [Google Scholar]
- Mei H, Haozhe Y. Wetland Dynamic and Ecological Compensation of the Yellow River Delta based on RS. Energy Procedia 2016, 104, 129–134. DOI:10.1016/j.egypro.2016.12.023 [Google Scholar]