
Development of a Hand Spasticity Testing Device for Quantitative Wrist Spasticity Assessment and Automated Evaluation of the Modified Tardieu Scale
Development of a Hand Spasticity Testing Device for Quantitative Wrist Spasticity Assessment and Automated Evaluation of the Modified Tardieu Scale
Ryoya Shibasaka 1,* Yoshifumi Morita 1 Hirofumi Tanabe 2 Igor Zubrycki 3 Grzegorz Granosik 3 Klaudia Marek 4 Elzbieta Miller 4
Received: 02 December 2025 Revised: 11 May 2026 Accepted: 17 June 2026 Published: 07 July 2026

© 2026 The authors. This is an open access article under the Creative Commons Attribution 4.0 International License (https://creativecommons.org/licenses/by/4.0/).
Graphical Abstract
1. Introduction
According to the Global Burden of Disease 2021 [1] and the World Stroke Organization Fact Sheet 2025 [2], approximately 94 million people were living with the effects of stroke worldwide in 2021, with about 12 million new strokes occurring that year. Spasticity is a common sequela of stroke, defined by Lance [3] as “a motor disorder characterized by a velocity-dependent increase in tonic stretch reflexes (muscle tone) with exaggerated tendon jerks resulting from hyperexcitability of the stretch reflex, as one component of the upper motor neuron syndrome”. Spasticity can severely impair activities of daily living and gait function, thereby reducing health-related quality of life [4,5]. In addition, spasticity-related pain and restricted joint motion may lead to secondary muscle weakness and joint contractures, negatively affecting long-term prognosis. Therefore, accurate spasticity assessment is essential for planning effective rehabilitation strategies tailored to individual patients.
Currently, spasticity is typically assessed in clinical settings using the Modified Ashworth Scale (MAS) and Modified Tardieu Scale (MTS). The MAS, originally developed by Ashworth in 1964 [6] and later modified by Bohannon and Smith [7], evaluates perceived resistance during passive movement on a six-point ordinal scale (0, 1, 1+, 2, 3, 4). The MTS, proposed by Tardieu et al. [8], was subsequently refined by the addition of range-of-motion measurements by Held and Pierrot-Deseilligny [9] and further modified by Boyd and Graham [10]. In the MTS, spasticity is assessed based on two parameters: joint angle and Quality of Muscle Reaction (QMR) during passive movement. Both the MAS and MTS demonstrate good intra-rater reliability [11,12]; however, their inter-rater reliability remains inconsistent across studies [13,14,15]. These findings suggest that, despite the clinical importance of accurately assessing spasticity, achieving reliable and quantitative evaluation remains challenging.
In recent years, researchers have sought to enhance the objectivity of spasticity assessment using force sensors, inertial measurement units (IMUs), and electromyography (EMG). Yamaguchi et al. [16] demonstrated that a device composed of a dynamometer and angular velocity sensors enabled high-precision evaluation of spasticity. Ahmad Puzi et al. [17] quantified MAS scores by applying machine learning techniques to elbow joint angle and resistance torque data. Choi et al. [18] reported that visual biofeedback using IMU and EMG signals improved the accuracy and reliability of lower-limb MTS assessments in children with cerebral palsy. Although several studies have explored automation of MAS scoring, research on automated evaluation of the MTS remains limited. The MTS comprises two components: joint angle and QMR. While joint angle is quantitatively measurable, QMR depends on the subjective judgment of the examiner, making objective evaluation difficult. Therefore, this study focuses on QMR to address this challenge.
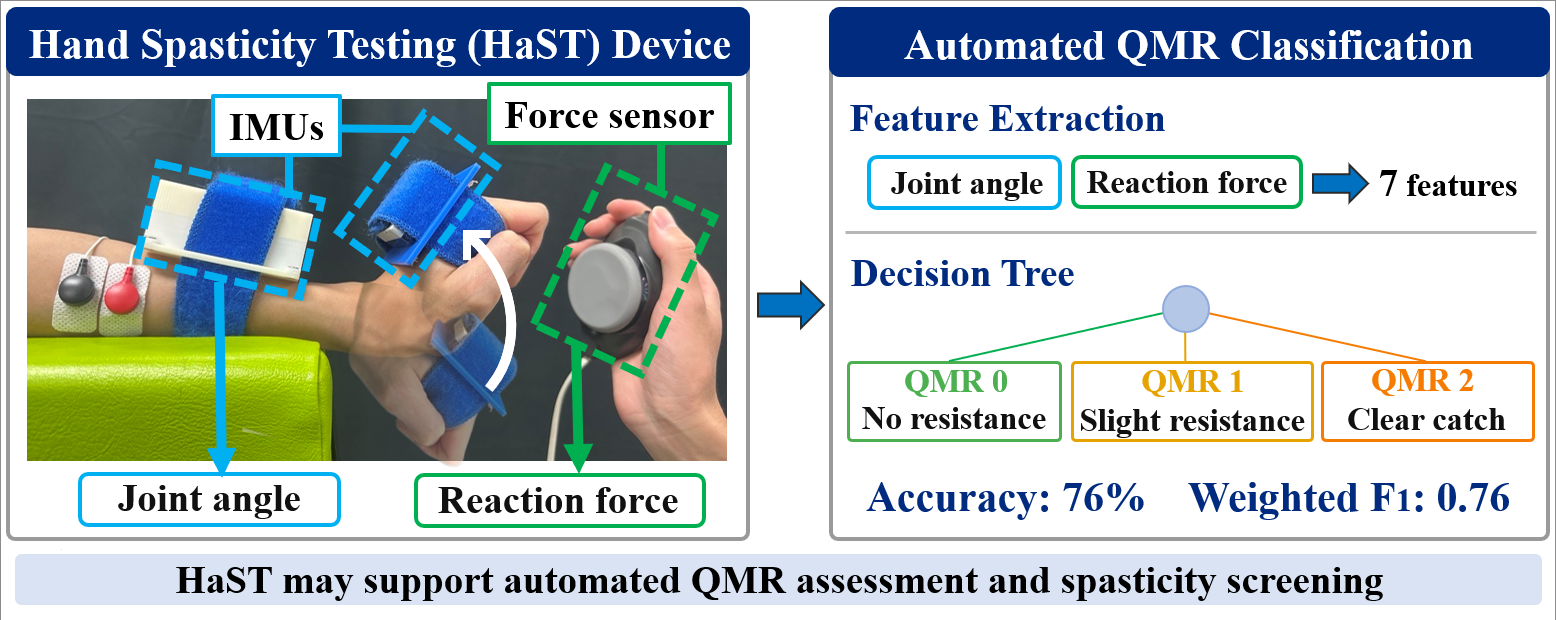
This study aimed to develop a novel Hand Spasticity Testing (HaST) device that enables objective and automated evaluation of the MTS. The device integrates multiple sensors to record joint angles, EMG signals, and examiner-applied forces, while a decision tree–based algorithm automatically classifies the QMR. The principal novelty of this work is threefold: (i) to the best of our knowledge, this is the first study to automate QMR scoring, as opposed to joint angle measurement alone, within the MTS framework for the wrist joint; (ii) the HaST device uniquely instruments the examiner’s tactile perception via a handheld force sensor, bridging the gap between subjective assessment and objective measurement; and (iii) the wireless, wearable design enables bedside clinical use without constraining the standard MTS posture.
The functional requirements of the HaST device were defined in consultation with the clinical co-authors. The key requirements were: (1) portability and wireless operation to enable bedside use in rehabilitation wards; (2) joint-angle estimation accuracy within 5° RMSE, verified against an optical motion capture reference; (3) simultaneous measurement of joint kinematics, examiner-applied force, and EMG; and (4) automated classification output that does not require real-time interpretation. These requirements informed the sensor selection and system architecture described in the following sections. Unlike joint angle measurement, QMR assessment depends strongly on the examiner’s tactile perception during rapid passive movement, making objective quantification substantially more difficult.
2. Materials and Methods
2.1. HaST Device
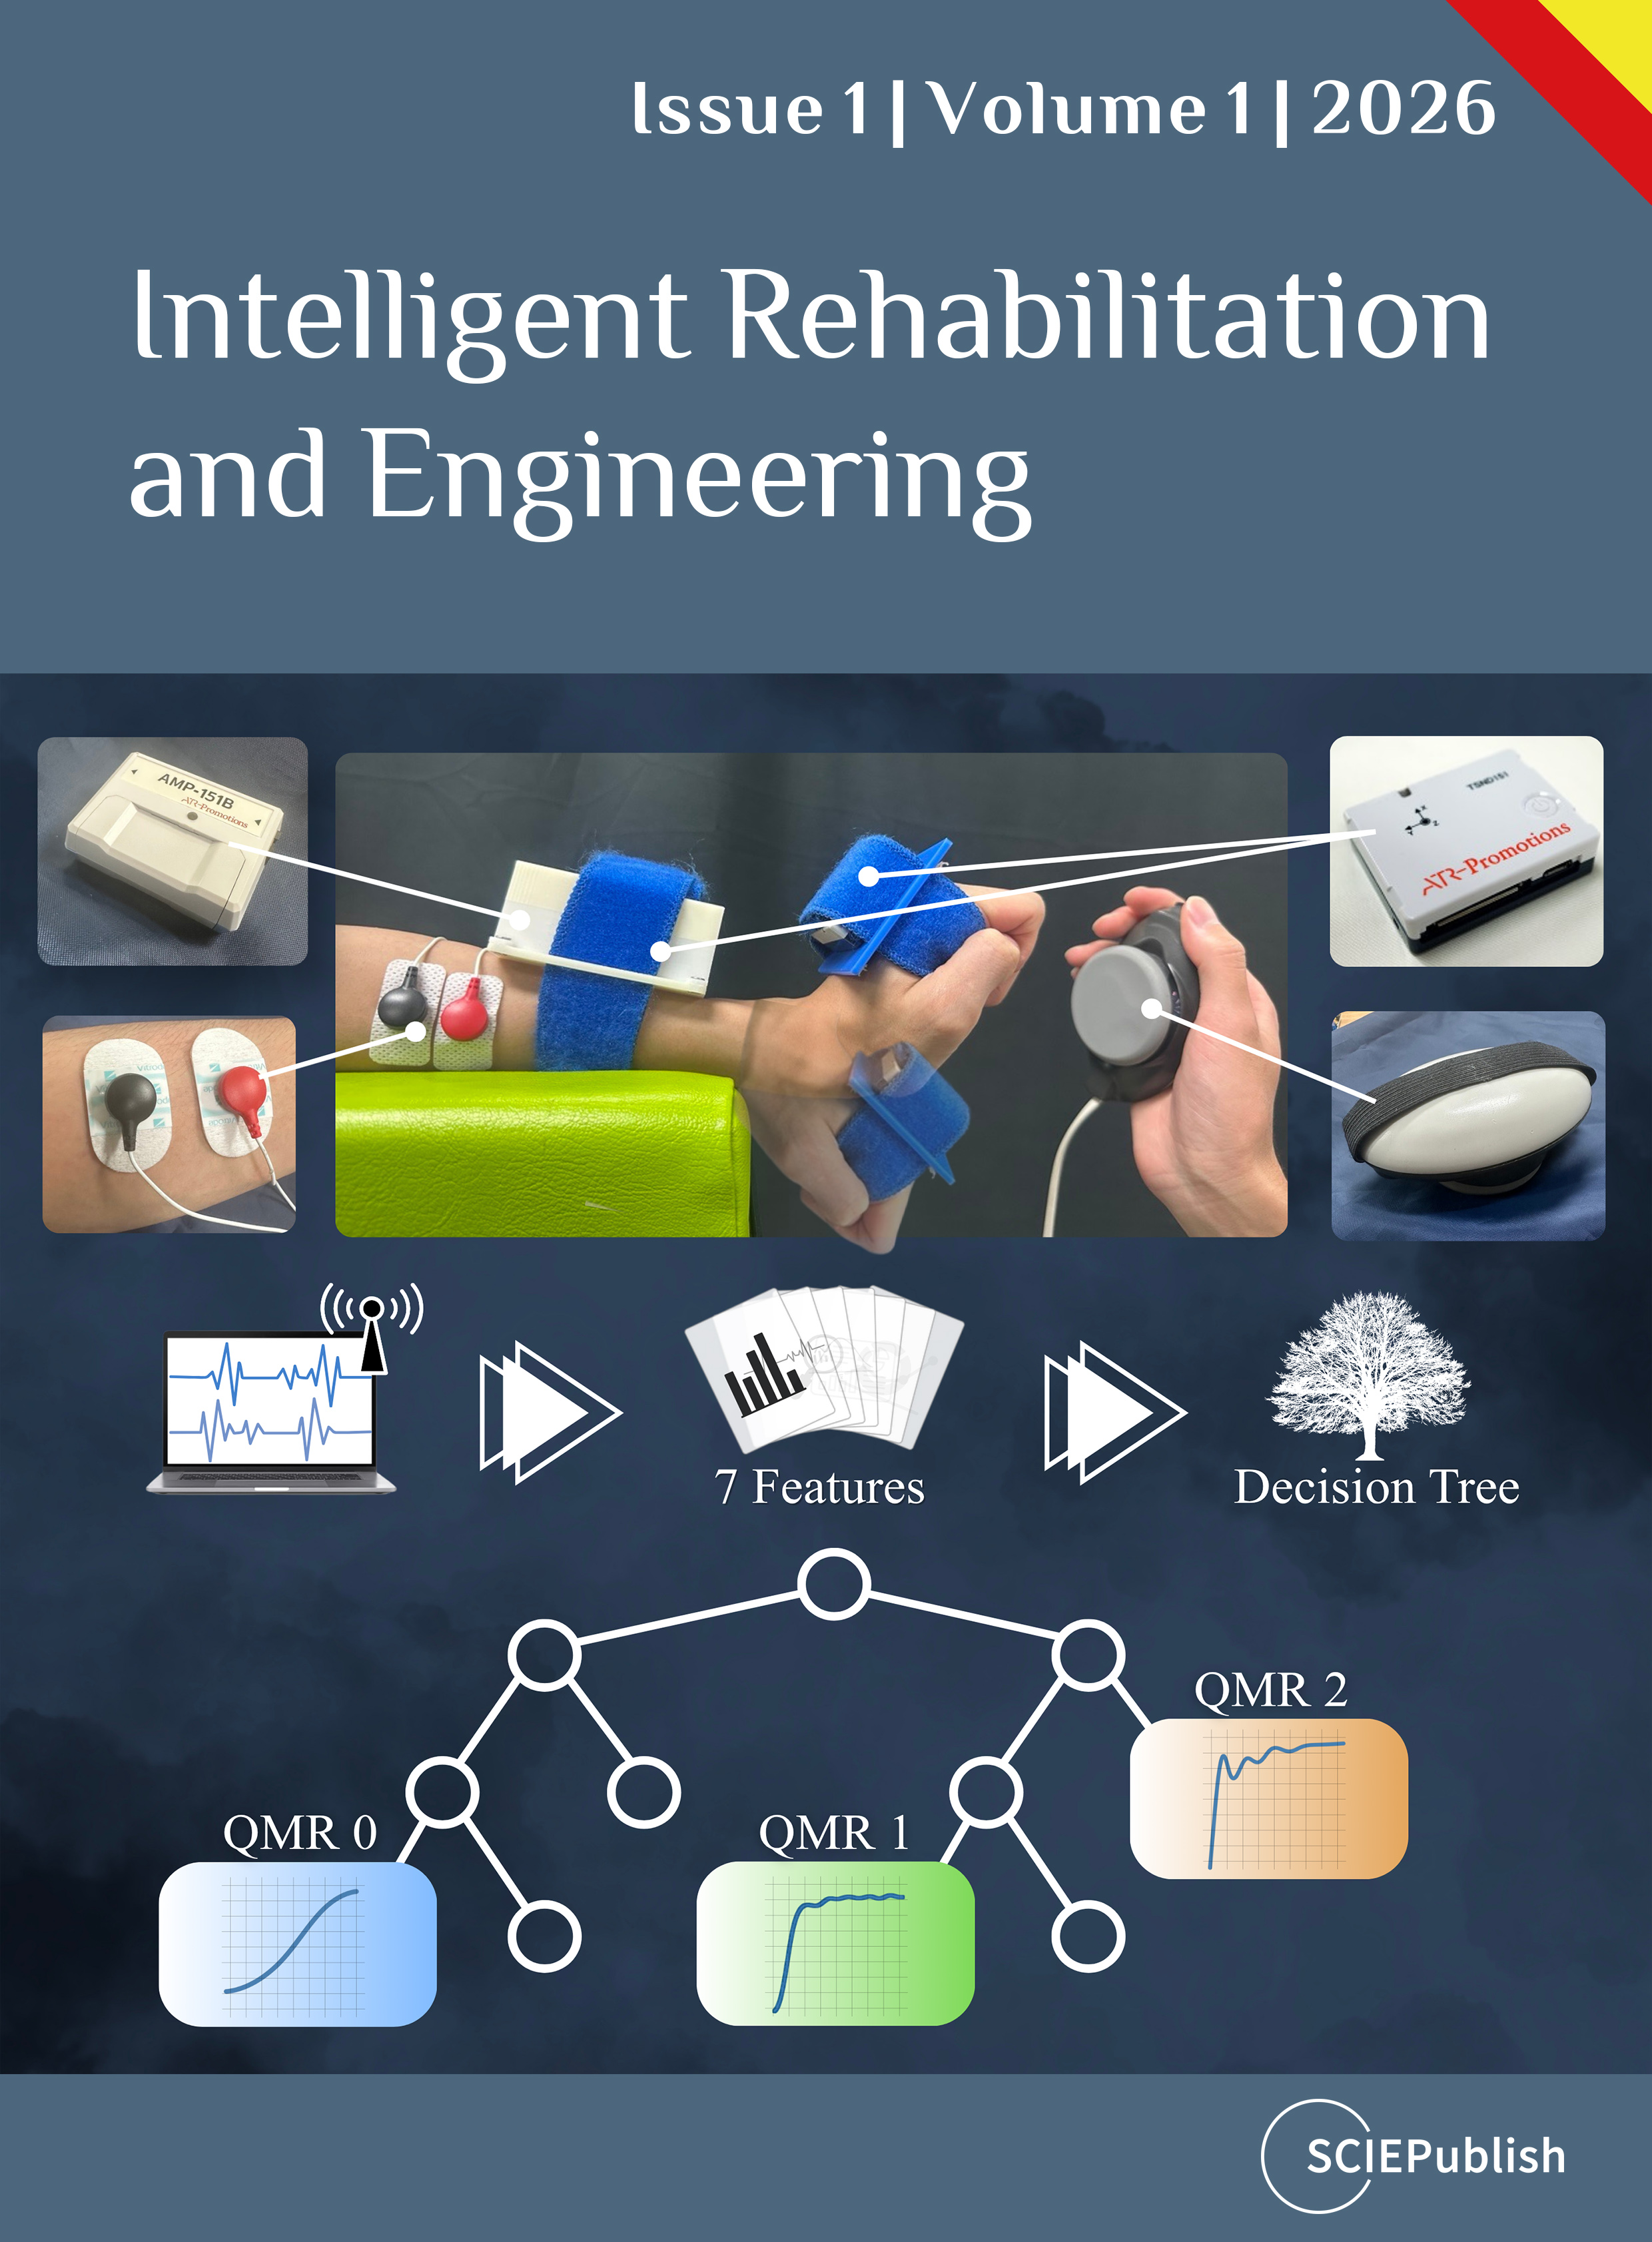
The HaST device visualizes the examiner’s subjective perception and allows quantitative recording. This device was designed specifically for wrist joint assessment. It can measure and visualize the reaction force experienced by the examiner, the subject’s joint angles, and EMG signals during MTS assessment. The hardware configuration comprises IMUs, EMG sensors, and a force sensor worn by the examiner. The overall system architecture and communication scheme are illustrated in Figure 1.
For the IMU, compact wireless multifunction sensors (TSND151, ATR-Promotions, Kyoto, Japan) were employed. The IMU could acquire three-axis angular velocity and three-axis acceleration at a rate of 100 Hz. Each unit was equipped with a 16-bit analog-to-digital input terminal, which allowed connection to the EMG and force sensors. For EMG measurements, an amplifier (AMP-151, ATR-Promotions) and electrodes (SE-C-AMP-H40, ATR-Promotions) were utilized. The amplification circuit included a hardware bandpass filter with a frequency range of 10–500 Hz to suppress baseline fluctuations. A handheld force sensor (MMT Commander, MF-104AA, Nihon Medix, Chiba, Japan) was used to measure reaction force. The sampling frequency for both the EMG and force sensors was set to 1000 Hz.
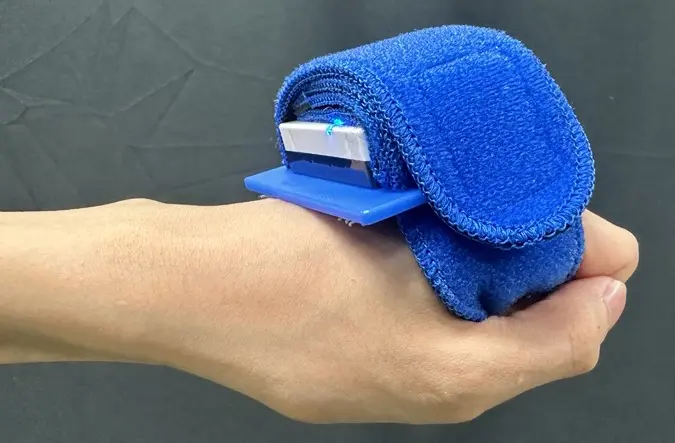
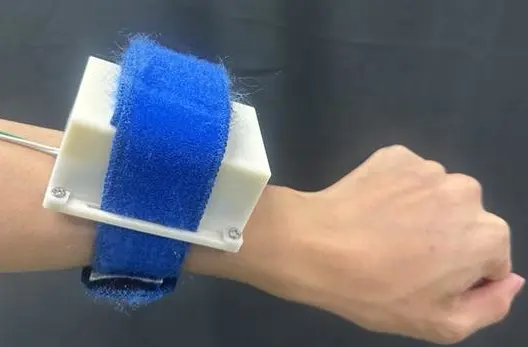
The sensor cases for mounting the IMU and EMG amplifier on the subjects were fabricated using a 3D printer. As shown in Figure 2a,b, the cases were attached to the dorsal sides of the hand and forearm.
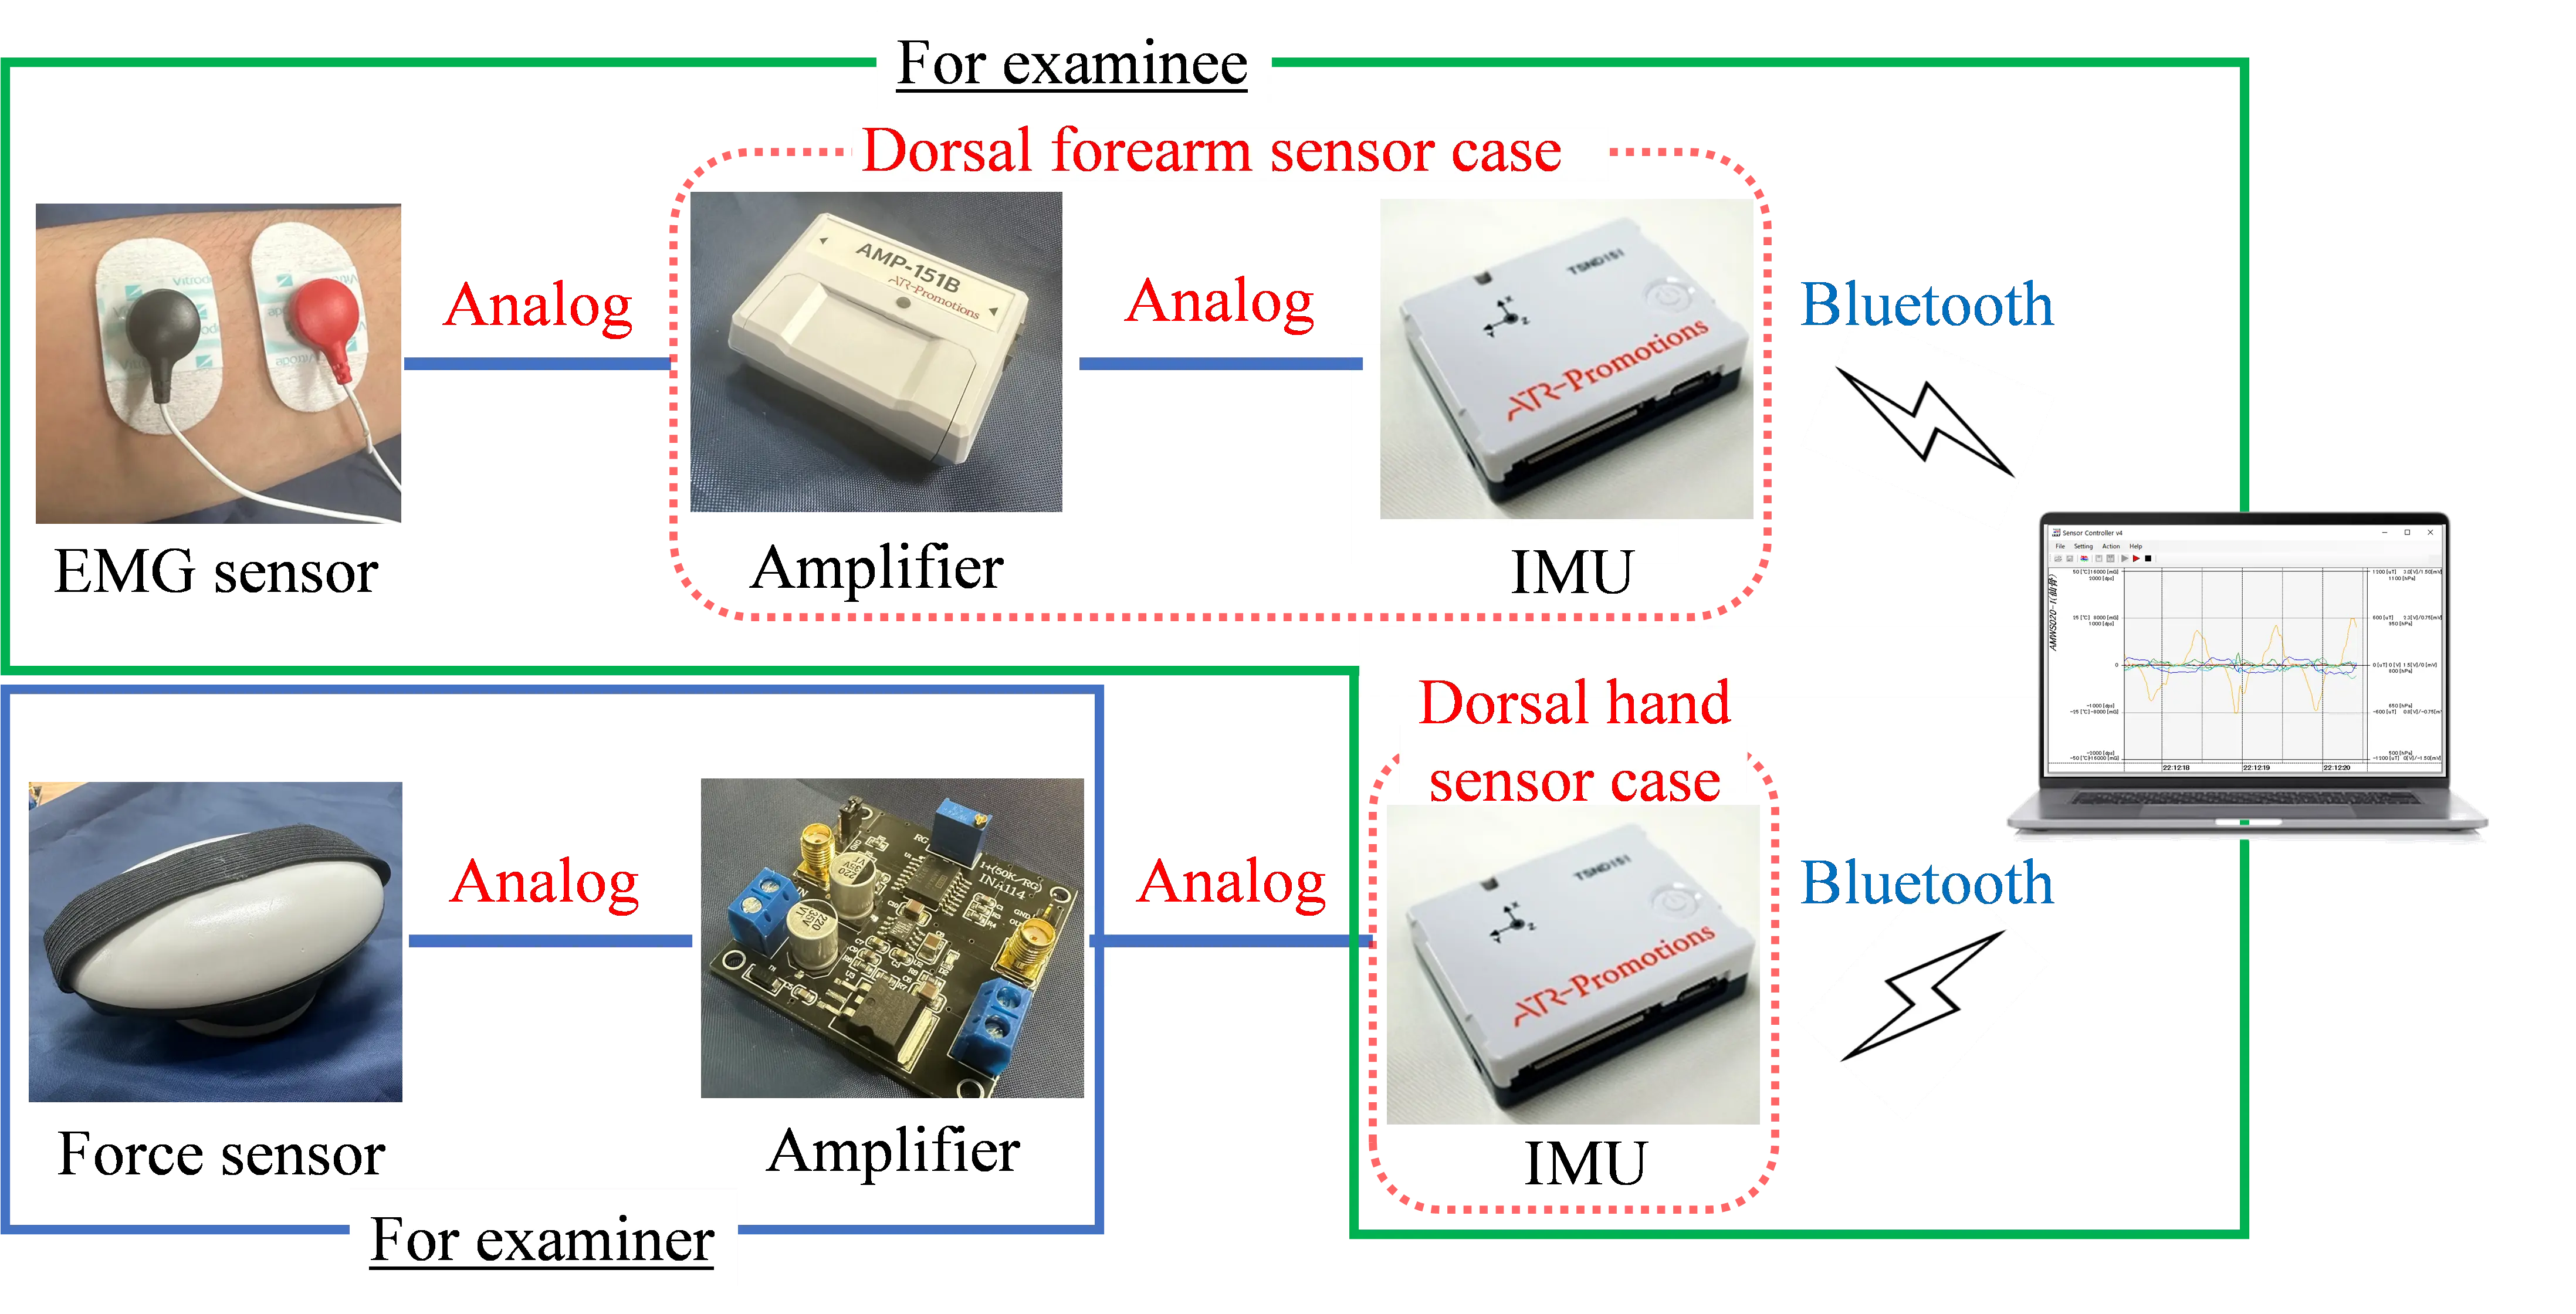
Figure 1. System configuration of the Hand Spasticity Testing (HaST) device, illustrating the data flow between IMUs, EMG sensors, the force sensor, and the PC interface.
 |
 |
|
(a) |
(b) |
Figure 2. Sensor cases of the HaST device on the hand and forearm. (a) Dorsal hand sensor case; (b) Dorsal forearm sensor case.
Medical-grade elastic belts secured the cases, while flexible materials were applied to the skin-contact areas to ensure both safety and comfort. All acquired sensor data were transmitted to a PC via Bluetooth. On the PC, data were monitored in real time using ATR-Promotions’ Sensor Controller software (version 4.0.0) for data acquisition and stored locally in CSV format for subsequent analysis.
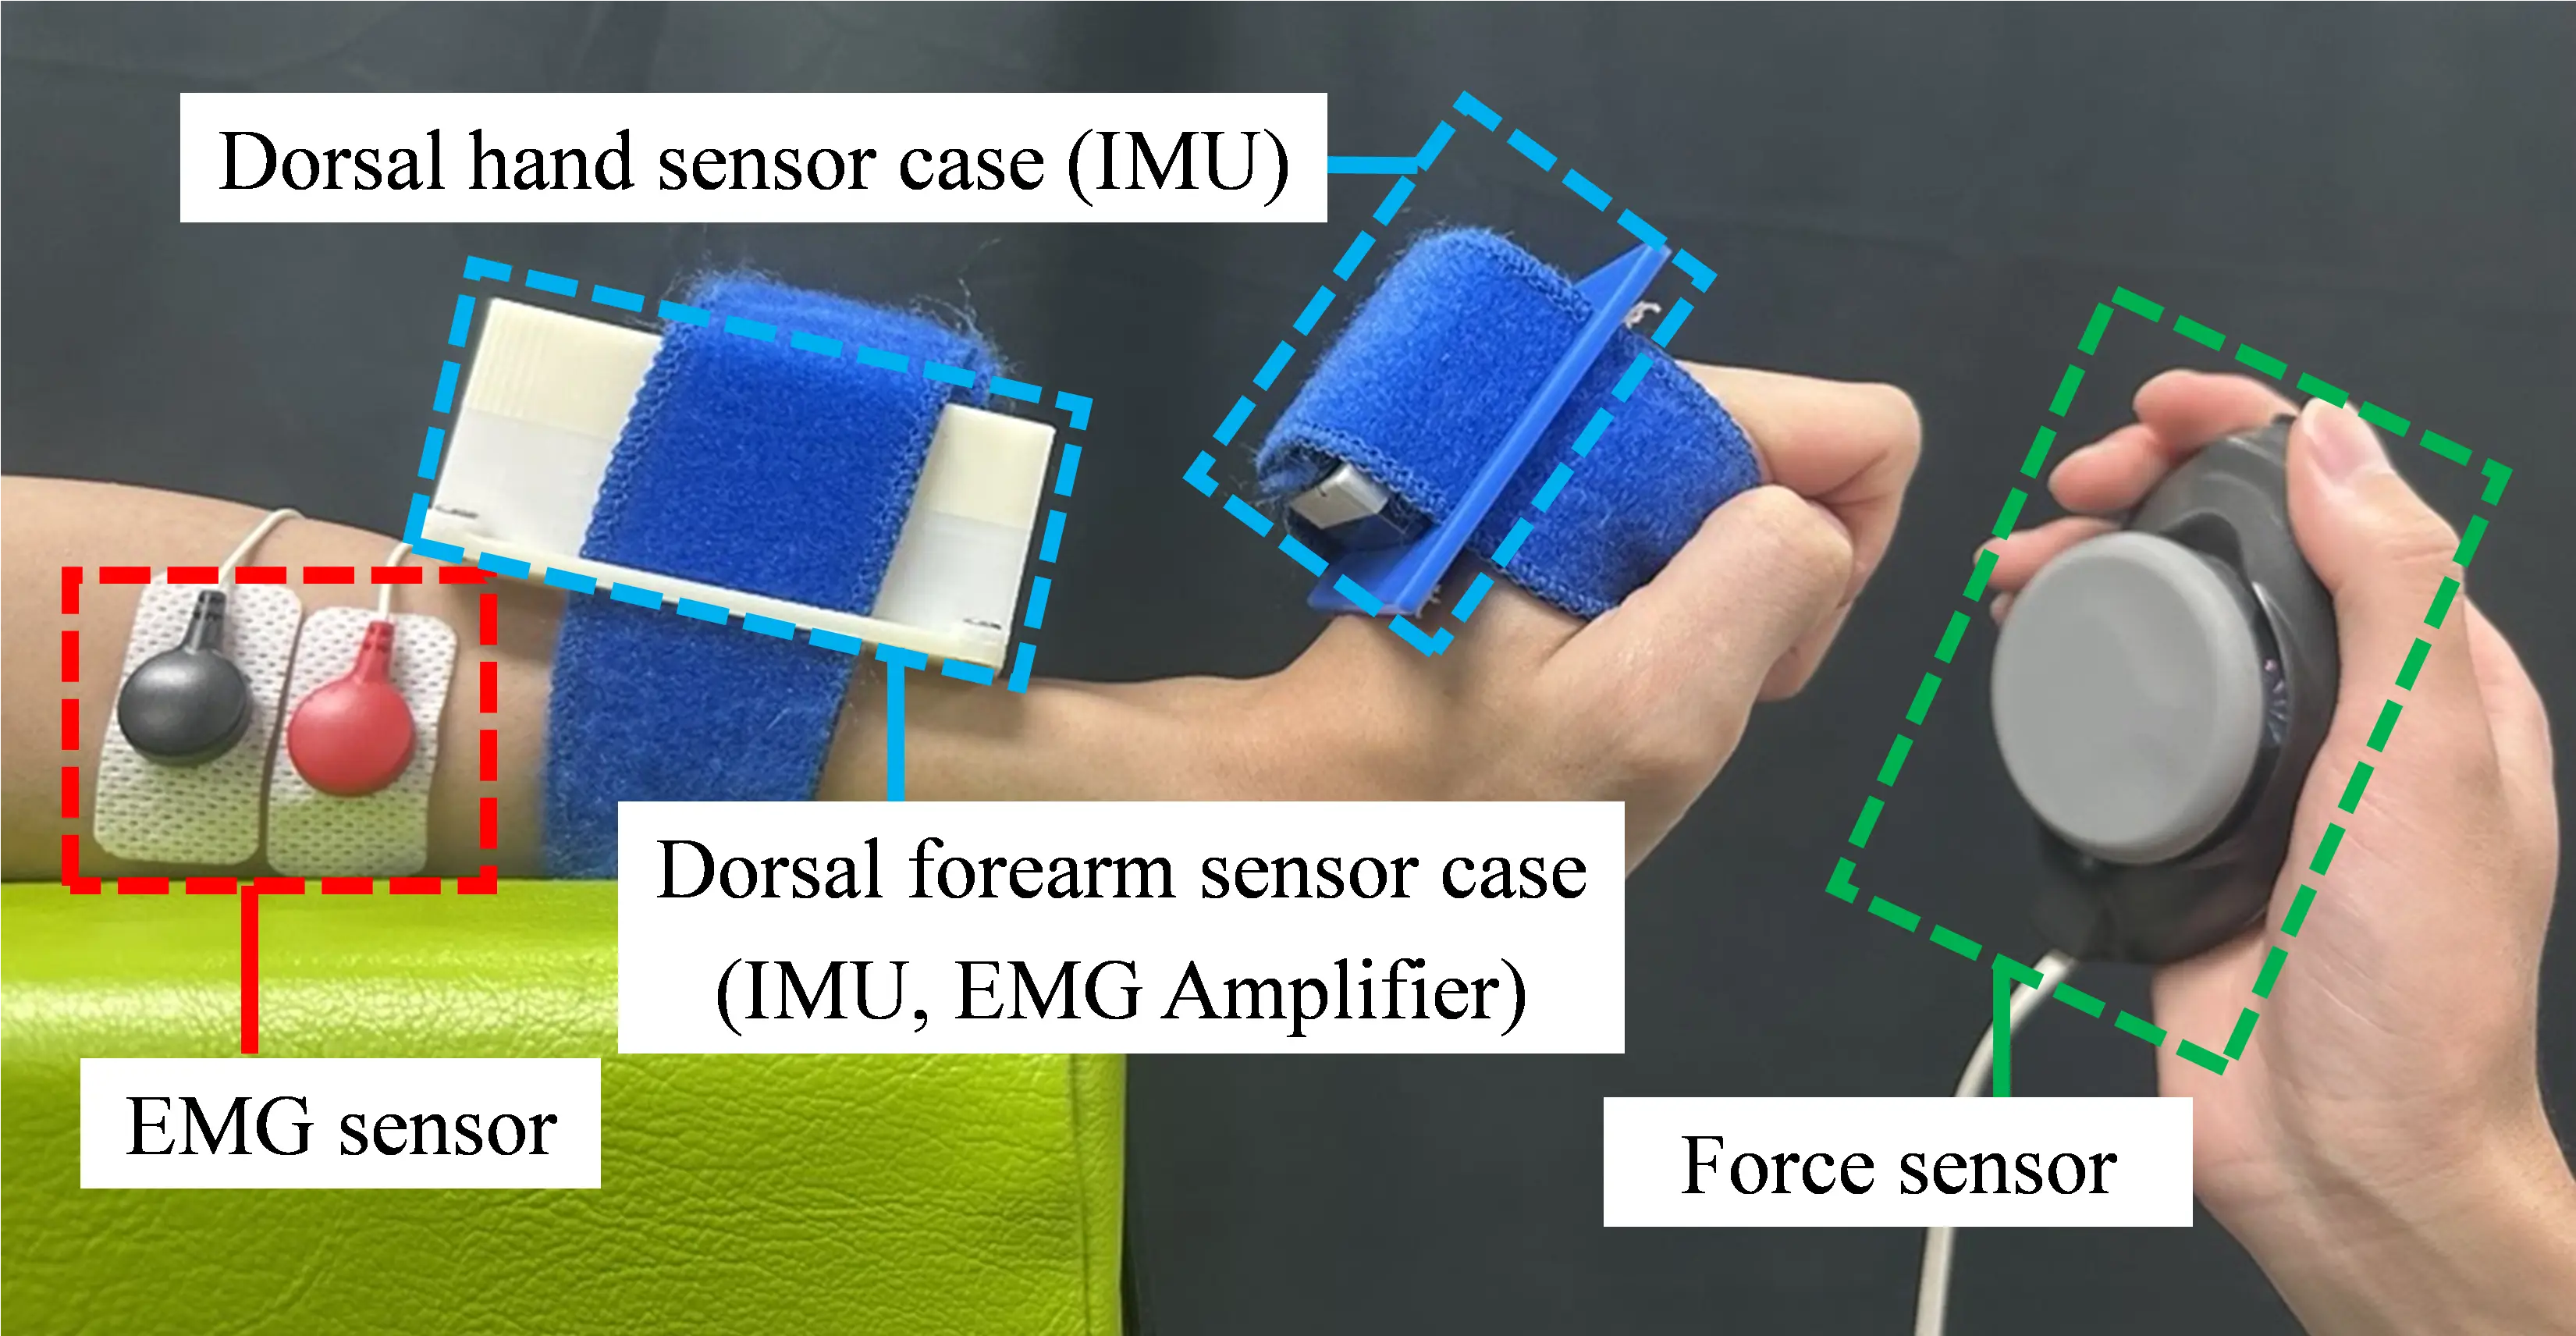
During the MTS assessment, the HaST device was attached to the subjects as depicted in Figure 3. The dorsal hand sensor case was fixed to the dorsal side of the second metacarpal using an elastic belt, whereas the dorsal forearm sensor case was positioned at the midpoint between the radial head and styloid process. EMG electrodes were placed on the flexor carpi radialis, and the ground electrode was attached to the annular ligament on the non-paretic side. The examiner held the force sensor against the subject’s palm.
All data were processed using MATLAB (MathWorks, Natick, MA, USA). The coordinate system definitions for the joint angles and IMUs are illustrated in Figure 4. Here, $${a}_{x}$$ and $${a}_{z}\,$$denote the accelerations in the x- and z-directions of each sensor, respectively, while $${\omega }_{y}$$ denotes the angular velocity about the y-axis (positive clockwise). $$\theta$$ represents the wrist joint angle of the subject.
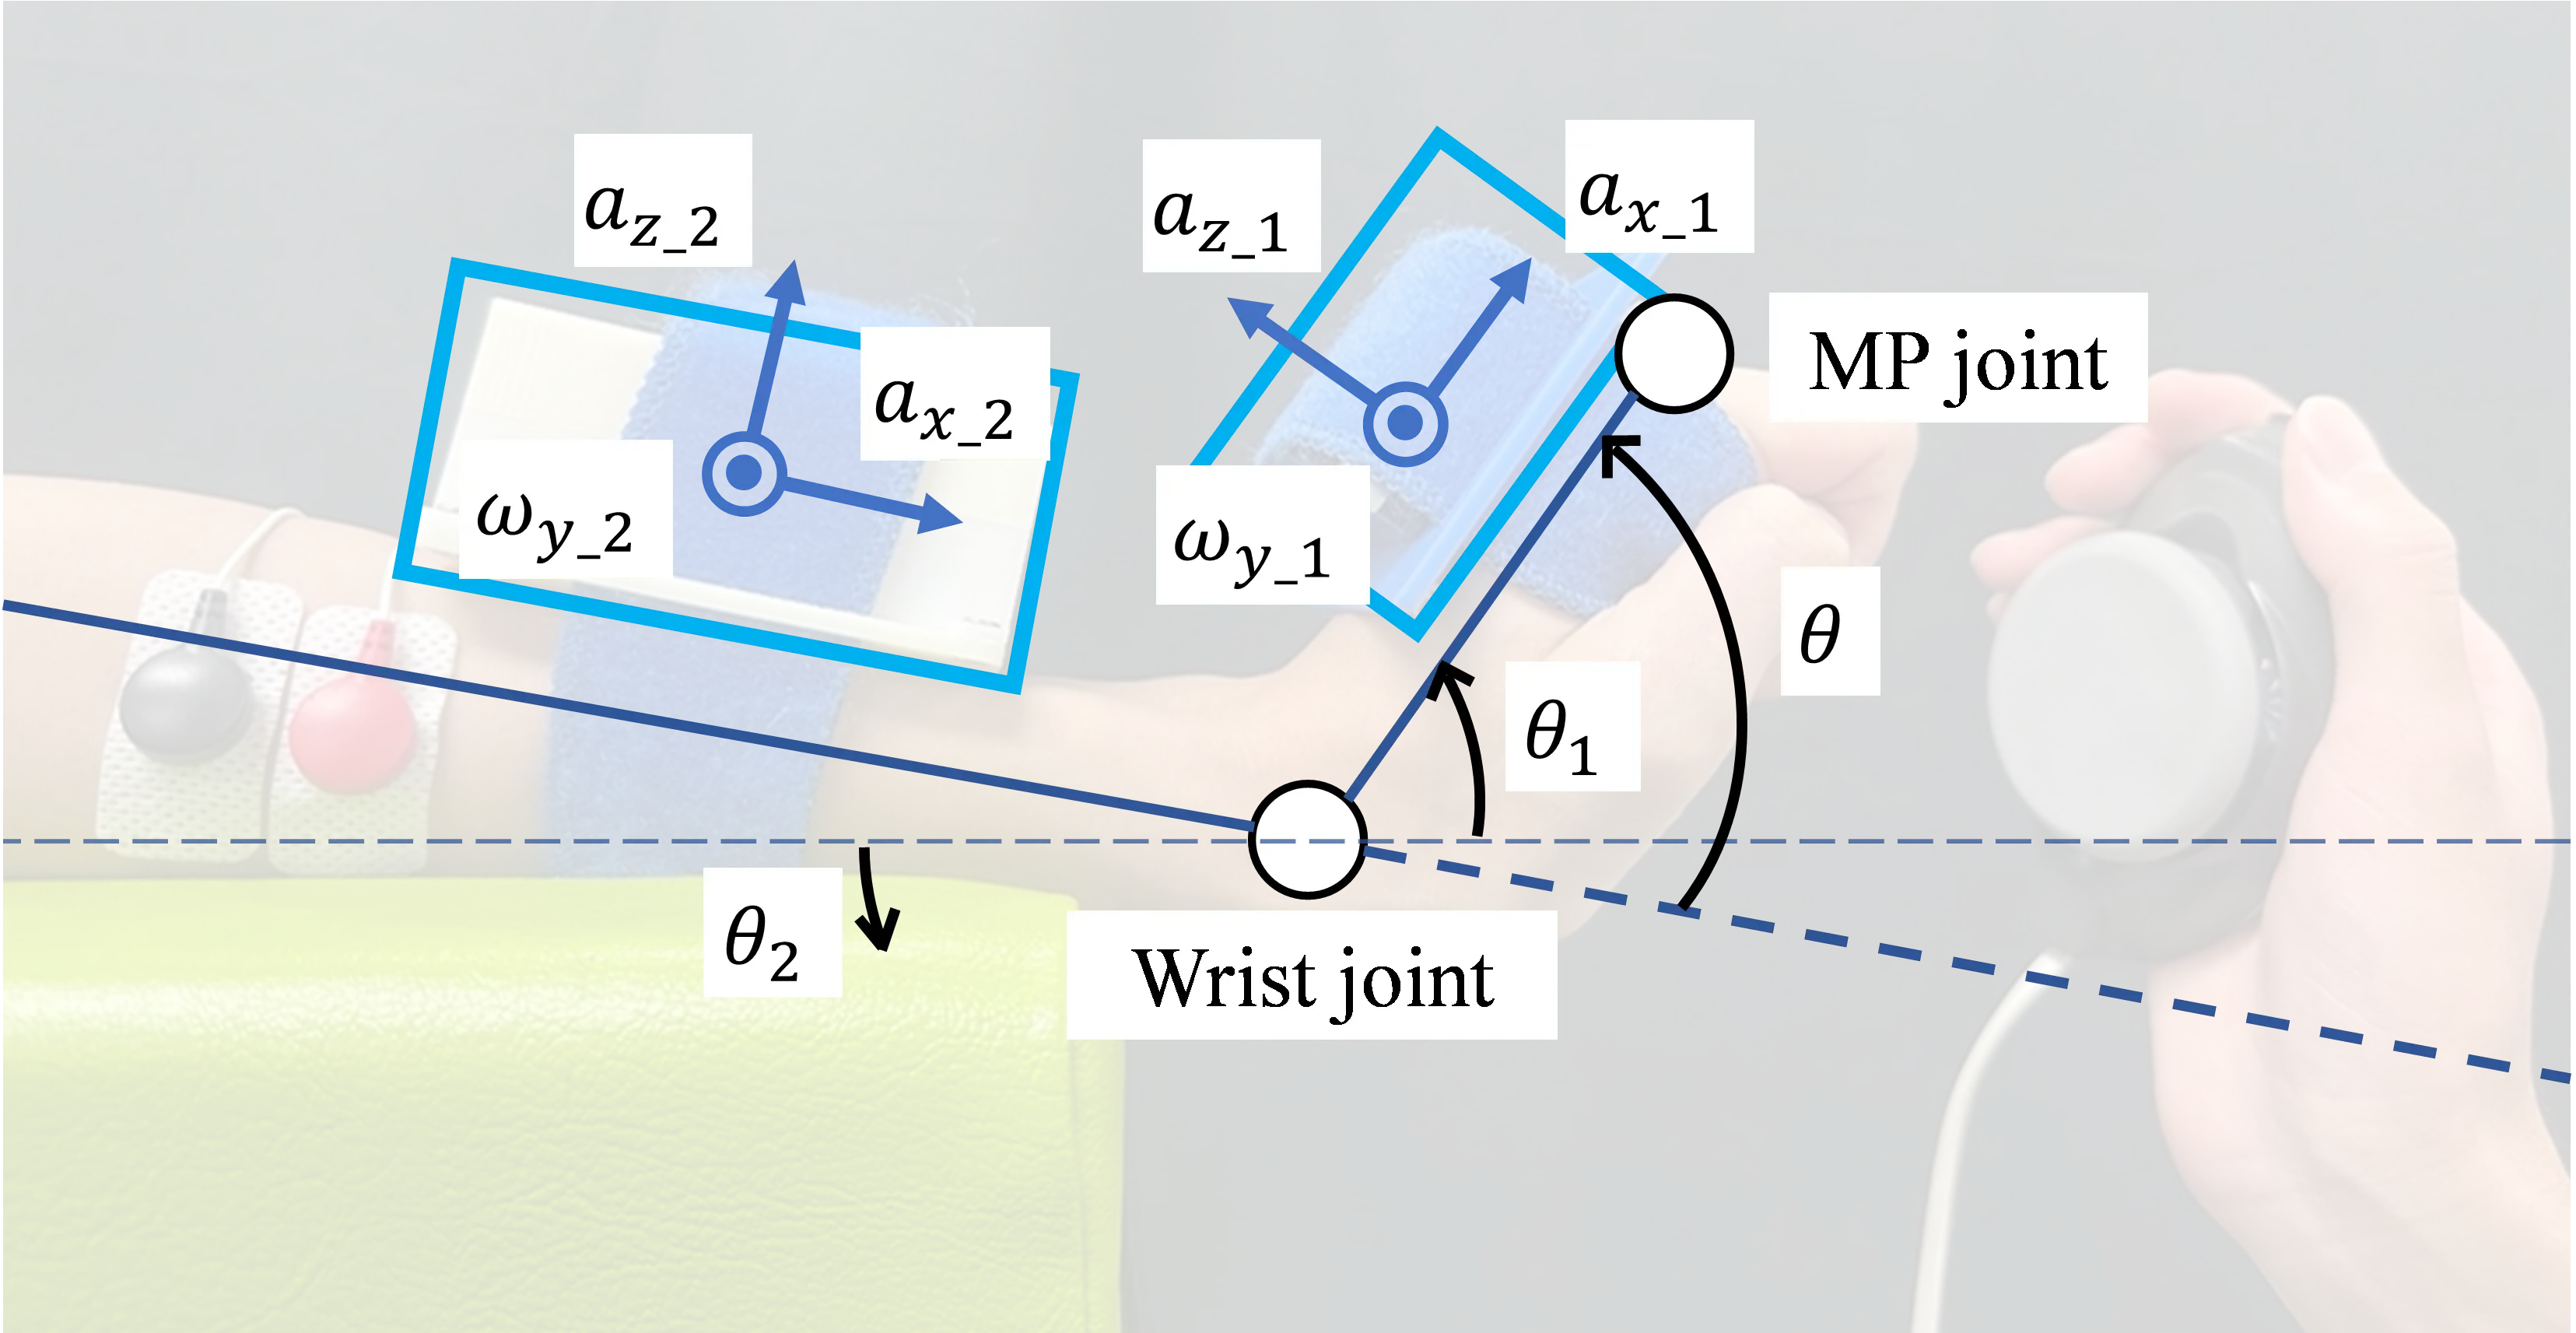
The wrist joint angle $$\theta$$ was calculated using a complementary filter, as proposed by Colton and Mentor [19]. This complementary filter is a sensor-fusion method that combines the gyroscope-integrated angle, which is robust to high-frequency noise, with the accelerometer-derived angle, which is robust to low-frequency drift. By initializing the filter with the accelerometer-derived angle, each IMU can estimate its absolute orientation, and the wrist joint angle can be obtained from the difference between the two IMUs. The angle $${\theta }_{n}$$ is defined by Equation (1), Equation (2) and Equation (3), where $${\theta }_{acc\_n}$$ is the angle derived from the accelerometer output, and $$\mathrm{\Delta }t$$ is the sampling period.
Substituting $$n=1,\mathrm{ }2$$ into Equation (3) yields the wrist joint angle, as expressed in Equation (4).
The weighting coefficient $$\alpha$$ was set to 0.99 based on preliminary experiments that minimized the root mean square error (RMSE) between the estimated angles and those measured using a motion capture system (OptiTrack V120 Trio, SPICE). In five repeated trials of wrist flexion and extension, the RMSE was confirmed to be below 5. Furthermore, data obtained from the force sensor were processed using a fourth-order bandpass filter with a cutoff frequency of 10 Hz.
2.2. Experimental Protocol
This study was conducted in accordance with the Declaration of Helsinki and was approved by the Ethics Committees of Nagoya Institute of Technology (No. 2020-001) and Shonan University of Medical Sciences (No. 24-045). All participants provided written informed consent before the measurement.
To acquire various data using the HaST device and develop a QMR classification algorithm for the MTS, an experimental study was conducted. Nineteen poststroke patients with hemiparesis participated. The MTS assessment was performed on the wrist joint while all participants wore the HaST device. The demographic characteristics of the participants are summarized in Table 1.
Table 1. Information of 19 participants.
|
No. |
Sex |
Age |
Paralyzed Hand |
Period of Onset [Years] |
Remarks |
|---|---|---|---|---|---|
|
1 |
F |
51 |
L |
8.5 |
Putaminal hemorrhage |
|
2 |
M |
72 |
L |
18.9 |
Cerebral infarction |
|
3 |
M |
67 |
L |
3.3 |
Cerebral infarction |
|
4 |
F |
60 |
L |
11.9 |
Lacunar infarction |
|
5 |
F |
66 |
L |
12.3 |
Subarachnoid hemorrhage, cerebral infarction |
|
6 |
F |
60 |
R |
11.2 |
Putaminal hemorrhage |
|
7 |
M |
72 |
R |
14.8 |
Intracerebral hemorrhage |
|
8 |
M |
58 |
L |
10.7 |
Putaminal hemorrhage |
|
9 |
M |
62 |
L |
4.5 |
Putaminal hemorrhage |
|
10 |
M |
66 |
L |
2.5 |
Cerebral infarction |
|
11 |
M |
52 |
L |
10.4 |
Intracerebral hemorrhage |
|
12 |
F |
29 |
R |
17.8 |
Cerebral arteriovenous malformation |
|
13 |
F |
61 |
R |
12.3 |
Intracerebral hemorrhage |
|
14 |
F |
65 |
R |
12.1 |
Intracerebral hemorrhage |
|
15 |
M |
52 |
R |
16.1 |
Intracerebral hemorrhage |
|
16 |
M |
54 |
R |
12.6 |
Intracerebral hemorrhage |
|
17 |
M |
60 |
L |
14.8 |
Putaminal hemorrhage |
|
18 |
F |
69 |
L |
12.3 |
Putaminal hemorrhage |
|
19 |
F |
69 |
L |
9.9 |
Cerebral infarction |
|
Mean ± SD |
M = 10; F = 9 |
60.26 ± 10.03 |
R = 7; L = 12 |
11.41 ± 4.43 |
- |
The MTS, as proposed by Boyd and Graham [10], evaluates spasticity by passively flexing and extending the joint. Its evaluation consists of two components: joint angle and QMR. Joint angle measurement involves performing passive motion at V1 (“as slow as possible”, slower than the natural drop of the limb segment under gravity) to determine the passive range of motion (R2). Subsequently, passive motion is performed at V2 (natural limb drop speed) or V3 (“as fast as possible”, faster than the natural drop rate of the limb segment under gravity) to measure the angle of catch (R1). The term “catch” refers to the momentary resistance perceived by the examiner when the muscle suddenly resists during passive movement, typically at V2 or V3 speeds. The QMR was evaluated subjectively by the examiner using a six-point scale (0–5), during passive motion at V2 or V3.
The QMR scoring during MTS evaluation was performed by an experienced therapist with over 30 years of clinical practice. The experimental procedure is illustrated in Figure 5. In addition to data reflecting spasticity, data under reduced-spasticity conditions were obtained using the Piston Device for Fingers (PDFin) [20] to expand the dataset for the automated evaluation of QMR. PDFin was developed to simulate the manual therapy technique known as the “piston finger technique” [21], which aims to reduce spasticity. Previous studies have indicated that a 30-s intervention using PDFin improved MAS scores in post-stroke hemiparetic patients [20]. Consequently, the device was adopted in this study as a method to reduce spasticity.

The MTS measurements were conducted with the participants seated at the edge of a chair, with the elbow joint maintained at 90° flexion, as described by Boyd and Graham [10]. In accordance with the MTS procedure, each measurement consisted of a slow stretch followed by a fast stretch. Two measurements were taken before and after the 30-s PDFin intervention, resulting in a total of four measurements per participant. Repeated measurements were conducted to obtain a broader range of QMR grades while minimizing participant fatigue, which is important in post-stroke populations. As spasticity has been observed to fluctuate not only between repeated trials but also following the PDFin intervention [21], it was deemed necessary to incorporate all data from measurement sessions into the model development process.
2.3. Feature Extraction and Classifier Evaluation
Prior to feature extraction, data corresponding to slow stretches and QMR 3 were excluded from the analysis. According to the MTS measurement procedure, both slow and fast stretches were performed. However, for the development of the QMR classification algorithm, data from slow stretches that did not contribute to the QMR assessment were excluded from the analysis. The numbers of samples for QMR levels 0, 1, and 2 were 16, 30, and 25, respectively. In contrast, QMR 3 contained only 5 samples, which were insufficient compared to QMR 0–2, and led to an imbalanced distribution across QMR grades; therefore, QMR 3 data were excluded from further analysis. In addition, missing values were observed in the data obtained from three participants, and linear interpolation was applied to compensate for these missing points.
The start and end of a fast stretch were defined as the moments when the angular acceleration reached 20% of its maximum value and when the maximum joint angle was first reached, respectively. In this study, the features listed in Table 2 were used to develop the classification algorithm for QMR-level identification. The EMG sensor was equipped to allow the examiner to monitor muscle activity. Preliminary analysis revealed high inter-session variability in EMG amplitude due to repositioning of surface electrodes and variation in skin impedance across participants. This variability reduced the reliability of EMG features (e.g., RMS amplitude, zero-crossing rate) in the LOOCV framework with the present small sample size. Therefore, in this experiment, the EMG data were not used for constructing the classification model. Future studies with standardized electrode placement protocols and larger cohorts may benefit from incorporating EMG features into the classification pipeline.
Table 2. Notation and definition of features.
|
Symbol |
Description |
|---|---|
|
$${RMSE}_{\theta }$$ |
RMSE between the measured joint angle data and the fitted logistic function |
|
$${N}_{\theta }$$ |
Number of local maxima of the joint angle |
|
$${N}_{\dot{\theta } }$$ |
Number of local maxima of angular velocity |
|
$${F}_{max}$$ |
Maximum reaction force |
|
$$∆{t}_{{\theta }_{max}-{F}_{max}}$$ |
Time difference between the attainment of maximum joint angle and peak reaction force |
|
$${N}_{F}$$ |
Number of local maxima of the reaction force |
|
$${N}_{\dot{F}}$$ |
Number of local maxima of the derivative of the reaction force |
For the feature $${RMSE}_{\theta }$$, the logistic function defined in Equation (5) was used.
The logistic function was chosen because the passive wrist extension trajectory during a fast stretch follows a sigmoidal pattern: the wrist starts near maximum flexion, rapidly transitions through the extension arc, and plateaus near maximum extension. When a spastic catch occurs, this smooth trajectory is perturbed by abrupt angular changes or oscillations, and the residual between the measured trajectory and the fitted smooth sigmoid, quantified as $${RMSE}_{\theta }$$, captures this irregularity. Nonlinear least-squares fitting was applied to the temporal profile of the joint angle, and parameters $$a$$, $$b$$, $$c$$, and $$d$$ were estimated to represent the amplitude, slope, inflection timing, and offset, respectively. Representative fitted parameter ranges observed in the dataset were: amplitude $$a$$ ≈ 91–145°, steepness $$b$$ ≈ 0.0198–0.0410 ms−1, inflection time $$c$$ ≈ 37–94 ms, and initial offset $$d$$ ≈ −93 to −44°. These values are provided only to illustrate the typical fitting behavior of the logistic model. A representative comparison between measured and fitted angle trajectories for QMR 0, 1, and 2 is shown in Figure 6.
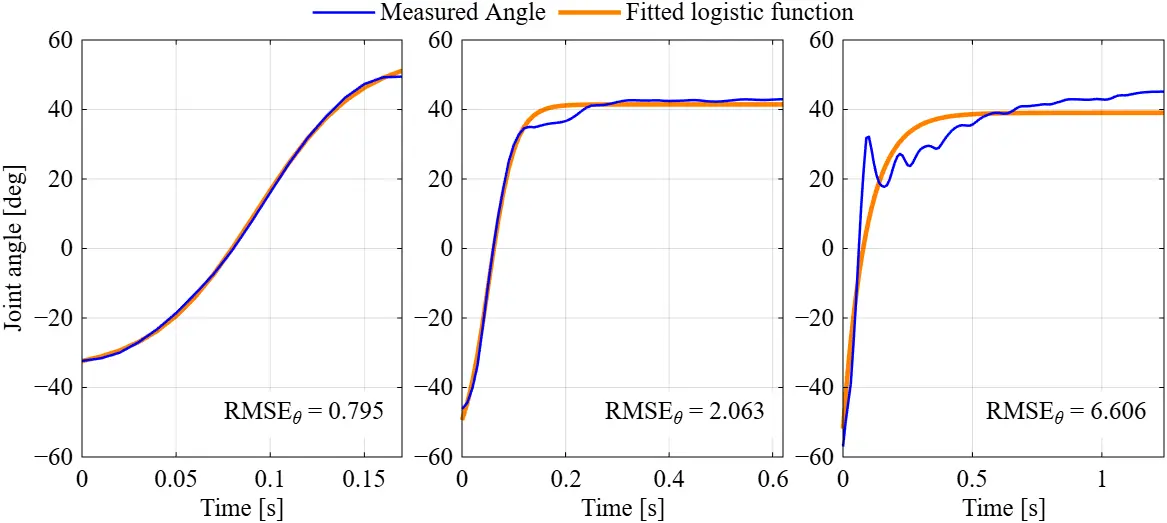
Figure 6. Representative joint angle trajectories during fast passive extension for (left) QMR 0, (middle) QMR 1, and (right) QMR 2. Positive and negative values indicated extension and flexion, respectively.
The hyperparameters of the decision tree were optimized using Bayesian optimization. Given the limited number of data samples (n = 71), leave-one-out cross-validation (LOOCV) was adopted for both hyperparameter search and model evaluation to fully utilize the available dataset. The performance of all classifiers was assessed based on the predictions obtained from LOOCV.
The classifier performance was visualized using confusion and normalized confusion matrices. In these matrices, the diagonal cells (top left to bottom right) represent correctly classified samples. Higher values along the diagonal indicate better classification accuracy. The shading of each cell corresponds to its value, with dark green representing higher values. Thus, a confusion matrix with a dark diagonal indicates high accuracy. Classifier performance was further evaluated using precision, recall, and F1-score, defined in Equation (6), Equation (7) and Equation (8), where TP, FP, and FN denote true positives, false positives, and false negatives, respectively.
To address the unequal number of samples across QMR grades, weighted averages of precision, recall, and F1-score were calculated, as shown in Equation (9), Equation (10) and Equation (11). Here, $${n}_{i}\,$$represents the number of samples in QMR grade $$i$$ ($$i=0, 1, 2$$), and $${\mathrm{P}\mathrm{r}\mathrm{e}\mathrm{c}\mathrm{i}\mathrm{s}\mathrm{i}\mathrm{o}\mathrm{n}}_{i}$$, $${\mathrm{R}\mathrm{e}\mathrm{c}\mathrm{a}\mathrm{l}\mathrm{l}}_{i}$$, and $${{F}_{1}}_{i}$$ denote the respective metrics for QMR $$i$$.
The overall classifier performance was also assessed using accuracy, as defined in Equation (12). Accuracy represents the ratio of correctly classified trials to the total number of trials and is widely used to evaluate the performance of classification models. Here, N_correct denotes the number of correctly classified instances (i.e., the total number of true positives across all QMR grades), and N_total denotes the total number of data samples used for training.
3. Results
The decision tree was trained using the features listed in Table 2. The resulting classifier, trained on the entire dataset, is illustrated in Figure 7.
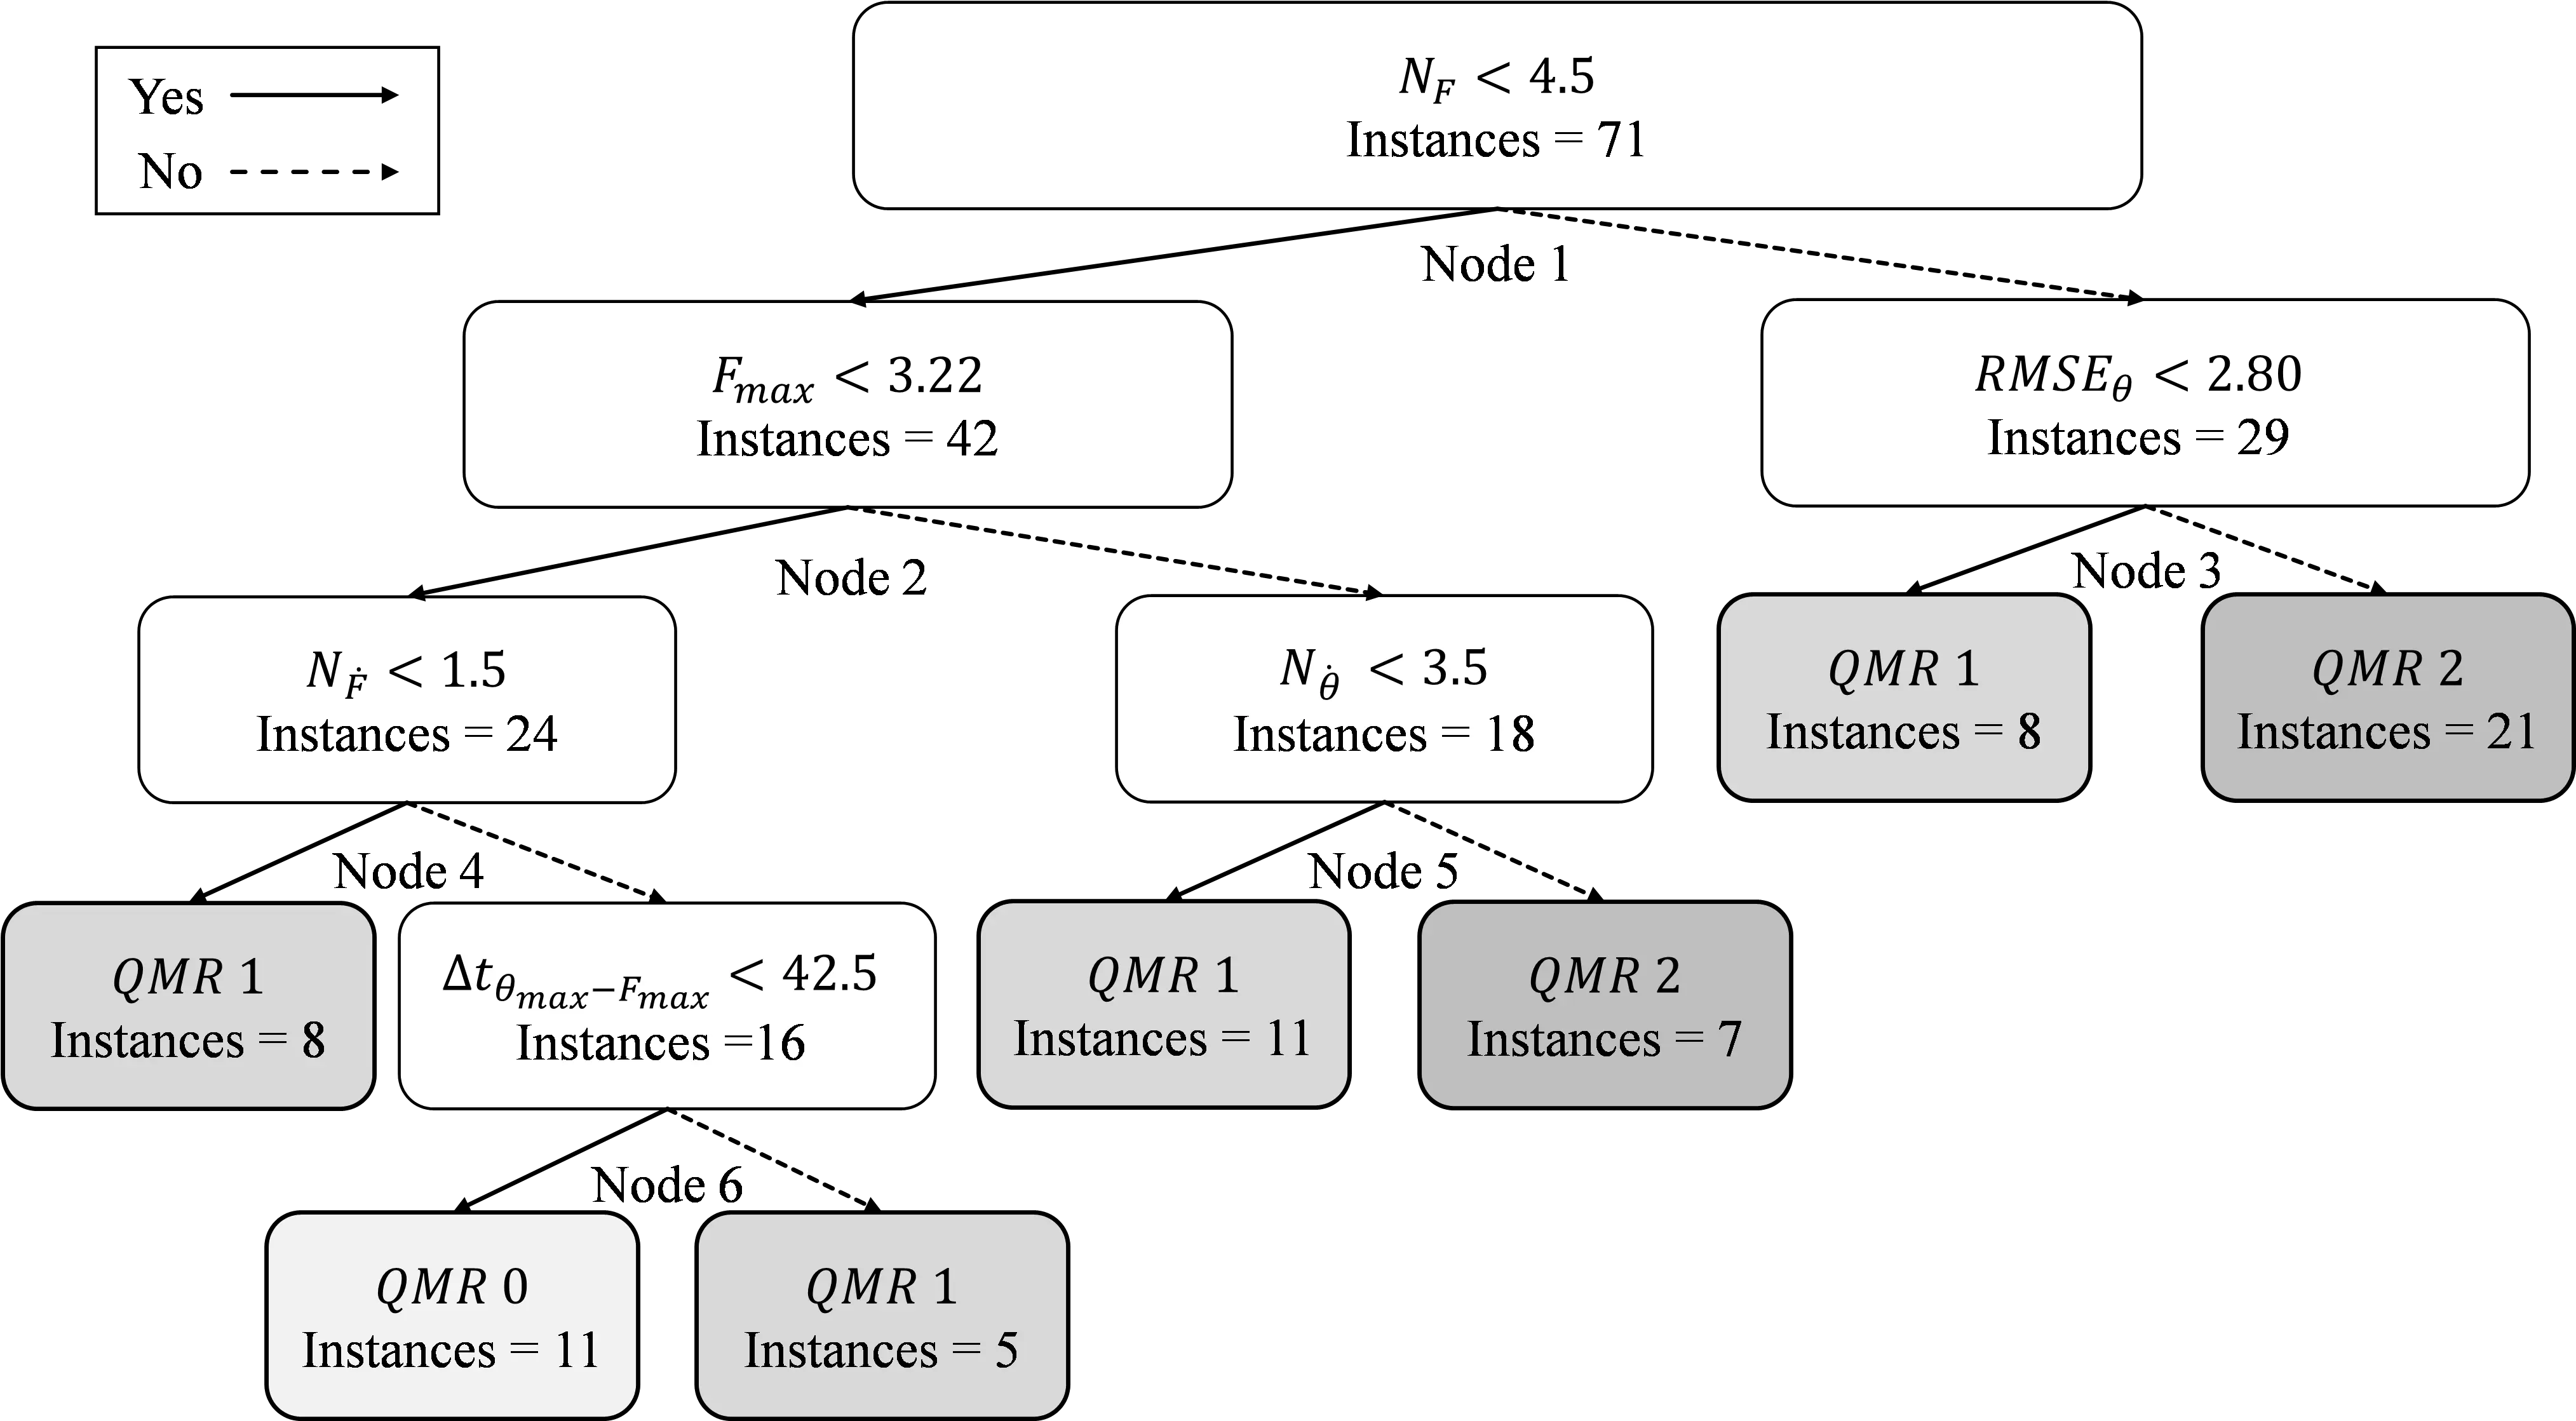
Figure 7. Decision tree classifier for QMR classification based on features extracted from joint angle and force data.
The conditions at each branch represent the splitting rules. In each node, “Yes” indicates that the condition is satisfied and is shown by a solid line, whereas “No” signifies that the condition is not satisfied and is shown by a dashed line. To optimize the hyperparameters of the decision tree, MinLeafSize, MaxNumSplits, and SplitCriterion were selected and tuned using Bayesian optimization. The optimal parameters were determined as follows: MinLeafSize = 2, MaxNumSplits = 22, and SplitCriterion = “twoing2”.
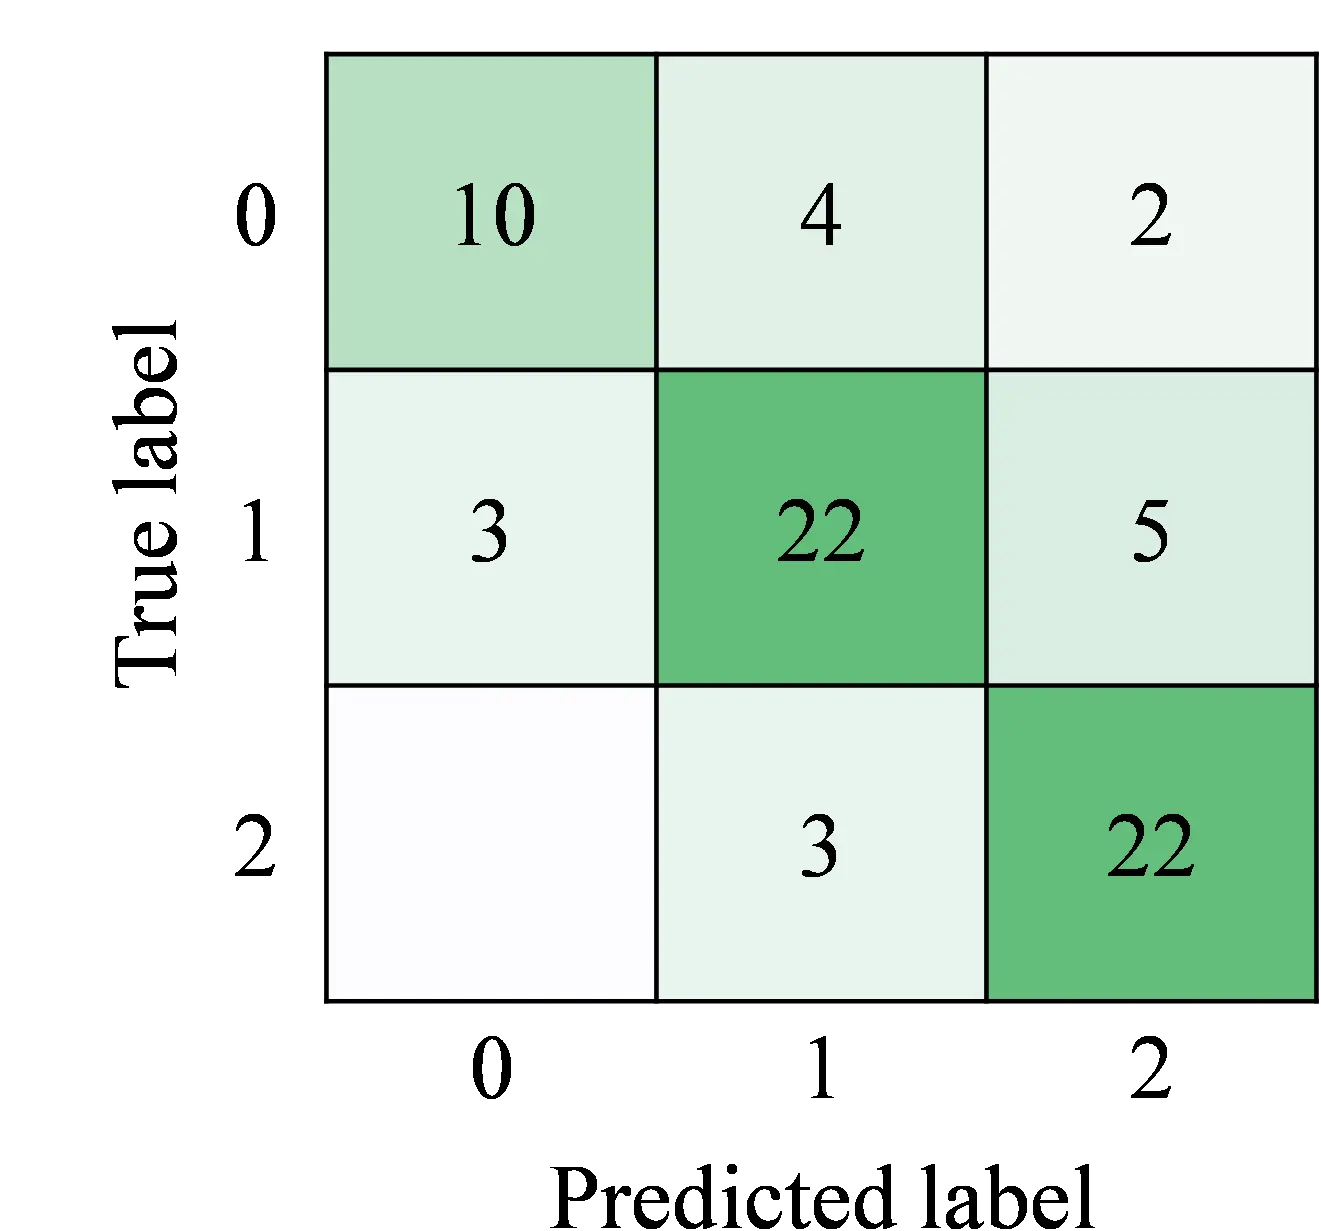
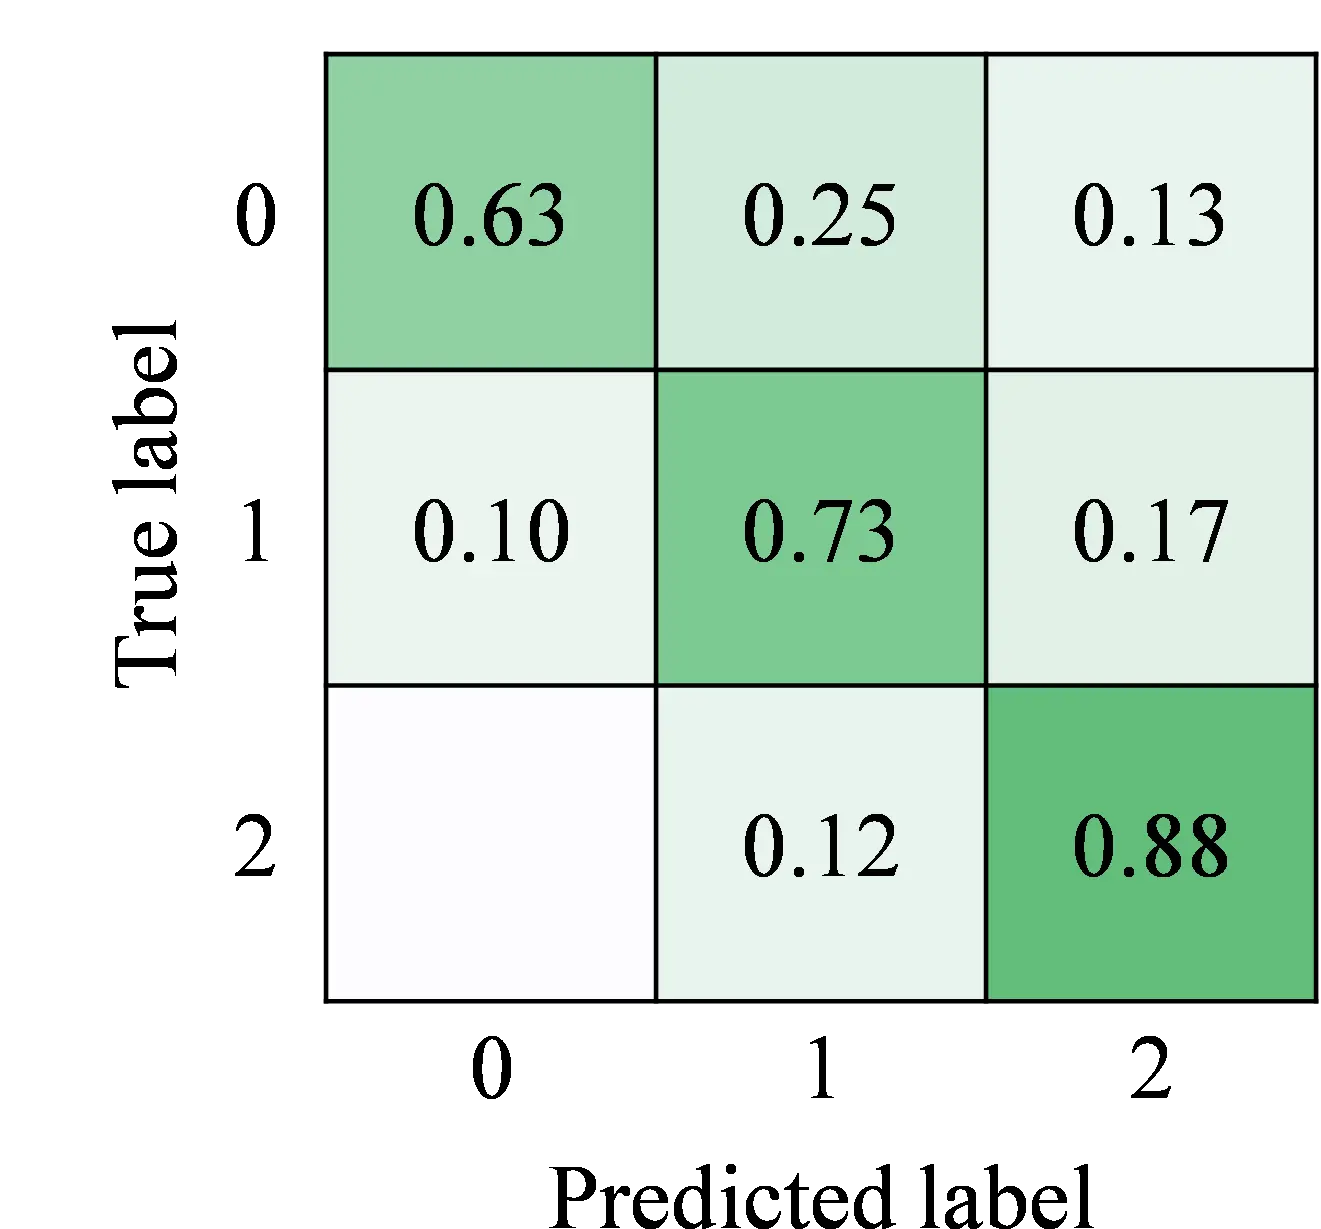
The relationship between the predicted and true values, estimated using LOOCV, is shown as both a standard confusion matrix and a normalized confusion matrix in Figure 8. Diagonal cells indicate correctly classified instances, whereas off-diagonal cells represent misclassifications. The intensity of green shading in each cell corresponds to its magnitude, with darker green indicating higher values. The normalized confusion matrix allows fair comparison of performance across classes with unequal sample sizes.
 |
 |
|
(a) |
(b) |
Figure 8. Confusion matrices for QMR classification. (a) Standard confusion matrix; (b) Normalized confusion matrix.
Classifier performance was further evaluated using precision, recall, and F1-score, which provide a quantitative assessment under an imbalanced QMR grade distribution that accuracy alone cannot capture. The TP, FP, FN, and TN values for each QMR grade are summarized in Table 3, while precision, recall, F1-score, and their weighted averages are listed in Table 4. The proposed approach achieved an overall accuracy of 76% for QMR classification (grades 0–2). Notably, the classification performance for QMR 2 (responses with a clear catch) was high, effectively distinguishing it from QMR 0.
Table 3. TP, FP, FN, and TN values for QMR classification.
|
QMR |
TP |
FP |
FN |
TN |
|---|---|---|---|---|
|
0 |
10 |
3 |
6 |
52 |
|
1 |
22 |
7 |
8 |
34 |
|
2 |
22 |
7 |
3 |
39 |
Table 4. Precision, recall, and F1-score for QMR classification.
|
QMR |
Precision |
Recall |
F1 |
Instances |
|---|---|---|---|---|
|
0 |
0.77 |
0.63 |
0.69 |
16 |
|
1 |
0.76 |
0.73 |
0.75 |
30 |
|
2 |
0.76 |
0.88 |
0.81 |
25 |
|
Weighted average |
0.76 |
0.76 |
0.76 |
71 |
To assess the appropriateness of the decision tree as a classifier, two additional classifiers, a polynomial kernel support vector machine (SVM) and a weighted k-nearest neighbor (k-NN), were evaluated using the same feature set and LOOCV procedure. The decision tree exhibited superior performance compared to both alternatives (see Table 5). Its interpretable structure offers an additional advantage in clinical contexts where transparency in the classification process is required.
Table 5. Classifier comparison using leave-one-out cross-validation on the same feature set.
|
Classifier |
Accuracy [%] |
Optimized Hyperparameters |
|---|---|---|
|
Decision Tree |
76 |
MinLeafSize = 2, MaxNumSplits = 22, SplitCriterion = twoing2 |
|
Polynomial kernel SVM |
59 |
BoxConstraint = 0.0089, KernelFunction = polynomial |
|
Weighted k-NN |
73 |
NumNeighbors = 2, Distance = cityblock, DistanceWeight = equal |
4. Discussion
The present study should primarily be interpreted as a feasibility study demonstrating the possibility of objective and automated QMR quantification rather than as a fully deployable clinical diagnostic system. The overall accuracy of 76% achieved by the proposed system is comparable to that reported by Ahmad Puzi et al. [17] for MAS automation (76–84%) and represents an encouraging first step toward automated QMR scoring within the MTS framework. Although further validation using larger independent cohorts will be necessary for broader clinical application, the present findings support the feasibility of objective QMR quantification using wearable sensor measurements and suggest the potential utility of the proposed system as a preliminary screening and assistive documentation tool.
To interpret the classification results, the relationships between the selected features and the clinical definitions of each QMR grade were analyzed. This section discusses how the features extracted at each node of the decision tree correspond to the characteristic mechanical responses observed during passive wrist movements.
At Node 3, $${RMSE}_{\theta }$$ was selected as the feature to distinguish between QMR 1 and QMR 2. This selection aligns with the clinical definitions: QMR 1 is defined as “no clear catch at a precise angle”, whereas QMR 2 is defined as “clear catch at a precise angle”. In QMR 2, the occurrence of a catch during passive movement likely caused abrupt changes or oscillations in the angular trajectory, resulting in greater variability in the angle waveform and thus an increased $${RMSE}_{\theta }$$. Therefore, $${RMSE}_{\theta }$$ may serve as an indicator reflecting the presence or absence of a catch.
At Node 4, $${N}_{\dot{F}}$$ was selected as the feature to separate QMR 1 from the group containing both QMR 0 and QMR 1. The classification rule indicated that smaller values of $${N}_{\dot{F}}$$ corresponded to QMR 1. QMR 0 is defined as “no resistance throughout the course of passive movement”, suggesting that the reaction force at the maximum joint angle tends to be higher than that during passive movement, appearing as a noticeable change in the force slope. In contrast, QMR 1, defined as “slight resistance throughout the course of passive movement”, is characterized by smaller changes in the reaction force compared with that at the maximum joint angle, leading to a lower $${N}_{\dot{F}}$$ value.
At Node 5, $${N}_{\dot{\theta }}$$ was selected as the feature to classify between QMR 1 and QMR 2. The presence of a catch, which is a characteristic of QMR 2, likely interrupted the constant extension motion, causing temporary decreases in joint angular velocity and multiple changes in the slope of the angle–time curve. Consequently, the frequency of angular velocity changes, represented by $${N}_{\dot{\theta }}$$, increased and exhibited higher values in QMR 2. Thus, $${N}_{\dot{\theta }}$$ can be considered an effective feature that reflects the irregularity in angular change induced by the presence of a catch.
At Node 6, $$∆{t}_{{\theta }_{max}-{F}_{max}}$$ was selected as the feature to classify between QMR 0 and QMR 1. In QMR 0, no apparent resistance was observed during passive movement, and the reaction force tended to reach its maximum value at the maximum joint angle. Conversely, in QMR 1, slight resistance occurred earlier during passive movement, causing the maximum reaction force ($${F}_{max}$$) to appear before the maximum joint angle. As a result, a clear difference was observed in $$∆{t}_{{\theta }_{max}-{F}_{max}}$$—the time difference between the maximum joint angle and Fmax—making it an effective indicator for distinguishing between QMR 0 and QMR 1. These findings suggest that quantifying the examiner’s tactile perception using force sensors could bridge the gap between subjective and instrumented assessments of spasticity.
The performance requirements depend on the intended clinical application and implementation context. Therefore, in this study, the evaluation results of the proposed classifier were compared with those of previous studies addressing similar research objectives. The study by Ahmad Puzi et al. [17] was selected as the reference for upper-limb spasticity diagnostic support. A comparison between the two studies is presented in Table 6. The comparison presented in Table 6 is intended as a contextual benchmark rather than a direct equivalence comparison. The two studies differed in terms of the following: assessment scale (MTS vs. MAS), target joint (wrist vs. elbow), participant characteristics, and sensor modalities. The direct comparison of the accuracies of these two systems is inherently limited. Notably, the paucity of automated MTS-QMR studies in the extant literature underscores the novelty and necessity of the present work. Choi et al. [18] investigated the use of automated MTS assessment for lower limb spasticity using biofeedback. However, this study did not report a QMR classification accuracy suitable for direct comparison. The necessity of future multi-site studies with standardized protocols is paramount for establishing benchmarks for automated MTS scoring. This study differs from the previous work in that the evaluation focused on the MTS rather than the MAS, thereby enabling the assessment of velocity-dependent spasticity. Studies investigating automation algorithms for the MTS are limited, and future studies should include validation with larger sample sizes. In this study, the wrist was selected as the target joint. Although the wrist has high clinical significance owing to its direct involvement in activities of daily living, its complex structure with multiple degrees of freedom makes it more susceptible to measurement errors. Furthermore, while earlier studies compared multiple machine learning algorithms, this study analyzed only the decision tree. As dataset sizes increase in future studies, the applicability of alternative methods, including neural networks, should be explored.
Table 6. Contextual benchmarking with previous studies from multiple perspectives.
|
Comparison Item |
This Study |
Previous Study [17] |
|---|---|---|
|
Spasticity assessment method |
Modified Tardieu Scale (MTS) |
Modified Ashworth Scale (MAS) |
|
Number of classes |
3 (0, 1, 2) |
3 (0, 1, 2) |
|
Number of participants |
19 |
25 |
|
Number of instances |
71 |
25 |
|
Target joint |
Wrist joint |
Elbow joint |
|
Sensor data |
Angle, Force |
Angle, Torque |
|
Type of machine learning |
Decision tree |
Linear support vector machine (SVM), linear discriminant analysis (LDA), weighted K-nearest neighbor (KNN) |
|
Classifier performance |
Accuracy: 76% |
Accuracy: 76–84% |
This study has several limitations. First, the dataset comprised 71 samples obtained from 19 participants, which may have compromised the statistical reliability and generalizability of the reported classification performance (95% CI for accuracy: approximately 65–85%). Although LOOCV was adopted to maximize the use of available data, its estimates may exhibit high variance when the sample size is limited. Therefore, validation using a larger independent cohort is necessary in future studies. Second, all QMR labels were assigned by a single experienced therapist. While this ensured consistency in labeling, inter-rater reliability was not evaluated formally. In contrast, sensor-derived measurements, including joint angles and reaction forces, are examiner-independent and reproducible. Therefore, future studies should investigate inter-rater reliability using multiple examiners. Third, the classifier was trained only on QMR grades 0–2 because the number of QMR 3 samples was insufficient for reliable training. Consequently, the current system cannot appropriately classify severe spasticity cases corresponding to QMR grades 3–5. As an interim solution, the system could potentially output a “grade ≥ 3: refer to clinician” warning when extracted features fall outside the distributions observed in the training dataset. Future studies should include additional data collection for higher QMR grades and the development of classifiers capable of handling the full MTS scale. Fourth, the PDFin intervention may have introduced carry-over effects on spasticity levels between measurement sessions, meaning that post-intervention QMR grades may not reflect the participant’s baseline spasticity. Although this variability was deliberately exploited to broaden the QMR distribution in the training dataset, it is possible that it may have introduced label noise, which could have a detrimental effect on classification performance. Subgroup analyses by sex, age, and paretic side were not feasible due to the limited sample size. These participant-related factors may influence spasticity characteristics and should be investigated in future larger-scale studies. Despite these limitations, this study demonstrates the feasibility of an objective and automated QMR assessment using wearable sensor measurements.
5. Conclusions
In this study, we developed the HaST device, which enables visualization of wrist joint angles, reaction forces, and EMG signals. We proposed an automated approach for MTS assessment by applying a machine learning algorithm to automatically classify QMR.
Using the extracted features, a decision tree classifier was trained, and its overall performance was evaluated using LOOCV. The resulting accuracy was 76%, with weighted precision, recall, and F1-score all equal to 0.76. In particular, the discrimination rate for QMR 2 was high, indicating effective differentiation from QMR 0.
Future work will focus on extending the HaST device and classification algorithm to other joints, as well as incorporating deep learning models to further enhance the objectivity and clinical applicability of MTS assessment.
Statement of the Use of Generative AI and AI-Assisted Technologies in the Writing Process
During the preparation of this manuscript, the authors used ChatGPT for refining the text and English translation. After using this service, the authors reviewed and edited the content as necessary and take full responsibility for the content of the published article.
Acknowledgments
We would like to thank all the participants for their valuable contributions to this study and Editage for English language editing.
Author Contributions
Conceptualization, Y.M., H.T., I.Z., G.G., K.M. and E.M.; Methodology, R.S., Y.M., I.Z. and G.G.; Software, R.S. and I.Z.; Validation, Y.M. and H.T.; Formal Analysis, R.S.; Investigation, Y.M., H.T., I.Z., G.G., K.M. and E.M.; Resources, Y.M.; Data Curation, R.S.; Writing—Original Draft Preparation, Y.M. and R.S.; Writing—Review & Editing, Y.M., H.T., I.Z., G.G., K.M. and E.M.; Visualization, R.S.; Supervision, Y.M.; Project Administration, Y.M.; Funding Acquisition, Y.M.
Ethics Statement
This study was approved by the Ethics Committee of Nagoya Institute of Technology (Approval No. 2020-001, approved on 21 July 2020) and the Ethics Committee of Shonan University of Medical Sciences (Approval No. 24-045, approved on 5 November 2024).
Informed Consent Statement
All participants provided written informed consent before the measurements.
Data Availability Statement
The datasets used and/or analyzed in the current study are available from the corresponding author upon reasonable request.
Funding
This study was funded by the JSPS Grant-in-Aid for Scientific Research (19K12878) and by the 2024 Nagoya Institute of Technology Internationalization Promotion Program.
Declaration of Competing Interest
The authors declare that they have no known competing financial interests or personal relationships that could have appeared to influence the work reported in this paper.
References
- Feigin VL, Abate MD, Abate YH, Abd ElHafeez S, Abd-Allah F, Abdelalim A, et al. Global, regional, and national burden of stroke and its risk factors, 1990–2021: A systematic analysis for the Global Burden of Disease Study 2021. Lancet Neurol. 2024, 23, 973–1003. DOI:10.1016/S1474-442200369-7 [Google Scholar]
- Feigin VL, Brainin M, Norrving B, Martins SO, Pandian J, Lindsay P, et al. World Stroke Organization: Global Stroke Fact Sheet 2025. Int. J. Stroke 2025, 20, 132–144. DOI:10.1177/17474930241308142 [Google Scholar]
- Lance JW. Symposium synopsis. In Spasticity: Disordered Motor Control; Feldman RG, Young RR, Koella WP, Eds.; Year Book Medical Publishers: Chicago, IL, USA, 1980; pp. 485–494. [Google Scholar]
- Schinwelski MJ, Sitek EJ, Wąż P, Sławek JW. Prevalence and predictors of post-stroke spasticity and its impact on daily living and quality of life. Neurol. Neurochir. Pol. 2019, 53, 449–457. DOI:10.5603/PJNNS.a2019.0067 [Google Scholar]
- Gillard PJ, Sucharew H, Kleindorfer D, Belagaje S, Varon S, Alwell K, et al. The negative impact of spasticity on the health-related quality of life of stroke survivors: A longitudinal cohort study. Health Qual. Life Outcomes 2015, 13, 159. DOI:10.1186/s12955-015-0340-3 [Google Scholar]
- Ashworth B. Preliminary trial of carisoprodol in multiple sclerosis. Pract. 1964, 192, 540–542. Available online: https://europepmc.org/article/med/14143329 (accessed on 2 June 2026).
- Bohannon RW, Smith MB. Interrater reliability of a modified Ashworth scale of muscle spasticity. Phys. Ther. 1987, 67, 206–207. DOI:10.1093/ptj/67.2.206 [Google Scholar]
- Tardieu G, Shentoub S, Delarue R. Research on a technic for measurement of spasticity. Rev. Neurol. 1954, 91, 143–144. Available online: https://europepmc.org/article/med/14358132 (accessed on 2 June 2026).
- Held JP, Pierrot-Deseilligny E. Rééducation Motrice des Affections Neurologiques; J.-B. Baillière et Fils: Paris, France, 1969. [Google Scholar]
- Boyd RN, Graham HK. Objective measurement of clinical findings in the use of botulinum toxin type A for the management of children with cerebral palsy. Eur. J. Neurol. 1999, 6, S23–S35. DOI:10.1111/j.1468-1331.1999.tb00031.x [Google Scholar]
- Gregson JM, Leathley MJ, Moore AP, Smith TL, Sharma AK, Watkins CL. Reliability of the tone assessment scale and the modified Ashworth scale as clinical tools for assessing poststroke spasticity. Arch. Phys. Med. Rehabil. 1999, 80, 1013–1016. DOI:10.1016/s0003-999390053-9 [Google Scholar]
- Singh P, Joshua AM, Ganeshan S, Suresh S. Intra-rater reliability of the modified Tardieu scale to quantify spasticity in elbow flexors and ankle plantar flexors in adult stroke subjects. Ann. Indian. Acad. Neurol. 2011, 14, 23–26. DOI:10.4103/0972-2327.78045 [Google Scholar]
- Yoo M, Lee J, Lee Y, Lee S, Lee J, Kim S. Reliability of the Modified Ashworth and Modified Tardieu Scales for assessing spasticity in children with cerebral palsy. Children 2022, 9, 827. DOI:10.3390/children9060827 [Google Scholar]
- Craven BC, Morris AR. Modified Ashworth scale reliability for measurement of lower extremity spasticity among patients with spinal cord injury. Spinal Cord 2010, 48, 207–213. DOI:10.1038/sc.2009.107 [Google Scholar]
- Li F, Wu Y, Li X. Test-retest reliability and inter-rater reliability of the Modified Tardieu Scale and the Modified Ashworth Scale in hemiplegic patients with stroke. Eur. J. Phys. Rehabil. Med. 2014, 50, 9–15. Available online: https://www.researchgate.net/profile/Emmanuelle-Cugy/post/Could-anyone-provide-the-MODIFIED-Tardieu-Scale-in-a-pdf-form/attachment/59d6368ec49f478072ea44e1/AS%3A273675427745795%401442260714751/download/Reliability+of+the+modified+Tardieu+scale.pdf (accessed on 2 June 2026).
- Yamaguchi T, Petersen TH, Kirk H, Forman CR, Svane C, Kofoed-Hansen M, et al. Spasticity in adults with cerebral palsy and multiple sclerosis measured by objective clinically applicable technique. Clin. Neurophysiol. 2018, 129, 2010–2021. DOI:10.1016/j.clinph.2018.07.004 [Google Scholar]
- Ahmad Puzi A, Sidek SN, Md Yusof H, Khairuddin I. Objective analysis of muscle spasticity level in rehabilitation assessment. Int. J. Integr. Eng. 2019, 11. Available online: https://penerbit.uthm.edu.my/ojs/index.php/ijie/article/view/4688 (accessed on 2 June 2026).
- Choi S, Shin Y, Kim SY, Kim J. A novel sensor-based assessment of lower limb spasticity in children with cerebral palsy. J. Neuroeng. Rehabil. 2018, 15, 45. DOI:10.1186/s12984-018-0388-5 [Google Scholar]
- Colton S, Mentor FRC. The Balance Filter; MIT Report; Massachusetts Institute of Technology: Cambridge, MA, USA, 2007. [Google Scholar]
- Mizuno S, Shibasaka R, Tanabe H, Yao R, Morita Y. Muscle tone reduction effect of passive repetitive joint motion by piston finger device. Adv. Biomed. Eng. 2024, 13, 144–151. DOI:10.14326/abe.13.144 [Google Scholar]
- Tanabe H. The Approach of Reorganization of the Human Central Nervous System; Human Press: Tokyo, Japan, 2016; pp. 84–86. [Google Scholar]