
Endocranial Volume Estimates for Sts 25 (Australopithecus cf. africanus)
Endocranial Volume Estimates for Sts 25 (Australopithecus cf. africanus)

Received: 26 April 2026 Revised: 13 May 2026 Accepted: 27 May 2026 Published: 30 June 2026

© 2026 The authors. This is an open access article under the Creative Commons Attribution 4.0 International License (https://creativecommons.org/licenses/by/4.0/).
1. Introduction
Sts 25 is a relatively complete cranium (lacking the face, but preserving large portions of the cranial vault and a partial basicranium) from Sterkfontein that has appeared in a number of studies [1,2,3,4,5,6,7,8,9,10,11,12,13,14,15] but has never been formally described. (See [16] (p. 81, figure 31)) for pictures of the cranium, [13] (p. 214, figure 5) for computed tomography (CT) images of the cranium, and [14] (p. 117, figure 3) for CT images of the endocast). This specimen is missing the right frontal bone and the right temporal squama and is distorted, with a posteriorly displaced occipital bone and a laterally displaced left temporal bone [13]. The outer table of bone is poorly preserved [2,13] and has been characterized as “totally absent in most of the parietal bone” [13] (pp. 210–211). Sutural complexity seems to indicate Sts 25 is an adult specimen [4,17], but it is notable that Wolpoff thought it might be a juvenile [18] (see discussion in [17] (p. 86)) and characterized its overall size as “diminutive” in relation to other Sterkfontein specimens [11] (p. 33). Wolpoff ([3] (p. 377, figure 3)) estimated Sts 25’s endocranial volume (EV) to be between 350–375 cm3, a value smaller than the EV of any adult Australopithecus africanus specimen. (We provisionally consider Sts 25 to belong to A. africanus (or Australopithecus cf. africanus) following [3,4,5,6,7,8,10,12,15,17]. This is likely to remain an uncertain assignment until Sts 25 has been studied in greater detail). Although the exact methodology is not specified, a multiple regression equation by the same author [19] returns estimates between 348–397 cm3 (variation here is due to rounding imprecision and different constituent measurements) using existing data from Sts 25. No other EV estimate for this specimen currently exists.
Even though it is somewhat complete, Sts 25 is filled with calcified sediment [4,13,14], and its base has not been fully removed from the surrounding breccia [2,6]. Observations of this specimen’s cranial vault have been largely confined to the parietal bone [1,2,10]. Noting the absence of standard measurements of overall cranial size, we used published chord and arc measurements from the parietal bone to predict Sts 25’s EV.
In preparation for this study, we assessed existing equations for estimating EV from the cranial vault, specifically the parietal bone. Many of these equations required measurements not available for Sts 25 such as bregma–auricular point [20], neurocranial length, width, height [21], porion–vertex point, bregma–asterion, asterion–asterion [22], and other non-parietal measurements [23]. Equations we were able to use with available measurements produced EV predictions that were either too large—ranging between 508–1031 cm3 [24,25,26]—or too small—ranging between 219–397 cm3 [19,24,26]—compared to other A. africanus specimens, perhaps reflecting the different priorities (and comparative samples) of the studies from which these equations were taken. Unrealistic results from this pilot study prompted us to create our own prediction equations. In the process of addressing the question of Sts 25’s EV, we developed polynomial regression equations that can be used to predict EV in other hominin specimens and groups, including australopiths and early Homo, and addressed questions about the range of A. africanus brain sizes.
2. Materials and Methods
2.1. Sample
Chimpanzee comparative data [26] consisted of EVs and chord and arc measurements on the parietal bones of 60 (30 female, 30 male) western chimpanzees (Pan troglodytes verus) from Liberia. In terms of body size, the western chimpanzee subspecies is generally smaller than the central subspecies (Pan troglodytes troglodytes), but slightly larger than the eastern subspecies (Pan troglodytes schweinfurthii). Notwithstanding body size discrepancies, EVs overlap broadly in the three subspecies. Endocranial volumes for P. t. troglodytes females (n = 41, x = 347 cm3, sx = 26.3, range = 305–393 cm3) and males (n = 38, x = 379 cm3, sx = 41.4, range = 292–454 cm3) from [27] are comparable to data for P. t. verus females (n = 30, x = 361 cm3, sx = 30.4, range = 300–447 cm3) and males (n = 30, x = 373 cm3, sx = 34.9, range = 290–445 cm3) used in this study [26]. We modified the dataset by cubing cube-root EV values from [26] and removing one erroneous L–Aa measurement value (table 8, row 6 in [26] (p. 78)), which was >10 standard deviations greater than the L–Aa mean, thereby decreasing sample sizes (from n = 60 to n = 59) for two single-variable and three multivariate regressions.
Data for Sts 25 (Table 1) and other hominin specimens (listed in Table 2) are from the literature. We built prediction equations using data for relatively intact hominin specimens but excluded fragmentary crania like Sts 19, KNM-ER 1590, and OH 7. The complete dataset of hominin measurements is available in appendix table A1 in Supplementary Materials. Data available for Sts 25 determined the relevant variables and included chord and arc lengths of the sagittal margin, coronal margin, and lambdoidal margin of the parietal bone (see notes to Table 1). We identified several different measurements for the relevant dimensions in Sts 25 (Table 1). In cases where there were multiple measurements of a given variable for Sts 25, we ran separate analyses for each measurement value and generated multiple estimates and prediction intervals (see Section 4). All of the chimpanzee specimens and most of the hominins are developmentally adult, although a number of specimens in the hominin predictor sample (OH 5, Omo L338-y6, OH 13, OH 16, D2700, KNM-ER 42700, KNM-WT 15000, ZKD III) and test sample (MLD 1, OH 7, KNM-ER 1590, SK 54) could be considered late juveniles or adolescents and all specimens (including Taung) are at or beyond the point of asymptotic growth cessation [15]. Taung is just under four years of age (~3.83 years), and brain growth is complete (according to a chimpanzee standard) or nearly complete (according to a modern human standard) [15]. Taung preserves two variables and appears in four analyses (out of 16). At just under four years of age, Taung already had a parietal sagittal margin chord length (78 mm) greater than Sts 71 (73–74 mm) and MLD-37/38 (74–77 mm) and arc length (85 mm) greater than or equal to Sts 71 (78–85 mm), MLD 1 (85 mm), and MLD 37/38 (82–88 mm)—see appendix table A1 in Supplementary Materials for details. Taking these facts into account, we decided to include Taung in the comparative sample regardless of its juvenile status. These observations seem to indicate that some dimensions of the parietal bone reach adult size by the end of the neurocranial growth period and do not change appreciably throughout the remainder of juvenile growth. More work is needed to corroborate these observations.
Table 1. Published parietal bone measurements for Sts 25.
|
Measurement * |
Tobias (1967) ** [1] |
Wolpoff (1974) [2] |
Wood (1991) [5] |
Kimbel et al. (2004) [10] |
Range |
|---|---|---|---|---|---|
|
Parietal sagittal chord (B–Lc) |
73.5 *** |
- |
74 **** |
76 |
74–76 |
|
Parietal sagittal arc (B–La) |
78.0 *** |
81 |
78 **** |
84 |
78–84 |
|
Parietal coronal chord (B–Pc) |
66.5 *** (R) |
- |
67 **** |
- |
67 |
|
Parietal coronal arc (B–Pa) |
82.0 *** (R) |
- |
82 **** |
- |
82 |
|
Parietal lambdoidal chord (L–Ac) |
54.0 *** (L) |
- |
54 **** |
- |
54 |
|
Parietal lambdoidal arc (L–Aa) |
55.5 *** (L) |
- |
56 **** |
- |
56 |
* Ref. [1]: Parietal sagittal chord, arc; coronal margin chord, arc; lambdoid margin chord, arc; Ref. [2]: Parietal sagittal length (C [#25], A [#26]), parietal coronal breadth (C [#29], A [#30]), parietal lambdoid length (C [#31], A [#32]); Ref. [10]: sagittal margin chord (SMC), arc (SMA); Ref. [26]: Bregma–Lambda chord (B–Lc), arc (B–La), Bregma–Pterion chord (B–Pc), arc (B–Pa), Lambda–Asterion chord (L–Ac), arc (L–Aa); ** For this table, we maintained the same number of significant figures appearing in original publications; *** Ref. [1] gave this a value of “±” indicating rough estimation; **** Rounded values from [1].
Table 2. Sample details including lists of specimens for each hominin species. Values in parentheses indicate the number of analyses in which each specimen was included.
|
Species |
n |
Specimens |
|---|---|---|
|
Pan troglodytes verus |
60 |
30 females/30 males * |
|
Australopithecus afarensis |
2 |
A.L. 444-2 (6), A.L. 333-45 (4) |
|
Australopithecus africanus |
4 |
Sts 5 (16), Sts 71 (9), MLD 37/38 (16), Taung (4) |
|
Paranthropus boisei |
6 |
KNM-ER 406 (16), KNM-ER 407 (16), KNM-ER 13750 (6), KNM-ER 23000 (6), OH 5 (16), Omo L338-y6 (16) |
|
Homo rudolfensis |
2 |
KNM-ER 1470 (16), KNM-ER 3732 (9) |
|
Homo habilis |
5 |
KNM-ER 1805 (16), KNM-ER 1813 (16), OH 13 (8), OH 16 (8), OH 24 (6) |
|
Homo erectus |
29 |
D2280 (8), D2282 (8), D2700 (8), Daka (8), KNM-ER 3733 (16), KNM-ER 3883 (16), KNM-ER 42700 (2), KNM-WT 15000 (4), Ng1 (8), Ng6 (4), Ng7 (8), Ng10 (4), Ng11 (8), Ng12 (8), OH 9 (4), OH 12 (4), Sale (2), Sangiran 2 (8), Sangiran IX (4), Sangiran 10 (16), Sangiran 17 (16), Sm1 (8), Sm3 (11), Trinil 2 (4), ZKD II (16), ZKD III (16), ZKD X (8), ZKD XI (16), ZKD XII (16) |
* Further details in [26].
2.2. Variables
Variable names and definitions [26] include chord (Bregma–Lambda chord, B–Lc) and arc (Bregma–Lambda arc, B–La) lengths of the sagittal margin, chord (Lambda–Asterion chord, L–Ac) and arc (Lambda–Asterion arc, L–Aa) lengths of the lambdoidal margin, and chord (Bregma–Pterion chord, B–Pc) and arc (Bregma–Pterion arc, B–Pa) lengths of the coronal margin of the parietal bone.
As noted above, there were multiple measurement values for Sts 25 and other specimens. In most (if not all) instances, we suspect measurements differed because researchers identified sutural junctions in different ways. For example, different measurements of Sts 25’s parietal sagittal margin chord length [1,10] and arc length [1,2,10] likely indicate different estimates for the location of bregma. Some specimens, like Sts 5, have multiple parietal measurements because sutures are obliterated or otherwise difficult to see. Each of these measurements is valid, representing logical decisions made at different times by different researchers. Rather than choose between different measurements, we decided to retain all reasonable measurement values and run two sets of analyses: one with smaller values (minimum, or “min”) and one with larger values (maximum, or “max”). We created new EV estimates for fragmentary hominin specimens, including A.L. 162-28 (Australopithecus afarensis), MLD 1 (A. africanus or Australopithecus prometheus), Sts 58 (A. africanus or Homo cf. habilis), SK 54 (Paranthropus robustus or Homo cf. erectus), OH 7 (H. habilis), KNM-ER 732 (Paranthropus boisei), KNM-ER 1590 (Homo cf. rudolfensis), and Sangiran 3, 4, and 12 (H. erectus).
We estimated EV for a specimen (Sts 58) which is not always included in quantitative analyses of the parietal bone because existing measurements were taken on the less worn endocranial surface [1]. We estimated ectocranial values for Sts 58’s sagittal margin chord (B–Lc) and sagittal margin arc (B–La) from endocranial measurements using linear regression in small samples of comparable (for this purpose) hominin specimens (including KNM-ER 1470, OH 24, KNM-ER 1805, OH 5, OH 13, KNM-ER 407, KNM-ER 23000, and KNM-ER 3732). The resulting equations,
predicted values of 76.8 mm (95% PI = 71.8–81.7 mm) for sagittal margin chord length (from an endocranial chord length of 70.3 mm) and 84.6 mm (95% PI = 77.3–91.9 mm) for sagittal margin arc length (from an endocranial arc length of 74.5 mm). Note that other equations in the literature use endocranial variables to predict EV, e.g., [25], and so there is the possibility that future estimates of Sts 58’s EV can be based on endocranial data. In this study, we converted Sts 58’s endocranial chord and arc lengths to their ectocranial equivalents in order to generate EV estimates using our polynomial equations. Further work is necessary to estimate Sts 58’s EV using endocranial data.
As noted above, we retained reasonable measurement values for hominins when more than one measurement was available. However, we did modify one additional measurement, B–Lc for MLD 1. Dart’s [28] B–Lc measurement for MLD 1 (68 mm) is smaller than values for Sts 25, Sts 71, and MLD 37/38, small- or average-sized A. africanus crania. After examining the original fossil, Wolpoff ([2] (p. 398)) noted the presence of 12 Wormian bones, opining that “Dart picked the point furthest posterior on the sagittal suture anterior to the Wormian bone development” for lambda. Wolpoff [2] located lambda using the clear intersection of the sagittal and lambdoidal sutures on the endocranial surface of the parietal bone, then transposed this location to the ectocranial surface. Adding 13.5 mm, the difference between the two lambda locations, to Dart’s [28] measurement, we calculated a “corrected” measurement of B–Lc (81.5 mm) that we think more accurately represents MLD 1’s large size.
2.3. Statistics and Analyses
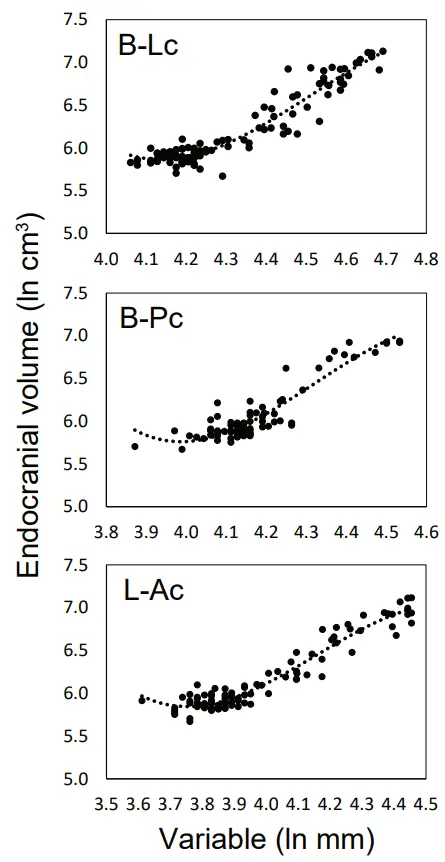
We used natural log-transformed variables to calculate single-variable and multivariate polynomial regression prediction equations on the combined sample of chimpanzee and hominin specimens. A recent study [29] found that logging variables improved standard errors of the estimate (SEE) and related statistics like confidence intervals. It was necessary to use polynomial regression since the relationship between EV and each parietal variable was non-linear even after data were logged (Figure 1). We used 3rd-order polynomial models, which provided a good fit in all cases while avoiding problems that arise because of overfitting. We presented coefficients for raw polynomials in the case of single-variable regressions so that published intercepts and polynomial coefficients can be used to generate estimates directly, without additional information. We used orthogonal polynomials in multivariate polynomial regressions to minimize the effects of collinearity. In this case, predictions cannot be generated directly from published coefficients. The code and data used in all analyses are available in the Supplementary Information [30]. We considered using piecemeal approaches (LOESS regression, β-splines, cubic splines) or models that are non-linear in the parameters, but prioritized the ability to predict values directly from published coefficients (in the case of single-variable equations) over slightly better fits at the lower and upper extremes of the dataset.
We generated four multivariate polynomial regression models: two full models (one with minimum values, one with maximum values) and two reduced models that include only variables with significant coefficients from each full model. The reduced “min” multivariate model included three variables (B–Pc, L–Ac, L–Aa), and the reduced “max” multivariate model included two variables (B–Lc, B–Pc). This process is akin to the procedure followed in multi-step multiple regression, but the nature of polynomial data (in which squared and cubed data for individual variables are included as covariates to build the model) precludes a standardized forward- or backward-step selection process.
We transformed log estimates back to raw data space by multiplying exponentiated values by a correction factor (calculated as the average of the Smearing estimate and ratio estimate) to account for log detransformation bias [31]. We presented standard error of the estimate (SEE) and percent standard error of the estimate (%SEE) statistics for the logged equations [32], but also transformed SEE values into original units (raw cm3) for meta-analysis (see below) by (1) adding/subtracting SEE to/from the natural log point estimate, (2) exponentiating and correcting resulting values, then (3) averaging resulting asymmetrical raw values to produce centered raw SEE values. We calculated mean percent prediction error (MPE) for the total sample [32,33,34], but also calculated MPE values for chimpanzees and each hominin species, including A. africanus.
We calculated 95% prediction intervals for each estimate using an equation for the standard error of the estimate of a new value that was not part of the original dataset ([35] (p. 346, Eq. 17.29)). We centered prediction intervals to account for the fact that exponentiated and corrected lower and upper limit values are asymmetric around the exponentiated and corrected point estimate. Because of this, 95% prediction intervals should be considered approximate.
We calculated a single-group summary and 95% confidence intervals for Sts 25’s EV estimates, and 95% prediction intervals for all estimates, using an inverse-variance random-effects model, a method commonly used in meta-analysis. In this case, we calculated the inverse weighted mean using the corrected point estimate, the corrected/centered raw SEE (which is a measure of the standard deviation of the residuals from the regression analysis), and the sample size at [36]. As with regression prediction intervals, calculations of the random-effects confidence intervals and prediction intervals must be considered approximate since we centered SEE values prior to meta-analysis.
We predicted EVs for 10 additional fragmentary hominin specimens, and presented these results as box-and-whisker plots. In this case, we calculated median—not mean—values for different estimates.
Statistics were performed in RStudio 2024.04.2+764 “Chocolate Cosmos” Release (5 June 2024) for Windows running R4.4.1, and ggplot2, dplyr, and ggridges packages were used to make plots. The code and datasets used to run all analyses and to make figures are available in the Supplementary Information [30].
3. Results
Regression equation summary statistics and predictions are listed in Table 3. All coefficients for single-variable polynomial regressions are significant at the p < 0.05 level. Coefficients for three variables (B–Pc, L–Ac, L–Aa) were significant (p < 0.05) for the “MV-full (min)” model, and coefficients for two variables (B–Lc, B–Pc) were significant (p < 0.05) for the “MV-full (max)” model. As noted above, these significant coefficients were used to reconstruct the two reduced (“MV-3 var (min)” and “MV-2 var (max)”) models. The complete set of statistics, including regression coefficients and exact values for significance tests, is available in appendix table A2 in Supplementary Materials.
Table 3. Regression summary statistics and predictions. Full statistics (including significance levels for individual intercept and slope coefficient values presented to 15 significant figures) are available in appendix table A2 in Supplementary Materials.
|
Variable |
n |
Adj. r2 |
SEE |
%SEE |
CF |
MPE (Aafr) |
MPE (Total) |
Est [95% PI] |
|---|---|---|---|---|---|---|---|---|
|
Single-variable (SV) models |
||||||||
|
L-Aa (max) |
92 |
0.905 |
0.126 |
13.4 |
1.0084 |
6.9 |
9.1 |
412 [308–517] |
|
L-Aa (min) |
92 |
0.935 |
0.103 |
10.8 |
1.0053 |
3.1 |
7.9 |
417 [331–503] |
|
L-Ac (max) |
97 |
0.894 |
0.130 |
13.9 |
1.0091 |
2.8 |
9.2 |
436 [332–551] |
|
B-Pc (max) |
81 |
0.854 |
0.129 |
13.8 |
1.0085 |
12.0 |
9.7 |
442 [326–557] |
|
B-Pc (min) |
81 |
0.845 |
0.133 |
14.2 |
1.0089 |
19.3 |
9.9 |
442 [323–561] |
|
L-Ac (min) |
97 |
0.930 |
0.106 |
11.2 |
1.0059 |
7.0 |
8.3 |
445 [350–540] |
|
B-La (min) |
102 |
0.856 |
0.159 |
17.2 |
1.0130 |
12.9 |
11.1 |
445 [301–588] |
|
B-Lc (min) |
104 |
0.880 |
0.145 |
15.6 |
1.0107 |
7.9 |
9.8 |
449 [317–580] |
|
B-Lc (max) |
104 |
0.904 |
0.130 |
13.9 |
1.0088 |
11.7 |
9.3 |
456 [337–576] |
|
B-La (max) |
102 |
0.876 |
0.147 |
15.9 |
1.0113 |
20.7 |
10.5 |
494 [346–641] |
|
B-Pa (max) |
82 |
0.778 |
0.164 |
17.8 |
1.0135 |
13.7 |
12.1 |
501 [333–669] |
|
B-Pa (min) |
82 |
0.773 |
0.166 |
18.1 |
1.0138 |
16.1 |
12.3 |
501 [331–671] |
|
SV random-effects mean [95% PI] |
453 [393–512] |
|||||||
|
Multivariate (MV) models |
||||||||
|
MV-full (max) |
76 |
0.959 |
0.064 |
6.6 |
1.0015 |
4.7 |
4.1 |
432 [372–493] |
|
MV-3var (min) |
76 |
0.944 |
0.075 |
7.8 |
1.0023 |
0.9 |
5.5 |
437 [370–504] |
|
MV-full (min) |
76 |
0.965 |
0.059 |
6.1 |
1.0012 |
1.2 |
4.0 |
444 [387–502] |
|
MV-2var (max) |
80 |
0.941 |
0.079 |
8.3 |
1.0032 |
9.1 |
5.6 |
469 [393–545] |
|
MV random-effects mean [95% PI] |
445 [377–514] |
|||||||
Abbreviations: SEE = standard error of the estimate; CF = correction factor; MPE = mean percent prediction error; Aafr = A. africanus; Est = estimate; 95% PI = 95% prediction interval. Equations are ordered from lowest to highest point estimate values within each model.
Endocranial volume predictions for Sts 25 are illustrated in Figure 2, which shows the random-effects mean, 95% confidence intervals, and 95% prediction intervals for predictions from single-variable and multivariate polynomial models. Table 3 lists each estimate along with its individual 95% prediction interval (traditionally calculated, not via meta-analysis) and mean percent prediction error (MPE) for each model (calculated for all specimens and for A. africanus separately). Point estimates for EV ranged between 412–501 cm3 for single-variable estimates and 432–469 cm3 for multivariate estimates, with random-effects means and prediction intervals of 453 [393–512] cm3 from single-variable polynomial regressions and 446 [377–514] cm3 from multivariate polynomial regressions.
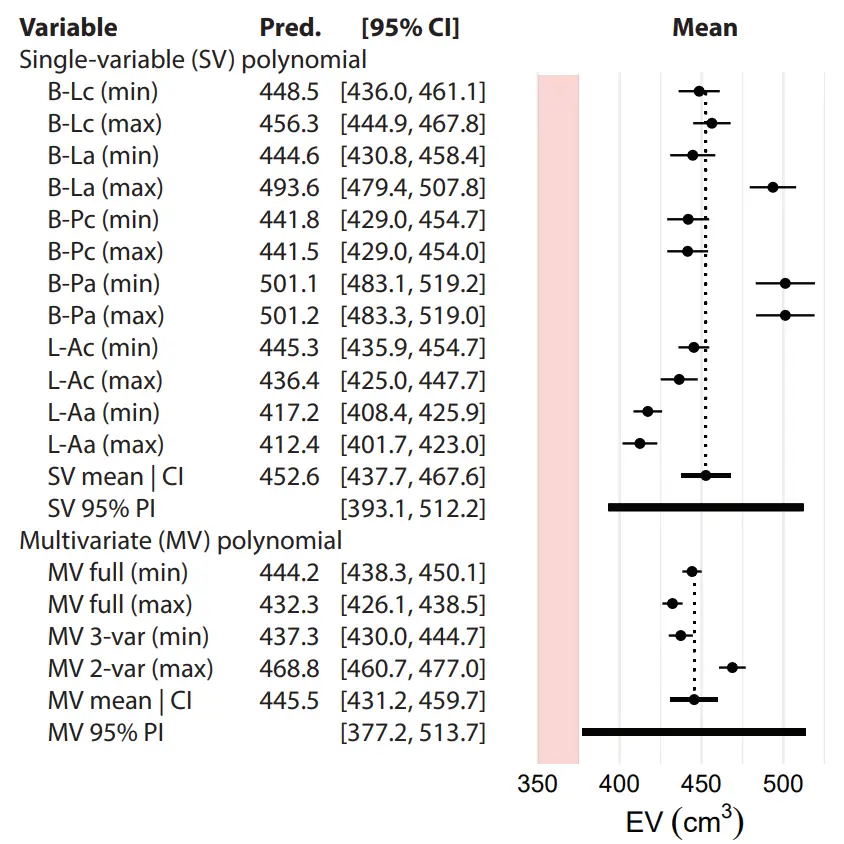
Figure 2. Forest plot showing regression predictions and confidence intervals (“95% CI”) for Sts 25’s EV, along with random-effects mean predictions, 95% CIs, and 95% prediction intervals (PIs) for single-variable (SV) and multivariate (MV) regression models. The pink shaded area indicates the range of the previous estimate from [3]. See text and Table 1 for abbreviations of variable names.
4. Discussion
4.1. Considerations About Sample Composition
One of this study’s goals was to develop parietal regression equations for estimating EV in A. africanus (of all sizes, not just for Sts 25) and other early hominin species. The parietal sagittal margin is known to be short in A. africanus in relation to mediolateral breadth of the parietal bone [1,10,26,37,38,39], but even so, most measurement values for A. africanus parietal variables fall at the limit of, or outside, the range of variation for chimpanzees, limiting the usefulness of equations based on chimpanzee data alone. We added data for early hominins to the chimpanzee sample, which ensured that measurement values for Sts 25 fall within the domain of the combined data distribution (see Figure 3). As a result, the equations generated in this study are useful for predicting EVs between 290 cm3 and 1251 cm3, the range of the data included in the combined comparative sample. This range fills a need for equations to estimate EV in australopiths, since existing parietal equations are based on smaller-brained samples of chimpanzees [26] or larger-brained samples of contemporary humans [24,26]. Other equations [19,25] do incorporate data for australopiths and early Homo, among other groups, but do not seem to perform well for smaller-brained hominins (reflecting the original purpose of these equations for estimating EV in the larger-brained H. habilis specimen OH 7).
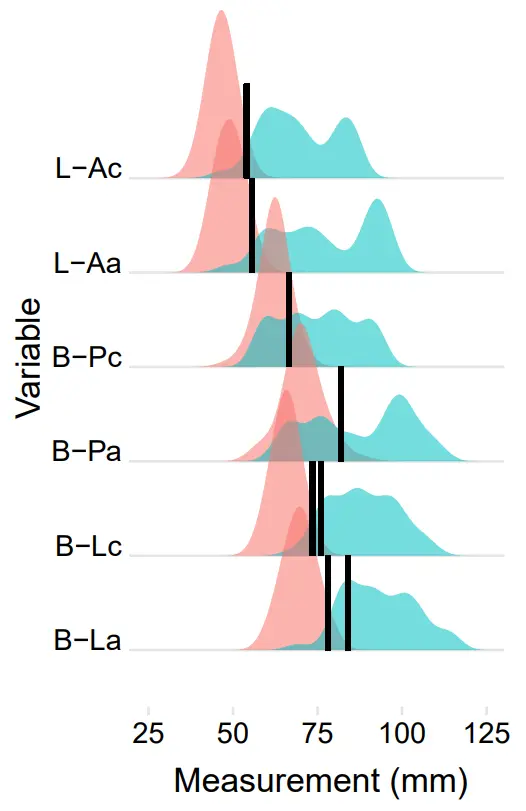
The decision to combine data from two different datasets requires additional justification. There is an argument that could be made that hominins are not part of any chimpanzee or contemporary human sample, and therefore these samples should not be used to estimate hominin attributes, including EVs. However, it has become standard practice to use chimpanzee and living human comparative samples to estimate values for fossil specimens, and this approach has been employed many times previously to estimate hominin EVs, e.g., [22,23,24,25,26]. In this study, we created a combined chimpanzee + hominin predictor sample to overcome the extrapolation problem outlined above. Given that this is standard practice, there is no reason why this approach should not be extended to both australopiths and early genus Homo, as it is in this study.
4.2. Considerations About Ontogenetic Status
It is intriguing to think that Wolpoff’s identification of Sts 25 as “quite young” [18] (p. 79) might have informed his low EV prediction [3], or vice versa. Nonetheless, there is no indication that Sts 25 is anything other than an adult specimen [4,5,6,7,13,14,15,17]. Grine [17] (p. 86) cited an observation by Kimbel and Rak that the complexity of Sts 25’s ectocranial sutures is similar to the condition in MLD 37/38, a specimen with heavily-worn third molar teeth. Sts 25’s adult status is corroborated in the present study. Parietal bone measurements for this specimen compare favorably to measurements for adult specimens of A. africanus (Sts 71, MLD 37/38, Sts 5). Two chord measurements (B–Lc, L–Ac) fall within the A. africanus range, and associated arc measurements (B–La, L–Aa) are a few millimeters lower in Sts 25 than in Sts 71 and MLD 37/38. Overall, Sts 25’s parietal bone is small, but not abnormally so, and there is no reason to assume such variation is ontogenetic in nature.
4.3. Predictions for Other Hominins
Predictions for ten other hominin specimens are shown in Figure 4 and Table 4. Predictions for A.L. 162-28 (382–401 cm3), KNM-ER 732 (449–469 cm3), OH 7 (537–1044 cm3), KNM-ER 1590 (531–853 cm3), and Sangiran 4 (596–1074 cm3) are more-or-less consistent with previous estimates [16,25,26,40,41,42,43,44]. It is notable that seven (out of 21) estimates for OH 7 are larger than smaller previous estimates [19,25,26,45,46] but consistent with larger estimates [25,26], including recent estimates (729–824 cm3) from a 3D virtual reconstruction [44]. Predictions for MLD 1 (509–595 cm3) overlap previous estimates (which have been reported as 500 ± 20 cm3 [40] and 500–520 cm3 [16]) at the lower end, but the largest estimates (567–595 cm3) are equivalent to large estimates for StW 505 (575–600 cm3), a putative male specimen of A. africanus [16,20,47].
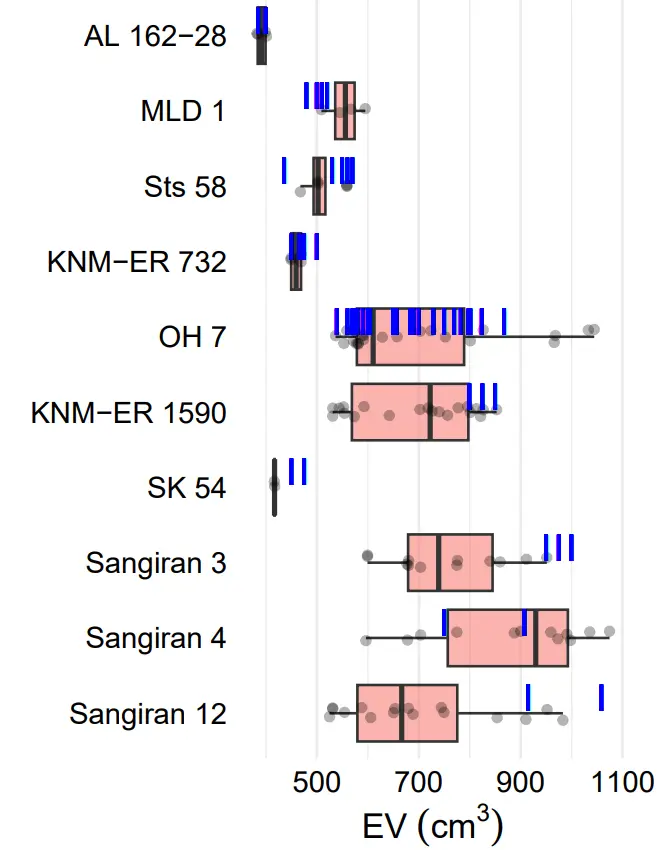
Figure 4. Box plots of endocranial volume (EV) point estimates for 10 fossil hominins. Individual point estimates are indicated by semitransparent jittered points and previous estimates are indicated by vertical blue bars.
Table 4. Endocranial volume predictions for 10 fragmentary hominin specimens. See text and Table 1 for predictor variable abbreviations.
|
Specimen |
Species |
N * |
Predictor Variables |
Median |
Range |
|---|---|---|---|---|---|
|
A.L. 162-28 |
A. afarensis ** |
4 |
L–Ac, L–Aa |
391.5 |
382–401 |
|
Sts 58 |
A. africanus ** |
4 |
B–Lc, B–La |
502.4 |
468–559 |
|
MLD 1 |
A. africanus ** |
4 |
B–Lc, B–La |
556.0 |
509–595 |
|
KNM-ER 732 |
P. boisei |
4 |
B–Pc, B–Pa |
459.2 |
449–469 |
|
OH 7 |
H. habilis |
22 |
B–Lc, B–La, B–Pc, B–Pa, L–Ac, L–Aa |
610.4 |
537–1044 |
|
KNM-ER 1590 |
H. rudolfensis ** |
20 |
B–Lc, B–La, B–Pc, B–Pa, L–Ac, L–Aa |
722.3 |
531–853 |
|
SK 54 |
Homo cf. erectus ** |
2 |
B–Pc |
416.9 |
416–417 |
|
Sangiran 3 |
H. erectus |
12 |
B–Lc, B–La, B–Pc, B–Pa, L–Ac, L–Aa |
739.1 |
599–911 |
|
Sangiran 4 |
H. erectus |
12 |
B–Lc, B–La, L–Ac, L–Aa |
929.6 |
596–1074 |
|
Sangiran 12 |
H. erectus |
16 |
B–Lc, B–La, B–Pc, B–Pa, L–Ac, L–Aa |
666.5 |
525–983 |
* “N” indicates the number of regression estimates for each specimen (including intermediate values when there are more than two predictor values for a given specimen); ** Taxonomic designation uncertain.
Sterkfontein specimen Sts 58 is a calvaria that was discovered alongside Sts 19 in a rubble dump in the Sterkfontein Member 4 (“Type Site”) main chamber in 1947, north of other specimens [48,49]. Broom and Robinson [48,50] thought that the Sts 58 parietal fit together with Sts 19, a partial basicranium, as Sterkfontein VIII, or “skull no. 8”. Sts 19 has been variably assigned to A. africanus [7,8,48,51] and early Homo, perhaps H. habilis [52,53,54,55,56,57]. Among modern authors, some (e.g., [16]) consider Sts 58 to be from the same individual as Sts 19, whereas others (e.g., Clarke, reported in [58]) question the connection.
New estimates for Sts 58 (468–559 cm3) are consistent with larger historical estimates of 530 cm3 [48,50] and 550–570 cm3 [59] for “Skull no. 8”, but they are larger than Holloway’s [45,60,61] estimate for the Sts 19 basicranium (436 cm3). This may be evidence that Sts 19 and Sts 58 do not represent the same individual. On the other hand, it is important to consider that Holloway [45] reconstructed Sts 19 using the partial endocast method with reference to australopith-grade endocasts (Taung, Sts 5, SK 1585, OH 5), a practice that might artificially depress EV estimates if this specimen represents early Homo. Holloway et al. [16] (p. 30) flagged Sts 19 as a specimen in which the missing parts exceed the preserved parts, giving the endocast he constructed a grade of “B1”. Either way, divergent EV estimates for Sts 19 and Sts 58 highlight the need for further research to critically re-examine the two pieces of Sterkfontein “Skull no. 8”.
New EV estimates for P. boisei specimen KNM-ER 732 (449–469 cm3) are smaller than a previous estimate of 500 cm3 [16,40] but on par with an estimate of 466 cm3 (460–472 cm3) [62], implying a degree of sexual size dimorphism for P. boisei EV that better matches this species’ craniodental size dimorphism. New EV estimates for SK 54 (416–417 cm3) are smaller than a previous estimate of 450–475 cm3 (with a potential adult value of 500 cm3 [16]). Although it might at first seem like these smaller estimates are inconsistent with the idea that SK 54 resembles H. erectus more than P. robustus [63], it is important to remember that this specimen is from a juvenile whose brain and surrounding cranial vault might not have finished growing. New EV estimates for Sangiran 3 (677–951 cm3) and Sangiran 12 (525–983 cm3) overlap previous estimates but skew to lower values, raising questions about the size (or maybe the measurements) of these specimens’ parietal bones.
In summary, of the above estimates, Sts 58 is a new estimate, and can be used in comparative analyses in lieu of older estimates [50,59] and the estimate based on Sts 19 [45,60,61], whose endocast required heavy reconstruction and which might not be associated with Sts 58 anyway. New EV estimates for KNM-ER 732 support smaller previous reconstructions [62], whereas estimates for MLD 1 suggest that Holloway’s [40] reconstruction might be something like a minimum value. Holloway et al. [16] graded the reliability of his estimate for MLD 1 as “B2–3”, opining that more of the endocast was reconstructed than was actually present. A recent study [64] presented wider cranial measurements across MLD 1’s parietal bones and supramastoid crests, consistent with a higher EV determination. We advocate for our new estimate to replace (or at least supplement) the measured volume from Holloway’s endocast reconstruction in comparative studies of hominin brain size. Other estimates can be considered supplemental to previous estimates, although values for Sangiran 3 and Sangiran 12 require further investigation to resolve discrepancies with previous reconstructions.
4.4. Endocranial Volume in Sts 25 and A. africanus
New EV estimates for Sts 25, MLD 1, and Sts 58 provide greater resolution for the A. africanus sensu lato hypodigm by addressing issues at the lower and upper ends of the species range (Figure 5). Prior EV estimates of 350–375 cm3 for Sts 25 implied an expanded lower end of the range. New estimates ~450 cm3 position Sts 25 near the middle of the A. africanus range in close approximation to MLD 37/38 and Type 2, and the range of point estimates overlaps values for Sts 71, Sts 19, MLD 37/38, Type 2, and Sts 5 (Figure 5). Excluding 350–375 cm3 estimates for Sts 25 reduces the A. africanus range from 218 cm3 to 177 cm3. New estimates for Sts 25 “fit what the eye can see” [20] (p. 9b), since basicranial and parietal dimensions for Sts 25 generally match or exceed values in Sts 19, Sts 71, and MLD 37/38 [1,6,7,10]. New larger EV estimates for MLD 1 position this specimen with StW 505 at the upper end of the A. africanus range. New estimates for Sts 58 underline questions about this specimen’s alpha taxonomic assignment and identity. As part of “Skull no. 8”, Broom & Robinson [48] considered Sts 58 to be a male specimen of Plesianthropus transvaalensis (later subsumed into A. africanus), and Schepers [65] thought that “Skull no. 8”’s endocast eclipsed Sts 5 in size. At 468–559 cm3, Sts 58 falls at the upper end of the A. africanus range, as originally proposed, and again exceeds Sts 5 in size. If Sts 58 is assigned to A. africanus, not Homo, we might consider this specimen to be one of three or four A. africanus males (along with MLD 1, StW 505, and, according to some researchers [66,67,68], Sts 5) that has an associated EV. Of course, if Sts 58 is early Homo instead of A. africanus, then its estimated brain size would fall among the very smallest values for this group, especially so if Sts 19 (436 cm3) and Sts 58 (468–559 cm3) belong to the same specimen. If so, then more work is needed to reconcile Sts 19’s small brain size with its Homo-like basicranium.
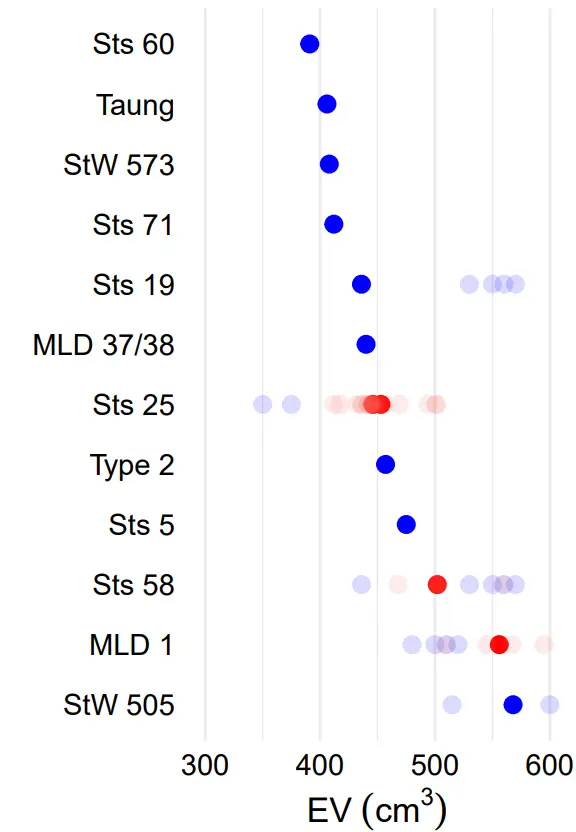
Figure 5. Dot plot showing the distribution of EV in A. africanus (including specimens from the expanded hypodigm like StW 573, Sts 19, Sts 58, and MLD 1 that have been assigned by some researchers to other species). Solid red dots mark summary estimates from this study, and semitransparent red dots represent individual point estimates. Solid blue dots mark established EV values for other specimens, and semitransparent blue dots represent selected alternative and/or historical estimates.
Finally, it is important to note that EV estimates for Sts 25 should be considered preliminary attempts pending a 3-D virtual reconstruction following established techniques (e.g., [69]) to account for taphonomic damage (including exfoliation of the outer table of bone), displacement of the occipital and left temporal bones, disconnection and misalignment of the basicranium (which is still partly embedded in breccia) relative to the cranial vault, missing sections of the right frontal and temporal bones, and the presence of calcified sediment filling the cranial cavity. Until then, there is no reason to exclude Sts 25 from studies that include Sts 19, Taung, Sts 71, MLD 1, and/or StW 505 since Sts 25’s cranial vault is as well- (or better-) preserved as these specimens. Acknowledging that more accurate estimates are possible and may be forthcoming, we justify our efforts by noting that lesser-known, sometimes fragmentary, understudied fossils have the potential to answer questions about species variability that cannot be addressed by focusing on just the most complete specimens (a point noted previously by [69]). When there are so few fossils, every piece of data counts. We invite other researchers to test the hypothesis that Sts 25’s EV falls near the middle of the A. africanus range.
5. Conclusions
New and revised estimates for Sts 25, Sts 58, and MLD 1 help resolve questions about the A. africanus range and establish Sts 25 and Sts 58 as specimens that can be included in future studies of hominin brain evolution. More work is necessary to resolve discrepancies between EV estimates for Sts 19 and Sts 58, which might or might not belong to the same individual. The polynomial regression equations developed here should prove useful for estimating EVs for fragmentary crania of fossil hominins in the size range of australopiths and early members of the genus Homo, including H. erectus.
Supplementary Materials
The following supporting information can be found at: https://data.mendeley.com/datasets/n4k25sbv9k/1 (accessed on 12 June 2026).
Acknowledgments
We would like to thank Lee Ann Smith, Mark Poch, and everyone else involved with the Natural Science Summer Research Program at Benedictine University for logistic and financial support.
Author Contributions
Conceptualization, R.C.M. and S.H.; Methodology, R.C.M.; Validation, R.C.M. and S.H.; Formal Analysis, R.C.M. and S.H.; Investigation, R.C.M. and S.H.; Resources, R.C.M.; Data Curation, R.C.M.; Writing—Original Draft Preparation, R.C.M. and S.H.; Writing—Review & Editing, R.C.M. and S.H.; Visualization, R.C.M. and S.H.; Supervision, R.C.M.; Project Administration, R.C.M.; Funding Acquisition, R.C.M.
Ethics Statement
Not applicable.
Informed Consent Statement
Not applicable.
Data Availability Statement
All data sets and code used to perform analyses and make figures are freely available at https://data.mendeley.com/datasets/n4k25sbv9k/1 (accessed on 12 June 2026), and may be used by other researchers for academic purposes without restriction.
Funding
This research was funded by the Benedictine University College of Science and Health and Natural Science Summer Research Program. This research received no external funding.
Declaration of Competing Interest
The authors declare that they have no known competing financial interests or personal relationships that could have appeared to influence the work reported in this paper.
References
- Tobias PV. Olduvai Gorge Vol. 2. The Cranium and Maxillary Dentition of Australopithecus (Zinjanthropus) boisei, 3rd ed.; Oxford University Press: Oxford, UK, 1967. [Google Scholar]
- Wolpoff MH. Sagittal cresting in the South African australopithecines. Am. J. Phys. Anthropol. 1974, 40, 397–408. DOI:10.1002/ajpa.1330400312 [Google Scholar]
- Wolpoff MH. Human Evolution, 1996–1997 Edition; McGraw-Hill: New York, NY, USA, 1996. [Google Scholar]
- Brain CK. The Hunters or the Hunted? An Introduction to African Cave Taphonomy; The University of Chicago Press: Chicago, IL, USA, 1981. [Google Scholar]
- Wood BA. Koobi Fora Research Project, Volume 4. Cranial Remains; Oxford University Press: New York, NY, USA, 1991. [Google Scholar]
- Dean MC. The Comparative Anatomy of the Hominoid Cranial Base. Ph.D. Dissertation, University College London, London, UK, 1982. [Google Scholar]
- Dean MC, Wood BA. Basicranial anatomy of Plio-Pleistocene hominids from East and South Africa. Am. J. Phys. Anthropol. 1982, 59, 157–174. DOI:10.1002/ajpa.1330590206 [Google Scholar]
- De Miguel C, Henneberg M. Variation in hominid brain size: How much is due to method? Homo 2001, 52, 3–58. DOI:10.1078/0018-442X-00019 [Google Scholar]
- Wolpoff MH, Lee S-H. The Late Pleistocene human species of Israel. BMSAP 2001, 13, 291–310. DOI:10.4000/bmsap.6220 [Google Scholar]
- Kimbel WH, Rak Y, Johanson DC. The Skull of Australopithecus afarensis; Oxford University Press: Oxford, UK, 2004. [Google Scholar]
- Lee S-H, Wolpoff MH. Habiline variation: A new approach using STET. Theory Biosci. 2005, 124, 25–40. DOI:10.1016/j.thbio.2005.01.004 [Google Scholar]
- Quam R, Martinez I, Rosa M, Bonmati A, Lorenzo C, De Ruiter DJ, et al. Early hominin auditory capacities. Sci. Adv. 2015, 1, e1500355. DOI:10.1126/sciadv.1500355 [Google Scholar]
- Beaudet A, Carlson KJ, Clarke RJ, De Beer F, Dhaene J, Heaton JL, et al. Cranial vault thickness variation and inner structural organization in the StW 578 cranium from Jacovec Cavern, South Africa. J. Hum. Evol. 2018, 121, 204–220. DOI:10.1016/j.jhevol.2018.04.004 [Google Scholar]
- Beaudet A, Clarke RJ, De Jager EJ, Bruxelles L, Carlson KJ, Crompton R, et al. The endocast of StW 573 (“Little Foot”) and hominin brain evolution. J. Hum. Evol. 2019, 126, 112–123. DOI:10.1016/j.jhevol.2018.11.009 [Google Scholar]
- McCarthy RC, Zimel E. Revised estimates of Taung’s brain size growth. S. Afr. J. Sci. 2020, 116, 5963. DOI:10.17159/sajs.2020/5963 [Google Scholar]
- Holloway RL, Broadfield D, Yuan M. Brain Endocasts: The Paleoneurological Record. The Human Fossil Record; Wiley-Liss: Hoboken, NJ, USA, 2004; Volume 3. [Google Scholar]
- Grine FE. The alpha taxonomy of Australopithecus africanus. In The Paleobiology of Australopithecus, Vertebrate Paleobiology and Paleoanthropology; Reed KE, Fleagle JG, Leakey RE, Eds.; Springer Science+Business Media: Dordrecht, The Netherlands, 2013; pp. 73–104. DOI:10.1007/978-94-007-5919-0_6 [Google Scholar]
- Wolpoff MH, Lee S-H. Variation in the habiline crania—Must it be taxonomic? Hum. Evol. 2006, 21, 71–84. DOI:10.1007/s11598-006-9007-8 [Google Scholar]
- Wolpoff MH. Cranial capacity estimates for Olduvai Hominid 7. Am. J. Phys. Anthropol. 1981, 56, 297–304. DOI:10.1002/ajpa.1330560310 [Google Scholar]
- Lockwood CA, Kimbel WH. Endocranial capacity of early hominids. Science 1999, 283, 9. DOI:10.1126/science.283.5398.9b [Google Scholar]
- Neubauer S, Gunz P, Schwarz U, Hublin J-J, Boesch C. Brief communication: Endocranial volumes in an ontogenetic sample of chimpanzees from the Taï Forest National Park, Ivory Coast. Am. J. Phys. Anthropol. 2012, 147, 319–325. DOI:10.1002/ajpa.21641 [Google Scholar]
- Zhang Y, Wu X, Schepartz LA. Comparing methods for estimating cranial capacity in incomplete human fossils using the Jingchuan 11 partial cranium as an example. Quat. Int. 2017, 434, 57–64. DOI:10.1016/j.quaint.2015.12.008 [Google Scholar]
- Wu X-J, Bae CJ, Friess M, Xing S, Athreya S, Liu W. Evolution of cranial capacity revisited: A view from the late Middle Pleistocene cranium from Xujiayao, China. J. Hum. Evol. 2022, 163, 103119. DOI:10.1016/j.jhevol.2021.103119 [Google Scholar]
- Poissonnet CM, Olivier G, Tissier H. Estimation de la capacité crânienne à partir d’un os de la voûte. Bull. Mem. Soc. Anthropol. Paris 1978, 5, 217–221. DOI:10.3406/bmsap.1978.1924 [Google Scholar]
- Holloway RL. The O.H. 7 (Olduvai Gorge, Tanzania) hominid partial brain endocast revisited. Am. J. Phys. Anthropol. 1980, 53, 267–274. DOI:10.1002/ajpa.1330530211 [Google Scholar]
- Vaišnys JR, Lieberman D, Pilbeam DR. An alternative method of estimating the cranial capacity of Olduvai Hominid 7. Am. J. Phys. Anthropol. 1984, 65, 71–81. DOI:10.1002/ajpa.1330650110 [Google Scholar]
- Isler K, Kirk EC, Miller JMA, Albrecht GA, Gelvin BR, Martin RD. Endocranial volumes of primate species: Scaling analyses using a comprehensive and reliable data set. J. Hum. Evol. 2003, 55, 967–978. DOI:1016/j.jhevol.2008.08.004 [Google Scholar]
- Dart RA. The Makapansgat proto-human Australopithecus prometheus. Am. J. Phys. Anthropol. 1948, 6, 259–281. DOI:10.1002/ajpa.1330060304 [Google Scholar]
- Yapuncich GS, Churchill SE, Cameron N, Walker CS. Morphometric panel regression equations for predicting body mass in immature humans. Am. J. Phys. Anthropol. 2018, 166, 179–195. DOI:10.1002/ajpa.23422 [Google Scholar]
- McCarthy R, Haque S. Data for: Endocranial Volume Estimates for Sts 25 (Australopithecus cf. africanus). Mendeley Data, V1. Available online: https://data.mendeley.com/datasets/n4k25sbv9k/1 (accessed on 12 June 2026).
- Smith RJ. Logarithmic transformation bias in allometry. Am. J. Phys. Anthropol. 1993, 90, 215–228. DOI:10.1002/ajpa.1330900208 [Google Scholar]
- Smith RJ. Allometric scaling in comparative biology: Problems of concept and method. Am. J. Physiol. 1984, 246, R152–R160. DOI:10.1152/ajpregu.1984.246.2.r152 [Google Scholar]
- Smith RJ. Rethinking allometry. J. Theor. Biol. 1980, 87, 97–111. DOI:10.1016/0022-5193(80)90222-2 [Google Scholar]
- Yapuncich GS. Alternative methods for calculating percentage prediction error and their implications for predicting body mass in fossil taxa. J. Hum. Evol. 2017, 115, 140–145. DOI:10.1016/j.jhevol.2017.03.001 [Google Scholar]
- Zar JH. Biostatistical Analysis, 5th ed.; Prentice Hall: Upper Saddle River, NJ, USA, 2010. [Google Scholar]
- METAANALYSISONLINE. Available online: https://metaanalysisonline.com/ (accessed on 28 January 2026).
- Tobias PV. Olduvai Gorge, Vol. 4. The Skulls, Endocasts and Teeth of Homo habilis; Cambridge University Press: Cambridge, MA, USA, 1991. [Google Scholar]
- Rak Y, Howell FC. Cranium of a juvenile Australopithecus boisei from the Lower Omo Basin, Ethiopia. Am. J. Phys. Anthropol. 1978, 48, 345–366. DOI:10.1002/ajpa.1330480311 [Google Scholar]
- Kimbel WH, Rak Y. The cranial base of Australopithecus afarensis: New insights from the female. Phil. Trans. Roy. Soc. B 2010, 365, 3365–3376. DOI:10.1098/rstb.2010.0070 [Google Scholar]
- Holloway RL. Endocranial volumes of early African hominids, and the role of the brain in human mosaic evolution. J. Hum. Evol. 1973, 2, 449–459. DOI:10.1016/0047-2484(73)90123-1 [Google Scholar]
- Holloway RL. Brain. In Encyclopedia of Human Evolution and Prehistory, 2nd ed.; Delson E, Tattersall I, van Couvering J, Brooks AS, Eds.; Garland: New York, NY, USA, 2000; pp. 141–149. [Google Scholar]
- Falk D. Cerebral cortices of East African early hominids. Science 1983, 222, 1072–1074. DOI:10.1126/science.221.4615.1072 [Google Scholar]
- Falk D. Hadar AL 162-28 endocast as evidence that brain enlargement preceded cortical reorganization in hominid evolution. Nature 1983, 313, 45–47. DOI:10.1038/313045a0 [Google Scholar]
- Spoor F, Gunz P, Neubauer S, Stelzer S, Scott N, Kwekason A, et al. Reconstructed Homo habilis type OH 7 suggests deep-rooted species diversity in early Homo. Nature 2015, 519, 83–86. DOI:10.1038/nature14224 [Google Scholar]
- Holloway RL. New endocranial values for the Australopithecines. Nature 1970, 227, 199–200. DOI:10.1038/227199a0 [Google Scholar]
- Kochetkova VI. Paleoneurology; VH Winston & Sons: Washington, DC, USA, 1978. [Google Scholar]
- Holloway RL, Clark RJ, Tobias PV. Posterior lunate sulcus in Australopithecus africanus: Was Dart right? Comptes Rendus Palevol 2004, 3, 287–293. DOI:10.1016/j.crpv.2003.09.030 [Google Scholar]
- Broom R, Robinson JT. Further evidence of the structure of the Sterkfontein ape-man Plesianthropus. In Sterkfontein Ape-man: Plesianthropus; Broom R, Robinson JT, Schepers GWH, Eds.; Transvaal Museum, Mem. 4: Johannesburg, South Africa, 1950; Part I, pp. 7–83. [Google Scholar]
- Thackeray JF, Gommery D. Spatial distribution of australopithecine specimens discovered at Sterkfontein between 1947 and 1949. Ann. Transvaal Mus. 2002, 39, 70–72. Available online: https://hdl.handle.net/10520/AJA00411752_18 (accessed on 26 May 2026).
- Broom R, Robinson JT. Size of the brain in the ape-man, Plesianthropus. Nature 1948, 161, 438. DOI:10.1038/161438a0 [Google Scholar]
- Ahern JCM. Underestimating intraspecific variation: The problem with excluding Sts 19 from Australopithecus africanus. Am. J. Phys. Anthropol. 1998, 105, 461–480. DOI:10.1002/(sici)1096-8644(199804)105:4%3C461::aid-ajpa5%3E3.0.co;2-r [Google Scholar]
- Peterson TD. Taxonomic Implications of Basicranial Variation in Australopithecus africanus. Ph.D. Dissertation, University of New Mexico, Albuquerque, NM, USA, 2010. [Google Scholar]
- Clarke RJ. The cranium of the Swartkrans hominid SK 847 and its relevance to human origins. Ph.D. Dissertation, University of the Witwatersrand, Johannesburg, South Africa, 1977. [Google Scholar]
- Kimbel WH, Rak Y. The importance of species taxa in paleoanthropology and an argument for the phylogenetic concept of the species category. In Species, Species Concepts and Primate Evolution; Kimbel WH, Martin LB, Eds.; Springer: New York, NY, USA, 1993; pp. 461–484. [Google Scholar]
- Strait DS, Grine FE, Moniz MA. A reappraisal of early hominid phylogeny. J. Hum. Evol. 1997, 32, 17–82. DOI:10.1006/jhev.1996.0097 [Google Scholar]
- Strait DS, Grine FE. Inferring hominoid and early hominid phylogeny using craniodental characters: The role of fossil taxa. J. Hum. Evol. 2004, 47, 399–452. DOI:10.1016/j.jhevol.2004.08.008 [Google Scholar]
- Kimbel WH. The origin of Homo. In Origin and Early Evolution of the Genus Homo; Grine FE, Fleagle JG, Leakey REF, Eds.; Springer: New York, NY, USA, 2009; pp. 31–37. [Google Scholar]
- Falk D. A reanalysis of the South African australopithecine natural endocasts. Am. J. Phys. Anthropol. 1980, 53, 525–539. DOI:10.1002/ajpa.1330530409 [Google Scholar]
- Schepers GWH. The brain casts of the recently discovered Plesianthropus skulls. In Sterkfontein Ape-Man: Plesianthropus; Broom R, Robinson JT, Schepers GWH, Eds.; Transvaal Museum, Mem. 4: Johannesburg, South Africa, 1950; Part II, pp. 89–117. [Google Scholar]
- Holloway RL. Australopithecine endocast (Taung specimen, 1924): A new volume determination. Science 1970, 168, 966–968. DOI:10.1126/science.168.3934.966 [Google Scholar]
- Holloway RL. Australopithecine endocasts, brain evolution in the Hominoidea, and a model of hominid evolution. In The Functional and Evolutionary Biology of Primates; Tuttle R, Ed.; Routledge: London, UK, 1972; pp. 185–207. [Google Scholar]
- Falk D, Redmond JC, Guyer J, Conroy GC, Recheis W, Weber GW, et al. Early hominid brain evolution: A new look at old endocasts. J. Hum. Evol. 2000, 38, 695–717. DOI:10.1006/jhev.1999.0378 [Google Scholar]
- Martin JM, Leece A, Herries AI, Baker SE, Strait DS. We the hunted. S. Afr. J. Sci. 2024, 120. DOI:10.17159/sajs.2024/16387 [Google Scholar]
- Martin JM, Morris-Obst L, Leece AB, Baker S, Herries AIR, Strait DS. The StW 573 Little Foot fossil should not be attributed to Australopithecus prometheus. Am. J. Phys. Anthropol. 2025, 188, e70177. DOI:10.1002/ajpa.70177 [Google Scholar]
- Schepers GWH. The endocranial casts of the South African ape-men. In The South African Ape-Men: The Australopithecinae; Broom R, Schepers GWH, Eds.; Transvaal Museum, Mem. 2: Johannesburg, South Africa, 1946; Part 2, pp. 155–272. [Google Scholar]
- Rak Y. The Australopithecine Face; Academic Press: New York, NY, USA, 1983. [Google Scholar]
- Thackeray JF. ‘Mrs Ples’ from Sterkfontein: Small male or large female? S. Afr. Archaeol. Bull. 2000, 55, 155–158. DOI:10.2307/3888964 [Google Scholar]
- Tawane GM, Thackeray JF. The cranium of Sts 5 (‘Mrs Ples’) in relation to sexual dimorphism of Australopithecus africanus. S. Afr. J. Sci. 2018, 114, 4. DOI:10.17159/sajs.2018/a0249 [Google Scholar]
- Neubauer S, Gunz P, Weber GW, Hublin J-J. Endocranial volume of Australopithecus africanus: New CT-based estimates and the effects of missing data and small sample size. J. Hum. Evol. 2012, 62, 498–510. DOI:10.1016/j.jhevol.2012.01.005 [Google Scholar]