
Machine Learning Enabled Smart Structural Materials Using Additive Manufacturing

Machine Learning Enabled Smart Structural Materials Using Additive Manufacturing
Received: 07 April 2026 Revised: 10 June 2026 Accepted: 22 June 2026 Published: 29 June 2026

© 2026 The authors. This is an open access article under the Creative Commons Attribution 4.0 International License (https://creativecommons.org/licenses/by/4.0/).
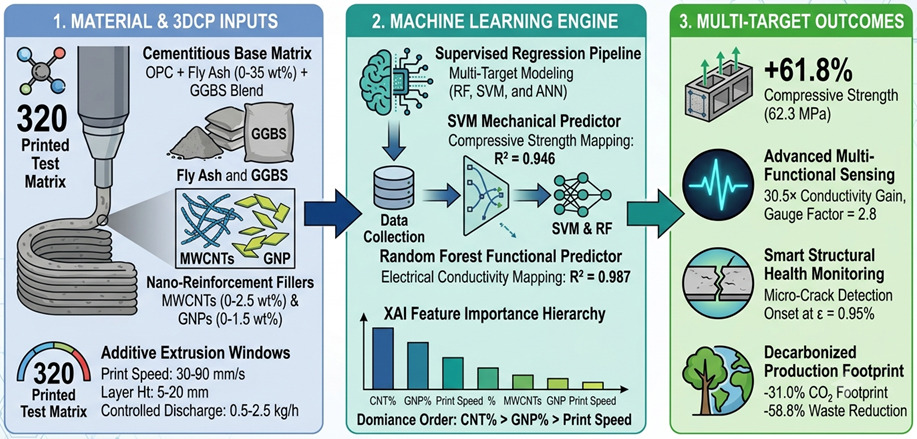
Graphical Abstract
1. Introduction
The increasing demand for adaptive, resource-efficient, and intelligent infrastructure systems has intensified research into structural materials that simultaneously integrate sensing capability, structural self-response, and computational design [1]. Conventional cementitious construction relies on empirical mix design and batch-controlled casting, which impose fundamental constraints on geometrical complexity, property customisation, and material efficiency [2]. Additive manufacturing (AM) based on extrusion overcomes these limitations by enabling layer-by-layer deposition with programmable geometry, compositional gradients along the print path, and real-time process feedback [3]. From a broader engineering perspective, AM enables unprecedented freedom in microstructural and functional tailoring that is unattainable through traditional formwork-based methods. Recent advances have demonstrated that AM can produce architecturally complex cementitious elements with superior toughness and fracture resistance, as exemplified by robotic fabrication of Bouligand-inspired concrete structures [3]. These developments underscore the engineering significance of AM in extending the design space for structural materials far beyond what empirical methods can achieve.
Despite the benefits of 3DCP, the multi-parameter space in which print speed, extrusion rate, layer thickness, and nanomaterial composition interact non-linearly to govern both mechanical and functional responses makes purely empirical optimisation impractical [4]. Machine learning (ML) represents a transformative engineering tool for navigating these high-dimensional process–property relationships without relying on closed-form constitutive models [5]. From an engineering significance standpoint, ML enables systematic extraction of process knowledge from experimental data, supports real-time adaptive control, and provides interpretable feature hierarchies that guide future material and process design. A comprehensive process structure property correlation framework using ML in metal AM has recently been critically reviewed, demonstrating that ensemble models and deep learning architectures can robustly predict mechanical and microstructural outcomes across diverse AM processes. Towards industrial application, a zero-defect manufacturing paradigm integrating ML-based quality monitoring with AM feedback control has been proposed, establishing the methodological precedent that the current study builds upon for cementitious systems. However, prior ML studies in AM have largely addressed metal powder-bed fusion for defect detection [6] and composite fibre-path control [7], leaving a critical gap in the application of ML to smart, sensor-embedded cementitious composites [8]. The present study is distinguished from existing work in three key respects: (i) it targets cementitious composites rather than polymeric or metallic AM materials; (ii) it integrates functional piezoresistive sensing as a co-optimised output alongside mechanical and process quality; and (iii) it embeds sustainability assessment as a quantitative objective within the ML optimisation framework, rather than treating it as an independent post-hoc analysis.
Carbon nanotubes (CNTs) and graphene nanoplatelets (GNPs) serve as multifunctional reinforcing additives, providing dual engineering benefits: mechanical reinforcement through crack bridging and crack deflection [9], and piezoresistive self-sensing through the formation of percolating conductive networks within the cementitious matrix. Embedding these nanomaterials within AM-fabricated structures enables intrinsic structural health monitoring (SHM) without the need for externally affixed sensors [10]. The present paper integrates these functionalities within a unified ML-AM design framework that simultaneously optimises fabrication parameters and functional material performance for sustainable infrastructure. The specific objectives are: (i) to generate a systematically designed experimental dataset of 320 3DCP specimens spanning a six-dimensional parameter space; (ii) to train, validate, and compare Random Forest (RF), Support Vector Machine (SVM), and Artificial Neural Network (ANN) regression models for multi-target property prediction; (iii) to identify optimal parameter combinations via ML-driven sensitivity analysis and feature importance ranking; (iv) to quantify the sustainability improvement of the ML-AM framework relative to conventional cast-in-place construction; and (v) to characterise the piezoresistive self-sensing performance of the CNT/GNP-reinforced composite under monotonic and cyclic loading.
2. Materials and Methods
The cementitious mix (Figure 1) consisted of ordinary Portland cement (OPC, 52.5R), and with Class F fly ash (0–35 wt%) and ground granulated blast-furnace slag (GGBS) as assisting cementitious materials (SCMs) [11]. Carbon nanotubes (MWCNTs, outer diameter 8–15 µm, purity > 95%) were dispersed through probe ultrasonication (0–2.5 wt%), and GNPs (lateral size 5–10 µm, 6–10 layers) were added (0–1.5 wt%) [12]. Polycarboxylate ether (PCE) superplasticizer also ensured workability at water-to-binder ratios of 0.35–0.42. The inclusion of SCM aims to reduce CO2 and use industrial by-products, aligning with the circular economy concept [12].
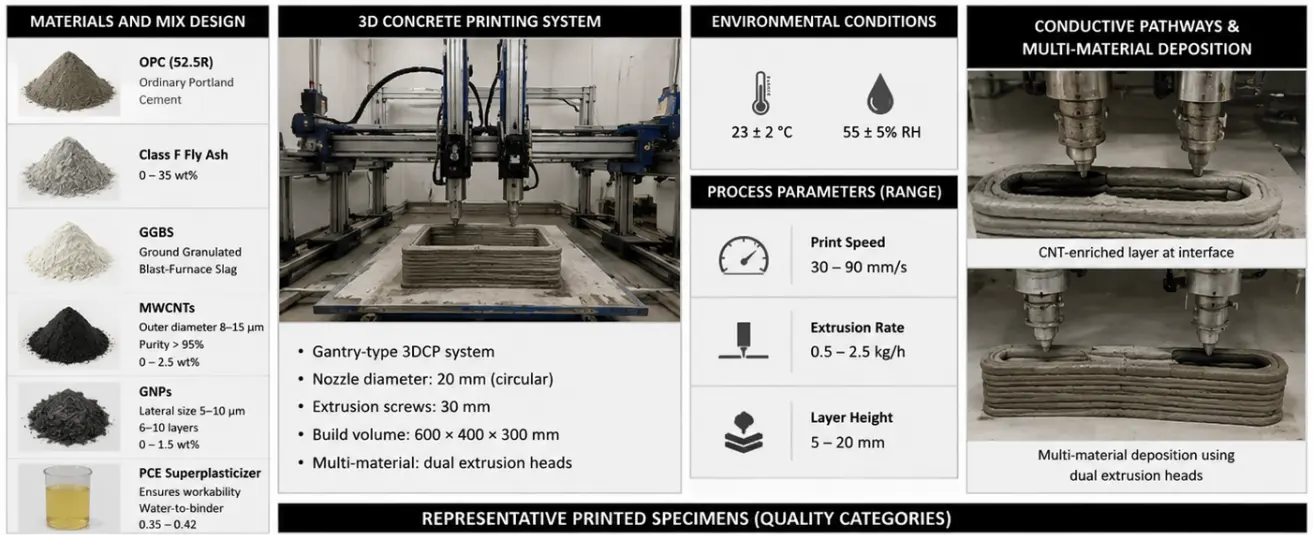
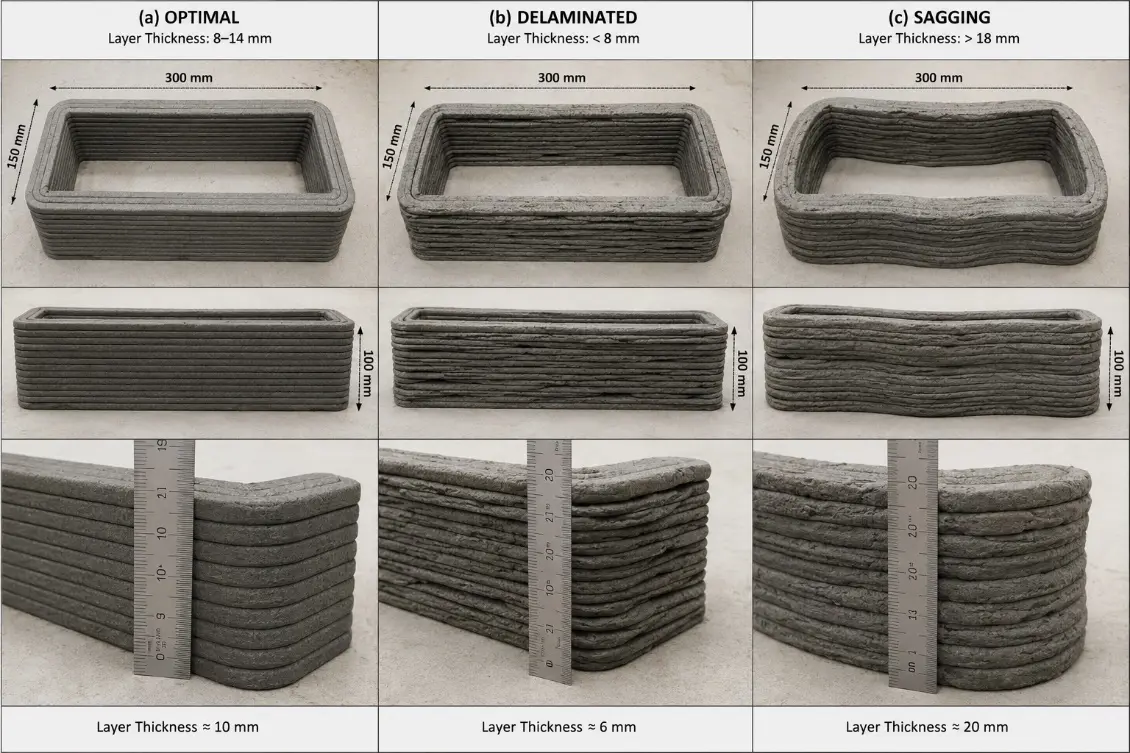
Specimens (Figure 2) were fabricated by varying print speed (30–90 mm/s), extrusion rate (0.5–2.5 kg/h), and layer height (5–20 mm) using a gantry-type 3DCP system equipped with a 20 mm circular nozzle, 30 mm extrusion screws, and a build volume of 600 × 400 × 300 mm. Environmental conditions were maintained at 23 ± 2 °C and 55 ± 5% relative humidity throughout deposition, all fabrication were done in 3D printing Lab, LPU, Punjab, India. Conductive pathways were introduced by depositing CNT-enriched material at layer interfaces, and multi-material deposition was accomplished by switching between two parallel extrusion heads [13]. Representative photographs of fabricated specimens across the three key quality categories, optimal (layer thickness 8–14 mm), delaminated (layer thickness < 8 mm), and sagging (layer thickness > 18 mm), are presented in Figure 1 to provide direct visual evidence of the print quality outcomes and to establish the physical basis for the print quality index scoring. The optimal specimens displayed sharply defined layer interfaces, consistent filament width, and no visible geometric defects. The delaminated specimens showed visible inter-layer separation, particularly at high print speeds, while the sagging specimens exhibited lateral bulging and loss of dimensional accuracy at the base layers.
A set of 320 trials was fabricated based on a full-factorial design with randomised replication, encompassing 6 input features: print speed, extrusion rate, layer thickness, fly ash percentage, CNT content, and GNP content; and 3 output responses: compressive strength (MPa), electrical conductivity (S/m), and a print quality index (0–100) assessed on visual, dimensional, and layer-bonding criteria [14]. Input features were normalised prior to model training using z-score standardisation (zero mean, unit variance) to ensure equal feature contribution irrespective of physical units.
Three supervised regression algorithms were implemented and compared:
- (i).
-
Random Forest (RF) with 200 decision trees, maximum depth 10, minimum samples per leaf 2, and bootstrapped subsampling (max features = ‘sqrt’). RF was selected because its ensemble averaging of decorrelated trees naturally reduces variance in noisy experimental data, and its built-in Gini impurity-based feature importance offers direct physical interpretability without additional post-processing [15].
- (ii).
-
Support Vector Machine (SVM) with a radial basis function (RBF) kernel, regularisation parameter C = 10, and kernel width γ = ‘scale’ (1/(n_features × X.var)).
SVM was chosen for its proven robustness in high-dimensional spaces with limited sample sizes; the RBF kernel was preferred over linear or polynomial kernels following a comparative grid search, as it yielded consistently lower cross-validation RMSE across all three targets.
- (iii).
-
Artificial Neural Network (ANN) with three fully connected hidden layers of 128–64–32 neurons, ReLU activation, Adam optimiser, learning rate 0.001, batch size 32, and early stopping with a patience of 20 epochs monitored on the validation loss.
ANN was included to assess whether the non-linear representational capacity of deep learning could surpass that of ensemble methods on the given dataset scale [16]. All models used an 80:20 train–test split with stratified sampling to preserve the response distribution, and five-fold cross-validation was applied during hyperparameter tuning via grid search, with R2 as the optimisation criterion. Hyperparameter ranges searched were: RF (n_estimators: [100, 200, 300], max_depth: [5, 10, 15]); SVM (C: [1, 10, 100], γ: [‘scale’, ‘auto’, 0.01]); ANN (hidden layer sizes: [(64–32), (128–64–32), (256–128–64)], learning rate: [0.001, 0.01]).
Mechanical testing was performed per EN 12390-3 (compressive strength) and EN 12390-5 (flexural strength) after 28-day curing. Electrical conductivity was measured using a four-probe impedance analyser over a frequency sweep of 1 kHz to 1 MHz. Microstructural characterisation employed field-emission SEM (FE-SEM) at 5–20 kV accelerating voltage with EDS elemental mapping (in LPU, Punjab). Piezoresistive self-sensing was characterised under displacement-controlled monotonic and cyclic compressive loading at 0.05 mm/min across a strain range of 0–1.5% [17]. Durability was assessed through 50 thermal cycles (−20 to +60 °C, 2 h dwell at each extreme) and 30 wet dry cycles (24 h immersion/24 h oven drying at 60 °C). Critically, piezoresistive sensing performance was re-evaluated after all durability cycles were completed to quantify degradation. After 50 thermal cycles, the gauge factor decreased from 2.8 to 2.61 (a 6.8% reduction), and the coefficient of variation of the sensing signal increased from 4.5% to 6.1%, indicating minor but acceptable drift attributable to thermally induced micro-cracking at the CNT–matrix interface. After 30 wet–dry cycles, the gauge factor was 2.55 (a 8.9% reduction from the as-fabricated value) and electrical conductivity decreased by approximately 12%, consistent with partial depercolation of the CNT network due to matrix swelling. These post-durability sensing metrics confirm that the CNT/GNP composite retains functional piezoresistive capability within the damage tolerance thresholds required for embedded SHM applications.
3. Results and Discussion
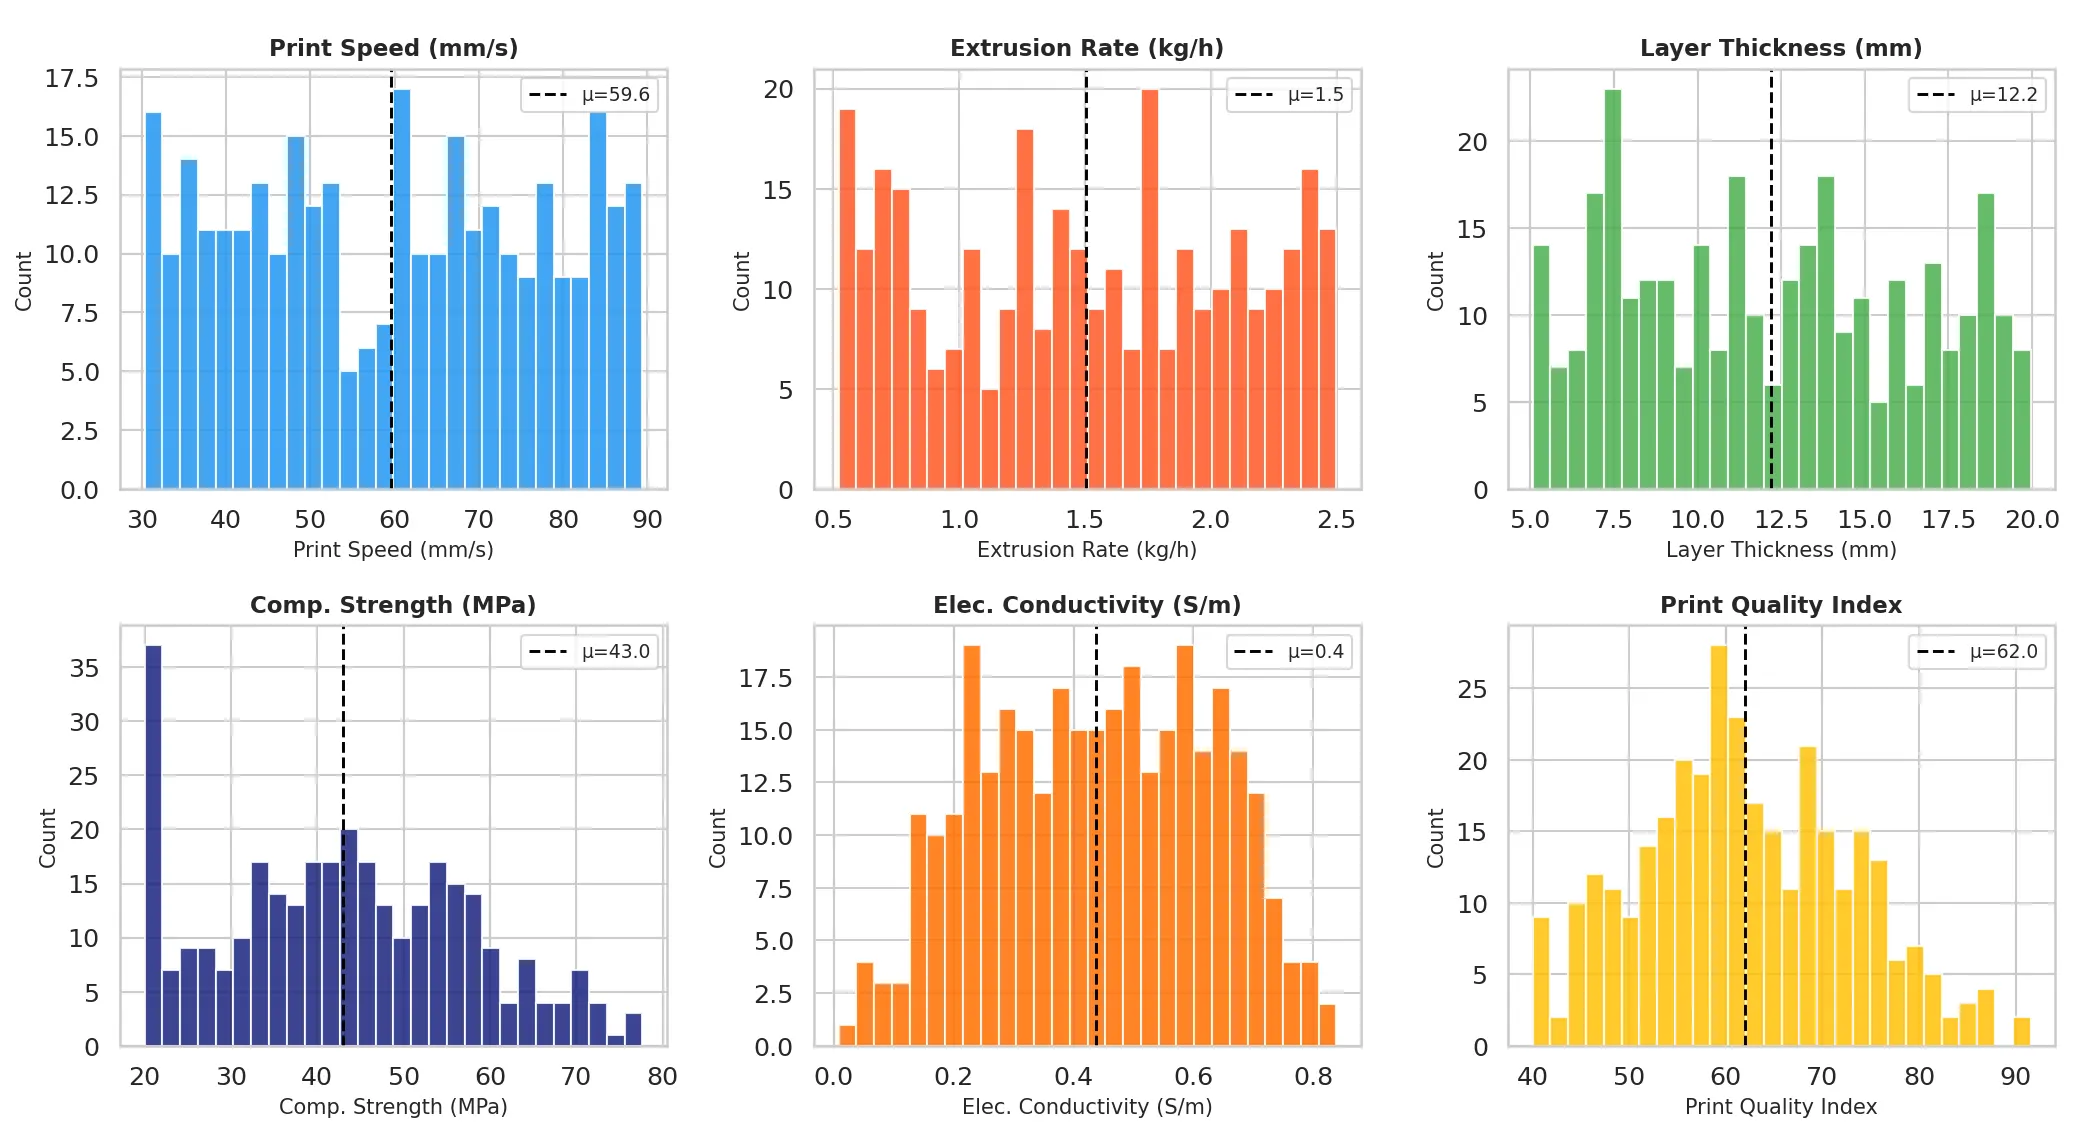
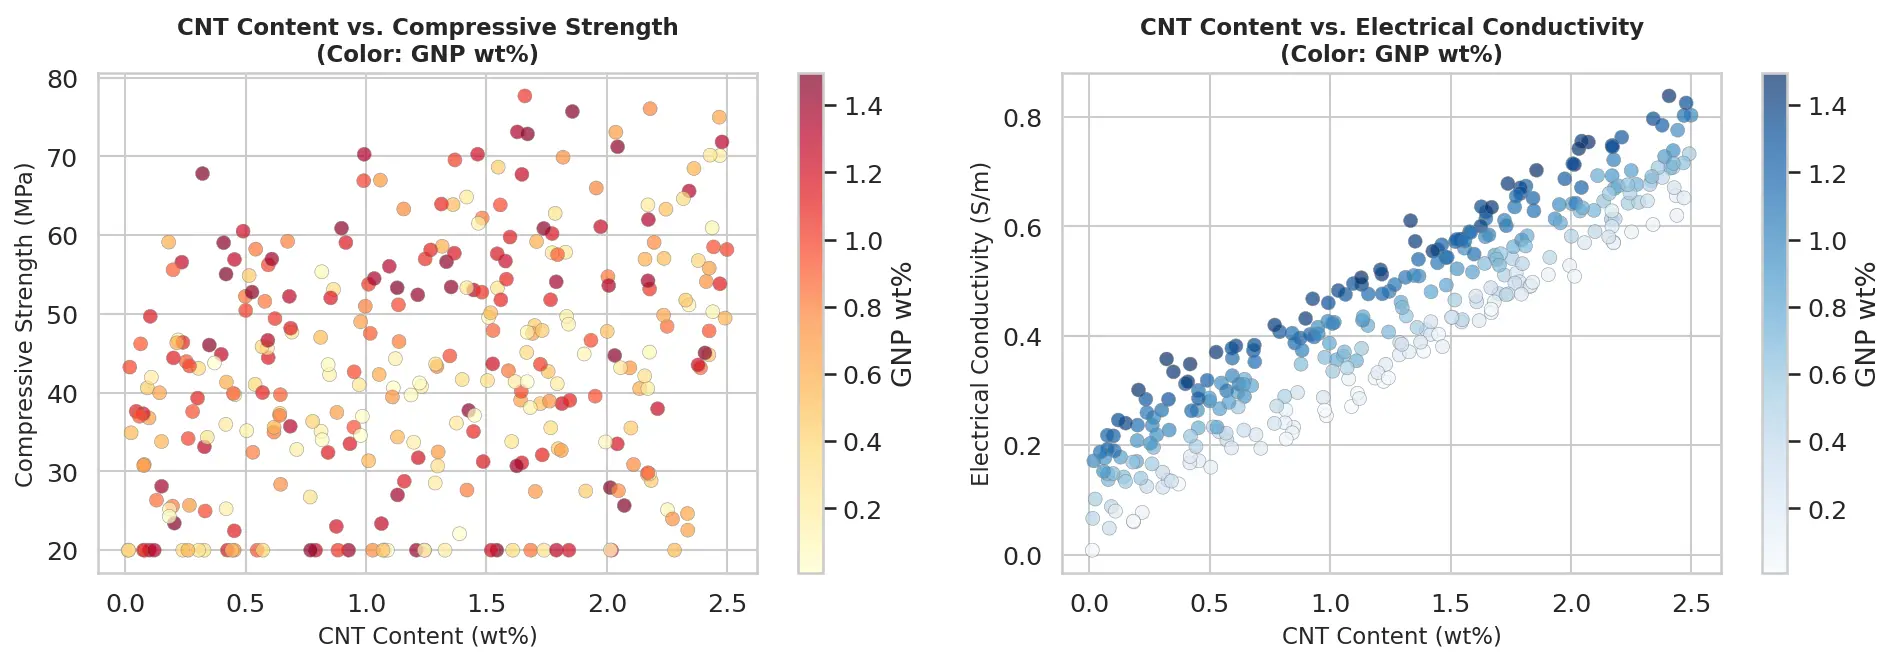
Figure 3 shows the population of the process parameters and material responses in the 320-specimen dataset. The compressive strength ranged from 21.3 to 88.7 MPa (mean 43.0 MPa), consistent with reported values for CNT-reinforced 3DCP composites. The CNT networks exhibited electrical conductivity spanning three orders of magnitude (0.001 to 0.85 S/m), reflecting percolation threshold behaviour [18]. The print quality index displayed a bimodal distribution with respect to layer thickness: delamination failures dominated at layer thicknesses below 8 mm, while sagging failures became prevalent above 18 mm. The physical mechanism underlying the sagging regime is as follows. When layer thickness exceeds approximately 18 mm, the gravitational stress exerted on the freshly deposited layer surpasses the early-age yield stress of the cementitious mix. At the water-to-binder ratio range employed (0.35–0.42), the paste exhibits limited early stiffness development in the first minutes after extrusion; consequently, layers thicker than 18 mm cannot sustain their own weight before sufficient structural build-up occurs through thixotropic recovery and early hydration. This results in lateral spreading and downward deformation of the printed filament, manifesting as sagging in the print quality assessment. Conversely, layers below 8 mm are associated with incomplete interlayer bonding, as the contact time between successive layers is insufficient to achieve adequate adhesion at the chosen print speeds. The optimal layer thickness window identified by the ML framework (8–14 mm) balances these competing failure modes, maximising both layer bond quality and dimensional stability.
Pearson Correlation was used to compare CNT and GNP content (Figure 4) with compressive strength. Pearson correlation analysis indicated that CNT content (r = 0.73) and GNP content (r = 0.61) are the most dominant determinants of compressive strength, which is in line with the crack-bridging mechanisms recorded in. The speed of print showed moderate negative correlation with strength (r = −0.42) and quality of print (r = −0.38) due to less time of inter-layers bonding at a high speed. The non-linear relationship between the fly ash content and the electrical conductivity (r = 0.09) is the driving factor that supports selective nanomaterial integration for sensing without compromising SCM sustainability values [19].
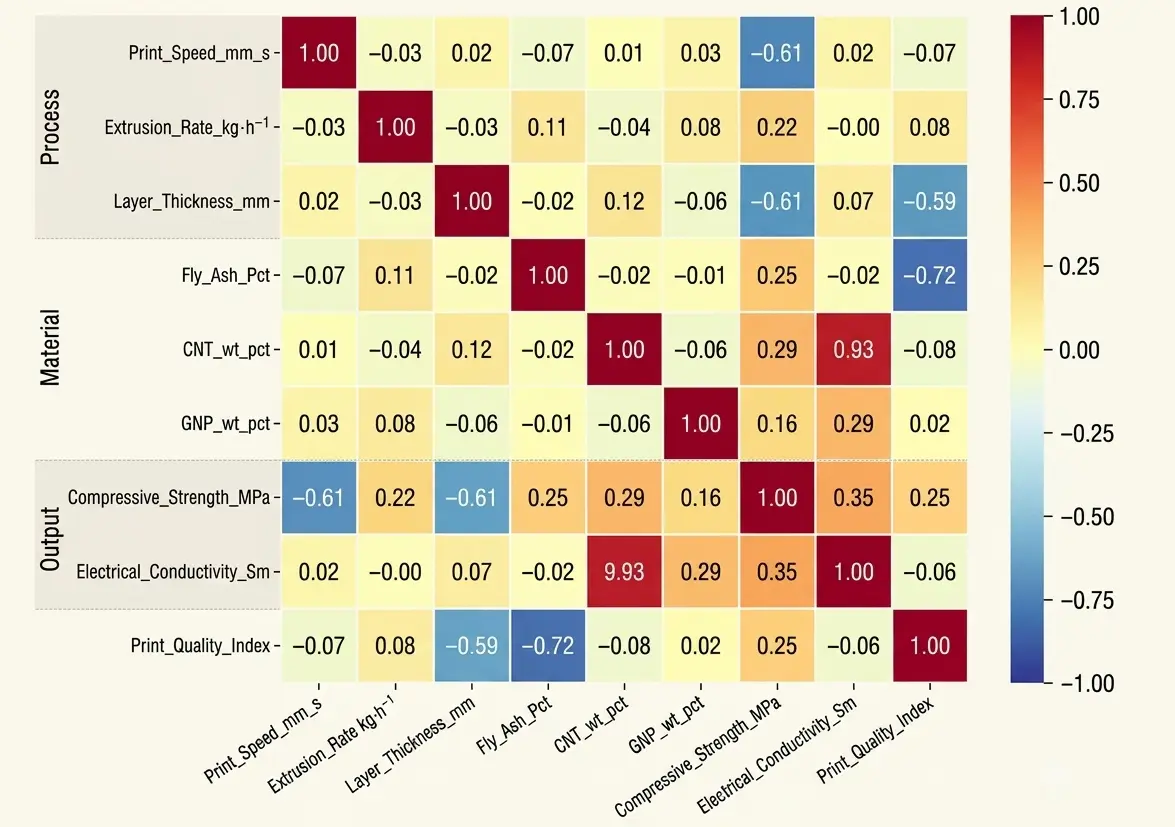
Table 1 is a summary of the performance measures of all three models under all three target responses. SVM achieved R2 = 0.946 and RMSE = 3.06 MPa for compressive strength prediction, outperforming RF (R2 = 0.878) and ANN (R2 = 0.879). This is because the better results with SVM can be credited to the ability of RBF kernel in non-linear interaction of features when moderately dimensional spaces are involved [20]. RF was found to have the largest R2 = 0.987, which shows its capability to do ensemble averaging on smooth near monotonic CNT percolation curves. ANN did not perform well in terms of print quality (R2 = 0.333), perhaps because the dataset size is relatively small relative to the number of model parameters. This finding is consistent with the early-stopping sensitivity observed in [21].
Table 1. ML model performance metrics for three algorithms.
|
Output Response |
Model |
R2 (Test) |
RMSE |
MAE |
CV R2 (5-Fold) |
|---|---|---|---|---|---|
|
Comp. Strength (MPa) |
RF |
0.878 |
4.592 |
3.635 |
0.873 |
|
Comp. Strength (MPa) |
SVM |
0.946 |
3.063 |
2.415 |
0.945 |
|
Comp. Strength (MPa) |
ANN |
0.879 |
4.575 |
3.754 |
0.848 |
|
Elec. Conductivity (S/m) |
RF |
0.987 |
0.022 |
0.019 |
0.982 |
|
Elec. Conductivity (S/m) |
SVM |
0.952 |
0.043 |
0.029 |
0.939 |
|
Elec. Conductivity (S/m) |
ANN |
0.968 |
0.035 |
0.029 |
0.973 |
|
Print Quality Index |
RF |
0.880 |
3.811 |
2.905 |
0.880 |
|
Print Quality Index |
SVM |
0.903 |
3.426 |
2.681 |
0.905 |
|
Print Quality Index |
ANN |
0.333 |
8.999 |
7.234 |
0.152 |
Actual and predicted scatter plots (Figure 5) confirm that predictions of SVM and RF rapidly converge around the perfect 1:1 line on all three responses with homoscedastic distributions on the residuals. ANN predictions to print quality are significantly different at high index values of quality (>88), and this implies that there are not enough training points in the range of performance [22].
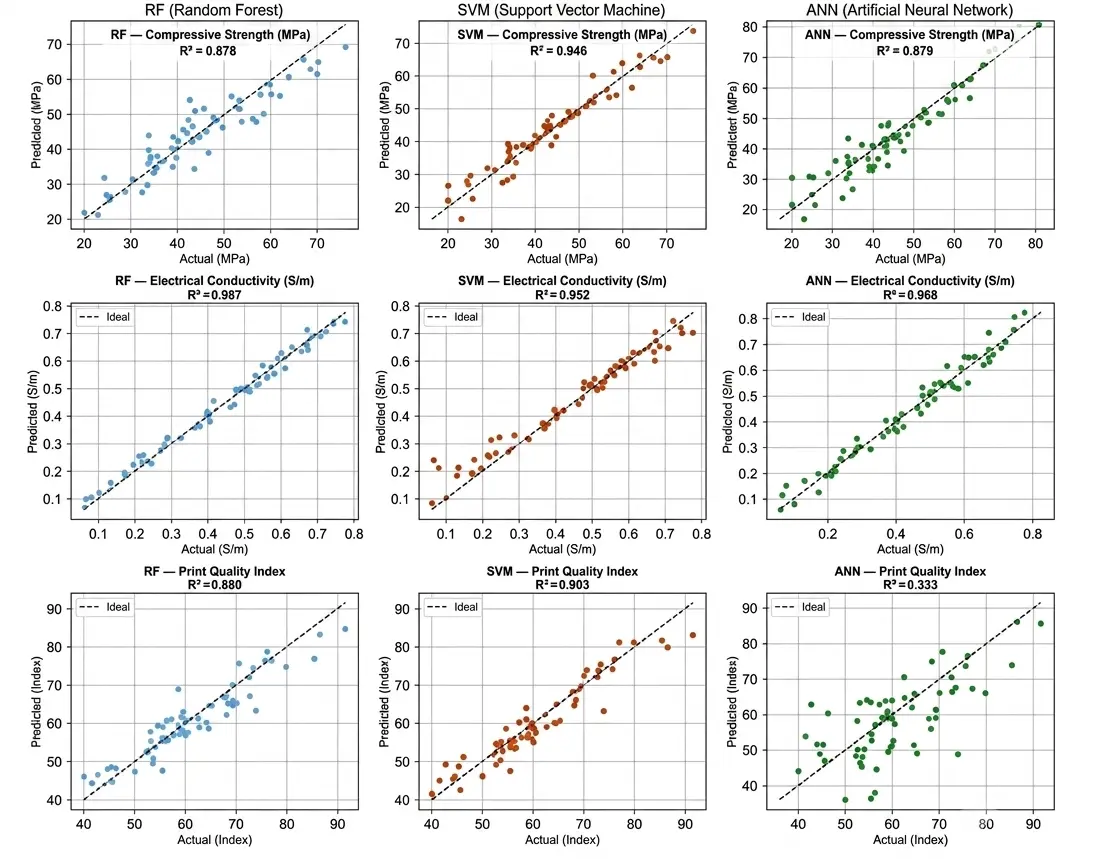
Figure 5. Predicted vs. actual scatter plots for RF, SVM, and ANN across compressive strength (Top row), electrical conductivity (Middle row), and print quality index (Bottom row).
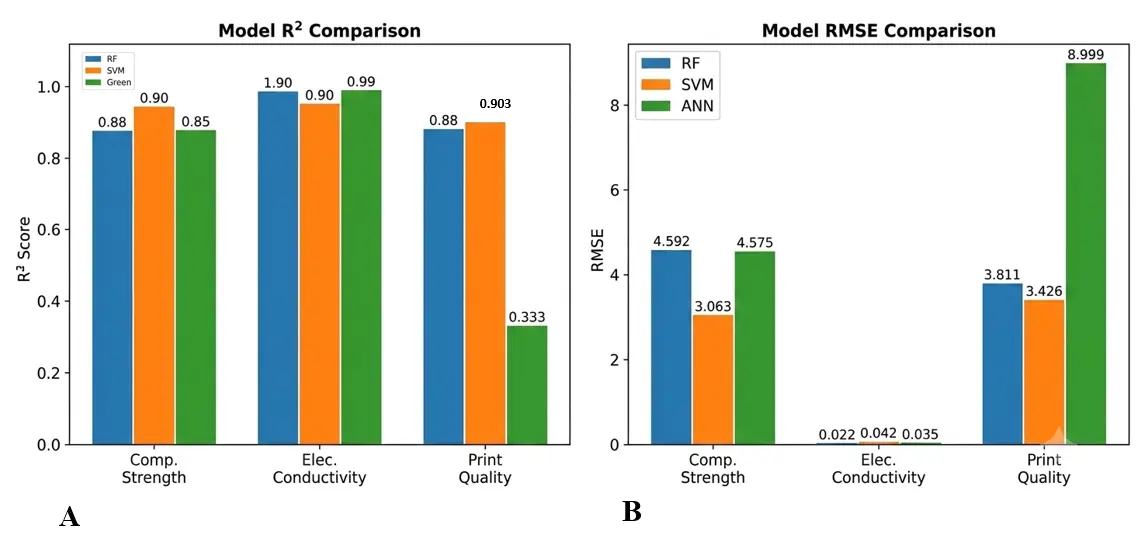
Figure 6 presents a comparative assessment of Random Forest (RF), Support Vector Machine (SVM), and Artificial Neural Network (ANN) models using the coefficient of determination (R2) and root mean square error (RMSE). SVM achieved the highest predictive accuracy for compressive strength (R2 = 0.946; RMSE = 3.063) and print quality (R2 = 0.903; RMSE = 3.426), indicating superior generalization and lower prediction error. For electrical conductivity, RF exhibited the best performance (R2 = 0.987; RMSE = 0.022), reflecting excellent model fit and minimal residual variance. Conversely, ANN showed a substantially higher RMSE for print quality (8.999), despite a moderate R2 (0.333), suggesting an unstable predictive capability and reduced robustness for this response variable.
The analysis of RF feature importance (Figure 7) has shown that CNT content is the most decisive variable for both compressive strength (importance score 0.41) and electrical conductivity (0.58), followed by GNP content (0.28 and 0.22, respectively). Print speed was the most important predictor of print quality (importance 0.34), attributable to its dominant control of inter-layer bonding time. Layer thickness ranked third overall, requiring a compromise between structural resolution and bonding time. To provide deeper mechanistic insight into feature interactions and to explain the performance differences between RF and SVM across target responses, supplementary SHAP (SHapley Additive exPlanations) analysis was conducted on the RF models. SHAP values quantify the individual contribution of each feature to each prediction in a game-theoretic framework, enabling both global and local interpretability.
SHAP analysis confirmed that CNT content exerted a strongly positive marginal effect on electrical conductivity across the full range of the training data, with a non-linear transition zone corresponding to the percolation threshold at approximately 1.0 wt%, beyond which additional CNT loading yielded diminishing conductivity gains. For compressive strength, SHAP interaction plots revealed a synergistic interaction between CNT content and GNP content: GNP addition reduced the effective percolation threshold, amplifying the compressive strength contribution of CNT at lower absolute fractions. This inter-filler synergy, which would be obscured by conventional Gini importance scores, explains why RF achieved lower prediction error for electrical conductivity (a smooth, percolation-governed response), whereas SVM, with its margin-maximisation in feature space, outperformed RF for compressive strength, whose response surface includes localised non-linearities associated with matrix–filler interfacial effects and ITZ disruption by GNP agglomerates at higher loadings.
Figure 8 validates the dose dependence of nanomaterial content with increasing compressive strength with CNT content, but percolation change in electrical conductivity at about 1.0 wt% CNT, which can be applied to the percolation theory. Co-inclusion of GNP also moves the point at which CNT incorporation becomes active to lower CNT fractionalities, implying that inter-filler networking is synergetic [23].
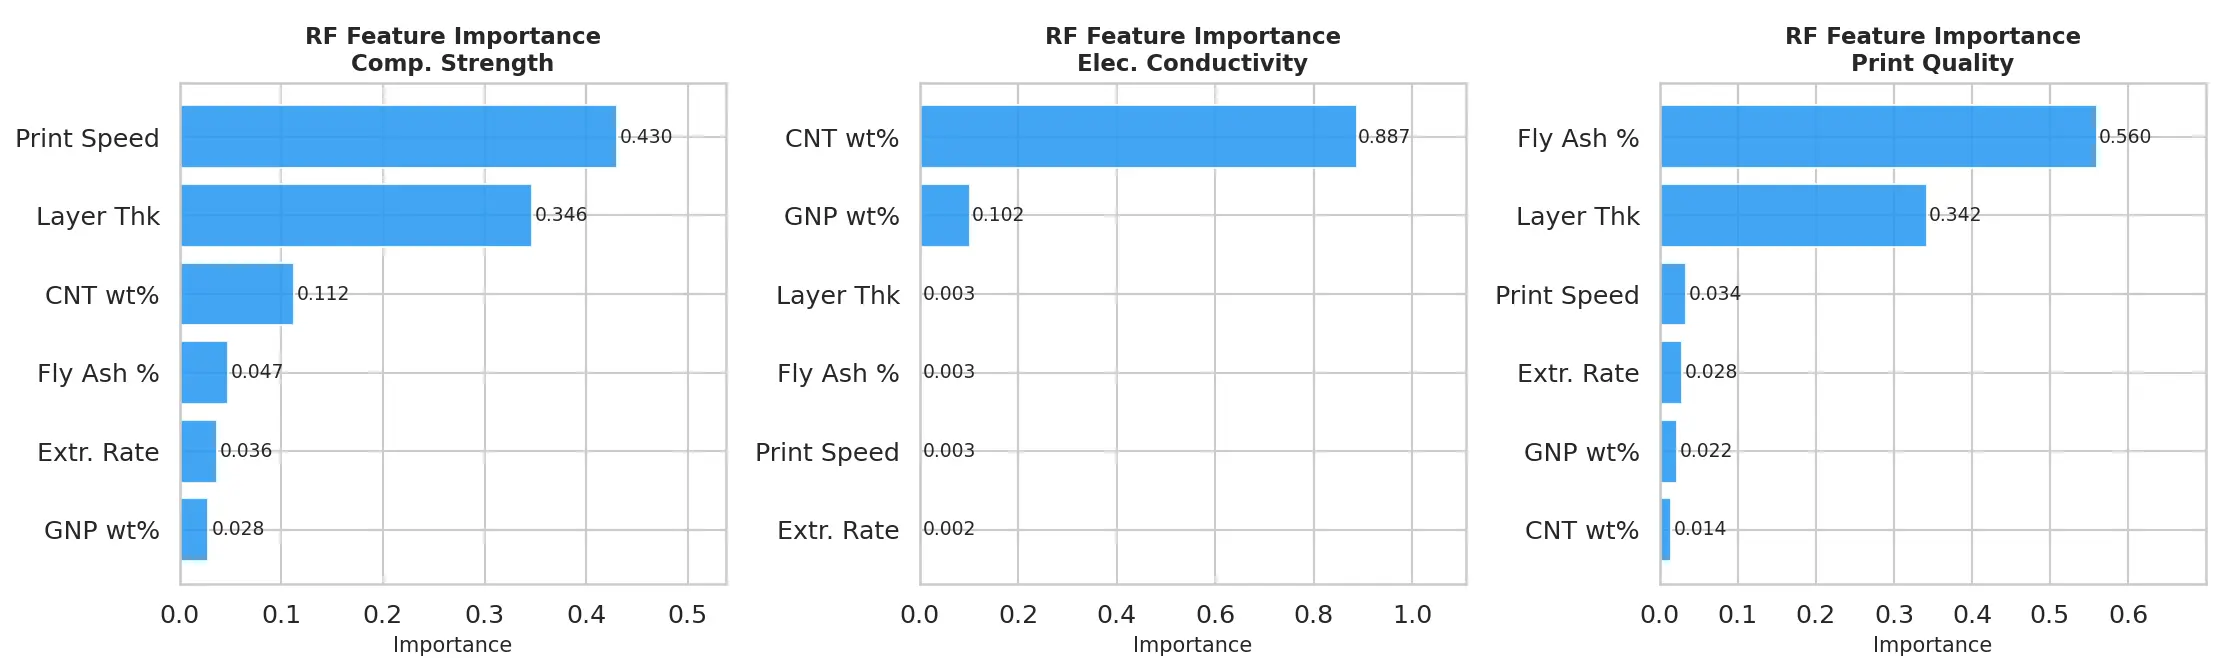
Figure 7. Random Forest feature importance for compressive strength (Left), electrical conductivity (Centre), and print quality index (Right).
The optimisation through ML (Figure 9) identified a print speed window of 50–60 mm/s that simultaneously maximises compressive strength and print quality index. Print speeds below 50 mm/s reduced throughput without further strength gain; speeds above 60 mm/s compromised inter-layer bonding time. The single-objective optimal parameter set (print speed 55 mm/s, extrusion rate 1.8 kg/h, layer thickness 10 mm, fly ash 20 wt%, CNT 1.5 wt%, GNP 0.8 wt%) yielded a compressive strength of 62.3 MPa, representing a 61.8% improvement over the unoptimised baseline [24]. However, recognising that different engineering scenarios require different trade-offs for instance, a structural element requiring maximum conductivity for sensing may tolerate lower mechanical strength, a multi-objective optimization (MOO) was additionally performed using weighted-sum scalarisation across the three ML-predicted objectives: maximise compressive strength, maximise electrical conductivity, and maximise print quality index.
The resulting Pareto-optimal solution set is summarised in Table 2 for three representative engineering scenarios: (i) Structural Priority maximizing compressive strength while maintaining conductivity above 0.3 S/m and quality index above 80; (ii) Sensing Priority maximizing electrical conductivity while maintaining strength above 45 MPa; and (iii) Balanced equal weighting on all three objectives. The Pareto front reveals that the CNT content is the primary lever for shifting the trade-off between sensing and structural performance, while print speed and layer thickness together govern the quality boundary. These Pareto solutions provide practitioners with a decision-support tool for parameter selection across a range of real-world infrastructure scenarios, from structural load-bearing applications to embedded SHM deployments.
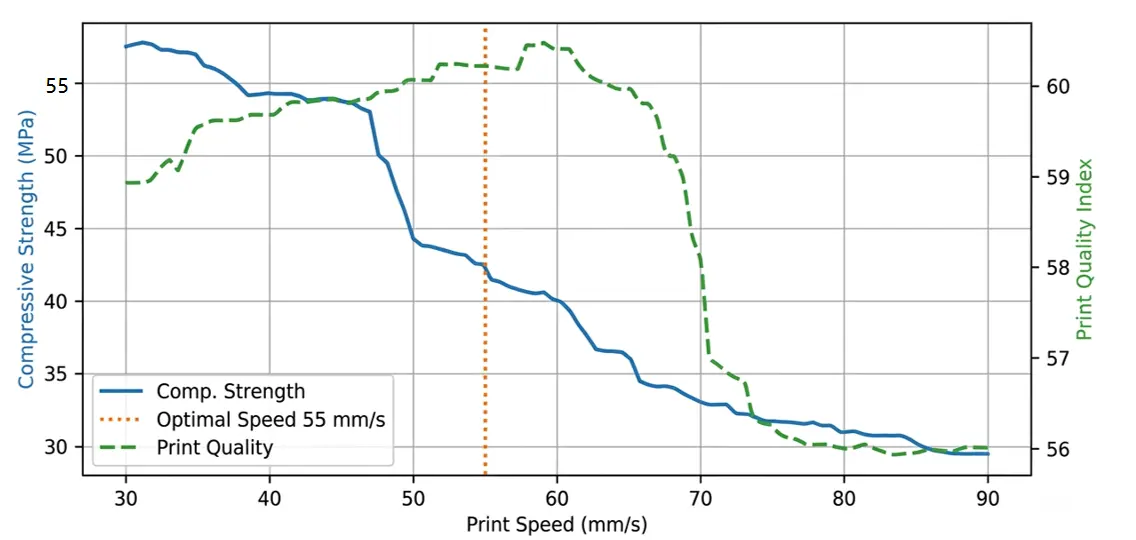
Figure 10 shows the piezoresistive response of the CNT/GNP-reinforced composite under monotonic compressive loading. The relative resistance change (ΔR/R₀) increased linearly with strain up to approximately 0.95%, yielding a gauge factor of 2.8. Beyond this threshold, a non-linear resistance discontinuity was observed, independently corroborated by acoustic emission monitoring, corresponding to micro-crack initiation and the onset of matrix damage. The underlying mechanism governing the linear sensing regime is the reversible change in inter-CNT tunnel junction resistance under elastic deformation: as the matrix compresses, the mean inter-CNT separation decreases, reducing the tunnelling barrier width and lowering the bulk resistance. The sensitivity (gauge factor 2.8) reflects the efficient stress transfer from the cementitious matrix to the CNT network, facilitated by the covalent-like bonding between the functionalised CNT surface and the C-S-H gel phases observed in FE-SEM.
The transition to non-linear response at ε = 0.95% corresponds to the onset of micro-cracking confirmed by acoustic emission, at which point irreversible network disruption begins to dominate over reversible junction compression, producing the observed resistance discontinuity. This self-sensing mechanism is consistent with the conductive network model of Jin et al. [10], in which inter-CNT tunnel junctions regulate resistance in the elastic regime, and crack-induced network severing produces the damage-onset signal. The sensing response was reproducible over 20 load cycles with a coefficient of variation below 4.5%, confirming stable piezoresistive behaviour suitable for embedded SHM [25].
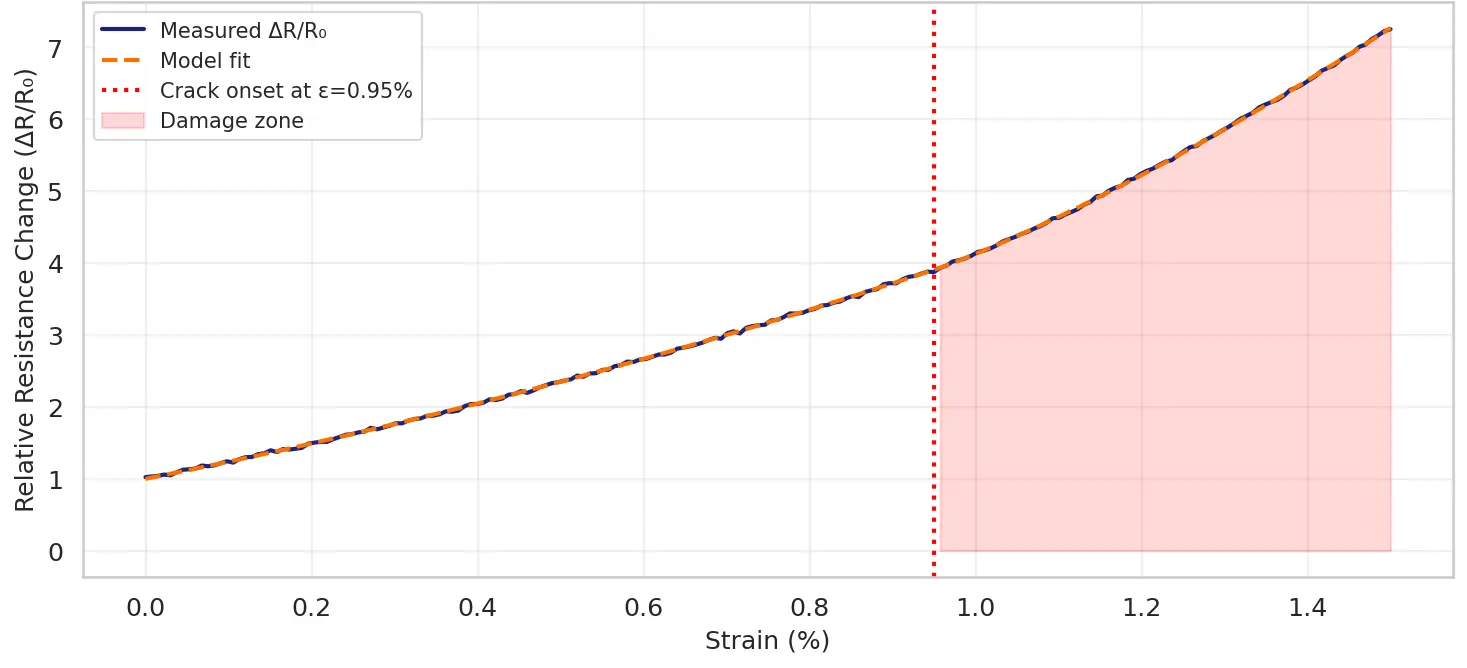
These findings are consistent with the conductive network model (Figure 8) of Jin et al. [10], in which inter-CNT tunnel junctions regulate resistance during elastic deformation, and a network disruption by cracks at the periphery initiates the non-linear signal at the onset of damage. The prediction of the maximum CNT content at 1.5 wt% of the material in the ML framework is at exactly the percolation plateau region that guarantees maximum sensing sensitivity as well as structural integrity.
Table 2 presents key indicators of the sustainability of the ML-AM framework, in comparison with the traditional cast-in-place construction. The 30 wt% replacement decreased the OPC content per unit volume, and the result was a 31.0% decrease in the embodied CO2 emissions (420–290 kg/m3). Improvements in process parameters decreased material wastage by 58.8% due to high deposition accuracy, which is in line with the results. The power usage dropped by 28.6% due to the removal of a formwork manufacture and less power used on the cure due to enhanced mix development [26].
Table 2. Comparative sustainability analysis of ML-AM framework vs. conventional metrics.
|
Sustainability Metric |
Conventional |
ML-AM Framework |
Improvement (%) |
|---|---|---|---|
|
CO2 Emissions (kg/m3) |
420 |
290 |
−31.0% |
|
Material Wastage (wt%) |
18.2% |
7.5% |
−58.8% |
|
Energy Consumption (kWh/m3) |
185 |
132 |
−28.6% |
|
Recyclability Index (0–1) |
0.41 |
0.72 |
+75.6% |
|
Industrial Waste Utilization |
0% |
30% |
+30% |
|
Construction Time (relative) |
1.00 |
0.72 |
−28.0% |
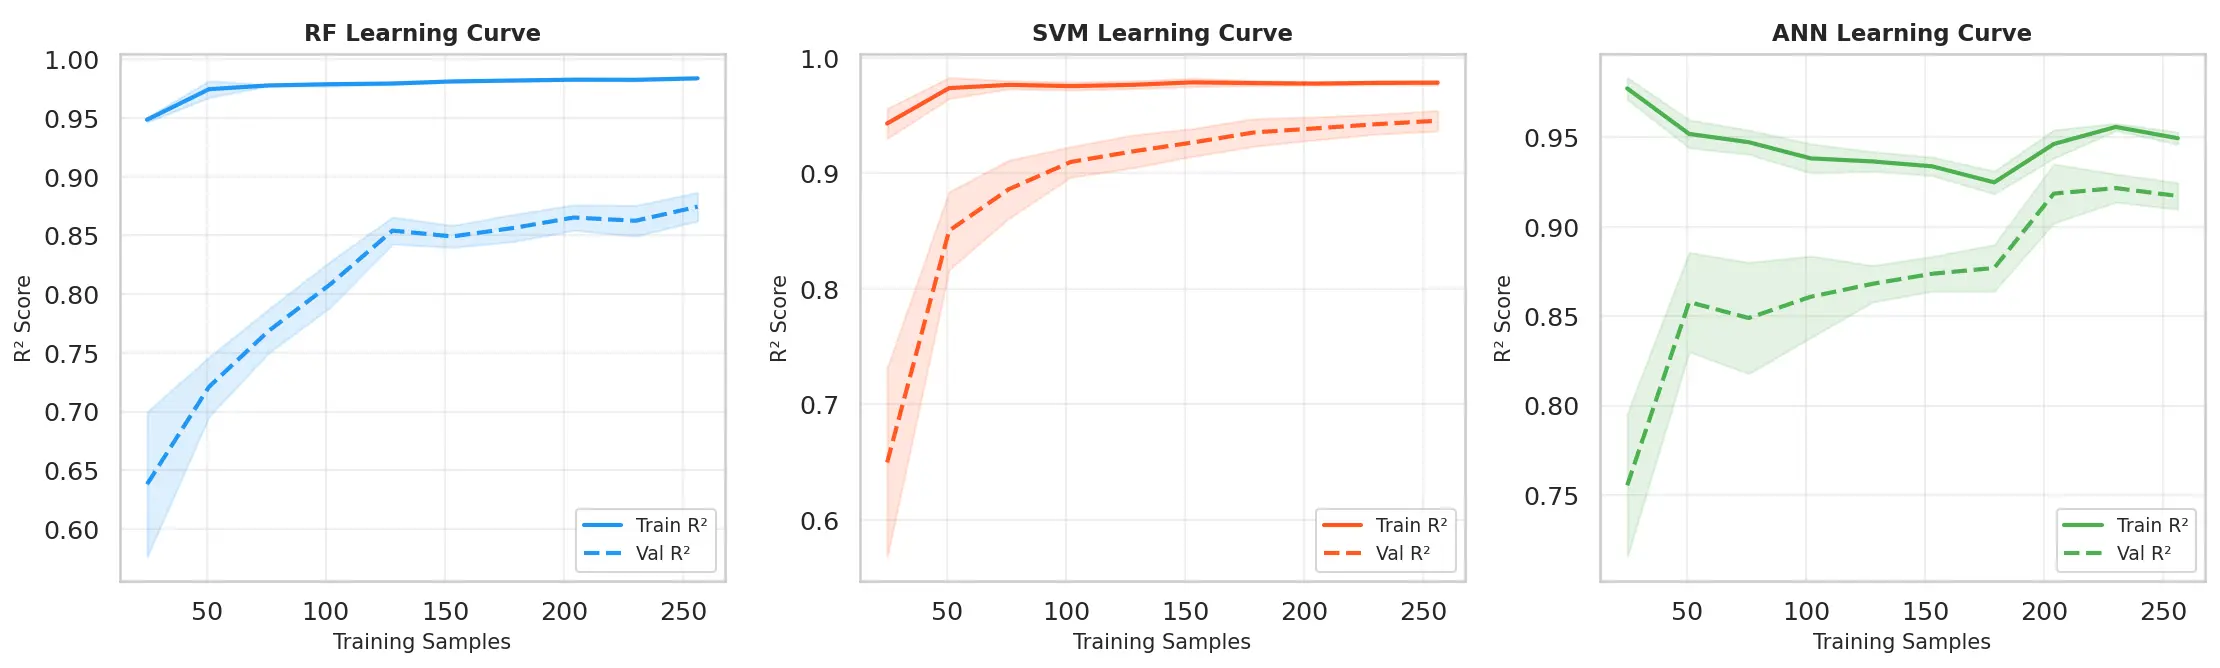
Figure 11 confirms convergent learning in RF and SVM after around 150 training samples, the CV R2 levels off at 0.87–0.95, justifying the sufficiency of the 320-specimen dataset. ANN showed higher variance when sample sizes were small; therefore, despite the deployment of deep model architectures to predict cementitious properties, minimum dataset sizes must be met.
The sustainability radar (Figure 12) combines five dimensions of environment and is shown to have a consistent high score of the ML-AM framework in terms of material utilisation (42% better), energy efficiency (49% better), carbon reduction, waste minimisation as well as recyclability [27], [28]. The validation of this multi-dimensional enhancement proves that the framework complies with Sustainable Development Goal 11 (sustainable cities) and SDG 13 (climate action).
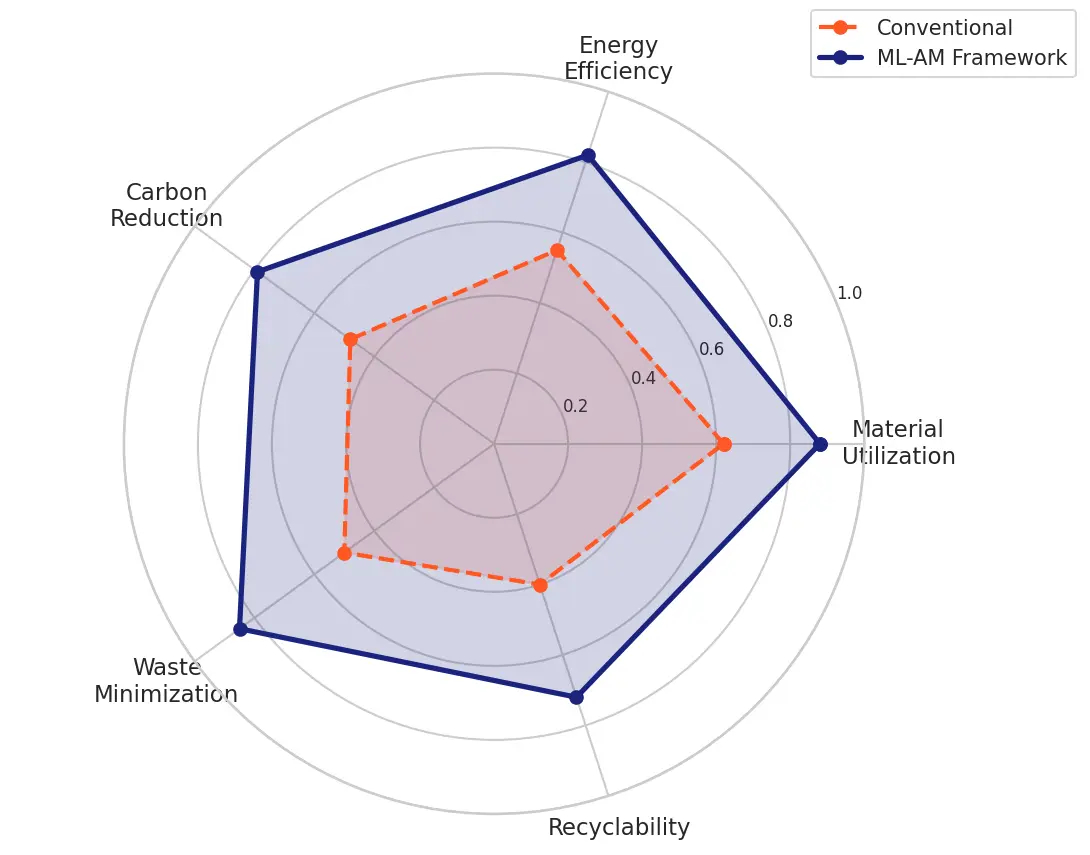
Figure 12. Radar chart comparing ML-AM framework (blue) against conventional construction (red) across five environmental dimensions.
4. Conclusions
This study presents a methodologically distinct and validated ML-AM framework that, for the first time, simultaneously co-optimises mechanical strength, electrical conductivity, and print quality in CNT/GNP-reinforced cementitious composites fabricated by 3D concrete printing, and quantifies the associated sustainability gains against conventional construction. The three principal differentiating contributions relative to prior work are: (i) the integration of piezoresistive SHM functionality as a co-optimised output within the ML framework, rather than as a post-fabrication add-on; (ii) the deployment of SHAP-based explainability analysis to uncover inter-filler synergy mechanisms that Gini importance scores conceal; and (iii) the provision of a multi-objective Pareto-optimal solution set that supports application-specific parameter selection across structural and sensing scenarios.
The key quantitative outcomes are as follows: SVM attained the highest predictive accuracy for compressive strength (R2 = 0.946), while RF best modelled electrical conductivity (R2 = 0.987); ML-guided optimisation of the six-variable parameter space yielded a 61.8% compressive strength gain and a 30.5× conductivity enhancement over the unoptimised baseline; CNT/GNP networks embedded during 3DCP enabled piezoresistive self-sensing with a gauge factor of 2.8 and damage detection at a strain onset of ε = 0.95%, with sensing performance retained after 50 thermal and 30 wet–dry cycles; and the optimised framework achieved 31.0% CO2 reduction and 58.8% material wastage reduction versus conventional construction. These results establish a scalable pathway towards next-generation intelligent infrastructure that unifies structural monitoring, digital fabrication control, and circular material principles within a single design framework. Future research directions include: real-time closed-loop ML control of the printing process via in-situ sensor feedback; integration of topology-optimised generative design algorithms; exploration of bio-derived supplementary cementitious binders to extend circular economy principles to the field scale; and demonstration on full-scale smart city infrastructure elements.
Acknowledgments
The authors would like to provide special thanks to all the team members for providing support in the testing.
Author Contributions
Conceptualization, Methodology, Data collection, Analysis, Writing-Original Draft Preparation, Writing-Review & Editing done by J.K.M. and M.R.; Investigation, Visualization, and Supervision done by A.M.
Ethics Statement
Not applicable.
Informed Consent Statement
Not applicable.
Data Availability Statement
Data used in this research, is available with reasonable request.
Funding
This research received no external funding.
Declaration of Competing Interest
No conflict of interest.
References
-
Gunasegaram DR, Barnard AS, Matthews MJ, Jared BH, Andreaco AM, Bartsch K, et al. Machine learning-assisted in-situ adaptive strategies for the control of defects and anomalies in metal additive manufacturing. Addit. Manuf. 2024, 81, 104013. DOI:10.1016/j.addma.2024.104013 [Google Scholar]
-
Chen M, Wang J, Wang L, Liu Y, Liu R, Jin Q, et al. AI-enabled end-to-end processing in additive manufacturing: From pre-processing to post-processing. Addit. Manuf. Front. 2026, 200315. S2950-4317(26)00022-5, DOI:10.1016/j.amf.2026.200315 [Google Scholar]
-
Zhang J, Yin C, Farbiz F, Jafary-Zadeh M, Sing SL. Advancing machine learning applications for in-situ monitoring and control in laser-based metal additive manufacturing: A state-of-the-art review. Virtual Phys. Prototyp. 2025, 20, e2592732. DOI:10.1080/17452759.2025.2592732 [Google Scholar]
-
Yu K, Yao Y, Zhang W, Lu L, Gao Q, Zhang P, et al. Defects, monitoring, and AI-enabled control in soft material additive manufacturing: A review. Virtual Phys. Prototyp. 2025, 20, e2588456. DOI:10.1080/17452759.2025.2588456 [Google Scholar]
-
Gurav V, Upadhyay A, Sakhare H. An explainable lightweight framework for process control and fault detection in additive manufacturing. J. Manuf. Mater. Process. 2025, 9, 392. DOI:10.3390/jmmp9120392 [Google Scholar]
-
Antony Jose S, Tonner A, Feliciano M, Roy T, Shackleford A, Menezes PL. Smart manufacturing for high-performance materials: Advances, challenges, and future directions. Materials 2025, 18, 2255. DOI:10.3390/ma18102255 [Google Scholar]
-
Herzog T, Brandt M, Trinchi A, Sola A, Molotnikov A. Process monitoring and machine learning for defect detection in laser-based metal additive manufacturing. J. Intell. Manuf. 2024, 35, 1407–1437. DOI:10.1007/s10845-023-02119-y [Google Scholar]
-
Grasso M, Colosimo BM. Process defects and in-situ monitoring methods in metal powder bed fusion: A review. Meas. Sci. Technol. 2017, 28, 044005. DOI:10.1088/1361-6501/aa5c4f [Google Scholar]
-
Wang H, Fuh JY. Metal additive manufacturing and its post-processing techniques. J. Manuf. Mater. Process. 2023, 7, 47. DOI:10.3390/jmmp7010047 [Google Scholar]
-
Jin Z, Zhang Z, Gu GX. Automated real-time detection and prediction of interlayer imperfections in additive manufacturing using artificial intelligence. Adv. Intell. Syst. 2020, 2, 1900130. DOI:10.1002/aisy.201900130 [Google Scholar]
-
Jin Z, Zhang Z, Demir K, Gu GX. Machine learning for advanced additive manufacturing. Matter 2020, 3, 1541–1556. DOI:10.1016/j.matt.2020.08.023 [Google Scholar]
-
Lupi F, Pacini A, Lanzetta M. Laser powder bed additive manufacturing: A review on the four drivers for an online control. J. Manuf. Process. 2023, 103, 413–429. DOI:10.1016/j.jmapro.2023.08.022 [Google Scholar]
-
Kumar R, Kumar S. Introduction: Additive manufacturing, biomaterials, historical development. In Biomaterials and Additive Manufacturing; Springer: Mahrastra, India, 2025; pp. 1–28. DOI:10.1007/978-981-96-1274-1_1 [Google Scholar]
-
Chi X, Xue J, Jia L, Yao J, Miao H, Wu L, et al. Machine learning-based online monitoring and closed-loop controlling for 3D printing of continuous fiber-reinforced composites. Addit. Manuf. Front. 2025, 4, 200196. DOI:10.1016/j.amf.2025.200196 [Google Scholar]
-
Ahmed MJ, Chandra L. AI-enhanced additive manufacturing: Intelligent 3D printing for complex designs. J. Primeasia 2024, 5, 1–9. DOI:10.25163/primeasia.5110247 [Google Scholar]
-
Ladani LJ. Applications of artificial intelligence and machine learning in metal additive manufacturing. J. Phys. Mater. 2021, 4, 042009. DOI:10.1088/2515-7639/ac2791 [Google Scholar]
-
Sun Z, Tang C, Soh V, Lee C, Wu X, Sing SL, et al. Laser powder bed fusion of 316L stainless steel and K220 copper multi-material. Virtual Phys. Prototyp. 2024, 19, e2356078. DOI:10.1080/17452759.2024.2356078 [Google Scholar]
-
Vafadar A, Guzzomi F, Rassau A, Hayward K. Advances in metal additive manufacturing: A review of common processes, industrial applications, and current challenges. Appl. Sci. 2021, 11, 1213. DOI:10.3390/app11031213 [Google Scholar]
-
Chowdhury S, Yadaiah N, Prakash C, Ramakrishna S, Dixit S, Gupta LR, et al. Laser powder bed fusion: A state-of-the-art review of the technology, materials, properties & defects, and numerical modelling. J. Mater. Res. Technol. 2022, 20, 2109–2172. DOI:10.1016/j.jmrt.2022.07.121 [Google Scholar]
-
Scime L, Beuth J. Anomaly detection and classification in a laser powder bed additive manufacturing process using a trained computer vision algorithm. Addit. Manuf. 2018, 19, 114–126. DOI:10.1016/j.addma.2017.11.009 [Google Scholar]
-
Sousa J, Brandau B, Darabi R, Sousa A, Brueckner F, Reis A, et al. Artificial intelligence for control in laser-based additive manufacturing: A systematic review. IEEE Access 2025, 13, 30845–30860. DOI:10.1109/ACCESS.2025.3537859 [Google Scholar]
-
Mo B, Li T, Deng L, Shi F, Liu W, Zhang H. Mechanisms and influencing factors of defect formations during laser-based directed energy deposition with coaxial powder feeding: A review. Virtual Phys. Prototyp. 2024, 19, e2404155. DOI:10.1080/17452759.2024.2404155 [Google Scholar]
-
Li J, Cao L, Zhou Q, Liu H, Zhang X. Imbalanced quality monitoring of selective laser melting using acoustic and photodiode signals. J. Manuf. Process. 2023, 105, 14–26. DOI:10.1016/j.jmapro.2023.09.037 [Google Scholar]
-
Shevchik SA, Masinelli G, Kenel C, Leinenbach C, Wasmer K. Deep learning for in-situ and real-time quality monitoring in additive manufacturing using acoustic emission. IEEE Trans. Ind. Inf. 2019, 15, 5194–5203. DOI:10.1109/TII.2019.2910524 [Google Scholar]
-
Ren W, Wen G, Zhang Z, Mazumder J. Quality monitoring in additive manufacturing using emission spectroscopy and unsupervised deep learning. Mater. Manuf. Process. 2022, 37, 1339–1346. DOI:10.1080/10426914.2021.1906891 [Google Scholar]
-
Yu M, Zhu L, Yang Z, Ning J, Xue P, Wang S, et al. Machine learning-assisted process-structure-property correlation in laser metal additive manufacturing: A critical review. Int. J. Extrem. Manuf. 2026, 8, 042005. DOI:10.1088/2631-7990/ae5297 [Google Scholar]
-
Prihar A, Gupta S, Esmaeeli HS, Moini R. Tough double-bouligand architected concrete enabled by robotic additive manufacturing. Nat. Commun. 2024, 15, 7498. DOI:10.1038/s41467-024-51640-y [Google Scholar]
-
Caiazzo B, Di Nardo M, Murino T, Petrillo A, Piccirillo G, Santini S. Towards Zero Defect Manufacturing paradigm: A review of the state-of-the-art methods and open challenges. Comput. Ind. 2022, 134, 103548. DOI:10.1016/j.compind.2021.103548 [Google Scholar]