Statistical and Machine Learning Approaches to Production Optimization in the Brewery Industry

Statistical and Machine Learning Approaches to Production Optimization in the Brewery Industry
Chijike Macdonald Ogbu Basil Eberechukwu Okafor Osita Obineche Obiukwu Victor Uchechukwu Opara Daniel Arinze Ekpechi *
Received: 18 April 2026 Revised: 09 May 2026 Accepted: 02 June 2026 Published: 09 June 2026

© 2026 The authors. This is an open access article under the Creative Commons Attribution 4.0 International License (https://creativecommons.org/licenses/by/4.0/).
1. Introduction
Production collapse in manufacturing refers to a sustained decline in efficiency, output, or capacity utilization resulting from interconnected operational, managerial, and technical failures. In process-based industries such as brewing, where production relies on skilled labour, tightly coupled equipment, stable raw material supply, and continuous energy availability, disruptions in any subsystem can rapidly propagate into significant productivity losses [1,2]. The brewery industry, therefore, remains particularly vulnerable to production instability, despite its strategic importance to national and global economies.
Globally, the brewing sector contributes substantially to employment and industrial growth, with Germany leading the European market and accounting for approximately 22% of regional brewery revenue, valued at over €24 billion annually [3]. In Africa, South Africa dominates the beverage and brewery industry, generating about 45% of continental revenue through major multinational operators [4]. Nigeria, however, remains a key player in West Africa, with Nigerian Breweries Plc (Lagos, Nigeria) contributing over 65% of national brewery revenue in recent years [5]. Despite this performance, historical evidence shows that several breweries have experienced severe production declines, including Premier Breweries Ltd. (Onitsha, Nigeria), which accounted for nearly 18% of Nigeria’s total brewery sector revenue at its peak in 2003 before entering a prolonged downturn [6].
Production collapse represents not only an operational challenge but also a major economic concern, leading to increased job losses, production costs, reduced competitiveness, and market share erosion. Prior studies attribute productivity decline in breweries to frequent machine breakdowns, financial mismanagement, unavailability of spare parts, political or regulatory instability, and supply chain disruptions [7]. However, conventional improvement strategies, such as preventive maintenance, workforce retraining, and supply chain restructuring, are often reactive [8].
In recent years, advances in statistical, mathematical, and ML model techniques have transformed industrial performance analysis. Methods such as multiple regression and Random Forest (RF) models enable robust identification of critical production drivers [9]. While optimization and what-if scenario analysis supports cost effective intervention and predictive decision-making strategies [10]. These approaches offer superior insight compared to traditional diagnostic methods by ranking factor importance, capturing nonlinear interactions and validating outcomes using quantitative performance metrics [11,12].
The aim of this review is to critically synthesize existing literature on the root causes of production collapse in the brewery industry. Also, the study will examine the application of data-driven statistical, ML, and optimization methods for improving output efficiency, with particular relevance. The review focused on identified production decline factors, modelling approaches for root cause analysis, validation practices, and scenario-based optimization strategies. The paper is structured to present a conceptual understanding of production collapse, review empirical findings, assess analytical methodologies, identify research gaps, and highlight future directions for data-driven productivity recovery in brewery operations.
2. Methodology of the Study
2.1. Review Design and Protocol
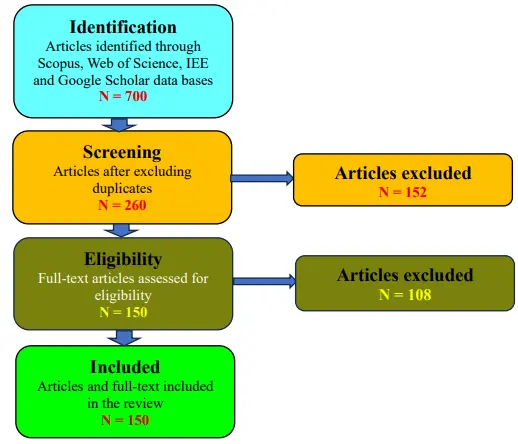
This study adopted a structured and systematic review design to ensure transparency, rigor, and reproducibility. The review process was guided by the Preferred Reporting Items for Systematic Reviews and Meta-Analyses (PRISMA) framework, which provides a standardized protocol for the identification, screening, eligibility assessment, and inclusion of relevant peer-reviewed studies [13]. As illustrated in Figure 1, the symbol “N” represents the number of articles (sample size) at each stage of the review process. Specifically, it denotes the total count of records identified, screened, excluded, assessed for eligibility, and finally included in the qualitative synthesis. The systematic search was conducted across major academic databases. A total of N = 700 records were initially identified. After duplicate removal and preliminary screening based on titles and abstracts, N = 260 articles remained for further consideration, while N = 152 were excluded due to irrelevance and duplication. Full-text eligibility assessment was conducted on N = 150 articles, during which N = 108 were excluded based on predefined inclusion and exclusion criteria such as lack of methodological clarity, insufficient empirical evidence, and limited relevance to brewery production systems. Ultimately, the final number of studies included in the qualitative synthesis was N = 150.
The methodology involved structured literature searching, screening, eligibility assessment, and qualitative synthesis of peer-reviewed publications related to industrial optimization.
2.2. Data Sources and Search Strategy
Relevant literature was retrieved from major scientific and engineering databases to ensure comprehensive coverage of high-quality and peer-reviewed studies. The databases consulted included Scopus, Web of Science, ScienceDirect, SpringerLink, IEEE Xplore, and Google Scholar. These databases were selected due to their extensive indexing of manufacturing, industrial engineering, optimization, and machine learning research. The literature search employed a combination of keywords and Boolean operators to capture studies relevant to the objectives of this review. Key search terms included production collapse, production decline, brewery industry, manufacturing inefficiency, root cause analysis, machine downtime, multiple regression, ML, RF, optimization, and what-if analysis. The search strategy was refined iteratively to improve relevance and minimize redundancy. Only articles published in English and within relevant engineering, manufacturing, and industrial management domains were considered.
2.3. Study Selection, Data Handling, and Review Scope
The study followed predefined inclusion and exclusion criteria to ensure relevance and quality. Included studies comprised peer-reviewed journal articles, conference proceedings, and high-impact review papers that addressed production decline, performance analysis, root cause identification, data-driven modelling, or optimization in breweries or closely related manufacturing industries. Studies focusing solely on non-industrial, non-quantitative, or purely descriptive analyses without operational relevance were excluded.
Following database retrieval, duplicate records were removed, and titles and abstracts were screened to assess relevance. Full-text articles were then evaluated for eligibility based on methodological rigor, clarity of objectives, and contribution to production collapse analysis. Relevant data from the selected studies including identified production factors, modelling techniques, validation metrics, and optimization outcomes was systematically extracted and synthesized qualitatively. The scope of the review emphasized on root cause identification, statistical and ML modelling approaches, validation practices, and what-if optimization strategies applicable to brewery operations, with particular relevance to developing-economy contexts. This approach ensured that the review remained focused, analytical, and aligned with the objectives of identifying dominant production decline factors and data-driven pathways for productivity recovery.
3. The Findings
3.1. Conceptual View of Production Collapse in Breweries
Production collapse in breweries can be operationally defined as a sustained reduction in production output, capacity utilization, and process efficiency [14]. This is often accompanied by increased machine downtime, quality losses, and rising operating costs [15]. Owing to the tightly coupled nature of brewing operations, disruptions in equipment performance, raw material supply, workforce availability, energy provision, and management practices rarely occur in isolation but interact as a complex system [16,17]. Consequently, production collapse should be viewed as a multi-factor systemic problem rather than a single point failure [18].
From the perspective of the Theory of Constraints (ToC), production decline is frequently driven by one or more critical bottlenecks that restrict overall throughput and amplify inefficiencies across the production line [19,20]. Similarly, lean manufacturing principles interpret production collapse as the accumulation of waste, including unplanned downtime, rework, waiting time, and underutilized resources [20,21]. Integrating these perspectives provides a structured conceptual foundation for identifying dominant constraints [22]. Understanding their interactions and guiding data-driven root cause analysis and optimization efforts in brewery operations [23]. The following section reviews existing empirical and methodological studies that have examined the causes, modelling approaches, and optimization strategies associated with production collapse and efficiency improvement in the brewery and related manufacturing industries.
Cerna-Arribasplata et al. [24] defined production collapse in operational terms as excessive downtime, long setup times, and high defect rates in brewery operations. Using a lean approach, the authors demonstrate that production inefficiency is a multi-factor system problem driven by bottlenecks and maintenance failures. They also highlighted that practical lean tools significantly reduced downtime and waste, showing their effectiveness in improving brewery production performance without deep theoretical complexity.
Dumbuya et al. [25] viewed production inefficiency in breweries as operational disorder, time loss, and workflow waste rather than isolated machine failure. By applying the 5S lean methodology, the authors show that production decline is a multi-factor problem linked to poor workplace organization and process flow. The results demonstrate that simple lean tools can reduce downtime, improve efficiency, and enhance productivity in brewery operations.
Escárcega Zepeda et al. [26] pinpointed production decline in breweries caused by poor delivery performance, process delays, and inefficiencies in personnel and machinery. Using lean based DMAIC (Define, Measure, Analyze, Improve, and Control) tools, the authors demonstrated that production collapse is a system wide problem, which involved workflow bottlenecks and waste. The application of the lean methods significantly improved efficiency, reduced costs, and restored operational performance in the brewery.
Howard et al. [27] linked production efficiency in breweries to energy-related operational constraints, showing how energy inflexibility can limit productivity and increase costs. Using a system-based simulation approach, the authors demonstrated that operational bottlenecks in energy use contribute to inefficiency and cost escalation. The findings highlighted energy management as a practical lean related lever for enhancing brewery performance and preventing production decline.
Wood & Martin [28] examined how regulatory variations, such as liquor licensing timing, flexibility, and competition policy, drive craft brewery growth differences across Australian states. This showed that early reforms in Victoria lowered entry barriers and spurred development. This institutional perspective highlighted regulatory bottlenecks that limit production output and market access, offering practical insights for breweries facing restrictive licensing that hampers efficiency and expansion.
Building on this conceptual framework, production collapse in breweries and beverages is best examined through the specific operational factors that constrain output and efficiency. Existing studies consistently emphasized that measurable disruptions rather than abstract organizational issues drive sustained productivity decline in process industries. Consequently, the next section critically reviews empirical research on the major root causes of production decline in the brewery industry. This phase focused on quantifiable factors, including equipment performance, supply chain reliability, workforce capability, energy availability, and financial regulatory pressures. This structured approach enables direct comparison of dominant causes across studies and supports evidence-based root cause identification.
3.2. Major Root Causes of Production Decline in the Brewery Industry
Production decline in the brewery industry is rarely attributable to a single cause but emerges from the interaction of multiple measurable operational, technical, and economic factors [29]. Empirical studies consistently show that sustained output reduction is driven by disruptions that directly affect production capacity, process continuity, and resource availability [30]. To ensure analytical clarity and comparability, this section reviews existing research by organizing identified causes into quantifiable categories commonly used in industrial performance analysis.
3.2.1. Machine Downtime and Equipment Failures
This type of failure represents critical bottlenecks in brewery operations, caused by sudden output declines, extended production halts, and significant inefficiencies that erode profitability and competitiveness [31]. These issues often arise from a multi-factor system, including maintenance gaps, regulatory constraints, and process waste, as addressed by ToC and lean manufacturing principles [32]. These studies highlighted practical strategies for minimizing downtime in the brewing industry.
Onyema et al. [33] observed frequent packaging machine breakdowns in a Nigerian brewery primarilydue to maintenance lapses, using Mean Time Between Failures (MTBF), Mean Time to Repair (MTTR), and availability metrics in their quantitative model. Applying root cause analysis and preventive maintenance optimization strategies, boosted reliability by 99.7%. This research aligned with lean waste reduction, though the single site data limits generalizability compared to multi-factory studies.
Paprocka [34] identified machine failures stemming from inadequate predictive maintenance. The study also compared predictive and proactive reactive strategies in production scheduling. Using Quality Robustness (QR) and Solution Robustness (SR) as key metrics in simulations, the predictive reactive approach excelled in stability, cost savings, and waste reduction. This contrasts with reactive maintenance in other studies, emphasizing predictive forecasting over root cause fixes. However, the accuracy of failure predictions remains a noted limitation.
Mohamed et al. [35] identified operator skill gaps as major contributors to frequent machine breakdowns in brewery operations. The study focused on improving the reliability of the glass bottle filler and crowner system in a beer production plant through the implementation of an Autonomous Maintenance (AM) program, a core pillar of Total Productive Maintenance (TPM).
AM is a proactive maintenance approach that empowers machine operators to take responsibility for routine maintenance activities such as cleaning, inspection, lubrication, tightening of loose components, early fault detection, and minor adjustments. The objective of AM is to enhance equipment reliability, reduce unplanned downtime, improve operator ownership, and foster continuous improvement through early identification of abnormalities before they escalate into major failures.
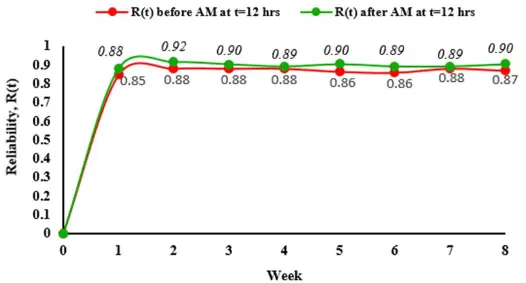
Before the implementation of AM, the machine recorded an average MTBF of 87.42 h, an MTTR of 1.15 h, and reliability levels of 87% for a 12-h shift and 76% for 24-h continuous operation. After two months of AM implementation, significant performance improvements were observed: MTBF increased to 113.27 h, MTTR decreased to 0.87 h, and reliability improved to 90% and 81% for 12-h and 24-h operations, respectively. Figure 2 presents the reliability profile of the glass bottle filler/crowner before and after applying the AM model, demonstrating the effectiveness of structured, operator-driven maintenance in enhancing production stability and operational efficiency.
 |
 |
|
(a) |
(b) |
Figure 2. Comparison of machine reliability over an 8-week period of glass bottle filler/crowner before and after AM at t = 12 h (a) and at t = 24 h (b). Adapted from “Implementation of Autonomous Maintenance and its Effect on MTBF, MTTR, and Reliability of a Critical Machine in a Beer Processing Plant” by A. Mohamed et al. [35], used under CC BY 4.0. [https://www.researchgate.net/publication/359061752_Implementation_of_Autonomous_Maintenance_and_its_Effect_on_MTBF_MTTR_and_Reliability_of_a_Critical_Machine_in_a_Beer_Processing_Plant] (accessed on 24 January 2026).
These results highlighted the effectiveness of empowering operators with the skills to perform minor maintenance tasks, thereby reducing breakdowns, increasing machine reliability, and optimizing equipment performance. However, the research could further explore long-term impacts and the scalability of AM in other machines within the plant.
Inyiama & Oke [36] identified machine age and wear out as primary downtime causes in a Nigerian bottling plant. The study applied Weibull analysis, Pareto charts, and cause-effect diagrams to model monthly downtime. From the result, preventive maintenance mitigated the losses. From the Key Performance Indicators (KPIs), the actual required time of the machine showed 92 h, while the targeted number of the machine to perform was 142 h. The outcome of the research differed from Reliability-Centered Maintenance (RCM) focused studies, by prioritizing equipment specific wear patterns over system criticality [37].
3.2.2. Supply Chain and Raw Material Disruptions
Supply chain disruptions and raw material shortages, such as barley, hops, and malt, trigger production collapses in breweries by halting brewing schedules and inflating costs [38]. These multi-factor issues expose vulnerabilities in global sourcing, often amplified by logistics delays or supplier failures [39]. This section reviews studies that applied optimization models to mitigate inventory bottlenecks and ensure steady input flows.
Nettesheim et al. [40] identified keg logistics inefficiencies, which include fleet size, turnaround time, and pick-up distances as key supply chain disruptions in a regional brewery. The study applied Internet of Things (IoT) enabled smart keg simulations for optimization. This technology driven approach contrasts with maintenance focused studies, showing no conflicts but highlighting scalability gaps without real world validation.
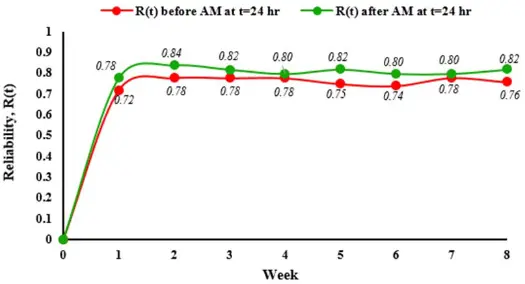
Soliani et al. [41] attributed Brazilian brewery supply chain disruptions to inefficient vehicle use and empty returns. Figure 3 illustrates the proposed improved collaborative logistics model. The research underscores the importance of collaborative logistics as a key strategy for sustainable, cost-effective operations. They applied a collaborative logistics model, boosting economic efficiency from 16% to 91% and cutting CO2 emissions from 44.88 to 26.67 kg/t.
The applied vehicle optimization metrics aligned well with IoT tracking but emphasize environmental gains, with no conflicts. However, broader variable integration remains a gap across partnership studies.
Wolmarans & Niemann [42] identified poor internal supply chain integration, such as goal misalignment and information gaps, as key causes of prolonged disruptions during COVID-19 alcohol bans in South African liquor production. The research applied On-Time in Full (OTIF) model as the primary recovery metric from 15 manager interviews. Internal supply chain integration mechanisms outperformed logistics tech by enabling rapid data collection and response planning. The applied model envisaged no conflicting findings; however, the single firm focus limits broader brewery applicability.
Dinsa [43] identified weak Supply Chain Management (SCM) practices such as supplier partnerships, information sharing, and lean internals as primary causes of poor operational performance at Bedele Brewery. Using lead time as the key quantitative variable in SPSS regression of 184 employee surveys, the coefficient of determination (R2) showed 80.9%. This strong practice performance link contrasts with crisis focused integration by emphasizing proactive lead time reduction, showing no conflicts but highlighting perception-based data gaps verses hard metrics in other studies.
3.2.3. Financial Challenges
Financial pressures, including high capital costs for equipment and volatile input prices, constrain brewery expansion and maintenance, leading to output declines and inefficiency [44,45]. Cash flow gaps exacerbate downtime risks, creating a vicious cycle of underinvestment [46]. Reviewed works highlighted cost reduction models for operational resilience.
Chuku et al. [47] identified poor cost control and cash management as key causes of financial underperformance in Nigerian brewery firms. The research applied earnings per share as the primary variable in the regression analysis of 13 listed companies from 2012–2021. Cost reduction strategies showed significant positive impacts on profitability, aligning with the benefits of SCM integration. However, shifting focus from operational to financial metrics, with no conflicts, Nigeria specific data limits cross regional comparisons.
Obembe et al. [48] found conflicting evidence on Corporate Social Responsibility (CSR) accounting’s impact on Nigerian brewery performance. Some of the reviewed studies showed significant links and others none, based solely on literature review without primary quantitative models or variables. This inconclusive result contrasts sharply with consistent operational metrics such as MTBF and MTTR. This highlighted CSR’s ambiguous role verses clear cost and maintenance drivers, and underscores the need for empirical data over secondary analysis.
Agbata et al. [49] identified suboptimal financial ratios as key causes of poor brewery performance in Nigeria. To help the situation, the study applied the current ratio as the negative impact, the debt equity ratio as the positive impact on the Return on Assets (ROA), and net profit margin as primary variables in a regression analysis of 4 firms from 2010–2018. The outcome indicated high liquidity performance, while optimal debt mix helped in contrasting cost control emphasis with no conflicts.
Banabo & Aganaba [50] identified capital structure and firm size as key financial factors influencing brewery performance. Across similar studies, financial structure is commonly examined, but its impact is often weak or insignificant. This contrasts with other authors who report stronger effects from operational and managerial variables. Conflicting findings suggest that financial leverage alone does not explain productivity or performance decline. The quantitative model relied on ROA, Return on Investment (ROI), equity, debt, and firm size as core variables.
3.2.4. Regulatory and Political Influences
Regulatory hurdles such as licensing, taxes, and political instability act as institutional bottlenecks, delaying production and market entry in breweries [51,52]. These external factors override internal efficiencies per ToC [53]. Studies here compare policy impacts across regions to guide compliance strategies.
Dumbili [54] identified policy failure and industry influence as key structural causes affecting Nigeria’s brewery sector environment. Across studies, regulatory weakness contrasts with others that emphasize financial or operational drivers. Conflicting findings arise as the work attributed challenges to strategic corporate behaviour, not production inefficiency. The study is largely qualitative, unlike quantitative models used by other authors. Key analytical variables include policy ambiguity, corporate campaigns, and regulatory enforcement, with no numerical performance metrics.
Odo et al. [55] identified fiscal policy, government regulation, and automation as key drivers of brewery performance. Using Pearson correlation, strong positive relationships were found, where from the outcomes, fiscal policy is 12.16 > 3.182, government policy is 6.91 > 3.182, and automation is 5.27 > 3.182. Compared with studies that emphasized on financial structure or policy ambiguity, the work highlighted external regulatory and technological factors as dominant. Conflicting evidence exists as policy effects are shown to be statistically significant, unlike studies reporting weak financial impacts. Key quantitative variables include profitability, sales growth, market share, and automation level, though results are location specific.
Okafor et al. [56] captured government policy, economic resources, and employee income as major causes influencing brewery productivity and growth. Compared with studies emphasizing automation or capital structure, policy impact emerged as the most dominant factor with R2 of 0.811, p-value of <0.05. Conflicting evidence exists where financial variables are weak in other studies but strongly significant here. Regression, correlation, and Chi-square analyses confirm positive effects of resources of R2 = 0.663 and income on performance χ2 = 75.036 > 9.49. Key quantitative variables include productivity, growth rate, income level, and policy stability, though regional effects were not fully captured.
Egwu [57] envisaged government regulation, taxation, interest rates, and price control as key factors affecting brewery performance. In contrast to studies that find strong policy effects, regulatory impact here is weak, with only taxation showing a limiting influence on demand. This creates a conflict with the evidence, as government policies significantly drive profitability and productivity. Using descriptive and inferential statistics, the study modelled performance, demand level, and disposable income as core variables. Results emphasize that excessive taxation, rather than broad regulation, constrains brewery operations, though the findings are limited by scope.
Poelmans et al. [58] identified political will, party alignment, voter preferences, and special interest lobbying as key drivers of alcohol policy change. Across studies, special interest influence and party ideology emerge as dominant factors shaping policy outcomes. This contrasts with economic focused studies that emphasize market or regulatory impacts rather than political dynamics. Using legislative voting analysis, the study modelled voting behaviour as a function of party affiliation, ideology, and interest group pressure. Results show special interests and national party alignment as the strongest predictors, though socio-economic effects were not quantified.
Hawkins et al. [59] pinpointed industry funded public health campaigns, corporate social responsibility, and policy framing as key drivers of alcohol policy influence. Compared with other studies, indirect lobbying and narrative control emerge as dominant factors rather than formal regulation or economic variables. This conflicts with quantitative studies and directly affects policies on consumption or firm performance. The analysis emphasized policy actors, campaign framing, and media narratives as core variables. Using interviews and qualitative framing methods, findings show that such campaigns subtly legitimize industry influences in policymaking, though no numerical impact values were estimated.
3.2.5. Labor Shortages and Workforce Issues
Skilled labour shortages and high turnover disrupt brewery operations, causing training gaps and unplanned downtime from human errors [60]. Workforce constraints compound equipment failures in lean systems [61]. This part of review presents interventions proven to boost operator reliability.
Osisioma & Audu [62] identified performance management, especially training and development, as key drivers of employee productivity in the brewery industry. Using simple linear regression, the study modelled employee productivity as a function of training and development. Results show a strong positive relationship of P = 12.712, R2 = 0.814, and p < 0.05, confirming training as a critical productivity determinant. Across studies, human capital factors emerged as dominant alongside policy and economic influences on performance. This contrasts with research emphasizing weak or indirect effects of regulation on firm outcomes.
Akpan [63] recognized unethical recruitment practices as a key cause of high labour turnover in Nigerian breweries, contributing to organizational instability. Using Generalized Linear Models (GLM), labour turnover was modelled against recruitment ethics. Results show a significant positive relationship (p < 0.005), confirming unethical recruitment as a strong predictor of turnover and performance risk. Compared with studies emphasizing policy, finance, or technology, this work pinpointed human resource governance as a dominant internal factor. This contrasts with findings where employee related issues play a secondary role to external economic or regulatory drivers
Adewumi [64] detected employment casualisation as a major cause of declining union strength and worker protection in Nigeria’s beverage sector. Compared with studies focusing on finance, policy, or technology, the work emphasized labour structure and industrial relations as dominant factors affecting organizational stability. This contrasts with productivity focused studies that downplay union influence on performance outcomes. The study is largely qualitative, relying on institutional variables such as union membership, bargaining power, and employment type rather than quantitative models. Findings reveal a conflict between the recognized importance of collective bargaining and its limited practical effectiveness under widespread casual employment.
Ikwuka et al. [65] identified employee resourcing strategies as key drivers of brewery performance, emphasizing recruitment, placement, and career development. Using correlation analysis, performance was modelled against Employee Resourcing (ER) variables with a strong positive and significant relationship reliability = 0.82. The study confirms that structured resourcing strategies consistently enhanced productivity, though its regional focus limits broader comparison. Compared with studies stressing policy, taxation, or technology, this work highlighted human capital management as a dominant internal factor. This contrasts with findings that downplay workforce strategies in favour of external economic pressures.
Okonkwo et al. [66] found that manpower planning was a key driver of improved organizational performance in the brewery industry. Using regression analysis, manpower planning improved to 61.7% of the performance variance of 18.029. The results confirm that accurate workforce forecasting is a strong quantitative predictor of brewery performance. Compared with other studies that emphasized policy or finance, this work highlighted human resource forecasting and skill planning as dominant internal drivers. This aligns with ER focused studies but contrasts with findings that prioritize external regulatory or economic factors.
3.2.6. Market Demand Fluctuations
Volatile market demand creates over and underproduction imbalances, wasting resources and idling capacity in breweries [67]. It is also known as an amplifies inventory waste per lean principles [68]. The reviewed research in this section illustrated demand forecasting and ToC buffering models to stabilize output amid sales swings.
Etuk et al. [69] captured supply and demand chain management as a key driver of market efficiency in breweries, particularly through demand forecasting and cost control. Applying correlation and ANOVA models, significant relationships were found for demand forecasting and cost efficiency, where p < 0.05 and r ≈ 0.510. The study confirms that operational efficiency is strongly linked to forecasting accuracy rather than lead-time reduction. Compared with human resource and policy focused studies, the work envisaged logistics and operational planning as dominant performance factors. Conflicting evidence emerged as supply and demand chain management showed no significant effect on lead time of p > 0.05, unlike its strong impact on forecasting and costs.
Ike & Ogbodo [70] identified market risks as key drivers of brewery financial performance, with exchange rate volatility and liquidity risk being most influential. Using regression analysis, asset turnover was modelled against inflation, exchange rate, interest rate, tax rate, and liquidity risk. Figure 4 illustrates the Jarque-Bera Test Result of the investigation and the applied optimization regression model.
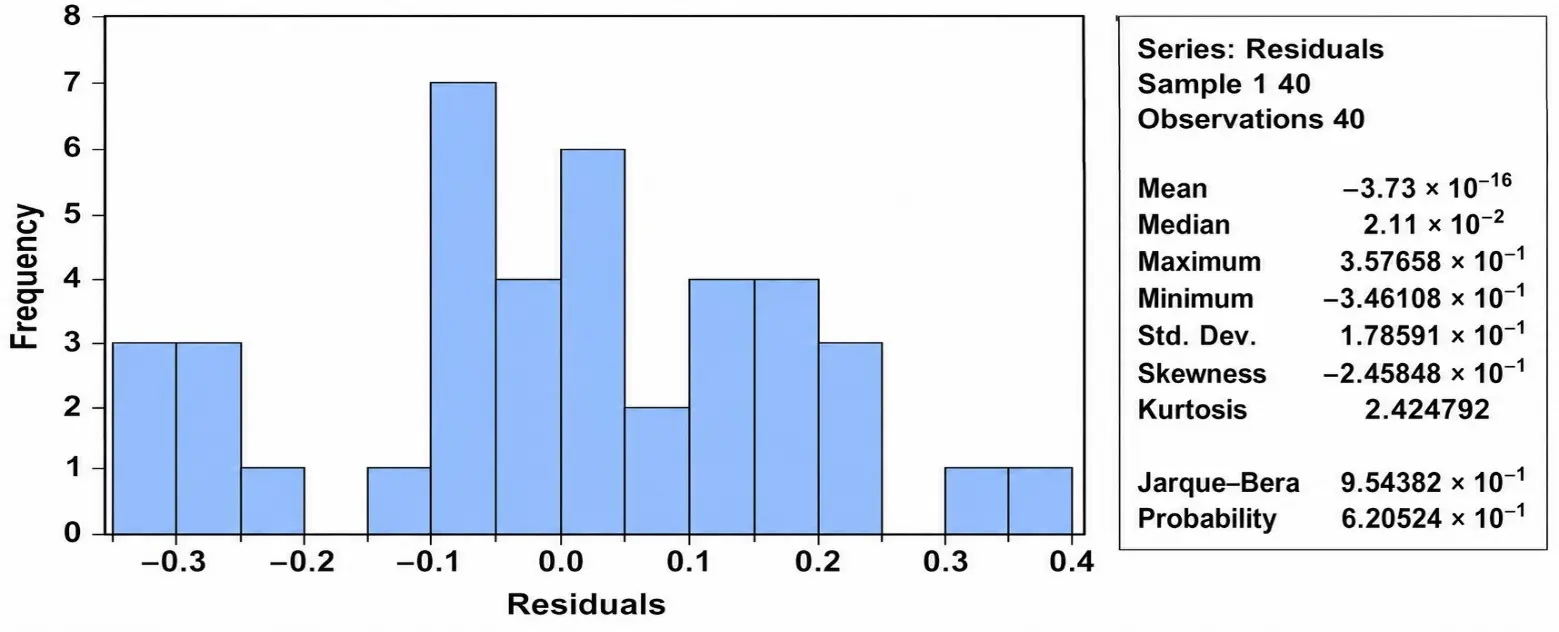
Figure 4 presents the histogram and normality test results of the regression residuals. The horizontal axis represents the residual values (differences between observed and predicted asset turnover values), while the vertical axis represents the frequency of occurrence of these residuals across the 40 observations. The distribution is accompanied by descriptive statistics and the Jarque–Bera (J-B) normality test results.
The residuals show a mean value of approximately 0 (−3.73 × 10⁻¹⁶), a standard deviation of 0.1786, skewness of −0.2458 (indicating slight left skewness), and kurtosis of 2.4248, which is close to the normal distribution benchmark of 3. The Jarque–Bera statistic of 0.9544 with a probability value of 0.6205 indicates that the residuals are normally distributed at conventional significance levels (p > 0.05).
This confirms that the regression model satisfies the normality assumption, thereby validating the reliability and statistical robustness of the estimated optimization model. The findings reveal that exchange rate volatility and liquidity risk significantly influence financial performance, whereas inflation, the tax rate, and the interest rate exhibit non-significant effects. Compared to studies that emphasize human resource or operational factors, this study highlights macroeconomic and financial risks as dominant external determinants of brewery performance.
Ugboya & Odiamenhi [71] captured market demand as the dominant driver of brewery production, outweighing internal operational factors. Using ordinary least square and multiple regression, production was modelled against demand for Stout, Harp, and Malt. Very high coefficients of 0.99349, 0.90981, and 0.99498 for Stout, Harp, and Malt, respectively, indicated strong explanatory power and model reliability. Compared with studies that emphasize finance, policy, or manpower, this work shows that demand-side variables are the strongest predictors of output. However, the focus on demand alone conflicts with studies highlighted equipment, policy, and supply chain constraints as key causes of production decline.
3.2.7. Energy and Infrastructure Constraints
Energy shortages and poor infrastructure, such as unreliable power and water supply, force industrial shutdowns, directly causing production collapse [72]. These utility bottlenecks demand proactive maintenance models [73]. The studies presented here emphasize flexible simulations for resilience in the energy-intensive beverage and brewery industries.
Mathew & Aban [74] highlighted process energy inefficiency as a major cost and productivity constraint in brewery operations. Using Pinch Analysis, the energy demand of 10.44 MW was modelled across heating and cooling utilities. Results showed significant savings of 18% and 21% for hot and cold, respectively, with 39% cost reduction in heat exchanger systems. This contrasts with policy and labour-based studies, demonstrating that engineering optimization alone can yield substantial performance gains. Compared with managerial and demand-focused studies, the work showed that thermal energy optimization is a dominant technical lever.
Mtebwa & Ichwekeleza [75] evaluated energy efficiency at Tanzania Breweries Limited and identified key causes of inefficiency on the packaging equipment. From the investigation, a low boiler efficiency of 62% was observed while the expected values are within 94–95%, and a high thermal energy demand of 68% was identified. From the further findings, packaging, brewing, and utilities consumed 54.63%, 29.30%, and 15.17% of total energy, with energy productivity at 45.5 kWh/L, nearly doubled the industry minimum. While lighting efficiency was adequate, the lack of real-time monitoring and poor load factors worsened performance. The study highlighted optimizing equipment use, improving boiler efficiency, and applying management techniques to reduce energy losses.
Noah et al. [76] pinpointed energy inefficiency as a key operational cause of reduced brewery productivity, particularly losses from boilers, steam leakages, and poor feedwater quality. The authors applied quantitative energy performance indicators, where energy use was measured via Normalized Performance Indicator of 1.2 GJ/m2, energy productivity of 52.14 MJ/carton, and cost of ₦34.74/carton. Findings suggest significant optimization potential despite a “fair” efficiency rating. Compared with studies that emphasize finance, manpower, or policy, this work highlights energy management as a dominant yet often overlooked factor. This contrasts with demand driven studies, showing that internal technical inefficiencies can constrain output even when market demand exists.
Nydrioti & Grigoropoulou [77] developed a Decision Support Framework (DSF) to optimize water reuse and energy efficiency in a Greek brewery. The research identified key causes of inefficiency as excessive wastewater treatment plant energy consumption of over 40%, which is above expected, and underutilized wastewater reuse. It was also observed that advanced treatment can handle 43% of wastewater, meeting utility demand (3%) and restricted irrigation needs. This reduced the operational Water Footprint (WF) by 12% and the supply chain WF by 1%, though energy use rose by ~3–5%. The optimal DSF scenario integrated energy efficiency and water reuse, cutting Carbon Footprint (CF) by 35%, operational WF by 10%, and supply chain WF by 1%. Compared to other studies, dominant factors are energy hotspots and water management, while conflicting trade-offs exist between energy use and water footprint reduction. Variables in quantitative models include energy consumption, WF, CF, treated volume, and reuse allocation, highlighting measurable sustainability gains. Table 1 presents other reported brewery industries that have collapsed due to the highlighted factors.
Table 1. Reported Brewery Companies with Problems.
|
S/N |
Name |
Country & Year |
Primary Cause of the Collapse |
Root Cause Category (Systematic Mapping) |
Ref. |
|---|---|---|---|---|---|
|
1 |
Deeds Brewing |
Australia (2024) |
Financial difficulties, including debts and operational challenges leading to liquidation. |
Operational & Financial Distress |
[78] |
|
2 |
Black Hops Brewing |
Australia (2024) |
Insolvency due to significant debts, including tax obligations and operational costs. |
Financial & Regulatory Compliance |
[79] |
|
3 |
Fourpure Brewing |
UK (2024) |
Entered voluntary administration amid market pressures and financial challenges. |
Market Volatility & Financial |
[80] |
|
4 |
Alamo Beer Company |
USA (2025) |
Filed for Chapter 11 due to declining popularity and economic impacts from the pandemic. |
Market Shift & Macro-Economic |
[81] |
|
5 |
Magic Rock Brewery |
UK (2024) |
Announced intention to appoint administrators due to overdue financial accounts. |
Financial Management |
[82] |
|
6 |
Flying Fish Brewing |
USA (2023) |
Filed for Chapter 11 bankruptcy due to market challenges and financial difficulties. |
Market & Financial Pressures |
[83] |
|
7 |
Nigerian Breweries |
Nigeria (2024) |
Recorded a net loss of N106 billion; temporary shutdown of two plants due to economic challenges. |
Infrastructure & Asset Maintenance |
[84] |
|
8 |
SABMiller’s Juba |
S. Sudan (2016) |
Ceased production due to civil war and foreign exchange shortages. |
Macro-Environmental & Political |
[85] |
As demonstrated in Table 1, the recent wave of brewery insolvencies (2023–2026) can be systematically mapped to three core pillars: market and financial pressures, which affected 75% of the sampled cases, macro-environmental shifts, and infrastructure and asset maintenance issues. Notably, the case of Nigerian Breweries (2024) highlights a critical intersection where macro-economic distress forced the shutdown of physical assets, underscoring the vulnerability of industrial infrastructure when operational maintenance becomes financially unsustainable. These insights underscore the need for systematic, data-driven approaches to precisely identify and prioritize root causes, forming the foundation for targeted interventions in the next phase of analysis.
3.3. Data-Driven Approaches for Root Cause Identification and Solution
Production decline in breweries can be systematically analyzed using data-driven approaches that quantify and rank contributing factors. Mathematical models, such as multiple regression, provide interpretable insights and causal relationships but are limited by linearity assumptions [86]. ML model methods, particularly RF, excel at capturing non-linear interactions and ranking feature importance, making them well-suited for complex industrial processes [87]. Comparisons show regression is effective for clear, linear relationships, while ML handles complexity and interactions better, highlighting the value of hybrid approaches for comprehensive root cause identification [88]. The next section highlighted effective applications of various techniques in industrial improvements.
3.3.1. Mathematical Models
This type of industrial system optimization model is classified into several types. Linear programming (LP) models are used when the objective function and constraints are linear [89]. Commonly used in resource allocation, production planning, and cost minimization [90]. Integer (IP) and Mixed-Integer Programming (MIP) are used when decision variables are constrained to be integers, for scheduling, workforce assignment, and machine allocation [91,92]. Nonlinear Programming (NLP) is applied when the objective function or constraints are nonlinear; it is commonly used in chemical process optimization, such as energy recovery [93]. Dynamic Programming (DP) models are used to break a problem into smaller sub-problems, which are solved recursively [94]. DP models are mostly suitable for multi-stage decision-making processes [95]. Stochastic programming addresses uncertainty in parameters such as demand, supply, and energy prices and is also useful for robust decision-making under risk [96,97]. Multi objective optimization models are used to optimize multiple conflicting objectives simultaneously [98]. It can also be used to minimize production costs while maximizing energy efficiency and product quality [99]. Heuristic and Metaheuristic models are used in genetic algorithms, simulated annealing, and particle swarm optimization [100]. Applied also when traditional models are too complex or nonlinear, such as in optimizing logistics and delivery routes for beer distribution [101]. Studies had envisaged that these models can be used for industrial root cause investigation and system optimization.
Onokwai et al. [102] applied multiple regression through Response Surface Methodology (RSM) to analyze how pressure, voltage, current, vibration, and temperature affect machine faults in the beverage industry. The research achieved high predictive accuracy of R2 = 98.22% and p < 0.05 with a clear interpretability of parameter effects. The study identified maximum faults of 25 at specific parameter settings, demonstrating causality between operating conditions and fault rates. While RSM is limited by linearity assumptions, the Adaptive Neuro-Fuzzy Inference System complements it by capturing non-linear relationships and improving prediction accuracy. The integrated approach enhances equipment reliability, production optimization, and fault prevention, though broader machine learning validation is needed for industrial applications.
Kucharczyk et al. [103] used multiple regression via RSM Box–Behnken design to optimize yeast growth and viability in high-gravity lager fermentation, analyzing pitching rate, aeration, filling time, and temperature. The study showed biomass increased with higher aeration and temperature but decreased with higher pitching rates, while yeast viability declined with higher yeast dose, aeration, and filling time, with most effects statistically significant (p < 0.05). RSM provided interpretable insights and causal relationships, effectively predicting optimal conditions to enhance fermentation stability. However, the method is limited by linearity assumptions, and further optimization would require real-time AI monitoring for dynamic control.
Ugwuanyim et al. [104] applied multiple regression to analyze the effect of marketing mix elements such as product, price, promotion, and place on Nigerian Breweries Plc revenue from 2013–2022, highlighting the interpretability and causal insights of regression analysis. As shown in Figure 5 on the graph matrix of revenue and marketing mix variables, the results showed that product and promotion positively influence revenue, price negatively affects it, and optimal profit contributions. I was also observed in product, price, promotion, and place having improved values of 99.80%, 0.09%, 0.06% and 0.05% respectively.
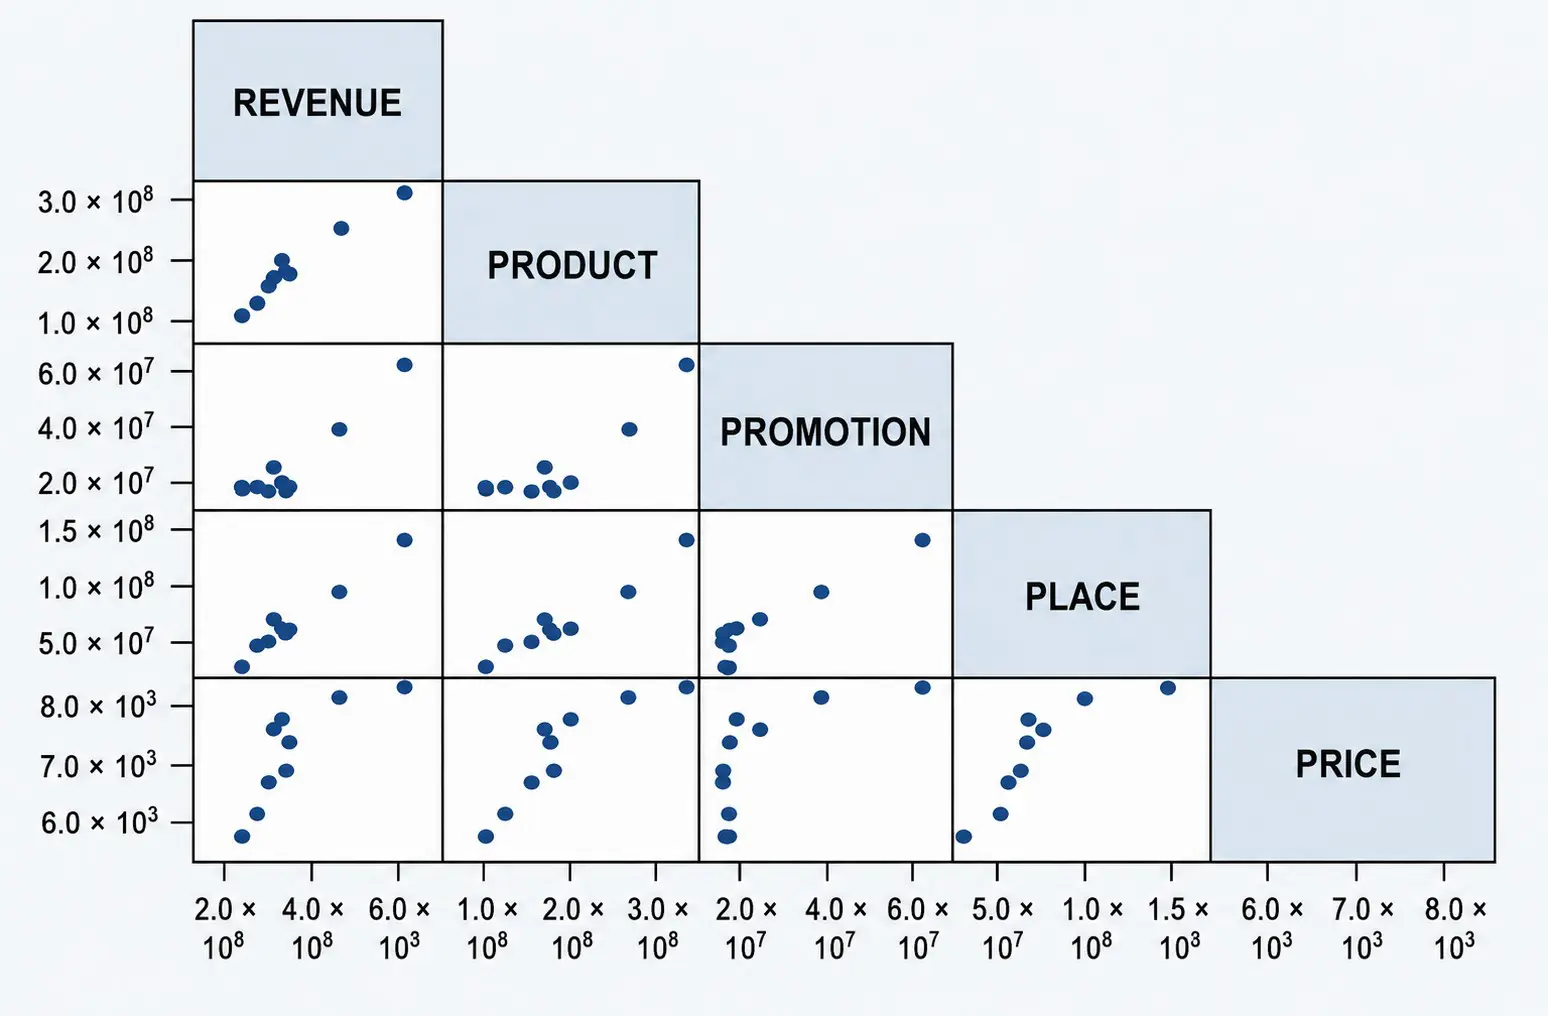
While regression clarified relationships, its linearity assumptions limit capturing complex interactions. The study emphasized aligning production, promotion, and pricing with distribution capacity to maximize revenue and profitability. Also, mathematical models are widely used in manufacturing analysis to quantify the relationship between production output and key operational variables [105]. Their main strength lies in high interpretability and the ability to infer causal effects, making them suitable for process understanding and policy decisions [106]. However, their reliance on linearity and predefined functional forms limits performance when system behaviour is complex or highly interactive [107].
3.3.2. Applied ML Models
ML models, particularly RF, are increasingly adopted in industrial analysis due to their robustness, accuracy, and ability to handle large multivariate datasets [108]. RF effectively captures non-linear relationships and interactions among variables while providing feature importance rankings for decision support [109]. Despite lower interpretability than regression, its predictive strength makes it superior for complex production systems [110]. Researchers applied these models for manufacturing and service rendering industries to investigation root cause problems for system improvement.
Tabassum et al. [111] applied multiple ML models to predict beer sensory panel outcomes using 48 process and flavour variables. Comparative results showed that RF consistently outperformed other models across key classification metrics, making it the most reliable predictor of sensory attributes. Feature importance analysis further identified dominant flavour and conditioning factors influencing sensory responses. The findings demonstrate that ML-based models, particularly RF, can effectively replace costly sensory panels while improving decision speed and consistency in brewing quality assessment.
Sáenz-Navajas et al. [112] compared bagging and boosting ML models to predict red wine mouthfeel from chemical measurements. RF and XGBoost significantly outperformed classical PLS regression, achieving over 80% validated prediction accuracy across all chemical datasets. Figure 6 presents the averaged absorbance spectra of the four wine categories (drying, full body, velvety, and gummy) varying in variety and origin for identified according to RF and XGBoost.
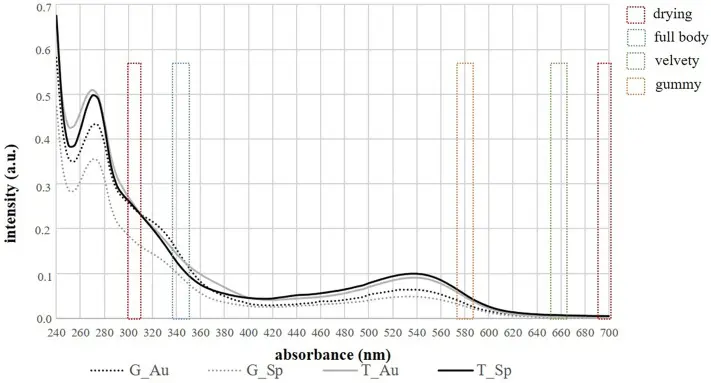
While XGBoost showed slightly higher predictive performance, RF offered comparable accuracy with lower computational cost. The results highlight the superiority of ensemble ML models for sensory prediction in complex beverage systems.
Cheng et al. [113] combined chemical analysis and ML models to evaluate flavour characteristics of Baijiu produced from mixed sorghum and kiwifruit residue fermentation. Results showed the mixed fermentation sample (XQ-G) had comparable total acid content to conventional Baijiu but significantly higher VOC levels, with 26 key compounds (VIP > 1) driving flavour differences. Among the tested ML classification models, the best-performing model accurately distinguished XQ-G from other samples, demonstrating superior predictive performance over traditional sensory analysis alone. The findings confirm that ML-enhanced evaluation improves flavour discrimination and supports efficient utilization of fermentation residues.
Chen [114] compared five ensemble machine learning models (RF, Gradient Boosting, XGBoost, LightGBM, and CatBoost) for wine quality prediction using the Vinho Verde red (1599 instances) and white (4898 instances) datasets. The reported accuracy values in Figure 7 were obtained using a leakage-free experimental workflow consisting of an 80:20 stratified train–test split, followed by five-fold StratifiedGroupKFold cross-validation within the training set. Data preprocessing included per-fold standardization, SMOTE-Tomek resampling to address class imbalance, and inverse-frequency cost weighting. Hyperparameters were optimized using Optuna with 120–200 trials per model, and final performance was evaluated on an untouched test set. The primary performance metric reported was weighted F1-score, which accounts for class imbalance in multi-class classification.
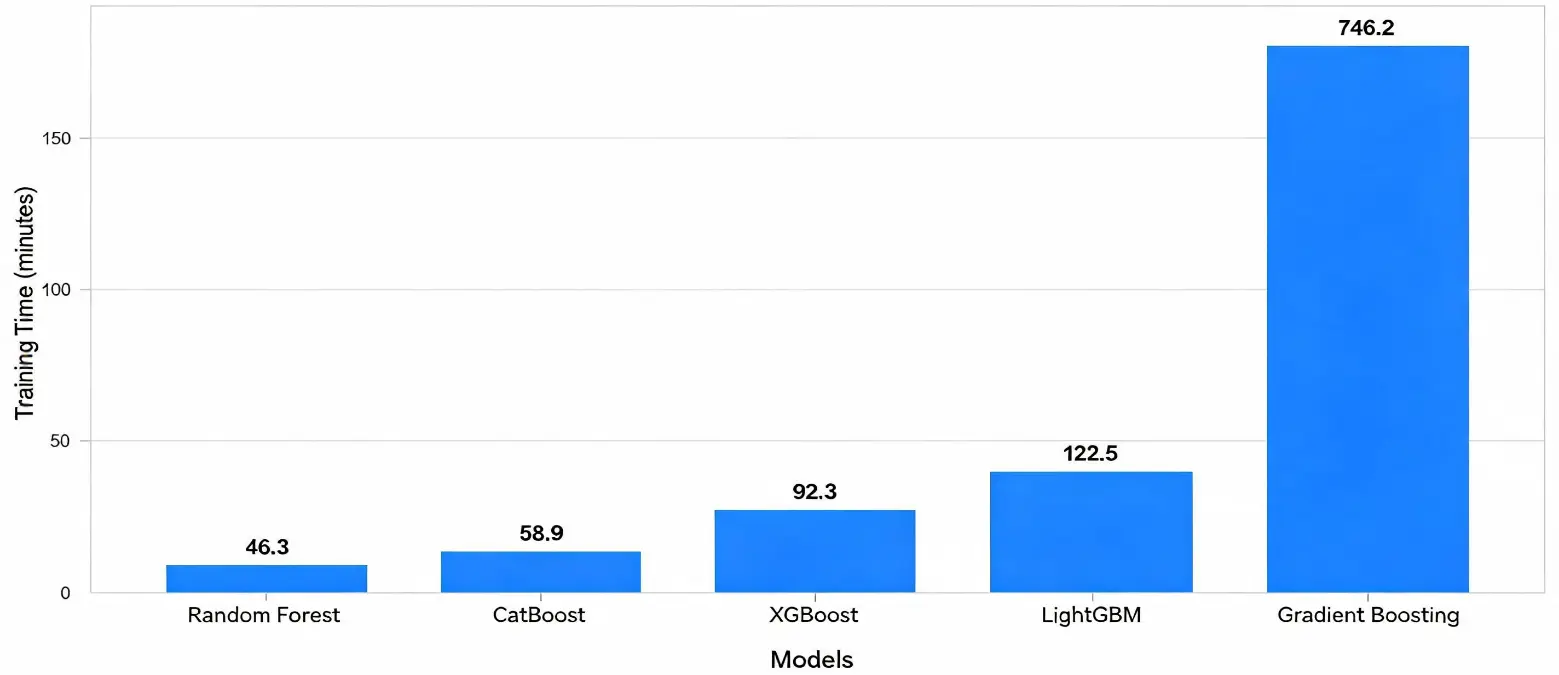
As presented in Figure 7, Gradient Boosting achieved the highest predictive performance (weighted F1 = 0.693 ± 0.028 for red wine and 0.664 ± 0.016 for white wine), with RF and XGBoost performing within three percentage points. Feature reduction to the top five ranked variables reduced dimensionality by 55% while causing only minor performance losses (2.6 percentage points for red and 3.0 percentage points for white), indicating strong predictive efficiency. Runtime profiling further showed that RF was the most computationally efficient (<50 min), whereas Gradient Boosting achieved the highest accuracy but required significantly longer training time (approximately 12 h). These results highlight the methodological rigor behind the reported accuracy values and clearly demonstrate the trade-off between predictive accuracy and computational efficiency in beverage quality prediction models.
Nettesheim et al. [115] systematically analyzed 21 studies on ML, including RF applications in the brewing process, classifying them by process stage, improvement area, task, and algorithm. Comparative analysis showed that artificial neural networks and support vector machines were more frequently applied than other models, while overall ML adoption in brewing lags behind broader industrial trends. Reported performances indicate limited benchmarking across models, with few studies comparing predictive accuracy or efficiency. The review also highlighted a major research gap in linking brewing recipes to desired chemical properties, underscoring the need for more performance driven ML evaluations in brewery operations.
3.3.3. Hybrid (Mathematical and ML Model) Optimization Approaches
Regression models are preferable when relationships are simple, data is limited, and causal interpretation is required [116]. Whereas ML models perform better under non-linear, data-rich conditions and high-dimensional [117]. The contrasting strengths reveal that neither approach is universally optimal. Consequently, hybrid frameworks that combine interpretability from regression and predictive power from ML offer a more comprehensive strategy for root cause identification in industrial production systems [118]. Researchers applied these models to industrial manufacturing and service providers to investigate root-cause problems and improve systems.
Khan et al. [119] applied traditional and ML models, including ensembles, deep neural networks, and transfer learning to predict wine quality on 6497 samples with class balancing and engineered features. Ensemble methods, particularly RF, outperformed others, achieving up to 95% accuracy and 0.994 AUC, while Voting and Stacking models delivered consistent results across tests. SHAP analysis highlighted alcohol, sulfur dioxide, and volatile acidity as key predictors. Transfer learning improved convergence speed but with slightly lower accuracy. Overall, the work compares reported performances and demonstrates effective, scalable approaches for modern viticulture quality assessment.
Santos et al. [120] used predictive and RF modes to optimize Overall Equipment Effectiveness (OEE) in the beverage industry. Integrating an ML model (RF) with predictive regression improved OEE from 44.4% to over 50%, reducing downtime and efficiency losses. The study reported the performance of traditional quality methods versus ML-enhanced approaches, showing superior predictive and operational outcomes. However, the study gap included variable accuracy across product lines and single site data. The work demonstrated the effectiveness of combining ML with conventional process optimization to improve beverage production.
Kulina et al. [121] analyzed key market factors affecting beer sales of a leading Bulgarian brand using PCA and ensemble ML with Classification and Regression Trees (CART). The two models based on different time periods are compared, achieving over 96% R2 and under 7% MAPE. The analysis identifies the most influential factors, including price, distribution, and advertising, and predicts sales two months ahead. Reported performances of ML models are compared to highlight accuracy and reliability. Overall, the work demonstrates how ML outperforms traditional approaches in forecasting competitive beer sales.
Ma et al. [122] compared statistical and ML forecasting approaches for beverage demand across different Stock Keeping Unit (SKU) demand patterns. Statistical models (ARIMA, exponential smoothing, Croston) perform well for stable, high-volume items, while ML and deep learning models (XGBoost, TiDE, N-BEATS) show superior accuracy for erratic, intermittent, and lumpy demand. By clustering SKUs, the authors demonstrate that no single model dominates across all cases. Reported performance highlights the strengths of ML in handling complex, non-linear patterns, while traditional models excel in structured demand scenarios. The work supports a hybrid, context-driven forecasting strategy rather than a one-size-fits-all approach.
Saetae [123] evaluated classical mathematical models and ML Long Short-Term Memory (LSTM) approaches for predicting microbial growth and acidification in yogurt fermentation. Hybrid LSTM models outperformed traditional growth models at 37 °C and 41 °C, while the Gompertz model performed best at 45 °C. For pH prediction, support vector regression consistently outperformed classical and ensemble models under all conditions. Reported performances show Root Mean Square Error (RMSE) reductions of up to 86% compared to conventional models. The results highlight the superior adaptability of ML models, with classical models remaining effective under specific process conditions.
The comparison between mathematical, statistical, and ML models showed that while classical models offer transparency and stability, ML approaches provided adaptability in complex, superior accuracy and data-rich manufacturing systems [124]. These predictive strengths naturally extend beyond forecasting into decision-oriented applications [125,126]. Consequently, the next section focuses on optimization and what-if scenario analysis as tools for translating model outputs into actionable improvements.
3.3.4. What-If Scenario Analysis for Output Improvement
This technique is a data-driven simulation technique used in manufacturing to evaluate hypothetical changes and their impact on key performance outcomes, enabling managers to test “what would happen if…” before implementation [127]. It supports informed decision-making by revealing risks and opportunities under different operational conditions [128]. It is also used to observe if the applied model optimizes maintenance, scheduling levers, and resource allocation [129]. By integrating real-time data, scenario testing enhances predictive planning and operational agility [130]. In breweries and beverage production, such optimization drives efficiency, reduces downtime, and improves overall output performance through smarter production strategies [131]. Recent studies demonstrate this technique for optimizing brewery production efficiency.
Gathani et al. [132] reviewed 141 publications to examine how what-if scenario analysis is used to evaluate hypothetical changes and their practical impacts across domains. The authors show that scenario and sensitivity analyses help decision-makers understand input/output relationships and test improvement pathways before implementation. They propose the Praxa framework to standardize how what-if analysis supports planning and output improvement. Practical outcomes include clearer decision logic, more consistent scenario testing, and improved communication of results. The work strengthens the use of what-if analysis as a decision-support tool rather than an algorithmic exercise.
Saretzky et al. [133] applied what-if scenario analysis to prescriptive maintenance by simulating potential interventions and measuring their impact on production KPIs such as OEE. Unlike conventional predictive models, the approach identifies root causes and ranks maintenance actions based on their quantified operational benefits. Results show lower prediction error for intervention effects, with mean Precision of Heterogeneous Effects (PEHE) reduced to 0.696 compared to 0.852 for baseline ML models. Figure 8 presents the performance of the applied models.
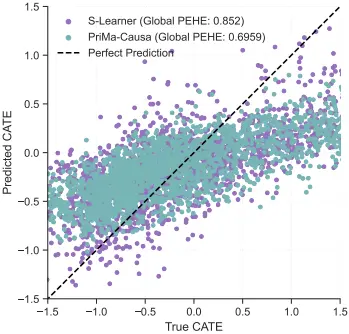
Figure 8. Global evaluation of Conditional Average Treatment Effect (CATE) estimation performance of the study. Sourced from Saretzky et al. [133] available via DOI:10.48550/arXiv.2512.00969 under the terms and conditions of the Creative Commons Attribution-NonCommercial-NoDerivatives 4.0 International License (CC BY-NC-ND 4.0).
In practice, the research, if applied, will enable managers to test maintenance decisions before implementation and select the most effective actions. The framework supports reduced downtime, improved equipment effectiveness, and more reliable output improvement decisions.
Enebechi [134] applied what-if scenario analysis to test the impact of introducing ML driven control on brewery production capacity. Practical evaluation showed reductions in inefficient process control from 20% to 17.34% and shorter fermentation and maturation losses from 10% to 8.7%. Scenario comparison between conventional and ML assisted operations indicated a production capacity increase from 50,000 to about 65,000 bottles. The results demonstrate a 33% improvement in output when ML based optimization is adopted. The study highlights how scenario testing supports informed decisions for capacity improvement in brewery operations.
Pekarcikova et al. [135] utilized what-if scenario analysis to beverage production planning by comparing Master Production Schedules (MPS) under finite and infinite capacity assumptions. Practical evaluation using real production data shows how different capacity scenarios directly affect inventory levels and production feasibility. The results highlight that finite-capacity MPS provides more realistic schedules and reduces inventory imbalance compared to infinite-capacity planning. The work demonstrates how scenario-based production scheduling supports better operational decisions. Also, the outcome showed that effective MPS what-if analysis can improve output planning and inventory control in beverage manufacturing.
Li et al. [136] used what-if scenario analysis through coupled simulations to evaluate how temperature and flow conditions affect beer fermentation performance. Validation at lab and industrial scales showed high prediction accuracy, with R2 up to 0.99 for alcohol and 0.96 for sugar content, closely matching real production trends. Scenario results revealed a critical 3 °C temperature overshoot at 48 h in large fermenters, causing uneven convection and quality risks. The findings provide practical guidance for adjusting cooling strategies and fermenter design. The work demonstrates how scenario-based simulation supports output improvement, process stability, and consistent beer quality.
The reviewed studies demonstrate that what-if scenario analysis effectively supports output improvement by enabling informed decisions on scheduling, resource allocation ad maintenance. However, most existing works remain case-specific, rely on limited datasets, and lack integration across multi-process and multi-site operations [137]. These limitations highlight unresolved challenges in real-time implementation, generalizability, and holistic system optimization [138]. The next section therefore, identifies key research gaps and outlines future research directions to advance scalable, data-driven optimization frameworks in production and brewery systems.
4. Research Gaps and Future Research Directions
Despite growing adoption of data analytics in manufacturing, significant gaps remain in translating predictive insights into robust, decision-oriented optimization for brewery operations [139]. Existing studies are often fragmented with limited integration of root cause analysis, ML, what-if optimization, and weak empirical validation. Brewery specific evidence from developing economies remains scarce, restricting contextual generalizability and relevance [140]. This section, therefore, articulates key research gaps that clarify the novel contributions of the present study and justify a data-rich case for advancing practical, validated decision-support frameworks.
4.1. Lack of Integrated Root Cause Analysis and ML Optimization Frameworks
Most existing studies applied either root cause analysis, ML, or optimization in isolation, limiting their decision-making value. Future research should develop unified frameworks that link fault diagnosis, predictive modelling, and what-if optimization into a single operational workflow for production improvement [141].
4.2. Limited Brewery Specific Studies in Developing Economies
Current literature is dominated by case studies from developed economies. They overlooked context-specific challenges such as power instability, workforce constraints, and raw material variability [142]. Future work should focus on breweries in developing regions to produce more transferable and policy-relevant insights [143].
4.3. Weak Validation Rigor and Reliance on Single-Case Evidence
Many studies lack robust validation using long-term operational data, cross-period testing, or benchmark comparisons [144]. Future research should emphasize stronger empirical validation, multi-metric performance assessment, and sensitivity analysis to improve credibility and industrial adoption [145,146].
4.4. Underutilization of What-If Scenario Analysis for Decision Support
Although predictive accuracy is widely reported, however, fewer studies translate predictions into actionable what-if scenarios for managers. Future research should prioritize scenario-based evaluation of maintenance, scheduling, and resource decisions to directly support output optimization [147,148].
4.5. Limited Linkage Between Analytical Results and Managerial Implementation
Existing work often stops at technical results, without demonstrating how insights guide real operational changes. Future studies should explicitly connect data-driven findings to managerial actions, performance gains, and scalable pathways for optimizing implementation [149,150].
5. Conclusions
This review has systematically examined the causes of production collapse in brewery operations and the analytical approaches used to understand, predict, and improve output performance. Evidence from the literature shows that production decline is rarely driven by a single factor. Rather by technical, operational, managerial, external constraints, equipment downtime, inefficient maintenance practices, supply chain disruptions, energy instability, and weak planning systems. The comparison between mathematical and ML models highlights that while traditional models offer transparency and process understanding. While ML approaches provide superior predictive accuracy and adaptability in complex data-rich brewery environments. Importantly, the review demonstrates that predictive capability alone is insufficient for operational improvement unless translated into decision-oriented tools.
What-if scenario analysis serves as a critical bridge between prediction and action, enabling managers to test maintenance strategies, resource allocation, and production schedules before implementation. Empirical evidence indicates that scenario-based decision support can significantly improve output, reduce downtime, and enhance operational efficiency. However, the review also reveals persistent gaps that can develop a linkage between analytical insights and managerial decision-making.
Overall, this review consolidates dispersed findings into a coherent knowledge base and underscores the need for integrated root cause analysis, ML, and simulation frameworks. By identifying these gaps and opportunities, the study provided a strong foundation for future research and practical interventions. Aimed at restoring productivity, strengthening resilience, and achieving sustainable performance improvement in brewery operations.
Statement of the Use of Generative AI and AI-Assisted Technologies in the Writing Process
Large Language Model (ChatGPT, OpenAI) was used solely for language editing, grammar improvement, and clarity enhancement. All scientific content, analysis, results, and conclusions were developed and verified by the authors.
Author Contributions
This work was carried out in collaboration between all authors. Author C.M.O. and D.A.E. did the Conceptualization and Methodology. B.E.O. and V.U.O. wrote the protocol, and wrote the first draft of the manuscript. Author O.O.O., C.M.O. and B.E.O. managed the literature searches. All authors read and approved the final manuscript.
Ethics Statement
Not Applicable. No Animal or Human was used in the Study.
Informed Consent Statement
Informed consent was obtained from all individuals included in this study. All authors consent to the publication of this manuscript. The manuscript is original, has not been published previously, and is not under consideration for publication elsewhere.
Data Availability Statement
Not Applicable.
Funding
This research received no external funding.
Declaration of Competing Interest
The authors declare that they have no known competing financial interests or personal relationships that could have appeared to influence the work reported in this paper.
References
-
Agraprana AA, Donoriyanto DS. Optimization of production process by applying Theory of Constraint (TOC) at CV. Wijaya Mandiri Label. IJIEM—Indones. J. Ind. Eng. Manag. 2024, 5, 192. DOI:10.22441/ijiem.v5i1.22515 [Google Scholar]
-
David CE, Uche R, Nwufo O, Ekpechi DA, Kingsley CC. Integrating machine availability and preventive maintenance to improve productive efficiency in a manufacturing industry. Asian J. Curr. Res. 2024, 9, 91–109. DOI:10.56557/AJOCR/2024/v9i28610 [Google Scholar]
-
Nigerian Breweries Plc. Q2 2025: Nigerian Breweries Plc Records N733.19 Billion Revenue. 2025. Available online: https://www.nbplc.com/q2-2025-nigerian-breweries-plc-records-n733-19-billion-revenue (accessed on 19 December 2025).
-
Premium Times Nigeria. 2024: Nigerian Breweries Plc Crosses the Trillion Naira Mark in Revenue. 2024. Available online: https://www.premiumtimesng.com/promoted/774433-2024-nigerian-breweries-plc-crosses-the-trillion-naira-mark-in-revenue.html (accessed on 19 December 2025).
-
Food Business Africa. Brewing Majors & Craft Brewers Battle for a Share of the World’s Last Frontier Market for Beer. Available online https://www.theafricareport.com/415775/nigerian-breweries-vows-to-fight-for-market-share-as-tolaram-fuels-guinness-rivalry/ (accessed on 19 December 2025). [Google Scholar]
-
Mordor Intelligence. Europe Beer Market—Growth, Trends, and Forecast (2025–2030). Available online: https://www.mordorintelligence.com/industry-reports/europe-beer-market (accessed on 19 December 2025).
-
Ezeaku NI, Uzorh AC, Obiukwu OO, Godwin SI, Ekpechi DA. Quantitative models for supply chain risk analysis in water tank manufacturing: A case study of a factory in Aba, Nigeria. Asian J. Curr. Res. 2024, 9, 1–12. DOI:10.56557/AJOCR/2024/v9i18483 [Google Scholar]
-
El Hammoumi Z, Tebr D, Charkaoui Y, Satauri I, El Beqqali O. Predictive Maintenance Approaches: A Systematic Literature Review. Eng. Proc. 2025, 112, 70. DOI:10.3390/engproc2025112070 [Google Scholar]
-
Shamsuddoha M, Khan EA, Chowdhury MMH, Nasir T. Revolutionizing Supply Chains: Unleashing the Power of AI-Driven Intelligent Automation and Real-Time Information Flow. Information 2025, 16, 26. DOI:10.3390/info16010026 [Google Scholar]
-
Yang Y, Wang H. Random Forest-Based Machine Failure Prediction: A Performance Comparison. Appl. Sci. 2025, 15, 8841. DOI:10.3390/app15168841 [Google Scholar]
-
Bubeník P, Rakyta M, Buzalka M, Biňasová V, Kovaríková Z. Optimization of Business Processes Using Artificial Intelligence. Electronics 2025, 14, 2105. DOI:10.3390/electronics14112105 [Google Scholar]
-
Ndukwe DC, Obiukwu OO, Njoku DO, Ekpechi DA. Screw production optimization using artificial neural network (ANN) technology. Asian J. Curr. Res. 2023, 8, 82–95. DOI:10.56557/AJOCR/2023/v8i48447 [Google Scholar]
-
Page MJ, McKenzie JE, Bossuyt PM, Boutron I, Hoffmann TC, Mulrow CD, et al. The PRISMA 2020 statement: An updated guideline for reporting systematic reviews. Int. J. Surg. 2021, 88, 105906. DOI:10.1016/j.ijsu.2021.105906 [Google Scholar]
-
Ooyama S, Seo Y, Maesako K. Assessing Sustainability Trade-Offs in Craft Beer Production Through Life Cycle and Costing Analysis Scenarios. Sustainability 2025, 17, 11003. DOI:10.3390/su172411003 [Google Scholar]
-
Carvalho G, Leite AC, Leal R, Pereira R. The Role of Emergent Processing Technologies in Beer Production. Beverages 2023, 9, 7. DOI:10.3390/beverages9010007 [Google Scholar]
-
Duru KB, Uche R, Obiukwu OO, Ekpechi DA, Chukwuemeka KC. Minimization of root causes of declining productivity in a manufacturing company: A case study of Jocalis Company. Int. J. Adv. Multidiscip. Res. Stud. 2024, 4, 1095–1104. DOI:10.62225/2583049X.2024.4.1.2346 [Google Scholar]
-
Aniuga C, Ogba I-E. Product innovation and customer satisfaction in Nigeria brewery industry: A study of customers of Star Lager Beer by Nigerian Breweries Plc. in Southeast, Nigeria. Afr. Sci. J. 2021, 3, 43. DOI:10.5281/zenodo.5648324 [Google Scholar]
-
Voicu-Dorobanțu R. Crisis-Proofing the Fresh: A Multi-Risk Management Approach for Sustainable Produce Trade Flows. Sustainability 2025, 17, 4466. DOI:10.3390/su17104466 [Google Scholar]
-
Ukey K, Chinta L, Majumder H, Patil DS, Mitkari S, Sahu AR, et al. Implementation of the Theory of Constraints (TOC) for a Furniture Manufacturing-Based Organization. Eng. Proc. 2025, 114, 17. DOI:10.3390/engproc2025114017 [Google Scholar]
-
Tang J, Dai Z, Jiang W, Wu X, Zhuravkov MA, Xue Z, et al. A Comprehensive Review of Theories, Methods, and Techniques for Bottleneck Identification and Management in Manufacturing Systems. Appl. Sci. 2024, 14, 7712. DOI:10.3390/app14177712 [Google Scholar]
-
Ota OU, Obiukwu OO, Okafor BE, Ekpechi DA. Lean optimization of batch production in an aluminium company. Asian J. Curr. Res. 2023, 8, 62–81. DOI:10.56557/AJOCR/2023/v8i48445 [Google Scholar]
-
Campilho RDSG, Barbosa FB. Innovations in Manufacturing Processes and Systems for Sustainable Practices. Processes 2025, 13, 2315. DOI:10.3390/pr13072315 [Google Scholar]
-
Salazar TMB, San Martín-González MF, Velasquez Domingo JA, Huang J-Y. Life Cycle Assessment of Craft Beer Brewing at Different Scales on a Unit Operation Basis. Sustainability 2023, 15, 11416. DOI:10.3390/su151411416 [Google Scholar]
-
Cerna-Arribasplata JA, Rivas-Atauchi AM, Tupia-De-La-Cruz EL. Lean-TPM production model for efficiency and quality enhancement in the brewing industry: Insights from a Peruvian case study. Int. J. Recent Eng. Sci. 2025, 12, 23–32. DOI:10.14445/23497157/IJRES-V12I1P104 [Google Scholar]
-
Dumbuya IB, Koroma MJ, Conteh ZB. Enhancing productivity and efficiency in the workplace through the 5S methodology: A strategic approach to operational excellence at Sierra Leone Brewery Limited. Int. J. Res. Commer. Manag. Stud. 2025, 7, 46–61. DOI:10.38193/IJRCMS.2025.7104 [Google Scholar]
-
Escárcega Zepeda PA, Hernández Navarro PR, Mondragón Chavero LA, Duque Sevilla RM, Corral Nuñez MdC, López Badilla G, et al. Using DMAIC methodology and Lean Manufacturing tools in the brewing industry in Northwest Mexico to increase delivery times and sales. Partn. Univers. Innov. Res. Publ. 2024, 2, 77–85. DOI:10.5281/zenodo.13974816 [Google Scholar]
-
Howard DA, Ma ZG, Engvang JA, Hagenau M, Jorgensen KL, Fausing Olesen J, et al. Energy flexibility potential in the brewery sector: A multi-agent based simulation of 239 Danish breweries. In Proceedings of the 2022 IEEE PES 14th Asia-Pacific Power and Energy Engineering Conference (APPEEC), Melbourne, Australia, 20–23 November 2022. DOI:10.1109/APPEEC53445.2022.10072200 [Google Scholar]
-
Wood G, Martin D. Regulation and restructuring in the craft brewing industry. Growth Change 2025, 56, e70023. DOI:10.1111/grow.70023 [Google Scholar]
-
Xie J, Chen Y, Yin R, Yuan X, Guo L, Zhao D, et al. Unveiling Disparities in Beer Consumer Behavior and Key Drivers Across Regions in China. Foods 2025, 14, 3799. DOI:10.3390/foods14213799 [Google Scholar]
-
Alo EA, Lugard E. Inventory management practices and performance of brewery manufacturing firms in south-west, Nigeria. Adeleke Univ. J. Bus. Soc. Sci. 2024, 4, 162–175. Available online: https://aujbss.adelekeuniversity.edu.ng/index.php/aujbss/article/view/86 (accessed on 24 December 2025)
-
Otuagoma S, Obuseh E, Akpovi O, Okpare A, Eyenubo J, Roland T. Assessment of Conveyor Telemetry System in a Manufacturing Firm: A Case Study of a Brewery in Eastern Nigeria. NIPES—J. Sci. Technol. Res. 2025, 7, 44–58. DOI:10.37933/nipes/7.2.2025.3 [Google Scholar]
-
Terradillos E, Matias J, Navas HVG, Costa O, Mendes D. A Conceptual Lean–Sustainability Model for Industrial SMEs. Sustainability 2026, 18, 3826. Doi:10.3390/su18083826 [Google Scholar]
-
Onyema CE, Obiukwu OO, Osueke GO. Reduction of machine breakdown in the brewery manufacturing company: A case study of Brewery “A” in Eastern Nigeria. Asian J. Appl. Sci. Technol. (AJAST) 2023, 7, 65–74. DOI:10.38177/ajast.2023.7307 [Google Scholar]
-
Paprocka I. Evaluation of the Effects of a Machine Failure on the Robustness of a Job Shop System Proactive Approaches. Sustainability 2019, 11, 65. DOI:10.3390/su11010065 [Google Scholar]
-
Mohamed A, Ben J, Muduli K. Implementation of Autonomous Maintenance and its Effect on MTBF, MTTR, and Reliability of a Critical Machine in a Beer Processing Plant. Int. J. Pareto Stud. Allied Sci. Technol. 2022. Available online: https://www.researchgate.net/publication/359061752 (accessed on 24 January 2026)
-
Inyiama GK, Oke SA. Maintenance downtime evaluation in a process bottling plant. Int. J. Qual. Reliab. Manag. 2021, 38, 229–248. DOI:10.1108/IJQRM-12-2018-0340 [Google Scholar]
-
Martínez Monseco FJ, Gómez Lázaro E, Martín Martínez S. Implementation of the RCM Methodology as a Technical Analysis for Maintenance and Innovation for Hydroelectric Power Plants. Energies 2026, 19, 1394. DOI:10.3390/en19061394 [Google Scholar]
-
Ezeaku NI, Ekpechi DA, Chiabuotu CC, Nwankwo EI, Olum RI, Jerome FN. Application of Quantitative Models for Enhancing Supply Chain Efficiency and Mitigating Risks in Water Tank Manufacturing Industry of Nigeria. Eng. Sci. Technol. 2024, 389–404. DOI:10.37256/est.5220244554 [Google Scholar]
-
Drljača M, Petar S, Brannan GD, Štimac I. Quality Models for Preventing the Impact of Supply Chain Disruptions in Future Crises. Sustainability 2025, 17, 3293. DOI:10.3390/su17083293 [Google Scholar]
-
Nettesheim PM, Burggräf P, Steinberg F. Enhancing brewery logistics with smart kegs: A simulation study. J. Transp. Supply Chain. Manag. 2024, 18, 1073. DOI:10.4102/JTSCM.v18i0.1073 [Google Scholar]
-
Duarte Soliani R, Tiradentes Terra Argoud AR, Santiago F, Batista de Camargo Junior J, Gomes de Freitas C, Pedroza Lobão MS. Impacts of collaborative logistics: A Brazilian brewing sector case study. Int. J. Ind. Eng. Manag. 2022, 13, 99–109. DOI:10.24867/IJIEM-2022-2-304 [Google Scholar]
-
Wolmarans I, Niemann W. Internal supply chain integration during disruption recovery: A case study in the South African liquor industry. Acta Commer. 2023, 23, 16. DOI:10.4102/ac.v23i1.1150 [Google Scholar]
-
Hinkosa Dinsa J. Effect of supply chain management practice on operational performance in the case of Bedele Brewery Share Company. J. Bus. Econ. Dev. 2023, 8, 94–107. DOI:10.11648/j.jbed.20230803.13 [Google Scholar]
-
Arimany-Serrat N, Sgorla AF. Financial and ESG Analysis of the Beer Sector Pre- and Post-COVID-19 in Italy and Spain. Sustainability 2024, 16, 7412. DOI:10.3390/su16177412 [Google Scholar]
-
Arimany Serrat N, Sgorla AF. Analysis of the Financial and Non-Financial Indicators of the Beer Sector: Italy and Spain. 2024, preprints. DOI:10.20944/preprints202404.1886.v1 [Google Scholar]
-
Korálová E, Taušl Procházková P. Sustainable finance and carbon neutrality in the brewery industry: Challenges and opportunities. ACC J. 2025, 31, 43–58. DOI:10.2478/acc-2025-0009 [Google Scholar]
-
Chuku U, Uche OJ, LongJohn TB. Management Accounting Strategies and Financial Performance of Listed Brewery and Food Product Manufacturing Companies in Nigeria. Repos. Antis Publ. 2022, 694021. Available online: https://www.neliti.com/publications/694021/management-accounting-strategies-and-financial-performance-of-listed-brewery-and (accessed on 12 February 2026).
-
Obembe OJ, Jacob MS, Edheku OJ. Corporate Social Responsibility Accounting and Financial Performance of Breweries in Nigeria. Eur. J. Account. Audit. Financ. Res. 2022, 10, 58–70. Available online: https://eajournals.org/wp-content/uploads/Corporate-Social-Responsibility-Accounting-and-Financial.pdf (accessed on 12 February 2026).
-
Agbata AE, Osingor AS, Ezeala G. Effect of financial ratios on firm performance: Study of selected brewery firms in Nigeria. Int. J. Trend Sci. Res. Dev. (IJTSRD) 2021, 5, 1664–1671. Available online: https://www.researchgate.net/profile/George-Ezeala/publication/355070875_Effect_of_Financial_Ratios_on_Firm_Performance_Study_of_Selected_Brewery_Firms_in_Nigeria_of_the_Creative_Commons_Attribution_License_CC_BY_40/links/615c4c9f5a481543a87ff2c5/Effect-of-Financial-Ratios-on-Firm-Performance-Study-of-Selected-Brewery-Firms-in-Nigeria-of-the-Creative-Commons-Attribution-License-CC-BY-40.pdf (accessed on 12 February 2026).
-
Banabo KC, Aganaba D. The impact of capital structure and financial effectiveness listed brewery firms in Nigeria. BW Acad. J. 2024, 105–127. Available online: https://bwjournal.org/index.php/bsjournal/article/view/1984 (accessed on 12 February 2026).
-
Török Á, Szerletics Á, Jantyik L. Factors Influencing Competitiveness in the Global Beer Trade. Sustainability 2020, 12, 5957. DOI:10.3390/su12155957 [Google Scholar]
-
Williams A. Exploring the impact of legislation on the development of craft beer. Beverages 2017, 3, 18. DOI:10.3390/beverages3020018 [Google Scholar]
-
Kalak T. Sustainable Utilization of Brewer’s Spent Grains for Energy Production: Technologies, Challenges, and Development Prospects. Energies 2026, 19, 1828. Doi:10.3390/En19081828 [Google Scholar]
-
Dumbili EW. The Politics of Alcohol Policy in Nigeria: A Critical Analysis of How and Why Brewers Use Strategic Ambiguity to Supplant Policy Initiatives. J. Asian Afr. Stud. 2014, 49, 473–487. DOI:10.1177/0021909613490137 [Google Scholar]
-
Odo YE, Nnamani E, Uzoamaka E. Environment and Organizational Growth of Brewery Industry in Nigeria. Adv. J. Bus. Entrep. Dev. 2023, 7. Available online: https://aspjournals.net/ajbed/index.php/ajbed/article/view/44 (accessed on 12 February 2026).
-
Okafor CN, Udejinta NB, Obi-Anike HO. Impact of Economic Environment on the Performance of Nigeria Breweries Industry. Eur. J. Bus. Soc. Sci. 2017, 5, 63–80. Available online: https://europub.co.uk/articles/-A-10863 (accessed on 12 February 2026).
-
Egwu O. The Impact of Government Regulatory Policies on the Performance of Business Organization (A Study of Nigerian Breweries, Aba): Egwu, Progress O. 2023. Available online: https://repository.mouau.edu.ng/work/view/the-impact-of-government-regulatory-policies-on-the-performance-of-business-organization-a-study-of-nigerian-breweries-aba-egwu-progress-o-7-2 (accessed on 12 January 2026).
-
Poelmans E, Dove JA, Taylor JE. The politics of beer: Analysis of the congressional votes on the beer bill of 1933. Public Choice 2018, 174, 81–106. DOI:10.1007/s11127-017-0493-1 [Google Scholar]
-
Hawkins B, Durrance-Bagale A, Walls H. Co-regulation and alcohol industry political strategy: A case study of the Public Health England–Drinkaware Drink Free Days campaign. Soc. Sci. Med. 2021, 285, 114175. DOI:10.1016/j.socscimed.2021.114175 [Google Scholar]
-
Ji X, Hettiarachchige RO, Littman ALE, Lavery NL, Piovesan D. Prevent Workers from Injuries in the Brewing Company via Using Digital Human Modelling Technology. Appl. Sci. 2023, 13, 3593. DOI:10.3390/app13063593 [Google Scholar]
-
Šipilova V, Aleksejeva L, Homutiņins A. Decline in Labor Force and the Affecting Factors: Insights from System Dynamics, PEST, and SWOT Analysis in Latvia. Soc. Sci. 2025, 14, 718. DOI:10.3390/socsci14120718 [Google Scholar]
-
Osisioma EH, Audu YP. Performance management practices and productivity of employees of Nigeria Brewery and Guinness Plc in South-West Nigeria. Int. J. Public Adm. Manag. Res. 2022, 7, 28–45 https://www.researchgate.net/profile/Ekpechi-Daniel?ev=hdr_xprf (accessed on 17 March 2026). [Google Scholar]
-
Akpan AU. The Effect of Unethical Recruitment Practices on Labour Turnover: A Case Study of Brewery Industry in South West Nigeria. AKSU J. Adm. Corp. Gov. (AKSUJACOG) 2021, 1, 149–157. Available online: https://aksujacog.org.ng/articles/21/12/the-effect-of-unethical-recruitment-practices-on-labour-turnover-a-case-study-of-brewery-industry-in-south-west-nigeria/ (accessed on 17 March 2026).
-
Adewumi SA. Employment casualisation and trade union survival strategies in the beverage sector in Lagos, Nigeria. J. Public Aff. 2020, 21, e2256. DOI:10.1002/pa.2256 [Google Scholar]
-
Ikwuka PC, Ikon MA, Onwuchekwa FC. Employee Resourcing Strategies and Performance of Brewery Companies in South-East, Nigeria. Mod. Econ. Manag. 2022, 1, 8. DOI:10.53964/mem.2022008 [Google Scholar]
-
Okonkwo E, Okafor N, Essell O. The effect of human resource planning on organizational performance: A study of selected breweries in the South-East, Nigeria. Int. J. Manag. Entrep. Res. 2022, 4, 13–25. DOI:10.51594/ijmer.v4i1.280 [Google Scholar]
-
Sak T, Mylko I, Ivashko O, Chulipa I, Wołowiec T, Sokołowska-Woźniak J. How the Digital Economy Is Revolutionizing Marketing Management and Driving Sustainable Development. Sustainability 2025, 17, 1130. DOI:10.3390/su17031130 [Google Scholar]
-
He Z, Ni S, Jiang X, Feng C. The Influence of Demand Fluctuation and Competition Intensity on Advantages of Supply Chain Dominance. Mathematics 2023, 11, 4931. DOI:10.3390/math11244931 [Google Scholar]
-
Etuk A, Basil G, Bassey I. Supply and Demand Chain Management and Operational Efficiencies of Brewerying Firms in Nigeria: A Study of Champion Breweries Uyo. AKSU J. Manag. Sci. (AKSUJOMAS) 2016, 1, 91–103. Available online: https://aksujomas.org.ng/articles/16/12/supply-and-demand-chain-management-and-operational-efficiencies-of-brewerying-firms-in-nigeria-a-study-of-champion-breweries-uyo/ (accessed on 17 March 2026).
-
Ike NA, Ogbodo OC. Market Risk Effects and Financial Performance of Listed Brewery Firms in Nigeria. J. Glob. Account. 2023, 9, 182–213. Available online: https://journals.unizik.edu.ng/joga/article/view/2661/2162 (accessed on 17 March 2026).
-
Ugboya AP, Odiamenhi M. Prospects of the Nigeria Brewery Industry. J. Adv. Sci. Eng. 2019, 2, 17–24. DOI:10.37121/jase.v2i1.43 [Google Scholar]
-
Wojtaszek H. Energy Transition 2024–2025: New Demand Vectors, Technology Oversupply, and Shrinking Net-Zero 2050 Premium. Energies 2025, 18, 4441. DOI:10.3390/en18164441 [Google Scholar]
-
Li J. New Infrastructure Construction, Institutional Pressure, and Sustainable Development Performance: Empirical Evidence from Chinese Manufacturing Enterprises. Sustainability 2025, 17, 8551. DOI:10.3390/su17198551 [Google Scholar]
-
Mathew SU, Aban TL. Design and Cost Optimization of Heat Exchangers Network System in a Typical Brewery Plant. Eur. J. Eng. Technol. Res. 2020, 5, 245–251. DOI:10.24018/ejeng.2020.5.3.1748 [Google Scholar]
-
Mtebwa MH, Ichwekeleza WY. Assessment of energy efficiency in beverage industry. Tanzan. J. Eng. Technol. 2022, 41, 171–177. DOI:10.52339/tjet.v41i2.790 [Google Scholar]
-
Noah OO, Obanor AI, Audu ML. Energy audit of a brewery: A case study of Vitamalt Nig. Plc, Agbara. Energy Power Eng. 2012, 4, 137–143. DOI:10.4236/epe.2012.43019 [Google Scholar]
-
Nydrioti I, Grigoropoulou H. Optimizing Water Footprint and Energy Use in Industry: A Decision Support Framework for Industrial Wastewater Treatment and Reuse Applied to a Brewery. Water 2025, 17, 1179. DOI:10.3390/w17081179 [Google Scholar]
-
Brewery Collapses, Doors Close Forever. 2024. Available online: https://www.news.com.au/finance/business/retail/multiple-breweries-collapse-as-alcohol-industry-brought-to-its-knees/news-story/15fffe9945fce3dfb878f7a34be6a65e (accessed on 10 January 2025).
-
Courier Mail. Liquidation Looms as Brewery’s Frothy Debts Revealed. 2024. Available online: https://www.couriermail.com.au/topics/company-collapses-qld/page/32 (accessed on 10 January 2025).
-
The Sun. Major Beer Brand Placed into Administration & Staff ‘Made Redundant’ in Move to ‘Protect Firm from Market Pressures’. 2024. Available online: https://www.thesun.ie/money/13933183/major-beer-brand-placed-into-administration/ (accessed on 10 January 2025).
-
Rocha PA. What to Know About Alamo Beer Co. as Brewery Files for Bankruptcy. 2025. Available online: https://www.mysanantonio.com/business/article/alamo-beer-company-bankruptcy-20151250.php (accessed on 10 January 2025).
-
The Scottish Sun. Popular Beer Brand to File for Administration Leaving Drinkers Gutted. 2024. Available online: https://www.thescottishsun.co.uk/money/14136567/popular-beer-brand-to-file-for-administration/ (accessed on 10 January 2025).
-
Wikipedia. Flying Fish Brewing. 2023. Available online: https://en.wikipedia.org/wiki/Flying_Fish_Brewing (accessed on 10 January 2025).
-
Vanguard News. Nigerian Breweries Posts N106bn Loss, Shuts 2 Plants. 18 April 2024. https://www.vanguardngr.com/2024/04/nigerian-breweries-posts-n106bn-loss-shuts-2-plants/ (accessed on 10 January 2025). [Google Scholar]
-
The Guardian. Last Orders: South Sudan’s Only Brewery to Shut as Civil War Causes Forex Shortage. 15 January 2016. Available online: https://www.theguardian.com/global-development/2016/jan/15/south-sudan-only-brewery-shuts-civil-war-forex-shortage (accessed on 10 January 2025).
-
Nastasi G. Mathematical Models and Simulations, 2nd Edition. Axioms 2025, 14, 892. DOI:10.3390/axioms14120892 [Google Scholar]
-
Dudek G. Advances in Machine Learning: Emerging Methods and Real-World Applications. Appl. Sci. 2026, 16, 443. DOI:10.3390/app16010443 [Google Scholar]
-
Dawid L, Barańska AM, Baran P. Comparing the Performance of Regression and Machine Learning Models in Predicting the Usable Area of Houses with Multi-Pitched Roofs. Appl. Sci. 2025, 15, 6297. DOI:10.3390/app15116297 [Google Scholar]
-
Wang D, Wu H, Zheng W, Zhao Y, Tian G, Wang W, et al. A Mixed-Integer Linear Programming Model for Addressing Efficient Flexible Flow Shop Scheduling Problem with Automatic Guided Vehicles Consideration. Appl. Sci. 2025, 15, 3133. DOI:10.3390/app15063133 [Google Scholar]
-
Kim K, Kwon S, Choi M. Optimization of Production Scheduling for the Additive Manufacturing of Ship Models Using a Hybrid Method. J. Mar. Sci. Eng. 2024, 12, 1961. DOI:10.3390/jmse12111961 [Google Scholar]
-
Vicente JJ. Optimizing Supply Chain Inventory: A Mixed Integer Linear Programming Approach. Systems 2025, 13, 33. DOI:10.3390/systems13010033 [Google Scholar]
-
Chansombat S, Pongcharoen P, Hicks C. A mixed-integer linear programming model for integrated production and preventive maintenance scheduling in the capital goods industry. Int. J. Prod. Res. 2018, 57, 61–82. DOI:10.1080/00207543.2018.1459923 [Google Scholar]
-
Taghizadeh H, Hajipirlu MZ. Application of non-linear modelling with uncertain resource limitations in the optimization of manufacturing and production dimensions based on a fuzzy approach. Res. Sq. 2023. DOI:10.21203/rs.3.rs-2835107/v1 [Google Scholar]
-
Fadaeefath AM, Bordbari MJ, Haghighat F, Nasiri F. Dynamic Maintenance Cost Optimization in Data Centers: An Availability-Based Approach for K-out-of-N Systems. Buildings 2025, 15, 1057. DOI:10.3390/buildings15071057 [Google Scholar]
-
Lopez-Landeros CE, Valenzuela-Gonzalez R, Olivares-Benitez E. Dynamic optimization of a supply chain operation model with multiple products. Mathematics 2024, 12, 2420. DOI:10.3390/math12152420 [Google Scholar]
-
Mitrai I, Palys MJ, Daoutidis P. A Two-Stage Stochastic Programming Approach for the Design of Renewable Ammonia Supply Chain Networks. Processes 2024, 12, 325. DOI:10.3390/pr12020325 [Google Scholar]
-
Wang Z, Hao S, Yuan L, Hao K. A Three-Stage Stochastic Model to Improve Resilience with Lateral Transshipment in Multi-Period Emergency Logistics. Systems 2024, 12, 73. DOI:10.3390/systems12030073 [Google Scholar]
-
Liu Y, Tian G, Zhang X, Jiang Z. Multi-Objective Remanufacturing Processing Scheme Design and Optimization Considering Carbon Emissions. Symmetry 2025, 17, 266. DOI:10.3390/sym17020266 [Google Scholar]
-
Zhao Y, Du S, Tu M, Ma H, Shang J, Xiang X. Multi-Objective Scheduling Optimization of Prefabricated Components Production Using Improved Non-Dominated Sorting Generic Algorithm II. Buildings 2025, 15, 742. DOI:10.3390/buildings15050742 [Google Scholar]
-
Tomar V, Bansal M, Singh P. Metaheuristic Algorithms for Optimization: A Brief Review. Eng. Proc. 2023, 59, 238. DOI:10.3390/engproc2023059238 [Google Scholar]
-
Mahmudy WF, Widodo AW, Haikal AH. Challenges and Opportunities for Applying Meta-Heuristic Methods in Vehicle Routing Problems: A Review. Eng. Proc. 2024, 63, 12. DOI:10.3390/engproc2024063012 [Google Scholar]
-
Onokwai AO, Olusanya OO, Onifade MK, Anyaegbuna BE, Onoriode A, Agholor D. Comparative analysis of response surface methodology and adaptive neuro-fuzzy inference system for predictive fault detection and optimization in beverage industry. Front. Mech. Eng. 2024, 10, 1428717. DOI:10.3389/fmech.2024.1428717 [Google Scholar]
-
Kucharczyk K, Żyła K, Tuszyński T. Optimization of Fermentation Parameters in a Brewery: Modulation of Yeast Growth and Yeast Cell Viability. Processes 2025, 13, 906. DOI:10.3390/pr13030906 [Google Scholar]
-
Ugwuanyim G, Amuji H, Ebiringa O, Onwuegbuchunam D. Marketing Mix Optimization in Nigeria’s Brewing Industry: A Regression and Geometric Programming Approach (Case Study of Nigerian Breweries PLC). Open J. Stat. 2025, 15, 170–198. DOI:10.4236/ojs.2025.152010 [Google Scholar]
-
Schmid L, Roidl M, Kirchheim A, Pauly M. Comparing Statistical and Machine Learning Methods for Time Series Forecasting in Data-Driven Logistics—A Simulation Study. Entropy 2025, 27, 25. DOI:10.3390/e27010025 [Google Scholar]
-
Martinović M, Dokic K, Pudić D. Comparative Analysis of Machine Learning Models for Predicting Innovation Outcomes: An Applied AI Approach. Appl. Sci. 2025, 15, 3636. DOI:10.3390/app15073636 [Google Scholar]
-
Dudek G, Tomczyk A. Advances in Computational Intelligence and Machine Learning Models and Applications. Electronics 2026, 15, 196. DOI:10.3390/electronics15010196 [Google Scholar]
-
Amzil K, Saidi R, Cherif W. Enhancing Critical Industrial Processes with Artificial Intelligence Models. Eng. Proc. 2025, 112, 75. DOI:10.3390/engproc2025112075 [Google Scholar]
-
Horr AM, Drexler H. Real-Time Models for Manufacturing Processes: How to Build Predictive Reduced Models. Processes 2025, 13, 252. DOI:10.3390/pr13010252 [Google Scholar]
-
Rahman MA, Shahrior MF, Iqbal K, Abushaiba AA. Enabling Intelligent Industrial Automation: A Review of Machine Learning Applications with Digital Twin and Edge AI Integration. Automation 2025, 6, 37. DOI:10.3390/automation6030037 [Google Scholar]
-
Tabassum M, De Rouck G, De Brabanter K. Predictive modeling using artificial intelligence for sensory panel assessments of customized beer production. Int. J. Gastron. Food Sci. 2025, 42, 101311. DOI:10.1016/j.ijgfs.2025.101311 [Google Scholar]
-
Sáenz-Navajas M-P, Ferreira C, Bastian SEP, Jeffery DW. Bagging and boosting machine learning algorithms for modelling sensory perception from simple chemical variables: Wine mouthfeel as a case study. Food Qual. Prefer. 2025, 129, 105494. DOI:10.1016/j.foodqual.2025.105494 [Google Scholar]
-
Cheng W, Yu J, Li N, Pan T, Li R, Lan W. Machine-Learning Discrimination and Prediction of Flavor in Qingxiang-Xing Baijiu Fermented with Kiwi Fruit Residue. J. Am. Soc. Brew. Chem. 2025, 83, 511–523. DOI:10.1080/03610470.2025.2527456 [Google Scholar]
-
Chen Z. Wine quality prediction with ensemble trees: A unified, leak-free comparative study. arXiv 2025, arXiv.2506.06327. DOI:10.48550/arXiv.2506.06327 [Google Scholar]
-
Nettesheim P, Burggräf P, Steinberg F. Applications of machine learning in the brewing process: a systematic review. Discov. Artif. Intell. 2024, 4, 80. DOI:10.1007/s44163-024-00177-6 [Google Scholar]
-
Liu M, Hu J, Wu C, Sun Q, Zhao X. Hybrid Mathematical Modeling and Optimization Framework for Branch Flow Estimation at Y-Intersections: A Constraint- Aware Approach with Minimal Sensing Requirements. Symmetry 2025, 17, 2052. DOI:10.3390/sym17122052 [Google Scholar]
-
Liu X, Qi H, Jia S, Guo Y, Liu Y. Recent Advances in Optimization Methods for Machine Learning: A Systematic Review. Mathematics 2025, 13, 2210. DOI:10.3390/math13132210 [Google Scholar]
-
Du S, Jin L, Huang Z, Wan X. Recent Progress in Hybrid Intelligent Modeling Technology and Optimization Strategy for Industrial Energy Consumption Processes. Energies 2025, 18, 1939. DOI:10.3390/en18081939 [Google Scholar]
-
Khan R, Goyal A, Kanyal HS, Parashar D, Sharma SK, Iqbal M. Improved machine learning framework with feature engineering and SHAP analysis for predicting wine quality. Discov. Appl. Sci. 2026, 8, 27. DOI:10.1007/s42452-025-07999-8 [Google Scholar]
-
dos Santos WQ, McDermott O, Trubetskaya A. Lean Six Sigma 4.0 application in the food & beverage industry: A case study. IEEE Eng. Manag. Review 2025, 53, 110–130. DOI:10.1109/EMR.2025.3538268 [Google Scholar]
-
Kulina H, Yaneva P, Gocheva-Ilieva S. Modeling the beer market in a competitive environment with principal component analysis and machine learning techniques: A case study. In Proceedings of the ICoMS 24: Proceedings of the 2024 7th International Conference on Mathematics and Statistics, Amarante, Portugal, 23–25 June 2024; pp. 114–120. DOI:10.1145/3686592.3686612 [Google Scholar]
-
Ma BJ, Jackson I, Huang M, Villegas S, Macias-Aguayo J. A data-driven and context-aware approach for demand forecasting in the beverage industry. Int. J. Logist. Res. Applications 2025, 1–28. DOI:10.1080/13675567.2025.2566806 [Google Scholar]
-
Saetae D. Machine learning-based prediction of microbial growth and acidification in yogurt fermentation at industrial temperatures. LWT 2025, 231, 118326. DOI:10.1016/j.lwt.2025.118326 [Google Scholar]
-
Dazzarola C, Tighe R, Pérez-Correa JR, Saa PA. Toward a digital twin for beer quality control: Development of a digital model integrating industrial process data and model-based fermentation descriptors. J. Food Eng. 2025, 392, 112726. DOI:10.1016/j.jfoodeng.2025.112726 [Google Scholar]
-
Grand T, Jenkins D, Maskell D, Zhuang S. Valorisation of Carbon Dioxide from Fermentation in Craft Brewing: Potential Technologies, Brewer Interviews, and Implication for a ‘Three-Level Valorisation System’. J. Am. Soc. Brew. Chem. 2025, 83, 248–259. DOI:10.1080/03610470.2024.2417133 [Google Scholar]
-
Schreurs M, Piampongsant S, Roncoroni M, Cool L, Herrera-Malaver B, Vanderaa C, et al. Predicting and improving complex beer flavor through machine learning. Nat. Commun. 2024, 15, 2368. DOI:10.1038/s41467-024-46346-0 [Google Scholar]
-
Diniz DP, Carvalho M. Environmental Repercussions of Craft Beer Production in Northeast Brazil. Sustainability 2024, 16, 4566. DOI:10.3390/su16114566 [Google Scholar]
-
Osifeko M, Munda J. Scenario-Based Stochastic Optimization for Renewable Integration Under Forecast Uncertainty: A South African Power System Case Study. Processes 2025, 13, 2560. DOI:10.3390/pr13082560 [Google Scholar]
-
van der Walt R, van Vuuren G, Larney J, Verster T, Raubenheimer H. Combining E-Scores with Scenario Analysis to Evaluate the Impact of Transition Risk on Corporate Client Performance. Climate 2024, 12, 107. DOI:10.3390/cli12070107 [Google Scholar]
-
Wang Z, Zhang Y, Zhang Z. Scenario Analysis of Carbon Reduction Potential Through Forest Carbon Sink Mechanisms in the Beijing–Tianjin–Hebei Region, China. Sustainability 2025, 17, 7992. DOI:10.3390/su17177992 [Google Scholar]
-
Lugo-Niebla JR, Lagarda-Leyva EA, Acosta-Quintana MPG, Portugal-Vásquez J, Naranjo-Flores AA, Bueno-Solano A. System Dynamics Modeling and Multicriteria Analysis Methods for Selecting Scenarios in a Harness Assembling Plant. Systems 2025, 13, 936. DOI:10.3390/systems13110936 [Google Scholar]
-
Gathani S, Li K, Thind R, Zeng S, Xu M, Haas PJ, et al. PRAXA: A framework for what-if analysis. arXiv 2025, arXiv:2510.09791. DOI:10.48550/arXiv.2510.09791 [Google Scholar]
-
Saretzky F, Andersen L, Engel T, Ansari F. Integrating causal foundation model in prescriptive maintenance framework for optimizing production line OEE. arXiv 2025, arXiv:2512.00969. DOI:10.48550/arXiv.2512.00969 [Google Scholar]
-
Enebechi CT. Leveraging machine learning to optimize production processes and capacity in the brewery industry. SADI Int. J. Sci. Eng. Technol. (SIJSET) 2025, 12, 34–48. DOI:10.5281/zenodo.15591176 [Google Scholar]
-
Pekarcikova M, Trebuna P, Kliment M, Kronova J, Dic M. Master Production Schedule in the Consumer Product Goods Industry: Benefits of APS Applications. Appl. Sci. 2025, 15, 1642. DOI:10.3390/app15031642 [Google Scholar]
-
Li W, Yang H, Sun J, Lou L, Zhong J, Ouyang Z. Simulation of Beer Fermentation Combining CFD and Fermentation Reaction Models. Symmetry 2025, 17, 2025. DOI:10.3390/sym17122025 [Google Scholar]
-
Atieh AA, Abu Hussein A, Al-Jaghoub S, Alheet AF, Attiany M. The Impact of Digital Technology, Automation, and Data Integration on Supply Chain Performance: Exploring the Moderating Role of Digital Transformation. Logistics 2025, 9, 11. DOI:10.3390/logistics9010011 [Google Scholar]
-
Espina-Romero L, Gutiérrez Hurtado H, Ríos Parra D, Vilchez Pirela RA, Talavera-Aguirre R, Ochoa-Díaz A. Challenges and Opportunities in the Implementation of AI in Manufacturing: A Bibliometric Analysis. Sci 2024, 6, 60. DOI:10.3390/sci6040060 [Google Scholar]
-
Serviss MT, Van Hout D, Britton SJ, MacIntosh AJ. Brewing for the Future: Balancing Tradition and Sustainability. J. Am. Soc. Brew. Chem. 2026, 84, 121–139. DOI:10.1080/03610470.2025.2509059 [Google Scholar]
-
Lehnhardt F, Schneiderbanger H, Messner C, Gastl M. Impact of Brew House Parameters on Beer Aging: Mapping the German Brewery Landscape. J. Am. Soc. Brew. Chem. 2026, 84, 84–95. DOI:10.1080/03610470.2025.2524658 [Google Scholar]
-
Chiscop F, Vlase AI, Cazacu C-C, Popa CL, Cotet CE. Manufacturing Productivity Improvement by Integrating Digital Tools Illustrated in the Optimization of a Hub Assembly Line. Machines 2025, 13, 849. DOI:10.3390/machines13090849 [Google Scholar]
-
Ionescu A-M, Ionescu A-C. Exploring the Future of Manufacturing: An Analysis of Industry 5.0’s Priorities and Perspectives. Sustainability 2025, 17, 7842. DOI:10.3390/su17177842 [Google Scholar]
-
Antony Jose S, Tonner A, Feliciano M, Roy T, Shackleford A, Menezes PL. Smart Manufacturing for High-Performance Materials: Advances, Challenges, and Future Directions. Materials 2025, 18, 2255. DOI:10.3390/ma18102255 [Google Scholar]
-
Bernard G, Budde L, Hänggi R, Friedli T. Driving Continuous Improvement with Industry 4.0 Technologies: Lessons from Multiple Use Case Analysis. Appl. Sci. 2025, 15, 2191. DOI:10.3390/app15042191 [Google Scholar]
-
Andriani DP, Rahmani IV, Aini APN, Wijayanti F. Manufacturing industry performance appraisals: Multi-criteria decision-making model. Int. J. Integr. Eng. 2022, 14, 28–37. DOI:10.30880/ijie.2022.14.06.003 [Google Scholar]
-
Jaskó S, Ruppert T. The Future of Manufacturing and Industry 4.0. Appl. Sci. 2025, 15, 4655. DOI:10.3390/app15094655 [Google Scholar]
-
Polo S, Rubio EM, Ayllón J, de Agustina B. Emerging Advances in Sustainable Manufacturing. Processes 2025, 13, 1549. DOI:10.3390/pr13051549 [Google Scholar]
-
Bobitan N, Dumitrescu D, Popa AF, Sahlian DN, Turlea IC. Shaping Tomorrow: Anticipating Skills Requirements Based on the Integration of Artificial Intelligence in Business Organizations—A Foresight Analysis Using the Scenario Method. Electronics 2024, 13, 2198. DOI:10.3390/electronics13112198 [Google Scholar]
-
Garzón AG, Pavón Y, Aquino ME, Drago SR. Valorization of brewing by-products: Obtaining flavor-enhancing and antioxidant compounds from spent yeast. Sustain. Food Technol. 2026, 4, 1728–1737. DOI:10.1039/D5FB00499C [Google Scholar]
-
Krenicky T. Advanced Manufacturing Technologies: Development and Prospect. Appl. Sci. 2025, 15, 4597. DOI:10.3390/app15094597 [Google Scholar]