Identifying Effective Intervention Targets for Depressive Symptoms Across Adolescence: A Network-Based Simulated Intervention

Identifying Effective Intervention Targets for Depressive Symptoms Across Adolescence: A Network-Based Simulated Intervention
Received: 15 January 2026 Revised: 09 March 2026 Accepted: 13 April 2026 Published: 27 April 2026

© 2026 The authors. This is an open access article under the Creative Commons Attribution 4.0 International License (https://creativecommons.org/licenses/by/4.0/).
1. Introduction
Depressive symptoms in adolescence are conceptualized as maladaptive responses to developmental tasks such as changes in physical, cognitive, emotional, and social domains [1]. The point prevalence of elevated depressive symptoms among adolescents was estimated at 37% (95% CI: 0.32–0.42) between 2011 and 2020 [2]. Depressive symptoms exhibit distinct developmental trajectories throughout adolescence [3]. Previous research has extensively examined the network structures of depressive symptoms in adolescence and proposed central symptoms as potential intervention targets [4]. However, few studies have explored the degree to which network states change in response to interventions targeting central symptoms. To address this issue, this study applied the Ising model and the NodeIdentifyR algorithm (NIRA) to quantify the effects of symptom-specific interventions on network states and identify effective intervention targets. This study further explored the association between symptom centrality and simulated intervention effects. Given that developmental tasks during adolescence occur across distinct sub-stages [5], this study examined symptom networks across three stages of adolescence (i.e., early, middle, and late adolescence). These insights can contribute to the development of targeted intervention strategies for depressive symptoms across different stages of adolescence.
1.1. Depressive Symptoms Across Different Stages of Adolescence
Adolescence spans approximately 10 to 18 years of age and is typically categorized into early adolescence (10–12 years), middle adolescence (13–15 years), and late adolescence (16–18 years) [6,7]. Across this period, depressive symptoms have been examined as a single latent construct measured by summed scores [8]. Using this method, prior research has suggested that depressive symptoms exhibit different developmental trajectories: increasing in early adolescence and declining slightly during middle and late adolescence [3]. However, an increasing body of research has adopted a symptom-level perspective, focusing on specific depressive symptoms and their interactions [4]. Studies have documented that individual depressive symptoms may vary across developmental stages [1].
From a developmental perspective, adolescents’ emotional experiences and expressions may change across stages due to the maturation of emotional and cognitive capacities. Research on emotion differentiation suggests that children and early adolescents have a relatively limited ability to distinguish among specific negative emotions, and their affective experiences are often organized around broader and more undifferentiated negative states (e.g., general unhappiness or feeling bad) rather than clearly differentiated emotions [9,10]. Therefore, emotional expressions may appear more diffuse and generalized in early adolescence. As adolescents progress into middle and late adolescence, they gradually become capable of identifying and differentiating specific emotional states such as sadness, depression, or anger [9]. Advances in cognitive functioning increase the likelihood of self-reflective processes and rumination (Nolen-Hoeksema et al., 2008) [11]. Psychosocial stressors also become more complex during this period, including academic pressures, identity exploration, peer relationship challenges, and concerns about future life paths [12]. Together, changes in emotional experiences and expressions may contribute to more clearly differentiated depressive emotional experiences during middle and late adolescence [13,14]. These developmental changes may influence how depressive symptoms manifest and interact with one another across different stages of adolescence, potentially leading to different symptoms emerging as more central at different developmental periods.
1.2. Depressive Symptom Centrality Across Different Stages of Adolescence
Psychopathology network theory conceptualizes depressive symptoms as a network of interacting symptoms [15]. Previous research has examined network structures of depressive symptoms among adolescents. For instance, one study identified “loneliness” as the central symptom in early and middle adolescence (both elementary and junior high school), whereas “fatigue” was identified as the central symptom in late adolescence (senior high school) [16]. These findings suggested that central symptoms varied across different developmental stages of adolescence. However, little research has examined whether these central symptoms can serve as effective intervention targets for maximizing changes in the network states. Examining the effects of targeting these central symptoms can deepen understanding of their role within the depressive symptom network and inform the development of stage-tailored intervention strategies.
1.3. Identifying Intervention Targets via the Network-Based Simulated Intervention
The network-based simulated intervention is a valuable method for exploring effective intervention targets [17]. This method offers three advantages. First, it can quantify the projected effects of symptom-specific interventions on the global state of the depressive symptom network [18]. The projected effect refers to the expected change in total symptom activity between baseline and post-intervention conditions [19]. Depressive symptoms showing the greatest projected effects are identified as effective intervention targets. Second, this method can identify both treatment targets that most effectively reduce network activity and preventive targets that, if exacerbated, would most significantly deteriorate network state [20]. Identifying such targets holds significant value for developing clinical treatment and prevention strategies. Third, this method offers insights into the relationship between the centrality of depressive symptoms and the projected effects of symptom-specific interventions simulated within the network [19].
1.4. The Current Study
Although existing research has advanced understanding of depressive symptoms in three primary ways—(1) distinct developmental trajectories during adolescence [3], (2) network structures of depressive symptoms [21], and (3) central symptoms [4]—gaps remain regarding the projected effects of targeting these central symptoms. Specifically, little evidence exists to verify whether central symptoms serve as effective intervention targets. This study was designed with two primary objectives: (1) to identify effective intervention targets at each stage of adolescence by employing the Ising model and NIRA, and (2) to examine the association between the centrality of depressive symptoms and the projected effects of symptom-specific interventions. This study has the potential to advance both theoretical understanding of the role central symptoms play in the depressive symptom network and the development of practical strategies for symptom-specific prevention and treatment.
2. Materials and Methods
2.1. Participants and Procedures
The dataset used in this study was obtained from the Chinese Mental Health Database (CMHD), a national comprehensive mental health database. The survey employed a stratified sampling method, taking into account economic development and urbanization levels. The final sample consisted of 46,842 participants (49.19% male) from 27 provinces in China. Their ages ranged from 10 to 18 years (Mage = 14.01 years, SD = 2.55). Participants were categorized into three stages of adolescence [6], comprising early adolescence (n = 15,299, 10–12 years, 49.38% male), middle adolescence (n = 15,996, 13–15 years, 49.01% male), and late adolescence (n = 15,547, 16–18 years, 49.18% male).
The survey was conducted between October 2021 and February 2022. First, all participants completed consent forms, with minors providing parental consent. Second, participants reported demographic information (such as age and biological sex) and filled in the Center for Epidemiologic Studies Depression Scale (CES-D Scale), along with other questionnaires unrelated to this study. The process was carried out via an online platform under the direction of trained research assistants in the classroom during school hours. The survey procedure was approved by the Ethics Committee of the author’s institution.
2.2. Measures
The CES-D Scale was used to measure depressive symptoms [22]. Participants indicated how frequently they had experienced each symptom during the past week. The scale consists of twenty items, including four reverse-scored items (e.g., “I felt I was just as good as other people”). Each item is rated on a scale from 0 (rarely or never) to 3 (most or almost all the time). In this study, Cronbach’s α was 0.90 for the whole adolescence, 0.89 for the early adolescence, 0.91 for the middle adolescence, and 0.91 for the late adolescence.
2.3. Statistical Analysis
All statistical analyses were performed using R (Version 4.4.2) [23] and RStudio (version 2024.12.0+467). The current data contained no missing values, as the online survey system prompted participants to complete unanswered items. If participants chose not to respond, they could voluntarily exit the survey at any time. The Ising model analysis and the NIRA were carried out in the current study.
2.3.1. Ising Model Network Analyses
Three Ising model networks were estimated to map network structures of depressive symptoms in early, middle, and late adolescence [24]. In each network, nodes represented depressive symptoms and edges represented the partial correlation coefficients between pairs of symptoms. The expected influence (EI) index, which is defined as the sum of the edge weights connecting a given symptom to all others [25], was employed to assess the centrality of depressive symptoms within the networks. The accuracy and stability of the networks were assessed [26]. The accuracy of edge weights was evaluated by estimating 95% confidence intervals (CIs) with 1000 nonparametric bootstraps. The stability of the EI centrality indices was examined by calculating correlation stability (CS) coefficients. The CS coefficients should ideally be above 0.5 and not below 0.25 [26]. Network comparison tests (NCTs) were conducted to examine differences in network structure, edge strength, global expected influence, and symptom centrality (i.e., EI) between any two networks [27].
Prior to the Ising model network analysis, following previous studies [17,28], each symptom score was binarized as 1 (the original score was above 0) or 0 (the original score was 0), indicating the symptom’s presence or absence, respectively. The networks were estimated using logistic regression to obtain regression coefficients and intercept parameters [29]. The regression coefficients represented the edge weights. The intercept parameters represented the threshold parameters of the symptoms, reflecting the autonomous tendency of symptoms to be present when all other symptoms were absent. The original edge weight matrix (a 20 × 20 matrix) and the original threshold parameter vector (a 20 × 1 vector) were obtained through logistic regression.
2.3.2. Simulated Interventions
Based on the Ising model analyses, the NIRA was employed to implement a four-step simulated intervention [19]. The simulated interventions were conducted separately for three stages of adolescence.
First, this study conducted 35,000 samplings to generate 35,000 simulated pre-intervention observations based on the original edge weight matrix and the original threshold parameter vector obtained through the Ising model analyses. Each simulated pre-intervention observation included simulated scores for twenty depressive symptoms.
Second, this study adjusted the original threshold parameter of each depressive symptom to simulate the effect of an intervention and generate post-intervention observations. As there are multiple possible approaches for determining how thresholds should be altered [19], the current study followed previous research and used two standard deviations of the estimated thresholds as the manipulation magnitude [17,28]. The NIRA simulated two types of interventions for each symptom: the alleviating intervention, implemented by reducing twice the standard deviation from a symptom’s original threshold parameter, and the aggravating intervention, implemented by adding twice the standard deviation to a symptom’s original threshold parameter. For each symptom-specific intervention, 35,000 simulated post-intervention observations were generated. This simulated intervention process was applied sequentially to each of the twenty depressive symptoms. Thus, for each intervention type, the NIRA generated 35,000 × 20 simulated post-intervention observations, each containing simulated scores for all twenty depressive symptoms. Additionally, this study conducted the sensitivity analysis with one standard deviation perturbation.
Third, NIRA outcomes were calculated to identify symptoms with the greatest projected effect on network states as the effective intervention targets. Specifically, the sum of the simulated scores for all twenty depressive symptoms was computed for each observation, resulting in the observation’s sum score. The mean of all observations’ sum scores was then calculated for each simulated case (including simulated pre-intervention and post-intervention cases), yielding a sum score mean. The absolute difference between the pre-intervention sum score mean and each post-intervention sum score mean was computed as an NIRA outcome. Twenty NIRA outcomes were calculated for each simulated intervention type (i.e., alleviating or aggravating). The symptoms with the highest NIRA outcomes were identified as the effective intervention targets.
Fourth, this study analyzed the relationships between the NIRA outcomes and both symptom thresholds and EI centrality. Paired correlation analyses were conducted for each depressive symptom to compare its NIRA outcome with its corresponding threshold and EI centrality, respectively, both of which were derived from the Ising model networks.
3. Results
3.1. Descriptive Statistics
Table 1 displays the descriptive statistics of depressive symptoms across different stages of adolescence. The skewness ranged from −0.17 to 2.70, and the kurtosis ranged from −1.59 to 7.24 across three stages of adolescence. The skewness and kurtosis were deemed acceptable (skewness < 3, kurtosis < 10) [30]. The correlations between symptoms are provided in the supplemental materials.
3.2. Ising Model Network Analyses
3.2.1. Network Structures and Central Symptoms
Figure 1 presents the Ising network structures of depressive symptoms across different stages of adolescence. In the three networks, the number of non-zero edges was 158, 153, and 140, respectively, out of 190 possible edges. The strongest edge was between “feeling unhappy” (CESD12R) and “can’t enjoy life” (CESD16R) in each network, with edge weight increasing from early to late adolescence. The mean edge weight was 0.26 in each network, indicating the presence of many weak edges across all three networks. “Feeling sad” (CESD18) had the highest EI value and served as the central symptom in early adolescence. The EI value of “feeling depressed” (CESD6) increased from early to late adolescence. “Feeling depressed” had the highest EI value in middle and late adolescence, emerging as the central symptom in middle and late adolescence. The full EI centrality results for all depressive symptoms are available in the supplemental materials.
Table 1. Descriptive statistics of depressive symptoms at different stages of adolescence.
|
Nodes |
Symptoms |
Early Adolescence |
Middle Adolescence |
Late Adolescence |
||||||
|---|---|---|---|---|---|---|---|---|---|---|
|
M (SD) |
Skewness (Kurtosis) |
Predictability (R2) |
M (SD) |
Skewness (Kurtosis) |
Predictability R2 |
M (SD) |
Skewness (Kurtosis) |
Predictability R2 |
||
|
CESD1 |
Feeling bothered |
0.44 (0.74) |
1.80 (2.89) |
0.32 |
0.73 (0.88) |
1.08 (0.35) |
0.37 |
0.74 (0.87) |
1.06 (0.39) |
0.35 |
|
CESD2 |
Poor appetite |
0.30 (0.63) |
2.33 (5.40) |
0.22 |
0.40 (0.72) |
1.90 (3.17) |
0.26 |
0.38 (0.70) |
1.94 (3.46) |
0.22 |
|
CESD3 |
Feeling blue |
0.26 (0.63) |
2.70 (7.24) |
0.31 |
0.43 (0.77) |
1.87 (2.81) |
0.39 |
0.44 (0.77) |
1.84 (2.77) |
0.38 |
|
CESD4R |
Feeling bad |
1.61 (1.24) |
−0.17 (−1.59) |
0.17 |
1.55 (1.18) |
−0.08 (−1.50) |
0.17 |
1.35 (1.14) |
0.20 (−1.37) |
0.19 |
|
CESD5 |
Trouble focus |
0.44 (0.78) |
1.87 (2.80) |
0.25 |
0.74 (0.91) |
1.07 (0.21) |
0.30 |
0.89 (0.92) |
0.79 (−0.24) |
0.34 |
|
CESD6 |
Feeling depressed |
0.44 (0.77) |
1.80 (2.60) |
0.41 |
0.77 (0.93) |
1.01 (0.01) |
0.46 |
0.83 (0.91) |
0.90 (−0.04) |
0.46 |
|
CESD7 |
Effort |
0.36 (0.71) |
2.12 (4.12) |
0.32 |
0.60 (0.83) |
1.36 (1.15) |
0.37 |
0.64 (0.81) |
1.19 (0.81) |
0.41 |
|
CESD8R |
Feeling hopeless |
0.82 (1.06) |
0.95 (−0.54) |
0.28 |
0.92 (1.05) |
0.75 (−0.76) |
0.32 |
0.88 (0.99) |
0.81 (−0.54) |
0.34 |
|
CESD9 |
Feeling failure |
0.37 (0.75) |
2.16 (4.01) |
0.36 |
0.54 (0.85) |
1.55 (1.55) |
0.38 |
0.52 (0.80) |
1.55 (1.74) |
0.38 |
|
CESD10 |
Feeling fearful |
0.46 (0.84) |
1.83 (2.41) |
0.32 |
0.52 (0.83) |
1.59 (1.69) |
0.35 |
0.50 (0.79) |
1.58 (1.83) |
0.35 |
|
CESD11 |
Restless sleep |
0.40 (0.77) |
2.06 (3.51) |
0.26 |
0.49 (0.84) |
1.70 (1.97) |
0.24 |
0.51 (0.84) |
1.64 (1.83) |
0.21 |
|
CESD12R |
Feeling unhappy |
0.61 (0.93) |
1.35 (0.62) |
0.41 |
0.82 (0.95) |
0.87 (−0.35) |
0.45 |
0.86 (0.92) |
0.79 (−0.34) |
0.47 |
|
CESD13 |
Talking less |
0.46 (0.81) |
1.84 (2.59) |
0.14 |
0.55 (0.84) |
1.51 (1.50) |
0.17 |
0.60 (0.84) |
1.37 (1.17) |
0.20 |
|
CESD14 |
Feeling lonely |
0.39 (0.78) |
2.09 (3.57) |
0.38 |
0.56 (0.87) |
1.51 (1.33) |
0.41 |
0.60 (0.87) |
1.38 (1.02) |
0.41 |
|
CESD15 |
Feeling unfriendly |
0.30 (0.68) |
2.49 (5.78) |
0.35 |
0.36 (0.72) |
2.16 (4.22) |
0.35 |
0.34 (0.67) |
2.15 (4.45) |
0.38 |
|
CESD16R |
Can’t enjoy life |
0.61 (0.95) |
1.38 (0.64) |
0.43 |
0.78 (0.97) |
0.96 (−0.24) |
0.48 |
0.80 (0.93) |
0.91 (−0.19) |
0.50 |
|
CESD17 |
Crying |
0.63 (0.90) |
1.35 (0.82) |
0.38 |
0.72 (0.92) |
1.12 (0.25) |
0.41 |
0.59 (0.81) |
1.34 (1.14) |
0.36 |
|
CESD18 |
Feeling sad |
0.46 (0.77) |
1.73 (2.41) |
0.46 |
0.64 (0.84) |
1.25 (0.85) |
0.51 |
0.61 (0.79) |
1.24 (0.99) |
0.50 |
|
CESD19 |
People disliked me |
0.41 (0.80) |
2.01 (3.22) |
0.40 |
0.56 (0.86) |
1.52 (1.41) |
0.42 |
0.51 (0.79) |
1.56 (1.79) |
0.42 |
|
CESD20 |
Without motivation |
0.35 (0.69) |
2.16 (4.35) |
0.37 |
0.63 (0.85) |
1.27 (0.84) |
0.42 |
0.72 (0.86) |
1.05 (0.34) |
0.42 |
Note: M = mean, SD = Standard deviation. R nodes were reverse-scored.
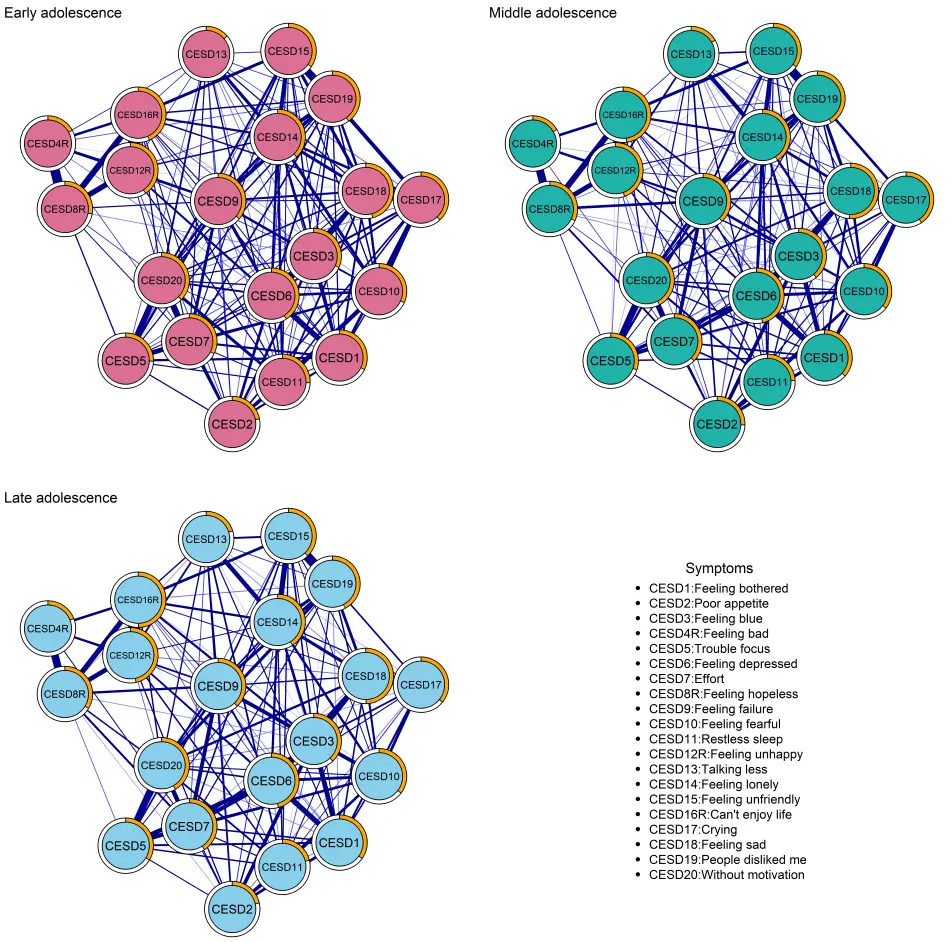
Figure 1. Ising network structures of depressive symptoms at different stages of adolescence. Note: Each node represents a depressive symptom. Blue edges represent positive connections and red edges represent negative connections. Thicker edges indicate stronger connections. The ring around each node indicates its predictability by all other nodes in the network. A larger orange sector corresponds to higher predictability.
In the network accuracy analysis, all three networks exhibited narrow confidence intervals, indicating adequate accuracy. In the network stability analysis, the three networks showed acceptable stability, with the CS coefficients for EI all equal to 0.75. Detailed results regarding the networks’ accuracy and stability are presented in supplemental materials.
3.2.2. Network Comparison Tests
The network comparison tests showed the global expected influence values for the three networks were 50.44, 49.17, and 49.99, respectively, with the significant differences across different stages of adolescence (pearly-middle < 0.01, pmiddle-late < 0.05). The centrality invariance test indicated that “feeling sad” (CESD18) and “feeling depressed” (CESD6) did not significantly differ in EI values across different stages of adolescence. The network structure invariance test revealed significant differences across different stages of adolescence (pearly-middle < 0.01, pmiddle-late < 0.05). The edge strength invariance test showed significant differences in certain edges across different stages of adolescence. For example, the edge between “feeling unhappy” (CESD12R) and “can’t enjoy life” (CESD16R) exhibited a significant difference between early and middle adolescence (pearly-middle < 0.05).
3.3. Simulated Interventions
3.3.1. The Alleviating and Aggravating Interventions
Figure 2 presents the results of alleviating and aggravating interventions in early, middle, and late adolescence. Depressive symptoms exhibited distinct projected effects on the whole network states across different stages of adolescence. In early adolescence, the alleviating intervention targeting “feeling bad” (CESD4R) had the greatest projected effect on the overall network state. Deactivating this symptom reduced the sum score mean from 4.61 to 3.43 (NIRA score = 1.18). In the aggravating intervention, “feeling sad” (CESD18) exhibited the greatest projected effect on the network state. Worsening this symptom increased the sum score mean from 4.57 to 6.83 (NIRA score = 2.26). Moreover, the confidence intervals for the effects of worsening “feeling depressed” (CESD6) and “feeling sad” (CESD18) largely overlapped. Worsening “feeling depressed” (CESD6) increased the sum score mean from 4.57 to 6.83 (NIRA score = 2.26).
Simulated interventions in middle and late adolescence exhibited aligned outcomes. The alleviating intervention targeting “feeling depressed” (CESD6) had the greatest projected effect on the whole network state, reducing the sum score mean from 7.22 to 4.98 (NIRA score = 2.24) in middle adolescence and from 7.53 to 5.13 (NIRA score = 2.40) in late adolescence. In the aggravating intervention, “feeling blue” (CESD3) showed the greatest projected effect, increasing the sum score mean from 7.17 to 10.18 (NIRA score = 3.01) in middle adolescence and from 7.58 to 10.60 (NIRA score = 3.02) in late adolescence.
3.3.2. Correlations of NIRA with Thresholds and EI Centrality
Figure 3 shows the comparisons between NIRA outcomes and thresholds, and between NIRA outcomes and expected influence centrality. Table 2 presents the EI values, thresholds, and NIRA outcomes for depressive symptoms. Table 3 presents the top five symptoms with the highest EI centrality and the top five symptoms with the highest NIRA scores across developmental stages. In alleviating interventions, the correlations between NIRA outcomes and thresholds were 0.58, 0.16, and 0.25 in early, middle, and late adolescence, respectively, illustrating a moderate to weak relationship between NIRA outcomes and thresholds. In aggravating interventions, the correlations between NIRA outcomes and thresholds were −0.82, −0.91, and −0.90 across early, middle, and late adolescence, respectively, indicating a strong relationship between thresholds and NIRA outcomes.
When comparing NIRA outcomes and expected influence centrality, the correlations in alleviating interventions were 0.13, 0.56, and 0.54 in early, middle, and late adolescence, respectively, showing a weak to moderate relationship. For aggravating interventions, their correlations were 0.86, 0.77, and 0.70 across the three stages of adolescence, respectively, indicating a strong relationship.
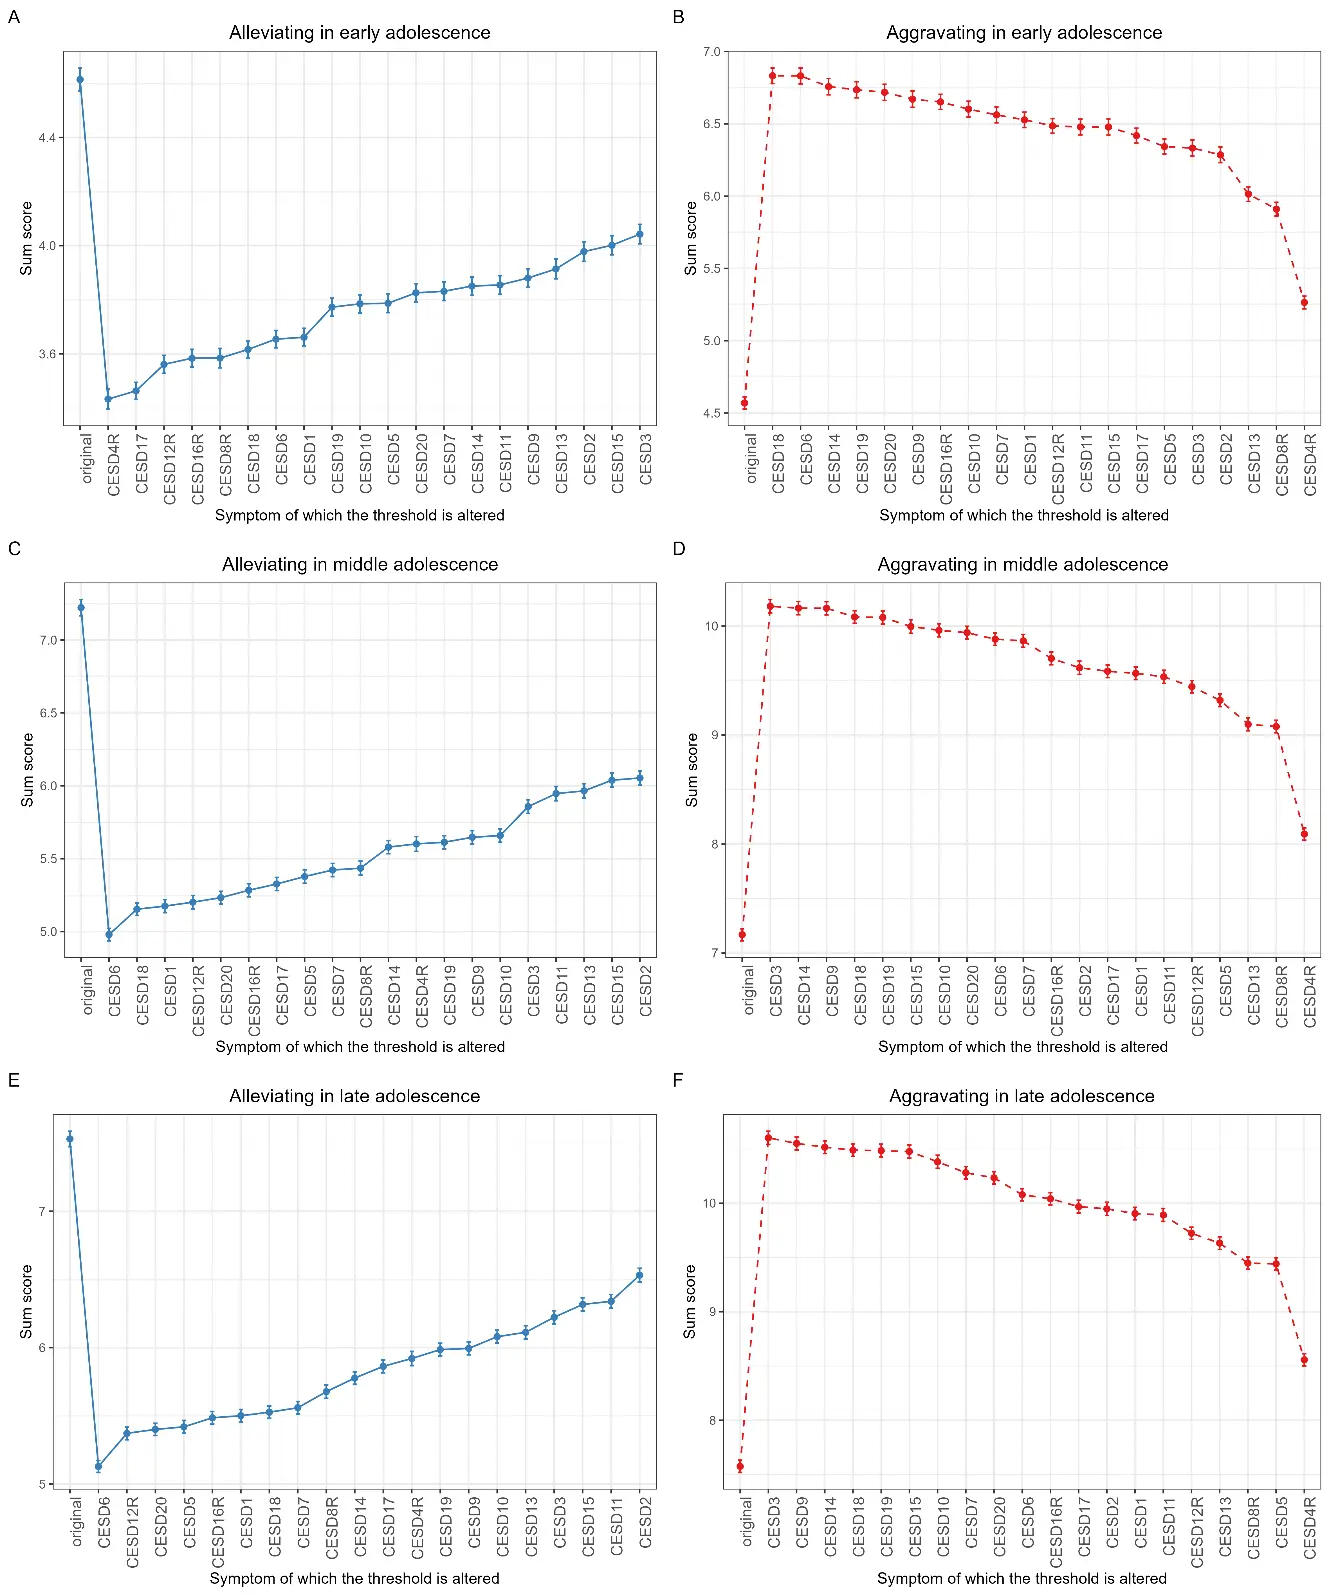
Figure 2. Results of alleviating and aggravating interventions for early, middle, and late adolescence. Note: This figure comprises six subplots. In each subplot, the x-axis displays individual depressive symptoms whose thresholds were altered and the y-axis shows the sum score of the network following each intervention. (A) alleviating interventions in early adolescence; (B) aggravating interventions in early adolescence; (C) alleviating interventions in middle adolescence; (D) aggravating interventions in middle adolescence; (E) alleviating interventions in late adolescence; (F) aggravating interventions in late adolescence.
Table 2. EIs, thresholds, and NIRA of depressive symptoms.
|
Nodes |
Early Adolescence |
Middle Adolescence |
Late Adolescence |
|||||||||
|---|---|---|---|---|---|---|---|---|---|---|---|---|
|
EIs |
Thresholds |
NIRA |
EIs |
Thresholds |
NIRA |
EIs |
Thresholds |
NIRA |
||||
|
Alleviating |
Aggravating |
Alleviating |
Aggravating |
Alleviating |
Aggravating |
|||||||
|
CESD1 |
4.99 |
−2.34 |
0.95 |
1.96 |
4.99 |
−1.92 |
2.05 |
2.40 |
4.96 |
−1.95 |
2.03 |
2.33 |
|
CESD2 |
3.99 |
−2.69 |
0.64 |
1.72 |
3.99 |
−2.80 |
1.17 |
2.45 |
3.70 |
−2.87 |
1.00 |
2.37 |
|
CESD3 |
4.95 |
−3.75 |
0.57 |
1.76 |
5.59 |
−3.91 |
1.36 |
3.01 |
5.71 |
−4.04 |
1.31 |
3.03 |
|
CESD4R |
3.20 |
−0.04 |
1.18 |
0.70 |
2.67 |
−0.04 |
1.62 |
0.92 |
2.69 |
−0.30 |
1.61 |
0.98 |
|
CESD5 |
4.20 |
−2.16 |
0.83 |
1.77 |
3.98 |
−1.65 |
1.84 |
2.15 |
4.48 |
−1.36 |
2.11 |
1.87 |
|
CESD6 |
6.35 |
−2.96 |
0.96 |
2.26 |
6.46 |
−2.45 |
2.24 |
2.71 |
6.59 |
−2.40 |
2.40 |
2.50 |
|
CESD7 |
5.20 |
−2.92 |
0.78 |
1.99 |
5.09 |
−2.69 |
1.80 |
2.70 |
5.57 |
−2.84 |
1.97 |
2.71 |
|
CESD8R |
4.10 |
−2.18 |
1.03 |
1.34 |
4.44 |
−2.27 |
1.79 |
1.91 |
4.42 |
−2.33 |
1.85 |
1.87 |
|
CESD9 |
5.69 |
−3.55 |
0.73 |
2.10 |
5.41 |
−3.34 |
1.57 |
3.00 |
5.43 |
−3.41 |
1.54 |
2.98 |
|
CESD10 |
4.97 |
−2.70 |
0.83 |
2.03 |
4.70 |
−2.81 |
1.56 |
2.79 |
4.92 |
−3.10 |
1.45 |
2.81 |
|
CESD11 |
4.46 |
−2.57 |
0.76 |
1.91 |
3.74 |
−2.33 |
1.27 |
2.37 |
3.64 |
−2.33 |
1.19 |
2.32 |
|
CESD12R |
5.32 |
−2.65 |
1.05 |
1.92 |
5.32 |
−2.31 |
2.02 |
2.28 |
5.53 |
−2.28 |
2.16 |
2.15 |
|
CESD13 |
2.98 |
−1.86 |
0.70 |
1.44 |
2.86 |
−1.69 |
1.26 |
1.93 |
3.28 |
−1.69 |
1.42 |
2.06 |
|
CESD14 |
5.74 |
−3.28 |
0.76 |
2.19 |
5.69 |
−3.00 |
1.64 |
3.00 |
5.83 |
−2.85 |
1.75 |
2.94 |
|
CESD15 |
4.92 |
−3.34 |
0.61 |
1.91 |
4.86 |
−3.52 |
1.18 |
2.83 |
5.28 |
−3.70 |
1.21 |
2.90 |
|
CESD16R |
6.14 |
−3.14 |
1.03 |
2.08 |
6.18 |
−3.17 |
1.94 |
2.53 |
6.36 |
−3.14 |
2.04 |
2.47 |
|
CESD17 |
5.48 |
−1.84 |
1.15 |
1.85 |
4.59 |
−1.94 |
1.89 |
2.42 |
4.03 |
−2.03 |
1.67 |
2.39 |
|
CESD18 |
6.45 |
−3.09 |
1.00 |
2.26 |
6.43 |
−3.05 |
2.07 |
2.92 |
6.44 |
−3.06 |
2.00 |
2.91 |
|
CESD19 |
5.90 |
−3.22 |
0.84 |
2.17 |
5.56 |
−2.92 |
1.61 |
2.91 |
5.36 |
−2.95 |
1.54 |
2.91 |
|
CESD20 |
5.85 |
−3.30 |
0.79 |
2.15 |
5.79 |
−2.76 |
1.99 |
2.77 |
5.75 |
−2.70 |
2.13 |
2.66 |
Note: EI means Expected Influence. In early adolescence, the CESD4R exhibits the greatest NIRA from alleviating interventions and the greatest threshold value. The CESD18 exhibits the greatest NIRA from aggravating interventions and the greatest EI value. In middle and late adolescence, the CESD6 shows the greatest NIRA from alleviating interventions and the greatest EI values, while the CESD3 shows the greatest NIRA from aggravating interventions and the smallest threshold values.
Table 3. Top five highest EI symptoms and top five NIRA score symptoms.
|
Developmental Stages |
The Top Five Highest EI Symptoms |
Top Five NIRA Score Symptoms |
|
|---|---|---|---|
|
Alleviating Intervention |
Aggravating Intervention |
||
|
Early adolescence |
Feeling sad Feeling depressed Can’t enjoy life People disliked me Without motivation |
Feeling bad Crying Feeling unhappy Feeling hopeless Feeling sad |
Feeling sad Feeling depressed Feeling lonely People disliked me Without motivation |
|
Middle adolescence |
Feeling depressed Feeling sad Can’t enjoy life Without motivation Feeling lonely |
Feeling depressed Feeling sad Feeling bothered Feeling unhappy Without motivation |
Feeling blue Feeling lonely Feeling failure Feeling sad People disliked me |
|
Late adolescence |
Feeling depressed Feeling sad Can’t enjoy life Feeling lonely Without motivation |
Feeling depressed Feeling unhappy Without motivation Trouble focus Can’t enjoy life |
Feeling blue Feeling failure Feeling lonely Feeling sad People disliked me |
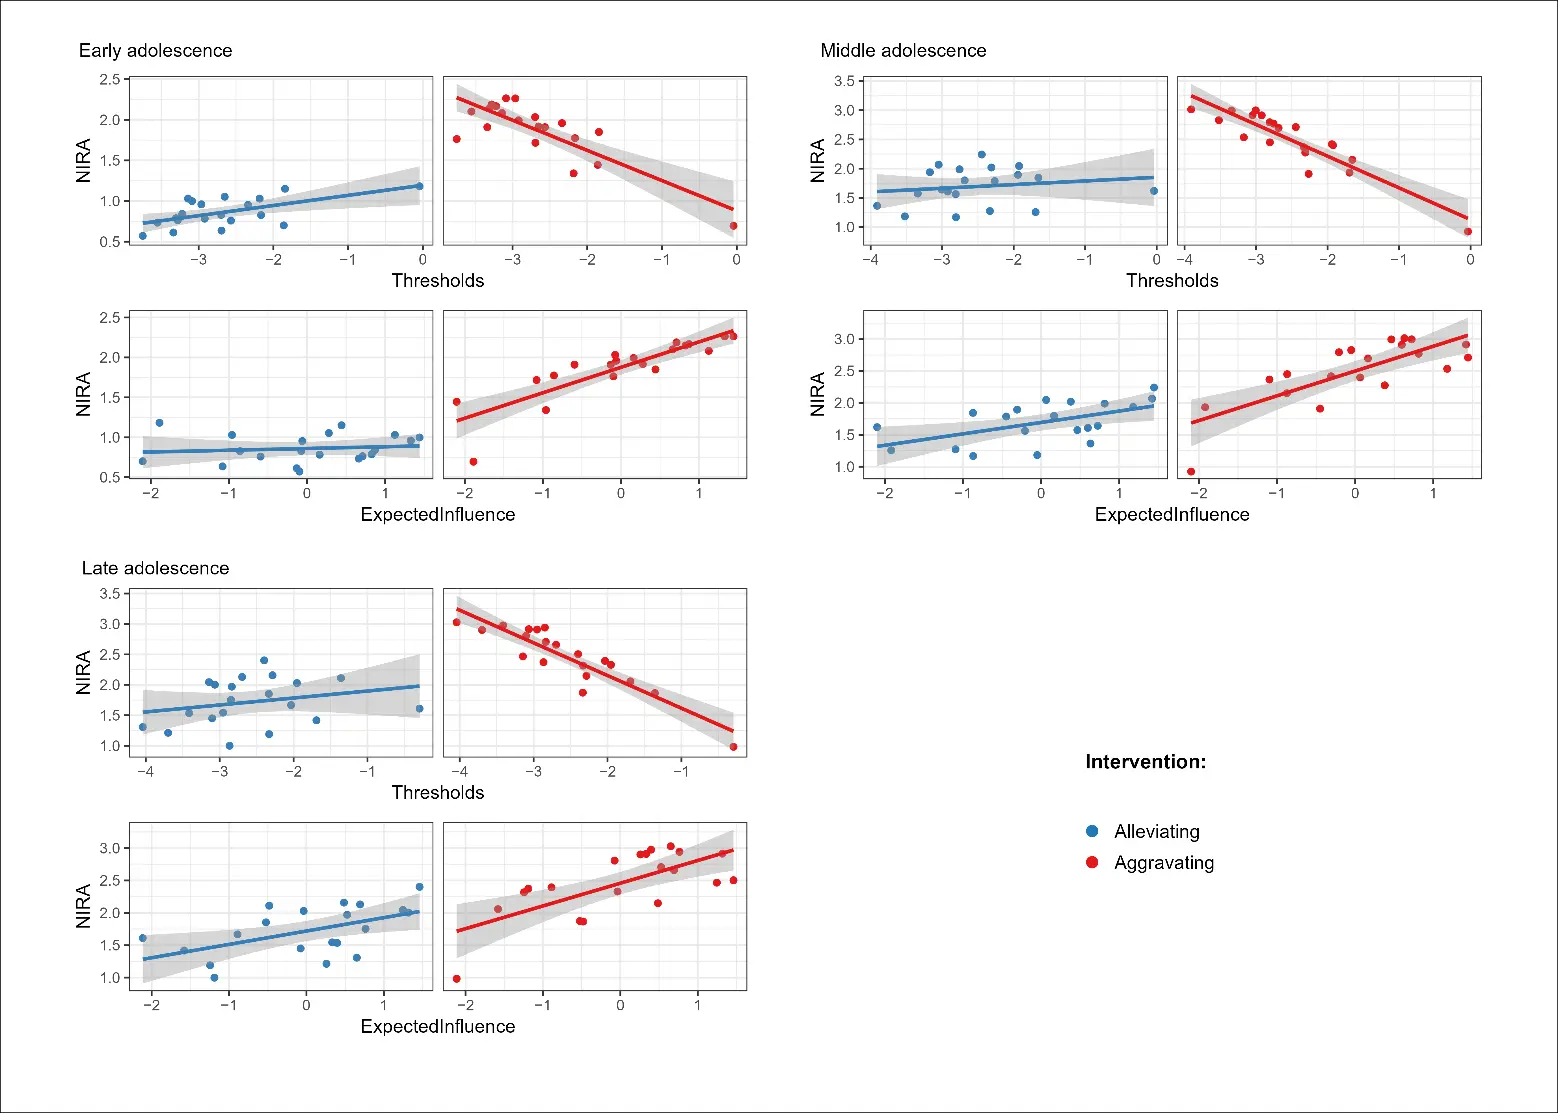
Figure 3. The relationships between NIRA and thresholds, and between NIRA and the expected influence (EI) centrality across different stages of adolescence. Note: This figure comprises three subplots for early, middle, and late adolescence. Each subplot contains two panels. The top panel shows correlations between thresholds and the NIRA from alleviating interventions (blue) and aggravating interventions (red). The bottom panel shows the correlations between the EI centrality and the NIRA from alleviating interventions (blue) and aggravating interventions (red). In all panels, steeper slopes indicate stronger correlations.
4. Discussion
Using the Ising model and the NIRA, this study examined depressive symptom networks in Chinese adolescents, identified central symptoms and effective intervention targets, and analyzed their relationships across early, middle, and late adolescence. Ising model analyses identified “feeling sad” and “feeling depressed” as central symptoms with the highest EI values in early and middle-to-late adolescence, respectively. The centrality of “feeling depressed” increased from early to late adolescence, although not significantly. Alleviating interventions identified “feeling bad” in early adolescence and “feeling depressed” in middle and late adolescence as the effective treatment targets for which decreasing their thresholds was projected to result in the greatest reduction in network activation. Aggravating interventions identified “feeling sad” and “feeling depressed” in early adolescence, and “feeling blue” in middle and late adolescence as the effective prevention targets. Worsening these specific symptoms would lead to the greatest increase in network activation in their respective developmental stages. These results indicated that the central symptoms were not necessarily the effective intervention targets. This study advances the understanding of the role that central symptoms play in the depressive symptom network and provides valuable insights into selecting effective treatment and prevention targets for adolescents with depressive symptoms.
4.1. Central Symptoms Throughout Adolescence
The central symptoms identified in this study align with prior findings. This study identified “feeling sad” and “feeling depressed” as central symptoms in early and middle-to-late adolescence, respectively. As prior research has demonstrated, depressed mood is the most consistent central symptom across studies [31]. “Feeling sad” has also been identified as a central symptom in previous studies [32]. The clinical significance of “feeling depressed” and “feeling sad” is well-documented [33]. For instance, the Diagnostic and Statistical Manual of Mental Disorders, Fifth Edition (DSM-V) lists depressed mood as one of two core criteria required for a diagnosis of Major Depressive Disorder (MDD) [34]. Although “feeling sad” is not listed as a core criterion in the DSM-V, one study on patients with MDD found that those presenting with a sad mood were more likely to experience other depressive symptoms, including social impairment [35].
Although previous research has identified central symptoms, few studies have examined changes in the centrality of depressive symptoms across early, middle, and late adolescence. This study found that the EI values of “feeling depressed” increased—though not significantly—from early to late adolescence. This finding implied that “feeling depressed” might play an increasingly important role in developing the adolescent depressive symptom network. A 6-year longitudinal study among adolescents revealed that the stable (“trait”) component of depressed mood became more prominent with age, whereas the temporal (“state”) component diminished over time [36]. Stable and persistent depressed mood may trigger a range of associated emotional difficulties, such as sadness and loneliness.
4.2. Intervention Targets Across Adolescence
The simulation analyses identified several affect-related symptoms as effective intervention targets across adolescence, including “feeling bad”, “feeling depressed”, “feeling sad”, and “feeling blue”. These CES-D items represent broad affective experiences that may reflect different ways in which adolescents experience and express negative emotional states.
Effective treatment targets differed from prevention targets. For instance, “feeling sad” and “feeling depressed” emerged as prevention targets, whereas “feeling bad” served as the treatment target during early adolescence. This distinction may reflect different functional roles that symptoms play within the depressive symptom network. Within the Ising model, symptoms with higher thresholds tend to remain in their current state and require stronger perturbations to change their activation status [24,29]. In the present study, “feeling bad” showed a relatively high threshold, suggesting that it may represent a relatively stable psychological state within the network. Reducing such stable symptoms may therefore produce broader changes in the overall network state, making them effective treatment targets. From a practice perspective, interventions directly targeting treatment targets may be particularly beneficial for adolescents who already exhibit elevated depressive symptoms [19]. By contrast, symptoms such as “feeling sad” and “feeling depressed” may function as more sensitive indicators of network activation. These emotional states may be more easily triggered by environmental stressors or emotional fluctuations during early adolescence. Once activated, they may facilitate the activation of additional depressive symptoms within the network, contributing to a broader deterioration of the network state. From this perspective, these symptoms may serve as early warning signals that warrant attention in prevention contexts. While “feeling bad”, “feeling sad”, and “feeling depressed” may share overlapping intervention strategies—such as cognitive–behavioral approaches or emotion regulation training—their roles within the network may differ in terms of when they should be prioritized during prevention versus treatment efforts.
In this study, effective intervention targets changed across different stages of adolescence. In early adolescence, the treatment target was “feeling bad”, which, according to the CES-D scale, refers to “I felt I was not just as good as other people”. This symptom reflects a negative self-evaluation in the context of social comparison rather than a single emotional state [37]. It may capture adolescents’ perceptions of self-worth relative to others, which can involve both affective and cognitive components [38]. During early adolescence, processes of social comparison become increasingly salient as adolescents navigate changes in peer relationships, academic expectations, and emerging self-concept [12]. Such negative self-evaluations may therefore represent a relatively stable psychological experience that contributes to broader depressive symptom activation. In contrast, the treatment target in middle and late adolescence was “feeling depressed”. This difference may reflect changes in adolescents’ emotional awareness and their ability to differentiate among emotional experiences. Research on emotion differentiation suggests that, as adolescents mature, their cognitive and emotional capacities enable them to identify and articulate more specific emotional experiences [9]. Moreover, during middle and late adolescence, individuals are confronted with multiple stressors stemming from the self, family, peers, and school [12], while their emotion regulation abilities remain immature [14]. Ineffective coping with these multiple stressors contributes to depressive symptoms [1]. Consequently, more differentiated affective states such as “feeling depressed” may become increasingly central to their emotional experiences in middle and late adolescence.
Furthermore, “feeling depressed” emerged as a prevention target in early adolescence, but as a treatment target in middle and late adolescence. This developmental shift may reflect a reorganization of symptom functioning across adolescence. In early adolescence, “feeling depressed” may represent a more transient and context-dependent emotional response [39,40], making it more suitable as a prevention target. However, during middle to late adolescence, depressive affect may become increasingly internalized and integrated with negative self-concepts and maladaptive cognitive processes such as rumination [41,42]. As a result, “feeling depressed” may function as a more stable and central component of the symptom network, thereby emerging as a treatment target.
4.3. Central Symptoms Are Not Necessarily Intervention Targets
Consistent with previous research, the present findings further indicate that central symptoms are not necessarily the most effective intervention targets [18,28]. Although central symptoms are typically assumed to exert a stronger influence on other symptoms due to their numerous or strong connections within the network [25], the present simulation results suggest that interventions targeting these symptoms do not always produce the greatest changes in overall network activation.
In the present study, the roles of central symptoms differed from those identified as intervention targets. For example, “feeling depressed” emerged as a central symptom in middle and late adolescence, yet it served as an effective treatment target only in those developmental stages. Similarly, “feeling sad”, which was identified as a central symptom in early adolescence, functioned primarily as a prevention target rather than a treatment target. These patterns suggest that the position of a symptom within the network does not necessarily determine its potential impact when targeted by interventions. Supporting this interpretation, the correlation analyses revealed only moderate-to-weak associations between the NIRA-derived intervention effects and symptom thresholds, and weak-to-moderate associations with expected influence centrality. These findings suggest that centrality alone may not fully determine a symptom’s potential as an intervention target. Instead, other properties of the symptom network may also influence the projected impact of symptom-specific interventions.
Another insight from the present study concerns the potential role of symptom thresholds. “Feeling bad”, identified as the treatment target in early adolescence, exhibited the highest threshold within the network, whereas “feeling blue”, identified as a prevention target in middle-to-late adolescence, showed the lowest threshold. Within the Ising model framework, higher thresholds indicate that a symptom tends to remain in its current state and requires stronger external perturbations to change its activation status [24,29]. Targeting such relatively stable symptoms during treatment may therefore produce broader shifts in the network state when their activation status changes. Conversely, symptoms with lower thresholds may be more easily activated, making them particularly relevant for prevention efforts aimed at avoiding the escalation of depressive symptoms.
Taken together, these findings suggest that both the structural position of a symptom within the network (e.g., centrality) and its intrinsic activation tendency (e.g., threshold) may jointly shape its potential as an intervention target. Considering multiple network characteristics may therefore provide a more comprehensive understanding of how symptom-specific interventions influence depressive symptom networks.
4.4. Implications
This study has two main implications. First, it advances the understanding of the role that central symptoms play within a network. Previous research has suggested central symptoms as possible intervention targets based on the argument that highly central depressive symptoms have strong connections to other symptoms and should have more influence on overall network activation [25]. This study indicates that interventions targeting central symptoms do not necessarily produce the greatest change in network activation. Symptom thresholds also affect network activation, independent of symptom centrality. Second, simulation results highlighted the role of broad affective experiences (e.g., “feeling bad”, “feeling depressed”, “feeling sad”, and “feeling blue”) as symptoms capable of sustaining and propagating the activation of the overall depressive symptom network throughout adolescence. These findings suggest that when an adolescent consistently exhibits depressed affect, it should not be dismissed as exaggeration; rather, they should receive greater attention and support. For schools, it is recommended to implement mental health programs that educate adolescents on properly recognize and cope with depressed affect.
4.5. Limitations and Future Directions
This study has several limitations. First, cross-sectional surveys were used. Although the current findings suggest changes in centrality of specific depressive symptoms across different stages of adolescence, these changes should not be interpreted as longitudinal changes within individuals [43]. Longitudinal studies are needed to test these results further [44]. Second, although the intervention results highlight potential treatment and prevention targets, these findings must be empirically validated. Subsequent empirical studies should evaluate the impact of interventions on specific depressive symptoms. Third, the simulation-based intervention approach relied on manipulating symptom thresholds (e.g., ±2 standard deviations), which may not directly correspond to effect sizes achievable in real-world clinical or preventive settings. The use of ±2 standard deviations in the simulated interventions remains a simplification of complex intervention processes. Therefore, the magnitude of simulated effects should be interpreted with caution. Future research should be designed to link simulation parameters more closely to empirically observed intervention effects and further validate these findings in real-world contexts.
5. Conclusions
Using the Ising model and NIRA, this study examined the network structures of depressive symptoms and identified central symptoms as well as effective intervention targets across early, middle, and late adolescence. “Feeling sad” and “feeling depressed” emerged as central symptoms in early and middle-to-late adolescence, respectively. In early adolescence, “feeling bad” was identified as the treatment target, while “feeling sad” and “feeling depressed” were identified as preventive targets. In middle and late adolescence, “feeling depressed” and “feeling blue” were respectively identified as primary targets for alleviating and aggravating interventions. These insights provide a more comprehensive understanding of how symptom-specific interventions influence depressive symptom networks.
Supplementary Materials
The following supporting information can be found at: https://www.sciepublish.com/article/pii/981, Figure S1: GGM network structures of depressive symptoms at different stages of adolescence; Figure S2: EIs of depressive symptoms in GGM networks for different stages of adolescence; Figure S3: Centrality stability in GGM networks across different stages of adolescence; Figure S4: Edge weight accuracy in GGM networks for different stages of adolescence; Figure S5: Results of alleviating and aggravating interventions for early, middle, and late adolescence; Figure S6: EIs of depressive symptoms in Ising networks across different stages of adolescence; Figure S7: Edge weight accuracy of Ising networks across different stages of adolescence; Figure S8: Centrality stability of Ising networks across different stages of adolescence; Figure S9: Edge weight differences of Ising networks across different stages of adolescence. Figure S10: EI differences of Ising networks across different stages of adolescence; Table S1: Pearson correlation coefficients among symptoms in early adolescence; Table S2: Pearson correlation coefficients among symptoms in middle adolescence; Table S3: Pearson correlation coefficients among symptoms in late adolescence.
Statement of the Use of Generative AI and AI-Assisted Technologies in the Writing Process
During the preparation of this manuscript, the authors used GPT-5.2 in order to enhance the fluency and readability of the text while preserving the intended meaning. After using this tool, the authors reviewed and edited the content as needed and take full responsibility for the content of the published article. All research content, data analyses, and conclusions were independently developed by the authors, and GPT-5.2 did not contribute to the generation of any original content.
Acknowledgements
We thank all participating adolescents, schools, and research assistants.
Author Contributions
Conceptualization: Y.Z. and Y.F.; Data curation: Y.Z.; Formal analysis: Y.Z.; Methodology: Y.Z. and Y.F.; Software: Y.Z.; Visualization: Y.Z.; Writing—original draft: Y.Z. and Y.F.; Project administration: Y.F. and Z.C.; Resources: Z.C.; Supervision: Y.F.; Writing—review and editing: Y.F. and Z.C.
Ethics Statement
Approval was obtained from the ethics committee of the Institutional Review Board of the Institute of Psychology, Chinese Academy of Sciences ((protocol codes H21045; date of approval: [2021]). The procedures used in this study adhere to the tenets of the Declaration of Helsinki.
Informed Consent Statement
The participants signed informed consent forms after having been informed of all the details of the study.
Data Availability Statement
The data that support the findings of this study are available on request from the corresponding author.
Funding
This research received no external funding.
Declaration of Competing Interest
The authors declare that they have no known competing financial interests or personal relationships that could have appeared to influence the work reported in this paper.
References
- Adams GR, Berzonsky MD. (Eds.). Blackwell Handbook of Adolescence; Blackwell Pub: Hoboken, NJ, USA, 2003. [Google Scholar]
- Shorey S, Ng ED, Wong CHJ. Global prevalence of depression and elevated depressive symptoms among adolescents: A systematic review and meta-analysis. Br. J. Clin. Psychol. 2022, 61, 287–305. DOI:10.1111/bjc.12333 [Google Scholar]
- Son S, Lee H, Jang Y. Continuity and stability of child and adolescent depressive symptoms in South Korea: A meta-analysis of longitudinal studies. J. Youth Adolesc. 2023, 52, 598–618. DOI:10.1007/s10964-022-01709-y [Google Scholar]
- Robinaugh DJ, Hoekstra RHA, Toner ER, Borsboom D. The network approach to psychopathology: A review of the literature 2008–2018 and an agenda for future research. Psychol. Med. 2020, 50, 353–366. DOI:10.1017/S0033291719003404 [Google Scholar]
- Akinade EA. The adolescence stage. In Developmental Psychology: A Life-Span Approach; Brightways Publishers: Ibadan, Nigeria, 2022; pp. 71–98. [Google Scholar]
- Sumter SR, Borhorst CL, Steinberg L, Westenberg PM. The developmental pattern of resistance to peer influence in adolescence: Will the teenager ever be able to resist? J. Adolesc. 2009, 32, 1009–1021. DOI:10.1016/j.adolescence.2008.08.010 [Google Scholar]
- Zou S, Wu X. Coparenting conflict behavior, parent–adolescent attachment, and social competence with peers: An investigation of developmental differences. J. Youth Adolesc. 2020, 49, 267–282. DOI:10.1007/s10964-019-01131-x [Google Scholar]
- Fried EI, Nesse RM. Depression sum-scores don’t add up: Why analyzing specific depression symptoms is essential. BMC Med. 2015, 13, 72. DOI:10.1186/s12916-015-0325-4 [Google Scholar]
- Nook EC, Sasse SF, Lambert HK, McLaughlin KA, Somerville LH. The nonlinear development of emotion differentiation: Granular emotional experience is low in adolescence. Psychol. Sci. 2018, 29, 1346–1357. DOI:10.1177/0956797618773357 [Google Scholar]
- Widen SC, Russell JA. Children acquire emotion categories gradually. Cogn. Dev. 2008, 23, 291–312. DOI:10.1016/j.cogdev.2008.01.002 [Google Scholar]
- Nolen-Hoeksema S, Wisco BE, Lyubomirsky S. Rethinking rumination. Perspect. Psychol. Sci. 2008, 3, 400–424. DOI:10.1111/j.1745-6924.2008.00088.x [Google Scholar]
- Curtis AC. Defining adolescence. J. Adolesc. Fam. Health 2015, 7, 2. Available online: https://www.scirp.org/reference/referencespapers?referenceid=3375976 (accessed on 15 March 2026).
- Hankin BL, Abramson LY. Development of gender differences in depression: An elaborated cognitive vulnerability–transactional stress theory. Psychol. Bull. 2001, 127, 773–796. DOI:10.1037/0033-2909.127.6.773 [Google Scholar]
- Reynolds WM, Johnston HF. Handbook of Depression in Children and Adolescents; Plenum Press: New York, NY, USA; London, UK, 1994. [Google Scholar]
- Borsboom D. A network theory of mental disorders. World Psychiatry 2017, 16, 5–13. DOI:10.1002/wps.20375 [Google Scholar]
- Li T, Chen J, Yang L, Lyu M, Liu J, Ren P. Central symptoms and network associations of depressive symptoms among school-aged students: A network analysis. J. Affect. Disord. 2024, 345, 284–292. DOI:10.1016/j.jad.2023.10.131 [Google Scholar]
- Li F, Zhang Y, Fang Y, Chen Z. Effective targets of intervention on generalized anxiety symptoms across whole adolescence and emerging adulthood: Network analysis and insilico intervention. Eur. Child Adolesc. Psychiatry 2025, 34, 2133–2144. DOI:10.1007/s00787-024-02626-0 [Google Scholar]
- Wang L, Chen C, Cao C, Liu P, Bi Y, Luo S, et al. Identifying intervention targets in the COVID-19 pandemic-related psychopathological network among adolescents: A simulating intervention study. Psychol. Trauma Theory Res. Pract. Policy 2025. DOI:10.1037/tra0001994 [Google Scholar]
- Lunansky G, Naberman J, Van Borkulo CD, Chen C, Wang L, Borsboom D. Intervening on psychopathology networks: Evaluating intervention targets through simulations. Methods 2022, 204, 29–37. DOI:10.1016/j.ymeth.2021.11.006 [Google Scholar]
- Jiménez S, Arango de Montis I, Garza-Villarreal EA. Modeling vulnerability and intervention targets in the Borderline Personality Disorder System: A network analysis of in silico and in vivo interventions. PLoS ONE 2023, 18, e0289101. DOI:10.1371/journal.pone.0289101 [Google Scholar]
- Huang S, Luo Y, Lai X, Jian K, Xu Z, Wang Y. Core symptoms of depression in Chinese adolescents and comparison between different gender and levels of depression: A network analysis approach. J. Psychol. Sci. 2022, 45, 1115–1122. DOI:10.16719/j.cnki.1671-6981.20220512 [Google Scholar]
- Radloff LS. The CES-D Scale: A self-report depression scale for research in the general population. Appl. Psychol. Meas. 1977, 1, 385–401. DOI:10.1177/014662167700100306 [Google Scholar]
- R Core Team. A Language and Environment for Statistical Computing; R Foundation for Statistical Computing: Vienna, Austria, 2022. [Google Scholar]
- Marsman M, Borsboom D, Kruis J, Epskamp S, Van Bork R, Waldorp LJ, et al. An Introduction to network psychometrics: Relating Ising network models to item response theory models. Multivar. Behav. Res. 2018, 53, 15–35. DOI:10.1080/00273171.2017.1379379 [Google Scholar]
- Robinaugh DJ, Millner AJ, McNally RJ. Identifying highly influential nodes in the complicated grief network. J. Abnorm. Psychol. 2016, 125, 747–757. DOI:10.1037/abn0000181 [Google Scholar]
- Epskamp S, Borsboom D, Fried EI. Estimating psychological networks and their accuracy: A tutorial paper. Behav. Res. Methods 2018, 50, 195–212. DOI:10.3758/s13428-017-0862-1 [Google Scholar]
- Van Borkulo CD, Van Bork R, Boschloo L, Kossakowski JJ, Tio P, Schoevers RA, et al. Comparing network structures on three aspects: A permutation test. Psychol. Methods 2023, 28, 1273–1285. DOI:10.1037/met0000476 [Google Scholar]
- Li P, Huang N, Yang X, Fang Y, Chen Z. A simulation-based network analysis of intervention targets for adolescent depressive and anxiety symptoms. Asian J. Psychiatry 2024, 99, 104152. DOI:10.1016/j.ajp.2024.104152 [Google Scholar]
- Van Borkulo CD, Borsboom D, Epskamp S, Blanken TF, Boschloo L, Schoevers RA, et al. A new method for constructing networks from binary data. Sci. Rep. 2014, 4, 5918. DOI:10.1038/srep05918 [Google Scholar]
- Kline RB. Principles and Practice of Structural Equation Modeling, 4th ed.; Guilford Press: New York, NY, USA, 2016. [Google Scholar]
- Malgaroli M, Calderon A, Bonanno GA. Networks of major depressive disorder: A systematic review. Clin. Psychol. Rev. 2021, 85, 102000. DOI:10.1016/j.cpr.2021.102000 [Google Scholar]
- Gijzen MWM, Rasing SPA, Creemers DHM, Smit F, Engels RCME, De Beurs D. Suicide ideation as a symptom of adolescent depression. A network analysis. J. Affect. Disord. 2021, 278, 68–77. DOI:10.1016/j.jad.2020.09.029 [Google Scholar]
- Mouchet-Mages S, Baylé FJ. Sadness as an integral part of depression. Dialogues Clin. Neurosci. 2008, 10, 321–327. DOI:10.31887/DCNS.2008.10.3/smmages [Google Scholar]
- American Psychiatric Association. Diagnostic and Statistical Manual of Mental Disorders, 5th ed.; APA: Washington, DC, USA, 2013. [Google Scholar]
- Chepenik LG, Cornew LA, Farah MJ. The influence of sad mood on cognition. Emotion 2007, 7, 802–811. DOI:10.1037/1528-3542.7.4.802 [Google Scholar]
- Holsen I, Kraft P, Vittersø J. Stability in depressed mood in adolescence: Results from a 6-year longitudinal panel study. J. Youth Adolesc. 2000, 29, 61–78. DOI:10.1023/A:1005121121721 [Google Scholar]
- Festinger L. A theory of social comparison processes. Hum. Relat. 1954, 7, 117–140. DOI:10.1177/001872675400700202 [Google Scholar]
- Harter S. The Construction of the Self: Developmental and Sociocultural Foundations, 2nd ed.; Guilford Press: New York, NY, USA, 2012. [Google Scholar]
- Dahl RE, Gunnar MR. Heightened stress responsiveness and emotional reactivity during pubertal maturation: Implications for psychopathology. Dev. Psychopathol. 2009, 21, 1–6. DOI:10.1017/S0954579409000017 [Google Scholar]
- Demkowicz O, Panayiotou M, Qualter P, Humphrey N. Longitudinal relationships across emotional distress, perceived emotion regulation, and social connections during early adolescence: A developmental cascades investigation. Dev. Psychopathol. 2024, 36, 562–577. DOI:10.1017/S0954579422001407 [Google Scholar]
- Cortright C, An D, Lansford JE, Bornstein MH, Chang L, Deater-Deckard K, et al. The relations among depressive symptoms, self-esteem, and optimism during adolescence: Longitudinal evidence from nine countries. Dev. Psychopathol. 2026, 38, 552–563. DOI:10.1017/S0954579425100497 [Google Scholar]
- Yeo G, Tan C, Ho D, Baumeister RF. How do aspects of selfhood relate to depression and anxiety among youth? A meta-analysis. Psychol. Med. 2023, 53, 4833–4855. DOI:10.1017/S0033291723001083 [Google Scholar]
- Bos FM, Snippe E, de Vos S, Hartmann JA, Simons CJP, van der Krieke L, et al. Can we jump from cross-sectional to dynamic interpretations of networks implications for the network perspective in psychiatry. Psychother. Psychosom. 2017, 86, 175–177. DOI:10.1159/000453583 [Google Scholar]
- Van Borkulo C, Boschloo L, Borsboom D, Penninx BWJH, Waldorp LJ, Schoevers RA. Association of symptom network structure with the course of depression. JAMA Psychiatry 2015, 72, 1219–1226. DOI:10.1001/jamapsychiatry.2015.2079 [Google Scholar]