Adjusted Net Savings and Sustainable Development in Africa: A Panel Evidence Approach

Adjusted Net Savings and Sustainable Development in Africa: A Panel Evidence Approach

Received: 07 November 2025 Revised: 04 February 2026 Accepted: 05 March 2026 Published: 30 March 2026

© 2026 The authors. This is an open access article under the Creative Commons Attribution 4.0 International License (https://creativecommons.org/licenses/by/4.0/).
1. Introduction
Sustainable development has become a central concern for developing economies, particularly in Africa, where the challenges of poverty reduction, energy security, and environmental degradation interact. Despite rapid economic expansion across several African countries in recent decades, the quality of growth remains uneven, and the long-term sustainability of this trajectory is uncertain. To capture this multidimensional aspect, Adjusted Net Savings (ANS)—a comprehensive indicator developed by the World Bank—is used as a proxy for sustainable development, reflecting not only economic performance but also environmental depletion and human capital accumulation.
Focusing on Africa is particularly important, as the continent combines high vulnerability to climate change, strong dependence on natural resources, and an urgent need for structural transformation to sustain long-term development. In this context, Adjusted Net Savings provides a suitable framework to assess whether economic growth trajectories in African economies are achieved at the expense of natural capital or support intergenerational sustainability.
Over the past three decades, African economies have faced the dual challenge of sustaining economic growth while minimizing the environmental costs of industrialization and resource exploitation. Although several nations have achieved notable progress in renewable energy adoption and institutional reforms, issues such as high carbon intensity, weak regulatory capacity, and limited green investment continue to constrain sustainable transformation. Therefore, understanding the interactions between income growth, renewable energy consumption, trade openness, and carbon intensity is essential for designing effective development strategies.
This study contributes to the literature by providing new empirical evidence on the determinants of sustainable development in African economies using second-generation panel data methods. By employing the Augmented Mean Group (AMG) estimator, System GMM, and Dumitrescu–Hurlin panel causality tests, it accounts for cross-sectional dependence, heterogeneity, and potential endogeneity across countries. The findings aim to clarify how structural economic factors and energy transitions jointly influence long-term sustainability outcomes. Detailed definitions, measurement units, and data sources of all variables are reported in Table A11 in the Appendix A.
Despite the growing literature on sustainable development indicators and energy–growth dynamics, empirical evidence on the nexus between Adjusted Net Savings and sustainable development in Africa remains limited. Existing studies predominantly rely on first-generation panel methods and often overlook cross-sectional dependence and heterogeneity across countries. This study contributes to the literature by explicitly addressing these econometric challenges through the application of second-generation panel estimators to the ANS framework in the African context. By combining AMG, System GMM, and panel causality techniques, the analysis provides a more robust and nuanced assessment of how income growth, energy transition, and trade openness jointly shape sustainable development trajectories across heterogeneous African economies.
The study is structured as follows: Section 2 reviews the related literature; Section 3 describes the data, variables, and methodological framework; Section 4 presents the empirical results; Section 5 discusses key findings; Section 6 provides policy recommendations; Section 7 concludes the study; and Section 8 outlines limitations and directions for future research.
2. Theoretical and Literature Review
Sustainable development represents the balance between economic growth, environmental protection, and social welfare. According to [1], the Adjusted Net Savings (ANS) indicator provides a comprehensive measure of sustainability by accounting for human capital formation, resource depletion, and pollution damage. Unlike traditional growth indicators, ANS captures whether a country’s economic progress is achieved at the cost of natural and environmental assets, thus aligning with the theoretical framework of green growth and intergenerational equity.
From a theoretical perspective, economic growth (lnGDP per capita) is expected to enhance sustainable development by increasing fiscal capacity and technological investment, as suggested by neoclassical and endogenous growth models. However, this positive link can be undermined by rising carbon intensity, reflecting energy-inefficient production patterns [2]. Renewable energy consumption contributes to long-term sustainability by reducing environmental degradation, though short-term costs and infrastructural barriers may weaken this effect in developing economies [3]. Similarly, trade openness may either promote sustainability through technological spillovers or hinder it by expanding pollution-intensive exports [4].
Recent empirical studies extend this framework by integrating institutional, financial, and resource-based factors into the sustainability-growth nexus. Ref. [5] revealed that financial outreach—measured by access to formal banking—enhances sustainable development in Africa, whereas financial innovation may have adverse effects by reducing employment opportunities. These findings highlight that inclusive financial systems are essential for achieving Sustainable Development Goals (SDGs) in developing regions. Similarly, ref. [6] found that only a limited set of SDG indicators can explain most of the variation in life satisfaction across countries, suggesting the need for a more focused and effective approach to sustainability measurement.
At the regional and local levels, ref. [7] emphasized the role of bottom-up initiatives in achieving SDGs in Africa, underscoring that polycentric governance combining both top-down and community-based approaches is key to effective implementation. Complementarily, ref. [8] applied Gradient Boosting Machine algorithms to identify the most influential SDGs based on income levels and geographic location, finding that “clean energy” and “climate action” goals dominate in higher-income economies, whereas “poverty reduction” and “clean water” remain critical in low-income countries.
Environmental and energy-related research also supports the multidimensionality of sustainable development. Ref. [9] demonstrated that African countries have not yet achieved strong decoupling between energy, water, and food production and greenhouse gas (GHG) emissions, revealing the urgent need for environmentally friendly infrastructure. In the same vein, ref. [10] proposed a comprehensive framework of 29 indicators to evaluate SDG-7 performance and found significant trade-offs between social and environmental indicators. These studies collectively affirm that sustainable energy transitions must balance economic access with ecological limits.
Methodologically, recent studies have adopted data-driven approaches such as network analysis and machine learning to reassess SDG performance. Ref. [11] used a network approach to analyze the interrelations between countries and SDGs, arguing that single composite indices are insufficient to capture the complexity of sustainable progress. Likewise, ref. [12] examined the efficiency of countries in achieving measurable SDG targets, highlighting the necessity of accountability and long-term evaluation frameworks. Expanding the scope further, ref. [13] linked the SDG Index to the Inclusive Wealth Index, revealing that responsible consumption (SDG 12), climate action (SDG 13), and clean energy (SDG 7) are the strongest predictors of wealth accumulation, reinforcing the economic-environmental interdependence of sustainability. Finally, ref. [14]embedded resilience assessment into the SDG framework, identifying the need for enhanced indicators to capture adaptive and systemic resilience dimensions, especially for post-2030 development agendas.
Overall, this growing body of literature demonstrates that sustainable development is not a static equilibrium but a dynamic interaction among economic growth, social inclusion, institutional resilience, and environmental stewardship. Despite the diversity of methodologies—from panel GMM estimations [5] to machine learning models [8,13] the collective evidence underscores that a holistic measure such as Adjusted Net Savings (ANS) remains vital for integrating these dimensions. This study contributes to this evolving literature by applying second-generation panel estimators that capture heterogeneity and cross-sectional dependence among African economies, providing a more realistic understanding of the complex dynamics driving sustainable development.
3. Data and Methodology
3.1. Data Description
This study investigates the determinants of sustainable development in African economies using a panel dataset covering ten countries: Egypt, Morocco, Tunisia, South Africa, Kenya, Tanzania, Uganda, Ghana, Senegal, and Botswana. The countries were selected based on data availability and their representativeness of Africa’s economic and environmental diversity. They collectively reflect varying patterns of growth, energy structure, and institutional development across the continent.
The dependent variable of the model is Adjusted Net Savings (ANS), expressed as a percentage of gross national income and excluding particulate emission damage. This indicator is considered one of the most comprehensive measures of sustainable development, as it integrates economic, environmental, and fiscal dimensions by accounting for natural resource depletion and environmental degradation.
The independent variables include CO2 intensity (carbon dioxide emissions per kilogram of oil equivalent energy use), GDP per capita (lnGDPpercapita), renewable energy consumption (RenEnergy), and trade openness (Tradeopen). These variables were selected based on the theoretical and empirical literature, which emphasizes their central role in the sustainability-growth nexus. CO2 intensity captures environmental efficiency in energy use; GDP per capita represents the level of economic development; renewable energy consumption reflects the progress in green energy transition; and trade openness measures the degree of external integration and its potential environmental implications.
All variables were obtained from the World Bank’s World Development Indicators (WDI) database and cover the period 1990–2020. The upper limit of the time span is determined by data availability, as the latest ANS observations were published in 2020. Therefore, the study does not capture the potential post-2020 effects of the global energy crisis, carbon pricing mechanisms, or green investment policies.
By integrating economic, environmental, and trade-related variables within a dynamic panel context, the study aims to provide an evidence-based understanding of how income growth, energy transition, and openness interact to shape sustainable development trajectories across the continent. The econometric tests and estimation techniques employed in the analysis are explained in detail in Section 3.2.
3.2. Econometric Framework
Given the panel structure of the data, the econometric analysis follows a multi-step approach designed to ensure reliable and consistent estimation in the presence of cross-sectional dependence, heterogeneity, and potential endogeneity across African economies.
The first step involves testing for cross-sectional dependence (CD) using the methodology developed by [15]. Since African countries are economically and environmentally interconnected through trade flows, energy markets, and regional climate shocks, neglecting such dependence could lead to biased standard errors and invalid inference.
Following this, slope heterogeneity is tested using the procedure of [16], which examines whether the estimated parameters differ significantly across cross-sections. Accounting for heterogeneity is essential, as structural and institutional differences among African economies may cause diverse responses to income growth and environmental pressures.
To determine the stationarity properties of the series, the Cross-sectionally Augmented IPS (CIPS) unit root test proposed by [17] is employed. This second-generation test corrects cross-sectional dependence by including the cross-sectional averages of lagged levels and first differences in the regression.
Once cointegration is established, long-run parameters are estimated using the Augmented Mean Group (AMG) estimator developed by [18,19]. The AMG estimator is particularly suitable for heterogeneous panels with cross-sectional dependence, as it accounts for unobserved common factors and produces consistent long-run coefficients across countries.
To assess causal linkages between sustainable development and its determinants, the [20] panel Granger causality test is employed. This method allows for heterogeneity in causal relationships across panel units and identifies the direction of influence among variables.
Given the potential endogeneity between economic growth, energy use, and sustainability indicators, the [21,22,23] endogeneity test is conducted. When endogeneity is detected, the System GMM estimator of [24,25] is applied as a robustness check. This estimator effectively handles endogeneity by combining equations in levels and first differences, using appropriate lagged instruments.
Finally, the Variance Inflation Factor (VIF) is computed to detect multicollinearity among regressors, ensuring the stability of coefficient estimates.
Overall, this econometric strategy integrates second-generation panel methods and dynamic estimators, providing a robust framework for analyzing the long- and short-run interactions among income, energy structure, trade openness, and sustainable development across African economies.
4. Empirical Findings
4.1. Cross-Sectional Dependence Test
The empirical analysis presents the results of the econometric tests and estimations described in Section 3.2. These findings are organized sequentially, starting with the diagnostic tests for cross-sectional dependence, slope heterogeneity, and unit roots, followed by long-run estimations, causality analysis, and robustness checks.
Before proceeding with the estimation, the presence of cross-sectional dependence among the variables was examined using the [15] CD test. This step is crucial, as economic, environmental, and trade linkages among African countries may cause shocks in one country to spill over to others, leading to correlated error terms and biased estimates if ignored. Table 1 presents the results of the cross-sectional dependence tests for all variables.
Table 1. Pesaran CD test results for cross-sectional dependence.
|
Variable |
CD |
p-Value |
CDw |
p-Value |
CDw+ |
p-Value |
CD * |
p-Value |
|---|---|---|---|---|---|---|---|---|
|
ANS |
0.43 |
0.667 |
−0.39 |
0.700 |
79.11 |
0.000 *** |
1.33 |
0.182 |
|
CO2 intensity |
−2.44 |
0.015 ** |
−1.19 |
0.233 |
121.30 |
0.000 *** |
3.95 |
0.000 *** |
|
lnGDP per capita |
34.09 |
0.000 *** |
3.53 |
0.000 *** |
232.19 |
0.000 *** |
−1.29 |
0.196 |
|
Renewable energy |
29.48 |
0.000 *** |
2.38 |
0.017 ** |
200.11 |
0.000 *** |
−13.73 |
0.000 *** |
|
Trade openness |
8.13 |
0.000 *** |
2.16 |
0.031 ** |
93.59 |
0.000 *** |
0.30 |
0.762 |
Note: *, **, and *** denote significance at the 10%, 5%, and 1% levels, respectively.
Table 1 presents the results of the cross-sectional dependence (CD) tests. Among the reported statistics, the CDw+ test proposed by [26] represents an enhanced version of the traditional [27] test, offering greater discriminatory power. This improvement is particularly relevant in panels with relatively small cross-sectional dimensions (in this study, N = 10, T = 31), where CDw+ provides more reliable evidence on the presence of dependence. Overall, the cross-sectional dependence tests clearly reject the null hypothesis of cross-sectional independence for the panel.
According to the results, the CDw+ statistics are statistically significant for all variables (p < 0.01), indicating a strong cross-sectional dependence among African countries. In other words, macroeconomic variables such as economic growth, energy use, trade, and environmental indicators are influenced by similar regional or global shocks. This finding implies that traditional fixed-effects models, which ignore cross-sectional dependence, may yield inconsistent estimates. Therefore, second-generation panel techniques that explicitly account for cross-sectional dependence are required to obtain robust and unbiased results.
Before estimating long-run relationships, it is important to determine whether the slope coefficients are homogeneous across panel units. The [16] slope heterogeneity test was applied to assess whether the relationships between sustainable development and its explanatory variables differ significantly among the selected African countries. The results of this test are presented in Table 2.
Table 2. Results of the Pesaran–Yamagata (2008) Slope Heterogeneity Test.
|
Test Statistic |
Value |
p-Value |
|---|---|---|
|
Δ (Delta) |
11.862 |
0.000 *** |
|
Δ_adj (Adjusted Delta) |
13.209 |
0.000 *** |
Notes: *** denote significance at the 1% levels.
According to the results of the slope heterogeneity test developed by [16], both the Delta and adjusted Delta (Δ_adj) statistics are statistically significant at the 1% level (p = 0.000). This finding indicates that the slope coefficients are not homogeneous across countries, meaning that the effects of explanatory variables on the dependent variable differ from one country to another.
In other words, factors such as trade openness, income per capita, renewable energy consumption, and carbon intensity exert varying magnitudes and directions of influence depending on each country’s unique economic and environmental structure. This result suggests that the dynamics of sustainable development in African countries cannot be explained by a single uniform model; instead, nations respond heterogeneously according to their structural characteristics.
Therefore, traditional panel estimators that assume parameter homogeneity, such as fixed-effects or pooled models, are not appropriate in this context. Instead, second-generation estimation techniques that account for heterogeneity should be used to ensure reliable, country-specific inferences.
4.2. Unit Root Test
To examine the stationarity properties of the variables while considering cross-sectional dependence, the Cross-Sectionally Augmented IPS (CIPS) panel unit root test developed by [17] was applied. This test accounts for potential cross-country correlations and is suitable for panels with both small N and large T dimensions. The results are presented in Table 3.
Table 3. Results of the CIPS Panel Unit Root Test.
|
Variable |
CIPS Statistic |
1% Critical Value |
5% Critical Value |
10% Critical Value |
Integration Order |
Result |
|---|---|---|---|---|---|---|
|
ANS—Adjusted Net Savings |
−5.273 *** |
−2.57 |
−2.33 |
−2.21 |
I(1) |
Stationary |
|
CO2 intensity |
−5.282 *** |
−2.57 |
−2.33 |
−2.21 |
I(1) |
Stationary |
|
lnGDP per capita |
−2.615 ** |
−2.55 |
−2.33 |
−2.21 |
I(0) |
Stationary |
|
Renewable energy consumption |
−4.772 *** |
−2.57 |
−2.33 |
−2.21 |
I(1) |
Stationary |
|
Trade openness |
−5.094 *** |
−2.57 |
−2.33 |
−2.21 |
I(1) |
Stationary |
Notes: **, and *** denote significance at the 5%, and 1% levels, respectively.
The results of the CIPS unit root test presented in Table 3 illustrate the stationarity properties of the variables included in the panel. Prior to the analysis, the results of the cross-sectional dependence (CD) test were found to be positive and significant, and slope heterogeneity was also detected. Overall, the CIPS unit root test results indicate a mixed order of integration across variables, with both I(0) and I(1) processes present in the panel. Therefore, the panel was deemed unsuitable for traditional first-generation unit root tests, and the second-generation CIPS test was employed instead.
According to the results, only the variable lnGDP per capita is stationary at level [I(0)], whereas all other variables—ANS, CO2 intensity, renewable energy consumption, and trade openness—become stationary after first differencing [I(1)]. This finding indicates the presence of mixed integration orders within the panel dataset and confirms that the use of the Augmented Mean Group (AMG) estimator is methodologically appropriate for the subsequent long-run analysis.
4.3. Augmented Mean Group (AMG) Test
To investigate the long-run relationship between sustainable development and its key determinants, the Augmented Mean Group (AMG) estimator developed by [19] was applied. This estimator accounts for both cross-sectional dependence and slope heterogeneity, making it suitable for heterogeneous panels such as the group of African countries analyzed in this study.
The long-run model can be expressed as follows:
|
```latexAN{S}_{it}={\alpha }_{i}+{\beta }_{1}{CO}_{2}intensit{y}_{it}+{\beta }_{2}lnGDPpercapit{a}_{it}+{\beta }_{3}RenEnerg{y}_{it}+{\beta }_{4}Tradeope{n}_{it}+{\epsilon }_{it}``` |
where $$AN{S}_{it}$$ represents adjusted net savings (a proxy for sustainable development) for country i at time t, and the explanatory variables denote carbon intensity, economic growth, renewable energy consumption, and trade openness, respectively.
The estimation results of the AMG model are presented in Table 4.
Table 4. AMG (Augmented Mean Group) Estimation Results. Dependent variable: Adjusted Net Savings (ANS).
|
Variable |
Coefficient |
Std. Error |
z |
p-Value |
[95% Confidence Interval] |
|---|---|---|---|---|---|
|
CO2 intensity |
−2.4374 |
8.8260 |
−0.28 |
0.782 |
[−19.7361, 14.8613] |
|
lnGDP per capita |
31.2785 |
14.6360 |
2.14 |
0.033 ** |
[2.5924, 59.9645] |
|
Renewable energy consumption |
−0.3800 |
0.1565 |
−2.43 |
0.015 ** |
[−0.6868, −0.0732] |
|
Trade openness |
0.0228 |
0.0286 |
0.80 |
0.426 |
[−0.0333, 0.0789] |
|
Common dynamic process |
0.9189 |
0.3123 |
2.94 |
0.003 *** |
[0.3068, 1.5310] |
|
Country-specific trend |
−0.1808 |
0.3011 |
−0.60 |
0.548 |
[−0.7710, 0.4093] |
|
Constant |
−189.5637 |
118.6385 |
−1.60 |
0.110 |
[−422.0909, 42.9634] |
Wald χ2(4) = 11.17, Prob > χ2 = 0.0247, RMSE = 2.7945. Share of significant country-specific trends: 0.400. **, and *** denote significance at the 5%, and 1% levels, respectively.
The long-run AMG estimation results presented in Table 4 indicate that the key determinants of sustainable development—represented by Adjusted Net Savings (ANS)—in African countries are per capita income and renewable energy consumption. The coefficient of per capita income (lnGDPpercapita) is positive and statistically significant (β = 31.28; p = 0.033), implying that economic growth enhances sustainable savings in the long run. In other words, as income levels rise, countries become more capable of internalizing environmental costs. This finding suggests that higher income levels strengthen the capacity to finance environmentally friendly policies and promote environmental sustainability.
Conversely, the coefficient of renewable energy consumption (RenEnergy) is negative and significant (β = −0.38; p = 0.015), indicating that renewable energy investments in African countries have not yet reached sufficient efficiency levels during the period under review, or that they still entail high short-term costs. This may reflect that, at the early stages of energy transition, factors such as financing burdens and technological dependence exert short-term adverse effects on sustainable savings indicators.
The coefficients of carbon intensity (CO2 intensity) and trade openness (Trade openness) are statistically insignificant. This result implies that the impacts of carbon efficiency and trade integration on sustainable development vary across countries and that no homogeneous relationship exists across the panel due to structural and institutional differences. However, the significance of the common dynamic process coefficient (p = 0.003) confirms that sustainability indicators in African countries are jointly influenced by shared regional factors or global shocks—such as fluctuations in energy prices, shifts in climate policies, or volatility in foreign aid flows.
Overall, the AMG estimator, which accounts for cross-sectional dependence and heterogeneity, provides robust evidence of long-run relationships. The findings suggest that economic growth supports sustainable development, whereas renewable energy use has not yet produced the expected positive effect in the current period. This highlights that the energy transition process in African countries remains in its early stages and that achieving stronger sustainable growth requires transforming renewable energy investments toward greater efficiency.
4.4. Country-Specific AMG Estimates
While the pooled AMG estimation provides the overall long-run relationships for the entire panel, it may mask heterogeneity across countries. Therefore, country-specific AMG estimates were computed to capture how the effects of carbon intensity, income, renewable energy, and trade openness on sustainable development vary among African economies.
The detailed results for each country are presented in Table 5, and supplementary diagnostics are provided in the Appendix A.
Table 5. Country-Specific AMG Estimates. Dependent variable: Adjusted Net Savings (ANS).
|
Country/ Variable |
Egypt |
Morocco |
Tunisia |
South Africa |
Kenya |
Tanzania |
Uganda |
Ghana |
Senegal |
Botswana |
|---|---|---|---|---|---|---|---|---|---|---|
|
CO2 Intensity |
−22.05 (0.38) |
4.09 (0.83) |
−76.15 * (0.06) |
14.47 *** (0.00) |
−20.51 (0.88) |
216.67 *** (0.00) |
−265.37 *** (0.00) |
−12.49 (0.67) |
−6.42 (0.56) |
−6.77 (0.66) |
|
lnGDP per capita |
−19.09 (0.25) |
10.76 * (0.07) |
−24.61 * (0.09) |
−22.47 (0.18) |
73.41 (0.12) |
128.46 *** (0.00) |
32.29 *** (0.00) |
28.80 ** (0.01) |
44.28 *** (0.00) |
−14.94 (0.43) |
|
Renewable Energy |
−0.08 (0.97) |
0.52 ** (0.04) |
−2.42 *** (0.00) |
−1.05 ** (0.02) |
−0.19 (0.91) |
5.74 *** (0.00) |
−2.12 (0.26) |
0.07 (0.76) |
−0.06 (0.64) |
−0.26 (0.50) |
|
Trade Openness |
0.14 ** (0.02) |
0.16 (0.13) |
−0.10 (0.20) |
−0.11 (0.24) |
0.58 *** (0.00) |
−0.64 *** (0.00) |
−0.02 (0.92) |
0.01 (0.85) |
−0.01 (0.86) |
0.23 ** (0.02) |
|
Cross-sectional Mean (R_c) |
0.04 (0.87) |
0.87 *** (0.00) |
0.86 *** (0.00) |
−0.21 (0.28) |
1.90 *** (0.00) |
1.29 *** (0.00) |
1.55 *** (0.00) |
2.04 *** (0.00) |
−0.10 (0.62) |
1.47 *** (0.00) |
|
Sabit (Constant) |
169.20 (0.30) |
−79.38 * (0.10) |
304.61 ** (0.04) |
189.83 (0.19) |
−531.56 (0.27) |
−1365.40 *** (0.00) |
32.26 (0.90) |
−201.72 ** (0.03) |
−297.24 *** (0.00) |
149.52 (0.40) |
Note: Detailed group-specific results are presented in Appendix A. Values in parentheses indicate p-values. *, **, and *** denote significance levels at 10%, 5%, and 1%, respectively.
The country-specific AMG estimation results reveal a clear heterogeneity among the ten African countries. The dynamics of sustainable development differ across countries, depending on their economic structures and energy policies.
Tanzania shows a positive and significant relationship between per capita income, renewable energy use, and adjusted net savings, highlighting the role of energy diversification and growth-oriented investments in enhancing sustainable savings. This finding is consistent with Tanzania’s recent infrastructure investments in the energy sector.
In Uganda and Tunisia, the negative and significant coefficients of carbon intensity and renewable energy suggest that the energy transition process has short-term costs. The lack of energy efficiency and infrastructural challenges associated with the transition appear to constrain sustainable savings.
Kenya and Botswana stand out as countries where trade openness positively affects sustainable savings. This indicates that trade integration fosters capital accumulation and environmentally friendly investments. In the case of Kenya, international trade likely contributes indirectly to growth through the importation of green technologies and the inflow of financing.
Conversely, in more industrialized and carbon-intensive economies such as South Africa and Egypt, the relationships between income, energy, and ANS are weak or negative. Since economic growth in these countries largely depends on fossil fuels, structural pressures on sustainable savings indicators persist.
Finally, the positive and significant common dynamic process coefficient in most countries suggests the presence of shared macroeconomic and environmental dynamics across the region. This implies that common factors—such as commodity prices, foreign investment flows, or regional environmental policies—play a role in shaping long-term sustainable growth trends.
Beyond the sign and significance of the coefficients, these results point to distinct structural mechanisms shaping sustainable development across African economies.
From an analytical perspective, the observed heterogeneity across countries reflects differences in energy transition capacity, trade integration, and structural dependence on fossil fuels. Countries such as Tanzania, where renewable energy investments are embedded within broader infrastructure expansion, appear better positioned to translate income growth and energy diversification into sustainable savings.
In contrast, negative coefficients for renewable energy and carbon intensity in countries such as Uganda and Tunisia suggest the presence of transition-related adjustment costs. Limited grid capacity, financing constraints, and low energy efficiency can cause renewable energy investments to reduce adjusted net savings in the short run, even when they are environmentally desirable.
The positive role of trade openness in Kenya and Botswana indicates that external integration can mitigate these transition costs by facilitating access to cleaner technologies, foreign capital, and environmentally efficient production methods. Conversely, in carbon-intensive and industrialized economies such as South Africa and Egypt, the persistence of fossil-fuel-based growth models constrains improvements in sustainability indicators, weakening the link between income growth and adjusted net savings.
Finally, the significance of the common dynamic process across most countries suggests that national sustainability outcomes are also shaped by shared regional and global forces, including commodity price cycles, cross-border investment flows, and common environmental pressures.
4.5. Reliability Tests
4.5.1. Durbin–Wu–Hausman Test
To ensure the robustness of the empirical results, potential endogeneity problems were examined using the [21,22,23] (DWH) test. This test evaluates whether the explanatory variables are correlated with the error term, which would bias the parameter estimates. In this study, CO2 intensity was treated as a potentially endogenous variable, and its second lag (L2.CO2 intensity) was used as an instrument within the IV–FE framework. The test results are reported in Table 6.
Table 6. Endogeneity Test Results (Durbin–Wu–Hausman Test).
|
Model |
Endogenous Variable |
Instrument(s) |
Coefficient |
Std. Error |
z-Value |
p-Value |
Conclusion |
|---|---|---|---|---|---|---|---|
|
IV–FE (xtivreg2) |
CO2 intensity |
L2.CO2 intensity |
39.260 |
6.612 |
5.94 |
0.0139 ** |
Endogeneity detected |
Notes: ** denotes significance levels at 5%.
According to the results of the Durbin–Wu–Hausman (DWH) endogeneity test, the variable representing carbon intensity (CO2 intensity) was found to be significantly endogenous (χ2(1) = 6.05, p < 0.05). The selected instrumental variable, the second lag of CO2 intensity, is statistically strong, with a first-stage F-statistic of 501.58, which far exceeds the Stock–Yogo critical value of 16.38. Moreover, the Anderson LM test (χ2 = 180.61, p < 0.01) confirms that the model is properly identified, while the Sargan test validates the exogeneity and relevance of the chosen instrument.
These findings indicate the presence of a potential endogeneity problem in the model, thereby providing a methodological justification for employing the System GMM estimator to obtain consistent and unbiased long-run parameter estimates.
4.5.2. System GMM Estimation
Following the detection of endogeneity in the previous section, both Difference GMM and System GMM estimations were performed to obtain consistent and efficient parameter estimates. The System GMM estimator proposed by [24,28] combines equations in levels and first differences, improving efficiency and addressing the potential bias arising from endogenous regressors. The estimation results are summarized in Table 7.
Table 7. Difference and System GMM Estimation Results. Dependent variable: ANS (Adjusted Net Savings).
|
Variable |
Difference GMM Coefficient |
p-Value |
System GMM Coefficient |
p-Value |
|---|---|---|---|---|
|
L.ANS |
0.9492 |
0.001 *** |
0.7964 |
0.000 *** |
|
lnGDP per capita |
6.4326 |
0.089 * |
1.6445 |
0.242 |
|
Renewable energy consumption |
−0.1065 |
0.431 |
−0.0157 |
0.598 |
|
CO2 intensity |
−8.4461 |
0.090 * |
−3.2505 |
0.121 |
|
Trade openness |
−0.0234 |
0.681 |
−0.0089 |
0.730 |
|
Constant |
— |
— |
−7.7239 |
0.415 |
|
AR(1) test (p-value) |
0.019 |
0.013 |
||
|
AR(2) test (p-value) |
0.087 |
0.116 |
||
|
Sargan test (p-value) |
0.131 |
0.347 |
||
|
Hansen test (p-value) |
0.049 |
0.191 |
||
|
Number of instruments |
6 |
8 |
||
|
Number of groups (countries) |
10 |
10 |
||
|
Number of observations |
290 |
300 |
Notes: *** p < 0.01, * p < 0.05, p < 0.10. AR(1) and AR(2) denote the Arellano–Bond tests for first- and second-order serial correlation in the first-differencedresiduals. The Sargan and Hansen tests assess the validity of the instruments. The insignificant AR(2) test and the valid Hansen test confirm the absence of second-order autocorrelation and the overall reliability of the instruments, indicating that the System GMM results are robust and consistent.
According to the results of both the Difference GMM and System GMM estimations, the lagged value of ANS is positive and highly significant, indicating that sustainable development is a dynamic and path-dependent process. The variable lnGDP per capita is positive and statistically significant at the 10% level in the Difference GMM model, suggesting that economic growth contributes to sustainable development in the long run.
The coefficient of CO2 intensity is negative in both models and statistically significant at the 10% level in the Difference GMM estimation, implying that improvements in carbon efficiency enhance environmental savings. In contrast, renewable energy consumption (RenEnergy) and trade openness (Tradeopen) are statistically insignificant in both models, indicating that their short-term effects on sustainable development remain limited within the sample period.
The AR(1) and AR(2) tests confirm the absence of autocorrelation, while the Hansen and Sargan tests verify the validity of the instrumental variables. Therefore, the GMM estimations corroborate the robustness of the AMG findings, confirming the consistency of the long-run relationships obtained through different estimation techniques.
4.5.3. Multicollinearity Test
Before interpreting the regression coefficients, it is important to verify that there is no multicollinearity among the explanatory variables, as high intercorrelation can distort the estimated parameters. To assess this, the Variance Inflation Factor (VIF) test was applied, and the results are presented in Table 8.
Table 8. Results of the Multicollinearity Test (VIF).
|
Variable |
VIF |
1/VIF |
|---|---|---|
|
lnGDP per capita |
5.16 |
0.1938 |
|
Renewable energy consumption |
3.97 |
0.2517 |
|
CO2 intensity |
3.30 |
0.3031 |
|
Trade openness |
2.01 |
0.4982 |
|
Mean VIF |
3.61 |
Note: All VIF values are below the commonly accepted threshold of 10, indicating that multicollinearity is not a concern in the estimated models. Therefore, the explanatory variables are sufficiently independent to provide reliable coefficient estimates.
The possibility of multicollinearity was evaluated using the Variance Inflation Factor (VIF) test. The results indicate that all independent variables have VIF values below the threshold of 10, with an average VIF of 3.61. This finding suggests that there is no serious multicollinearity problem in the model and that the estimated coefficients are reliable and stable.
4.6. Panel Granger Causality Test
To identify the direction of causal relationships among the variables, the [20] panel causality test was employed. This test is suitable for heterogeneous panels with cross-sectional dependence and allows for country-specific variations in causal dynamics. The results are summarized in Table 9.
Table 9. Dumitrescu–Hurlin Panel Granger Causality Test Results.
|
Causality Direction |
W-Bar |
Z-Bar |
p-Value |
Conclusion |
|---|---|---|---|---|
|
CO2 intensity → ANS |
3.2675 |
5.0703 |
0.0000 *** |
Causality confirmed |
|
ANS → CO2 intensity |
1.0197 |
0.0442 |
0.9648 |
No causal relationship |
|
Renewable energy → ANS |
1.9189 |
2.0546 |
0.0399 ** |
Causality confirmed |
|
ANS → Renewable energy |
0.9861 |
−0.0311 |
0.9752 |
No causal relationship |
|
Trade openness → ANS |
1.1362 |
0.3045 |
0.7607 |
No causal relationship |
|
ANS → Trade openness |
1.1781 |
0.3983 |
0.6904 |
No causal relationship |
|
lnGDP per capita → ANS |
2.7233 |
3.8533 |
0.0001 *** |
Causality confirmed |
|
ANS → lnGDP per capita |
5.6234 |
10.3383 |
0.0000 *** |
Bidirectional causality |
|
Renewable energy → CO2 intensity |
1.9021 |
2.0171 |
0.0437 ** |
Causality confirmed |
|
CO2 intensity → Renewable energy |
1.5908 |
1.3211 |
0.1865 |
No causal relationship |
|
Trade openness → CO2 intensity |
2.6423 |
3.6724 |
0.0002 *** |
Causality confirmed |
|
CO2 intensity → Trade openness |
3.9511 |
6.5989 |
0.0000 *** |
Bidirectional causality |
|
lnGDP per capita → CO2 intensity |
3.0603 |
4.6070 |
0.0000 *** |
Causality confirmed |
|
CO2 intensity → lnGDP per capita |
2.3380 |
2.9918 |
0.0028 *** |
Bidirectional causality |
|
Trade openness → Renewable energy |
1.5909 |
1.3214 |
0.1864 |
No causal relationship |
|
Renewable energy → Trade openness |
2.0381 |
2.3213 |
0.0203 ** |
Causality confirmed |
|
lnGDP per capita → Renewable energy |
3.1460 |
4.7986 |
0.0000 *** |
Causality confirmed |
|
Renewable energy → lnGDP per capita |
4.2284 |
7.2189 |
0.0000 *** |
Bidirectional causality |
|
lnGDP per capita → Trade openness |
3.6993 |
6.0359 |
0.0000 *** |
Causality confirmed |
|
Trade openness → lnGDP per capita |
1.1153 |
0.2577 |
0.7966 |
No causal relationship |
Note: ** and *** denote significance levels at 5%, and 1%, respectively.
The panel Granger causality analysis reveals significant short-run interactions among the variables included in the model. The results presented in Table 9 indicate a bidirectional causal relationship between Adjusted Net Savings (ANS) and real GDP per capita (lnGDPpercapita). This finding implies that economic growth enhances sustainable savings, while sustainable resource management simultaneously reinforces growth dynamics.
A unidirectional causal relationship is identified from carbon intensity (CO2intencity) to ANS, suggesting that environmental pressures and carbon-intensive production structures play a decisive role in shaping sustainable savings in the short run.
Renewable energy consumption (RenEnergy) is found to be a significant Granger cause of ANS, while no reverse causality is observed. This indicates that the use of renewable energy sources contributes positively to sustainable savings.
No causal relationship is detected between trade openness (Tradeopen) and ANS, suggesting that the expansion of trade volume affects sustainable savings indirectly rather than through a direct channel.
Further results show bidirectional causality between carbon intensity (CO2intencity) and trade openness (Tradeopen), as well as between real GDP per capita (lnGDPpercapita) and carbon intensity (CO2intencity). Additionally, a strong reciprocal interaction exists between real GDP per capita and renewable energy consumption, while unidirectional causality runs from renewable energy consumption to trade openness and from real GDP per capita to trade openness.
Overall, the causality analysis demonstrates that economic growth, energy transition, and carbon intensity are mutually interdependent variables, whereas trade openness acts as an indirect factor shaping these sustainability dynamics.
From a policy perspective, these causality patterns provide important insights into the design of sustainability-oriented development strategies in Africa. The bidirectional causality between economic growth and adjusted net savings highlights that policies fostering growth quality—rather than growth quantity alone—are central to long-term sustainability. This underscores the importance of integrating environmental considerations into macroeconomic planning, rather than treating sustainability as a secondary objective.
The bidirectional causal relationship between trade openness and carbon intensity suggests that trade expansion and environmental pressure evolve jointly. This finding supports the case for sector-specific carbon standards and green export requirements in carbon-intensive industries, ensuring that trade-driven growth does not undermine sustainability outcomes.
The unidirectional causality running from renewable energy consumption to adjusted net savings indicates that renewable energy policies influence sustainability primarily through their impact on resource savings rather than immediate feedback effects. This calls for phased renewable energy integration strategies, supported by de-risking instruments and targeted public investment, particularly in countries facing grid constraints and limited fiscal space.
Finally, the presence of shared dynamic interactions among income, energy, and carbon intensity points to the relevance of regional coordination mechanisms. Strengthening regional energy markets, harmonizing environmental standards, and coordinating green finance initiatives could help African economies internalize common shocks and enhance the sustainability benefits of growth and trade integration.
5. Discussion
This study investigates the determinants of sustainable development in African countries for the period 1990–2020 using panel data methods. The findings reveal that the relationships among economic growth, energy use, trade openness, and carbon intensity differ across both the long-term and short-term dynamics.
The long-run analysis based on the Augmented Mean Group (AMG) estimator identifies real GDP per capita (lnGDPpercapita) as a key determinant of sustainable development (ANS). The positive and statistically significant coefficient of income level indicates that economic growth supports structural transformations that reduce environmental costs and make savings more sustainable in the long run. In contrast, the negative and significant coefficient of renewable energy consumption (RenEnergy) suggests that renewable energy policies in African countries have not yet matured enough to generate economic efficiency and may impose cost pressures in the short term. This finding points to the adverse effects of deficiencies in energy infrastructure and limited financing capacity on sustainability.
The negative short-run effect of renewable energy consumption on adjusted net savings does not contradict the long-term sustainability potential of renewable energy, but rather reflects the transitional costs commonly observed in developing economies. Renewable energy investments typically involve high upfront capital requirements, which may temporarily crowd out other productivity-enhancing public expenditures such as education, health, and infrastructure—components that directly contribute to adjusted net savings [3,29].
Moreover, early-stage renewable energy adoption in countries with limited grid capacity often generates efficiency constraints due to intermittency and the continued need for costly backup generation. These structural inefficiencies increase short-run system costs and reduce net savings, particularly in African economies where energy systems remain heavily dependent on fossil fuels and institutional capacity is uneven [2,30]. In addition, the gradual decommissioning of carbon-intensive energy assets during the transition phase may result in stranded capital losses, which are directly captured by the adjusted net savings indicator [31].
Recent empirical studies focusing on developing and emerging economies confirm that the sustainability benefits of renewable energy investments tend to materialize only in the long run, once technological efficiency improves and complementary investments in infrastructure, governance, and financing mechanisms are established [32]. Accordingly, the observed negative short-run relationship reflects the cost of transition rather than a failure of renewable energy policies, highlighting the importance of sequencing and institutional readiness in Africa’s sustainable development process.
The country-specific AMG estimates reveal substantial heterogeneity in the determinants of sustainable development across African economies. In relatively diversified or higher-income countries such as Kenya and Morocco, trade openness and income per capita exhibit positive associations with adjusted net savings, suggesting that external integration and income growth contribute to sustainability when supported by broader economic structures.
In contrast, energy-import-dependent and lower-income countries such as Uganda and Tanzania display negative or mixed effects of renewable energy consumption and carbon intensity, indicating that transition-related costs and structural constraints dominate in the short run. These countries face higher financing burdens and limited institutional capacity, which may reduce sustainable savings during the early stages of energy transition.
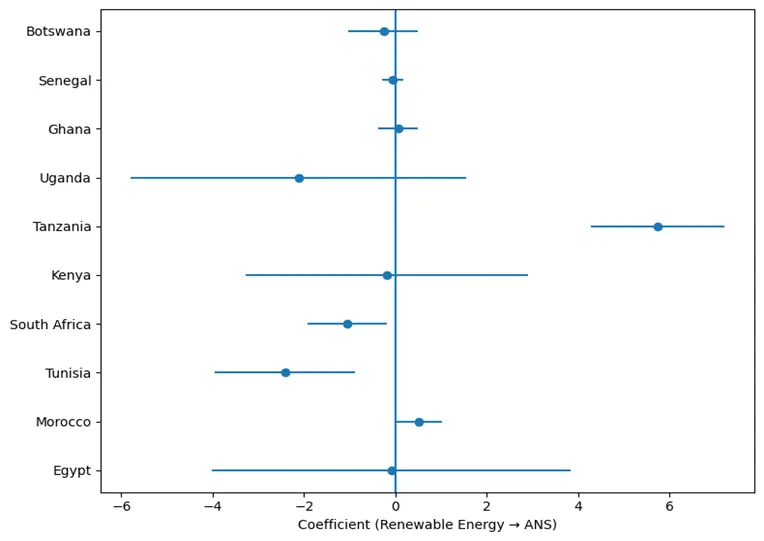
Resource- and carbon-intensive economies, including South Africa, show weaker or statistically insignificant links between economic growth and adjusted net savings, reflecting the persistence of fossil-fuel-based production structures. Overall, the heterogeneity observed across countries underscores that the sustainability-growth nexus in Africa is highly context-dependent and shaped by differences in income levels, energy structures, and trade integration rather than following a uniform pattern. The heterogeneity of renewable energy effects across African countries is further illustrated in Figure A1 in the Appendix A, which presents a forest plot of country-specific AMG coefficients.
Country-specific AMG results show that, in relatively advanced economies such as South Africa, Morocco, and Kenya, higher per capita income positively influences sustainable development. Conversely, in energy-import-dependent countries such as Tanzania, Uganda, and Ghana, renewable energy investments tend to create short-term costs, reducing ANS values. These differences highlight the heterogeneous nature of institutional capacity, access to technology, and energy efficiency levels across African economies.
The Dumitrescu–Hurlin panel causality test clarifies the direction of dynamic interactions between variables. The results indicate a bidirectional causality between sustainable development and per capita income, suggesting that growth and sustainability are mutually reinforcing processes. Moreover, the bidirectional causality between carbon intensity and trade openness implies that the environmental impacts of trade depend on each country’s production structure. On the other hand, renewable energy consumption is found to be a Granger cause of sustainable development, while the reverse relationship is not confirmed. This finding implies that the energy transition plays a decisive role in shaping development policies, but sustainability has not yet become a feedback factor influencing the energy structure.
The econometric robustness of the model is supported by diagnostic tests. The Durbin–Wu–Hausman test confirms that carbon intensity (CO2 intensity) is endogenous; therefore, the System GMM estimator was employed. The GMM results show that the effect of income loses statistical significance in the short run, while carbon intensity continues to negatively influence sustainability. This indicates that income growth supports sustainable development in the long term, but its short-term impact remains limited. Furthermore, the Hansen and Sargan tests confirm the validity of the instrumental variables, and the AR(2) test indicates no autocorrelation in the model.
Finally, the Variance Inflation Factor (VIF) results show that all variables have VIF values below 10 (mean VIF = 3.61), suggesting that there is no serious multicollinearity problem and that the estimated coefficients are stable and reliable.
Overall, the findings indicate that income level is the main determinant of sustainable development in African countries, but the effectiveness of the energy transition varies across nations. Although renewable energy investments hold strong potential to enhance environmental sustainability in the long run, their current impact remains limited due to efficiency and financing constraints. These results emphasize that green growth strategies in Africa should not focus solely on energy supply but also on institutional capacity, technology transfer, and trade structure integration to ensure long-term sustainability.
6. Policy Recommendation
The empirical findings of this study indicate that sustainable development outcomes in African economies depend not only on the pace of economic growth but also on the sequencing and institutional context of energy transition and trade integration.
The findings of this study reveal that sustainable development in African countries depends not only on economic growth itself but also on the quality of growth and the existence of policies that emphasize environmental sustainability. The positive effect of per capita income on sustainable development suggests that growth strategies must be reoriented toward a structure that internalizes environmental costs, enhances resource efficiency, and promotes green industries. The short-term negative impact of renewable energy consumption indicates that investments in this sector remain costly and inefficient, reflecting challenges related to technology, infrastructure, and financing. Therefore, for the energy transition to succeed in Africa, greater emphasis should be placed on access to finance, local technology production, maintenance capacity, and infrastructure development.
The bidirectional causality between trade openness and carbon intensity highlights the need to integrate trade policies with environmental standards. In African economies where exports are dominated by carbon-intensive sectors, aligning with green trade standards would not only build resilience against global carbon regulations but also create new competitive advantages. However, considerable heterogeneity among countries—mainly stemming from differences in institutional capacity—must be acknowledged. The effectiveness of sustainability policies will increase only when technical and economic measures are supported by strong governance mechanisms, transparent data systems, and accountable environmental institutions.
Finally, the significant shared dynamic processes observed in the study suggest that sustainable development indicators are interrelated across African countries at the regional level. This underscores the necessity of strengthening regional cooperation mechanisms in areas such as energy security, green investment funds, carbon markets, and technology sharing. Hence, the success of sustainable development policies depends not only on national-level initiatives but also on coordinated regional action to ensure collective progress toward environmental and economic sustainability.
7. Conclusions
This study analyzed the determinants of sustainable development in selected African countries over the period 1990–2020 by examining the long- and short-run interactions among economic growth, energy structure, trade openness, and carbon intensity. The findings demonstrate that sustainable development in African economies is a multidimensional process shaped by the interaction of economic, environmental, and institutional factors rather than by growth dynamics alone.
The AMG estimation results indicate that income per capita positively influences sustainable development, while renewable energy consumption does not yet deliver the expected contribution in the short run. This suggests that although economic growth can internalize environmental costs over time, the ongoing energy transition in many African countries has not yet surpassed the efficiency threshold. Country-specific results further reveal that sustainability outcomes improve in higher-income economies, whereas renewable energy investments in some countries generate short-term cost pressures due to technological, financial, and infrastructural constraints.
The causality analysis provides additional insights into these dynamics. The bidirectional relationship between adjusted net savings and income per capita confirms that economic growth and sustainability reinforce each other over time. At the same time, the bidirectional linkage between carbon intensity and trade openness highlights the environmental risks embedded in trade-driven growth processes. These findings underscore the importance of designing green trade strategies and redirecting export structures toward less carbon-intensive and environmentally sustainable sectors.
From a policy perspective, the results emphasize that sustainable development in Africa depends not merely on the pace of economic growth, but on the quality, composition, and institutional embedding of that growth. Ensuring that income expansion translates into long-term sustainability requires transforming growth models toward structures that reduce environmental costs, enhance resource efficiency, and support the effective diffusion of renewable energy technologies. In this context, international cooperation and regional financing mechanisms play a critical role in alleviating the short-term cost burden of energy transition. Moreover, aligning trade policies with environmental standards can simultaneously mitigate carbon emissions and strengthen the competitiveness of African economies within global value chains.
Overall, this study shows that achieving sustainable development in Africa requires a balanced and integrated approach that jointly addresses economic growth, energy transition, and trade policy within a coherent institutional framework. Embedding environmental sustainability goals into macroeconomic planning and strengthening regional coordination mechanisms emerge as central priorities for advancing long-term green growth across the continent.
8. Limitations and Future Research
The main limitation of this study is that the dataset used ends in 2020. The most recent data for the Adjusted Net Savings (ANS) indicator, published by the World Bank, is available only up to that year. Consequently, all variables included in the analysis are restricted to the period 1990–2020. Therefore, the effects of recent developments—such as the global energy crisis, the expansion of carbon pricing mechanisms, and the rise of green investment trends—on African economies fall outside the scope of this study. This data constraint may be particularly relevant for the estimated effects of renewable energy, as the acceleration of renewable investments after 2020 could alter the short-run cost dynamics observed in the analysis.
Additionally, limited data consistency across countries may have led to measurement discrepancies, particularly for indicators related to renewable energy and carbon intensity. While the model effectively captures long-run relationships, these limitations may constrain its ability to fully reflect short-term adjustment shocks and policy-induced transitions.
Future research should aim to extend the dataset as new information becomes available, thereby incorporating the post-2020 period and allowing for a more comprehensive assessment of post-COVID-19 energy transitions and green finance policies. To address potential data lags in ANS, alternative sustainability indicators such as the Inclusive Wealth Index or composite Sustainable Development Goal (SDG) indices could be employed. Moreover, future studies could deepen analysis by integrating measures of institutional quality, disaggregated renewable energy sources, and sector-specific data on carbon taxation, green investment flows, and trade structures, thereby offering a more nuanced understanding of sustainable development pathways in African economies.
Appendix A. Group-Specific Coefficients
Table A1. Egypt.
|
Variable |
Coef. |
Std. Err. |
z |
p > |z| |
[95% Conf. Interval] |
|---|---|---|---|---|---|
|
CO2intencity |
−22.05113 |
25.05153 |
−0.88 |
0.379 |
−71.15122–27.04897 |
|
lnGDPpercapita |
−19.08895 |
16.65009 |
−1.15 |
0.252 |
−51.72252–13.54462 |
|
RenEnergy |
−0.0840001 |
2.003135 |
−0.04 |
0.967 |
−4.010073–3.842072 |
|
Tradeopen |
0.1430526 |
0.0624607 |
2.29 |
0.022 |
0.020632–0.2654733 |
|
__00000R_c |
0.0449944 |
0.2839937 |
0.16 |
0.874 |
−0.511623–0.6016119 |
|
_cons |
169.1971 |
162.3106 |
1.04 |
0.297 |
−148.9259–487.3201 |
Table A2. Morocco.
|
Variable |
Coef. |
Std. Err. |
z |
p > |z| |
[95% Conf. Interval] |
|---|---|---|---|---|---|
|
CO2intencity |
4.090001 |
18.58652 |
0.22 |
0.826 |
−32.3389–40.5189 |
|
lnGDPpercapita |
10.76105 |
5.851792 |
1.84 |
0.066 * |
−0.7082524–22.23035 |
|
RenEnergy |
0.5150033 |
0.2561508 |
2.01 |
0.044 ** |
0.0129569–1.01705 |
|
Tradeopen |
0.1561332 |
0.1031969 |
1.51 |
0.130 |
−0.0461289–0.3583954 |
|
__00000R_c |
0.8654355 |
0.2921119 |
2.96 |
0.003 *** |
0.2929068–1.437964 |
|
_cons |
−79.38412 |
47.95081 |
−1.66 |
0.098 * |
−173.366–14.59774 |
Notes: ***, **, and * denote statistical significance at the 1%, 5%, and 10% levels, respectively.
Table A3. Tunisia.
|
Variable |
Coef. |
Std. Err. |
z |
p > |z| |
[95% Conf. Interval] |
|---|---|---|---|---|---|
|
CO2intencity |
−76.14594 |
40.31124 |
−1.89 |
0.059 * |
−155.1545–2.862645 |
|
lnGDPpercapita |
−24.60867 |
14.31079 |
−1.72 |
0.086 * |
−52.65731–3.439967 |
|
RenEnergy |
−2.422778 |
0.7851717 |
−3.09 |
0.002 *** |
−3.961686–−0.8838696 |
|
Tradeopen |
−0.0960039 |
0.0751399 |
−1.28 |
0.201 |
−0.2432753–0.0512676 |
|
__00000R_c |
0.8554903 |
0.2838865 |
3.01 |
0.003 *** |
0.2990829–1.411898 |
|
_cons |
304.6131 |
148.8563 |
2.05 |
0.041 ** |
12.86017–596.366 |
Notes: ***, **, and * denote statistical significance at the 1%, 5%, and 10% levels, respectively.
Table A4. South Africa.
|
Variable |
Coef. |
Std. Err. |
z |
p > |z| |
[95% Conf. Interval] |
|---|---|---|---|---|---|
|
CO2intencity |
14.47222 |
3.992863 |
3.62 |
0.000 *** |
6.646351–22.29809 |
|
lnGDPpercapita |
−22.47361 |
16.57491 |
−1.36 |
0.175 |
−54.95983–10.01261 |
|
RenEnergy |
−1.050502 |
0.4443552 |
−2.36 |
0.018 ** |
−1.921423–−0.1795821 |
|
Tradeopen |
−0.1058848 |
0.0897626 |
−1.18 |
0.238 |
−0.2818162–0.0700466 |
|
__00000R_c |
−0.209719 |
0.1929802 |
−1.09 |
0.277 |
−0.5879532–0.1685152 |
|
_cons |
189.8267 |
145.3782 |
1.31 |
0.192 |
−95.10936–474.7628 |
Notes: *** and ** denote statistical significance at the 1% and 5%, respectively.
Table A5. Kenya.
|
Variable |
Coef. |
Std. Err. |
z |
p > |z| |
[95% Conf. Interval] |
|---|---|---|---|---|---|
|
CO2intencity |
−20.50949 |
134.2845 |
−0.15 |
0.879 |
−283.7022–242.6832 |
|
lnGDPpercapita |
73.40756 |
47.00774 |
1.56 |
0.118 |
−18.72592–165.541 |
|
RenEnergy |
−0.1863119 |
1.579386 |
−0.12 |
0.906 |
−3.281853–2.909229 |
|
Tradeopen |
0.5817678 |
0.1330642 |
4.37 |
0.000 *** |
0.3209668–0.8425688 |
|
__00000R_c |
1.896033 |
0.4373269 |
4.34 |
0.000 *** |
1.038888–2.753178 |
|
_cons |
−531.5589 |
476.8953 |
−1.11 |
0.265 |
−1466.257–403.1388 |
Notes: *** denotes statistical significance at the 1% level, respectively.
Table A6. Tanzania.
|
Variable |
Coef. |
Std. Err. |
z |
p > |z| |
[95% Conf. Interval] |
|---|---|---|---|---|---|
|
CO2intencity |
216.6668 |
41.7958 |
5.18 |
0.000 *** |
134.7485–298.5851 |
|
lnGDPpercapita |
128.4642 |
10.8977 |
11.79 |
0.000 *** |
107.1051–149.8233 |
|
RenEnergy |
5.744576 |
0.7479443 |
7.68 |
0.000 *** |
4.278633–7.21052 |
|
Tradeopen |
−0.6443075 |
0.1165455 |
−5.53 |
0.000 *** |
−0.8727324–−0.4158826 |
|
__00000R_c |
1.286608 |
0.4532007 |
2.84 |
0.005 *** |
0.3983515–2.174865 |
|
_cons |
−1365.404 |
133.3383 |
−10.24 |
0.000 *** |
−1626.742–−1104.066 |
Notes: *** denotes statistical significance at the 1% level, respectively.
Table A7. Uganda.
|
Variable |
Coef. |
Std. Err. |
z |
p > |z| |
[95% Conf. Interval] |
|---|---|---|---|---|---|
|
CO2intencity |
−265.3707 |
86.07522 |
−3.08 |
0.002 *** |
−434.075–−96.66636 |
|
lnGDPpercapita |
32.28741 |
11.26422 |
2.87 |
0.004 *** |
10.20995–54.36487 |
|
RenEnergy |
−2.119645 |
1.879978 |
−1.13 |
0.260 |
−5.804334–1.565044 |
|
Tradeopen |
−0.0176506 |
0.1800784 |
−0.10 |
0.922 |
−0.3705978–0.3352967 |
|
__00000R_c |
1.553692 |
0.3719385 |
4.18 |
0.000 *** |
0.8247057–2.282678 |
|
_cons |
32.264 |
246.3059 |
0.13 |
0.896 |
−450.4866–515.0146 |
Notes: *** denotes statistical significance at the 1% level, respectively.
Table A8. Ghana.
|
Variable |
Coef. |
Std. Err. |
z |
p > |z| |
[95% Conf. Interval] |
|---|---|---|---|---|---|
|
CO2intencity |
−12.49007 |
29.80132 |
−0.42 |
0.675 |
−70.89958–45.91944 |
|
lnGDPpercapita |
28.8014 |
11.21582 |
2.57 |
0.010 ** |
6.818798–50.78401 |
|
RenEnergy |
0.0688536 |
0.2217811 |
0.31 |
0.756 |
−0.3658294–0.5035365 |
|
Tradeopen |
0.0091026 |
0.0470458 |
0.19 |
0.847 |
−0.0831056–0.1013107 |
|
__00000R_c |
2.044943 |
0.4016575 |
5.09 |
0.000 *** |
1.257709–2.832177 |
|
_cons |
−201.7215 |
94.56677 |
−2.13 |
0.033 ** |
−387.069–−16.37407 |
Notes: *** and **, denote statistical significance at the 1% and 5%, levels, respectively.
Table A9. Senegal.
|
Variable |
Coef. |
Std. Err. |
z |
p > |z| |
[95% Conf. Interval] |
|---|---|---|---|---|---|
|
CO2intencity |
−6.417762 |
10.98979 |
−0.58 |
0.559 |
−27.95736–15.12184 |
|
lnGDPpercapita |
44.27502 |
5.823779 |
7.60 |
0.000 *** |
32.86062–55.68942 |
|
RenEnergy |
−0.0566017 |
0.1194618 |
−0.47 |
0.636 |
−0.2907425–0.177539 |
|
Tradeopen |
−0.0140771 |
0.077923 |
−0.18 |
0.857 |
−0.1668034–0.1386492 |
|
__00000R_c |
−0.0995089 |
0.2014027 |
−0.49 |
0.621 |
−0.4942509–0.2952332 |
|
_cons |
−297.2438 |
44.13907 |
−6.73 |
0.000 *** |
−383.7548–−210.7328 |
Notes: *** denotes statistical significance at the 1% level, respectively.
Table A10. Botswana.
|
Variable |
Coef. |
Std. Err. |
z |
p > |z| |
[95% Conf. Interval] |
|---|---|---|---|---|---|
|
CO2intencity |
−6.77266 |
15.57957 |
−0.43 |
0.664 |
−37.30805–23.76273 |
|
lnGDPpercapita |
−14.93631 |
19.08359 |
−0.78 |
0.434 |
−52.33946–22.46685 |
|
RenEnergy |
−0.2641303 |
0.391436 |
−0.67 |
0.500 |
−1.031331–0.5030701 |
|
Tradeopen |
0.2316012 |
0.096587 |
2.40 |
0.016 ** |
0.0422942–0.4209082 |
|
__00000R_c |
1.470002 |
0.5195643 |
2.83 |
0.005 *** |
0.4516747–2.488329 |
|
_cons |
149.5224 |
175.8955 |
0.85 |
0.395 |
−195.2264–494.2713 |
Notes: *** and **, denote statistical significance at the 1% and 5%, levels, respectively.
Table A11. Variable Definitions and Data Sources.
|
Variable |
Symbol |
Definition |
Measurement Unit |
Expected Effect on ANS |
Data Source |
|---|---|---|---|---|---|
|
Adjusted Net Savings |
ANS |
A comprehensive indicator of sustainable development that accounts for investment in human capital, depletion of natural resources, and environmental damage |
% of Gross National Income (excluding particulate emission damage) |
Dependent variable |
World Bank—World Development Indicators (WDI) |
|
Economic Growth |
lnGDPpercapita |
Natural logarithm of real GDP per capita, representing the level of economic development |
Constant 2015 US dollars (log form) |
Positive |
World Bank—WDI |
|
Renewable Energy Consumption |
RenEnergy |
Share of renewable energy in total final energy consumption |
% of total final energy consumption |
Ambiguous (short-run negative, long-run potentially positive) |
World Bank—WDI |
|
Carbon Intensity |
CO2intensity |
Carbon dioxide emissions per unit of energy use, capturing environmental efficiency |
kg of CO2 per kg of oil equivalent energy use |
Negative |
World Bank—WDI |
|
Trade Openness |
Tradeopen |
Degree of integration into the global economy |
(% of exports + imports)/GDP |
Ambiguous |
World Bank—WDI |
Notes: All variables cover the period 1990–2020, determined by the availability of Adjusted Net Savings data. Renewable energy consumption refers to the share of renewables in total final energy consumption, not growth rates. The expected signs are based on theoretical and empirical literature; actual effects may vary across countries due to structural heterogeneity.
Statement of the Use of Generative AI and AI-Assisted Technologies in the Writing Process
Artificial intelligence tools (ChatGPT version 5.2) were used solely for language editing and translation purposes during the preparation of this manuscript. The AI tool did not contribute to the study design, data collection, econometric analysis, interpretation of results, or formulation of conclusions. All scientific content, empirical analysis, and policy interpretations are the sole responsibility of the author.
Ethics Statement
Not applicable. This study did not involve humans or animals.
Informed Consent Statement
Not applicable. This study did not involve humans.
Data Availability Statement
The data used in this study are publicly available from the World Bank’s World database. All datasets can be accessed online at: https://databank.worldbank.org/ (accessed on 25 October 2025).
Funding
This research received no external funding.
Declaration of Competing Interest
The author declares that there are no known competing financial interests or personal relationships that could have appeared to influence the work reported in this paper.
References
-
Hamilton K, Clemens M. Genuine Savings Rates in Developing Countries. World Bank Econ. Rev. 1999, 13, 333–356. DOI:10.1093/wber/13.2.333 [Google Scholar]
-
Shahbaz M, Mallick H, Mahalik MK, Loganathan N. Does globalization impede environmental quality in India? Ecol. Indic. 2015, 52, 379–393. DOI:10.1016/j.ecolind.2014.12.025 [Google Scholar]
-
Acheampong AO. Economic growth, CO2 emissions and energy consumption: What causes what and where? Energy Econ. 2018, 74, 677–692. DOI:10.1016/j.eneco.2018.07.022 [Google Scholar]
-
Copeland BR, Taylor MS. Trade, Growth, and the Environment. J. Econ. Lit. 2004, 42, 7–71. DOI:10.1257/002205104773558047 [Google Scholar]
-
Archer C, Idun AA-A. Financial outreach, financial innovation, and sustainable development in Africa. Environ. Sci. Pollut. Res. 2023, 30, 69393–69415. DOI:10.1007/s11356-023-27304-7 [Google Scholar]
-
Kubiszewski I, Mulder K, Jarvis D, Costanza R. Toward better measurement of sustainable development and wellbeing: A small number of SDG indicators reliably predict life satisfaction. Sustain. Dev. 2021, 30, 139–148. DOI:10.1002/sd.2234 [Google Scholar]
-
Jiménez-Aceituno A, Peterson GD, Norström AV, Wong GY, Downing AS. Local lens for SDG implementation: Lessons from bottom-up approaches in Africa. Sustain. Sci. 2019, 15, 729–743. DOI:10.1007/s11625-019-00746-0 [Google Scholar]
-
Asadikia A, Rajabifard A, Kalantari M. Region-income-based prioritisation of Sustainable Development Goals by Gradient Boosting Machine. Sustain. Sci. 2022, 17, 1939–1957. DOI:10.1007/s11625-022-01120-3 [Google Scholar]
-
Muhirwa F, Shen L, Elshkaki A, Velempini K, Hirwa H, Zhong S, et al. Decoupling Energy, Water, and Food Resources Production from GHG Emissions: A Footprint Perspective Review of Africa from 1990 to 2017. Energies 2021, 14, 6326. DOI:10.3390/en14196326 [Google Scholar]
-
Gebara CH, Laurent A. National SDG-7 performance assessment to support achieving sustainable energy for all within planetary limits. Renew. Sustain. Energy Rev. 2023, 173, 112934. DOI:10.1016/j.rser.2022.112934 [Google Scholar]
-
Sciarra C, Chiarotti G, Ridolfi L, Laio F. A network approach to rank countries chasing sustainable development. Sci. Rep. 2021, 11, 15441. DOI:10.1038/s41598-021-94858-2 [Google Scholar]
-
Issever Grochova L, Litzman M. The efficiency in meeting measurable sustainable development goals. Int. J. Sustain. Dev. World Ecol. 2021, 28, 709–719. DOI:10.1080/13504509.2021.1882606 [Google Scholar]
-
Sugiawan Y, Kurniawan R, Managi S. Assessing the United Nations sustainable development goals from the inclusive wealth perspective. Sci. Rep. 2023, 13, 1601. DOI:10.1038/s41598-023-28540-0 [Google Scholar]
-
Assarkhaniki Z, Sabri S, Rajabifard A, Kahalimoghadam M. Advancing sustainable development goals: Embedding resilience assessment. Sustain. Sci. 2023, 18, 2405–2421. DOI:10.1007/s11625-023-01372-7 [Google Scholar]
-
Pesaran MH. Estimation and inference in large heterogeneous panels with a multifactor error structure. Econometrica 2006, 74, 967–1012. DOI:10.1111/j.1468-0262.2006.00692.x [Google Scholar]
-
Pesaran MH, Yamagata T. Testing slope homogeneity in large panels. J. Econom. 2008, 142, 50–93. DOI:10.1016/j.jeconom.2007.05.010 [Google Scholar]
-
Pesaran MH. A simple panel unit root test in the presence of cross-section dependence. J. Appl. Econom. 2007, 22, 265–312. DOI:10.1002/jae.951 [Google Scholar]
-
Eberhardt M, Bond S. Cross-Section Dependence in Nonstationary Panel Models: A Novel Estimator. 2009. Available online: https://mpra.ub.uni-muenchen.de/17870/ (accessed on 10 October 2025).
-
Eberhardt M, Teal F. Productivity Analysis in Global Manufacturing Production. 2010. Available online: https://ora.ox.ac.uk/objects/uuid:ea831625-9014-40ec-abc5-516ecfbd2118/files/m3956c6620e1981138f3168c388d1c793 (accessed on 10 October 2025).
-
Dumitrescu E-I, Hurlin C. Testing for Granger non-causality in heterogeneous panels. Econ. Model. 2012, 29, 1450–1460. DOI:10.1016/j.econmod.2012.02.014 [Google Scholar]
-
Durbin J. Errors in variables. Revue de l’institut International de Statistique 1954, 22, 23–32. DOI:10.2307/1401917 [Google Scholar]
-
Hausman JA. Specification tests in econometrics. Econom. J. Econom. Soc. 1978, 46, 1251–1271. DOI:10.2307/1913827 [Google Scholar]
-
Wu D-M. Alternative tests of independence between stochastic regressors and disturbances. Econom. J. Econom. Soc. 1973, 41, 733–750. DOI:10.2307/1914093 [Google Scholar]
-
Arellano M, Bover O. Another look at the instrumental variable estimation of error-components models. J. Econom. 1995, 68, 29–51. DOI:10.1016/0304-4076(94)01642-D [Google Scholar]
-
Blundell R, Bond S. Initial conditions and moment restrictions in dynamic panel data models. J. Econom. 1998, 87, 115–143. DOI:10.1016/S0304-4076(98)00009-8 [Google Scholar]
-
Fan J, Liao Y, Yao J. Power enhancement in high-dimensional cross-sectional tests. Econometrica 2015, 83, 1497–1541. DOI:10.3982/ECTA12749 [Google Scholar]
-
Pesaran MH. Testing weak cross-sectional dependence in large panels. Econom. Rev. 2015, 34, 1089–1117. DOI:10.1080/07474938.2014.956623 [Google Scholar]
-
Arellano M, Bond S. Some tests of specification for panel data: Monte Carlo evidence and an application to employment equations. Rev. Econ. Stud. 1991, 58, 277–297. DOI:10.2307/2297968 [Google Scholar]
-
Sadorsky P. Energy consumption, output and trade in South America. Energy Econ. 2012, 34, 476–488. DOI:10.1016/j.eneco.2011.12.008 [Google Scholar]
-
Apergis N, Payne JE. Renewable energy, output, CO2 emissions, and fossil fuel prices in Central America: Evidence from a nonlinear panel smooth transition vector error correction model. Energy Econ. 2014, 42, 226–232. DOI:10.1016/j.eneco.2014.01.003 [Google Scholar]
-
Bhattacharya M, Paramati SR, Ozturk I, Bhattacharya S. The effect of renewable energy consumption on economic growth: Evidence from top 38 countries. Appl. Energy 2016, 162, 733–741. DOI:10.1016/j.apenergy.2015.10.104 [Google Scholar]
-
Balsalobre-Lorente D, Driha OM, Halkos G, Mishra S. Influence of growth and urbanization on CO2 emissions: The moderating effect of foreign direct investment on energy use in BRICS. Sustain. Dev. 2022, 30, 227–240. DOI:10.1002/sd.2240 [Google Scholar]