Integrated GIS–MCDA (AHP) Framework for Groundwater Potential Mapping in Humid, Structurally Complex Watersheds

Integrated GIS–MCDA (AHP) Framework for Groundwater Potential Mapping in Humid, Structurally Complex Watersheds
Abinash Silwal
1,2
Dewasis Dahal
2,3
Bishal Poudel
4
Bibas Pokhrel
5
Sujan Shrestha
6
Ajay Kalra
5,*

Received: 22 January 2026 Revised: 24 February 2026 Accepted: 19 March 2026 Published: 24 March 2026

© 2026 The authors. This is an open access article under the Creative Commons Attribution 4.0 International License (https://creativecommons.org/licenses/by/4.0/).

Graphical Abstract
1. Introduction
Groundwater is one of the most critical freshwater resources, supporting domestic water supply, agriculture, industry, and ecosystem services across the globe. It accounts for a substantial share of global freshwater use, particularly in regions where surface water availability is limited or highly variable. Increasing population growth, urban expansion, and climate variability have significantly intensified reliance on groundwater resources, resulting in widespread stress on aquifer systems [1,2,3,4]. As a consequence, sustainable groundwater assessment and management have become central challenges in water resources planning.
Recent studies have demonstrated that groundwater depletion has accelerated in many parts of the world over the last two decades. Using satellite gravimetry and large-scale hydrological analysis, researchers have identified persistent declines in groundwater storage, particularly in intensively irrigated and densely populated regions [5,6]. These trends pose serious risks to water security, agricultural productivity, and groundwater-dependent ecosystems, underscoring the need for effective tools to identify areas with favorable groundwater potential and recharge capacity.
Conventional hydrogeological investigation methods, including borehole drilling, aquifer pumping tests, and geophysical surveys, provide valuable site-specific information but are often time-consuming, costly, and spatially limited when applied at watershed or regional scales [7]. These limitations have motivated the development of integrated approaches that combine remote sensing, Geographic Information Systems (GIS), and Multi-Criteria Decision Analysis (MCDA) to evaluate groundwater potential over large and heterogeneous landscapes [8]. GIS-based MCDA approaches allow multiple hydro-geomorphic factors to be analyzed simultaneously within a consistent spatial framework, making them particularly suitable for data-limited regions [9].
Among MCDA techniques, the Analytical Hierarchy Process (AHP) has been widely adopted for groundwater potential mapping due to its systematic framework for assigning relative weights to thematic layers through pairwise comparisons and consistency evaluation [10,11]. Numerous studies have successfully applied GIS-based AHP and related approaches to integrate rainfall, geology, soil characteristics, slope, drainage density, land use and land cover, and lineament density in groundwater potential assessments [12,13,14]. Advances in remote sensing and GIS have further enabled the extraction of structurally controlled features such as lineaments, which play a critical role in groundwater occurrence by enhancing secondary porosity and permeability [15,16,17]. More recent studies have also explored the use of machine-learning-based spatial models to complement traditional GIS-MCDA approaches, highlighting both the strengths and limitations of expert-driven weighting schemes [18,19,20,21].
Despite their widespread application, GIS-MCDA approaches are not without limitations. Several studies have highlighted the sensitivity of groundwater potential maps to input data quality, weighting schemes, and subjectivity in expert judgment, as well as the frequent lack of robust field-based validation [8,22,23,24]. These challenges are particularly pronounced in structurally complex and humid regions, where groundwater recharge processes exhibit strong spatial variability. Addressing these issues requires transparent methodological design, careful selection of criteria, and contextual interpretation of results.
In this context, the present study synthesizes recent developments in integrated GIS-MCDA approaches for groundwater potential mapping through a focused literature review. It demonstrates their application using a case study of the Fork Fish Creek watershed in West Virginia, USA. The watershed represents a humid Appalachian headwater basin characterized by mixed lithology, variable topography, and structurally controlled groundwater occurrence. By integrating rainfall, geology, and soil properties, slope, drainage density, land use and land cover, and lineament density within a GIS-AHP framework, this study aims to delineate groundwater potential zones and contribute to the growing body of research on groundwater assessment in humid, data-limited environments.
2. Literature Review
2.1. Literature Review Methodology
A structured literature review was conducted to examine the application of Geographic Information Systems and Multi-Criteria Decision Analysis techniques in groundwater potential mapping [25,26]. The review focused on peer-reviewed journal articles that employed GIS-based approaches, with particular emphasis on the Analytical Hierarchy Process and related decision-support methods. Relevant studies were identified through searches of major scientific databases, including Scopus, Web of Science, Google Scholar, and ScienceDirect. Search keywords included combinations of “groundwater potential mapping”, “GIS”, “remote sensing”, “multi-criteria decision analysis”, “AHP”, and “watershed scale”. Only peer-reviewed journal articles published in English were considered to ensure methodological rigor and reproducibility.
An initial screening was performed based on titles and abstracts to remove studies not directly related to groundwater potential assessment or those lacking a spatial decision-analysis component. Full-text screening was then conducted to retain studies that explicitly described thematic criteria selection, weighting strategies, and validation approaches. Review papers, regional case studies, and comparative methodological studies were all included to capture both theoretical and applied perspectives. The selected literature was analyzed to identify commonly used thematic factors, including rainfall, geology, soil characteristics, slope, drainage density, lineament density, and land use and land cover. Trends in weighting schemes, validation practices, and reported strengths and limitations were synthesized to inform the methodological design of the present case study. Insights from the literature review were subsequently applied to the Fork Fish Creek watershed to guide data selection, thematic layer preparation, and the GIS–AHP integration framework.
2.2. GIS and Remote Sensing Applications in Groundwater Potential Mapping
The integration of Geographic Information Systems and remote sensing has become a cornerstone of groundwater potential mapping due to their capacity to analyze spatial heterogeneity across large areas [27,28]. Early studies demonstrated that GIS-based integration of geological, geomorphological, and hydrological datasets provides an effective means for identifying groundwater-favorable zones at watershed and regional scales [7,29,30]. Remote sensing data enables the extraction of thematic layers such as land use and land cover, drainage networks, lineaments, and topographic attributes, which are otherwise difficult to characterize comprehensively using field-based methods alone [31,32,33].
Satellite-derived digital elevation models have been widely used to generate slope, drainage density, and flow accumulation layers, which are critical for understanding surface runoff and infiltration dynamics [34,35]. Lineament extraction from optical and radar imagery has also been extensively employed to identify structural controls on groundwater occurrence, particularly in hard rock and tectonically influenced terrains [15,36]. These studies consistently report higher groundwater potential in areas with dense structural features due to enhanced secondary porosity and permeability.
2.3. Multi-Criteria Decision Analysis in Groundwater Studies
Groundwater occurrence is governed by multiple interacting factors, making Multi-Criteria Decision Analysis particularly suitable for groundwater potential mapping [37]. MCDA techniques allow different thematic layers to be integrated within a structured decision-making framework, accounting for both quantitative data and expert knowledge [38,39]. Among MCDA methods, the Analytical Hierarchy Process has emerged as one of the most widely used approaches due to its transparency, consistency evaluation, and adaptability to spatial decision problems [40,41].
Numerous studies have successfully applied GIS-AHP frameworks to delineate groundwater potential zones across a wide range of hydrogeological settings. Machiwal et al. applied a GIS-AHP approach to a semi-arid basin in India and demonstrated that integrating multiple thematic layers significantly improved groundwater potential assessment compared to single-factor analyses [8]. Similarly, Melese and Kuma (2021) used GIS and AHP to map groundwater potential zones in the Muga watershed of Ethiopia and reported strong agreement between predicted high-potential zones and observed well locations [31].
Recent studies have further expanded the application of GIS-AHP methods to humid and structurally complex regions [42]. Patel et al. applied AHP-based groundwater potential mapping in the upper Narmada basin and highlighted the importance of slope, geology, and lineament density in controlling groundwater occurrence [40]. Comparable findings were reported by Doke et al., who demonstrated the effectiveness of GIS-AHP in the Ulhas basin and emphasized the role of drainage density and land use in recharge dynamics [43].
2.4. Thematic Factors Influencing Groundwater Potential
Previous groundwater potential mapping studies consistently identify a core set of thematic factors that exert strong control on groundwater recharge and storage. Rainfall is widely recognized as the primary source of groundwater recharge and is therefore assigned high importance in most GIS-MCDA models [29,31]. Geological and soil characteristics influence groundwater occurrence by controlling primary and secondary porosity, hydraulic conductivity, and weathering depth. Unconsolidated deposits and fractured bedrock formations generally exhibit higher groundwater potential compared to massive or compact lithologies [15,40].
Topographic slope plays a critical role in regulating infiltration and runoff processes. Studies consistently report that areas with gentle slopes favor infiltration and groundwater recharge, while steep slopes promote rapid surface runoff and limited recharge [34,44,45,46]. Drainage density serves as an indirect indicator of landscape permeability and runoff potential, with low drainage density commonly associated with permeable substrates and higher recharge capacity [35,47,48]. Lineament density has been widely used as a proxy for subsurface fracture networks, particularly in crystalline and structurally complex terrains, where fractures and faults provide preferential groundwater flow paths [31,49].
Land use and land cover also influence groundwater recharge by modifying infiltration rates and surface runoff characteristics. Forested and agricultural areas often promote higher infiltration compared to urbanized or impervious surfaces, although the magnitude of this effect varies depending on soil type and slope [31,50]. Consequently, LULC is routinely included as a thematic layer in GIS-based groundwater potential models.
2.5. Validation Practices and Methodological Limitations
Validation remains one of the most challenging aspects of groundwater potential mapping due to the limited availability of long-term groundwater monitoring data. Many studies rely on qualitative or semi-quantitative validation methods, such as overlaying existing well locations, spring density, or yield data with predicted groundwater potential zones [13,40]. While these approaches provide useful insights, they also introduce uncertainty related to data sparsity and spatial bias.
To address these limitations, recent research has explored the integration of machine learning techniques with traditional GIS-MCDA frameworks. Naghibi et al. applied boosted regression tree and random forest models to groundwater potential mapping and demonstrated improved predictive performance relative to expert-driven approaches in some cases [19]. Similarly, Shinde et al. compared AHP-based groundwater potential mapping with other weighting methods and used ROC-AUC analysis for validation, highlighting both the strengths and limitations of AHP [41].
Despite the growing interest in data-driven models, several studies emphasize that GIS-AHP remains valuable due to its interpretability, transparency, and applicability in data-limited regions [12,31]. As a result, hybrid and context-specific modeling approaches are increasingly recommended rather than reliance on a single technique.
2.6. Synthesis and Relevance to the Present Study
The reviewed literature demonstrates that integrated GIS-MCDA approaches, particularly those employing AHP, provide a robust and widely accepted framework for groundwater potential mapping. Previous studies highlight the importance of selecting appropriate thematic layers, justifying weighting schemes, and acknowledging uncertainty and validation constraints. While recent advances in machine learning offer promising alternatives, GIS-AHP remains an effective and interpretable approach for regional groundwater assessment, especially in structurally complex and data-limited environments.
Building on these insights, the present study adopts a GIS-AHP framework informed by established practices and applies it to a humid Appalachian headwater watershed. By situating the case study within a broader methodological context, this research contributes to the growing body of groundwater potential mapping studies and provides a reference for similar hydro-climatic and geological settings.
3. Study Area
The study area is the Upper West Virginia Fork Fish Creek sub-watershed located near the town of Hundred in Wetzel County, West Virginia, United States (Figure 1). The watershed covers an area of approximately 46.6 km2 and lies within the Appalachian Plateau physiographic province. Elevation within the basin ranges from about 305 m to 400 m above mean sea level, with moderate relief and a well-developed dendritic drainage network. The watershed is underlain predominantly by Pennsylvanian-age sandstones and shales, with localized alluvial deposits along valley bottoms, resulting in spatially variable permeability and groundwater flow conditions. Mean annual precipitation is approximately 1130 mm, supporting perennial streamflow. A United States Geological Survey stream gauge (USGS 0311404647) is located near the downstream outlet of the watershed and provides hydrologic observations for the basin.
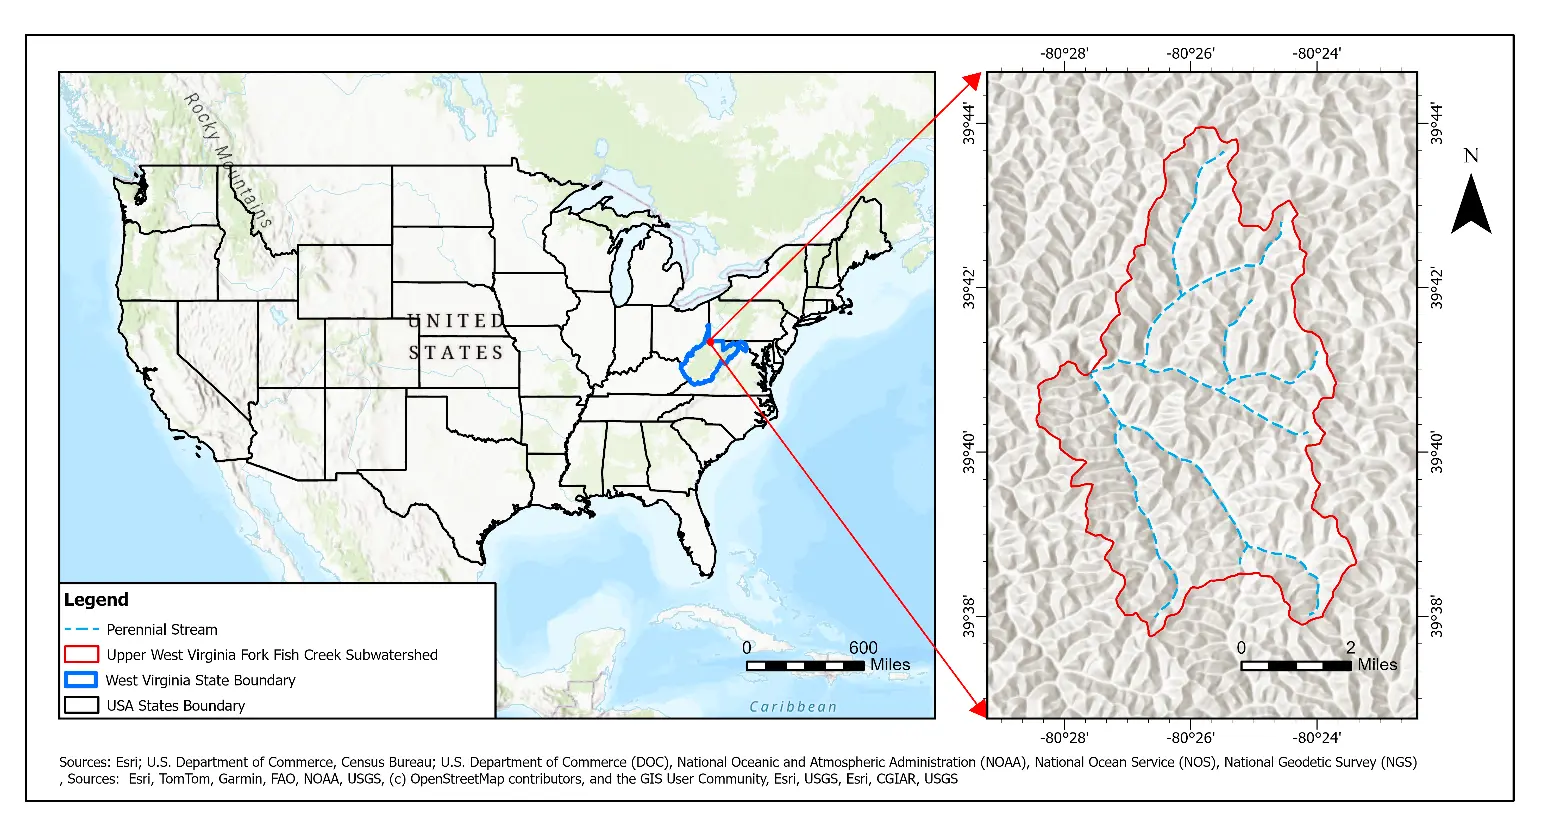
Figure 1. Location of the Upper West Virginia Fork Fish Creek sub-watershed in Wetzel County, West Virginia, United States. The left map shows the position of the watershed within the state of West Virginia, while the right map shows the watershed boundary and drainage network.
Soils within the watershed exhibit variable depth and hydraulic properties, with an average soil depth of approximately 8.41 inches and a saturated hydraulic conductivity of 7.5 × 10⁻⁸ m/s. Land use and land cover are dominated by forested areas (42.74 km2), with smaller extents of residential land (2.36 km2), agricultural land (1.47 km2), and surface water (0.01 km2). The watershed extends approximately from 39°37′ N to 39°44′ N latitude and 80°28′ W to 80°23′ W longitude. As a headwater catchment, the Fork Fish Creek sub-watershed contributes to groundwater recharge and surface water flow within the larger Ohio River basin, highlighting its relevance for regional groundwater assessment.
4. Materials and Methods
An integrated GIS-based multi-criteria decision analysis framework was adopted to delineate groundwater potential zones within the Upper West Virginia Fork Fish Creek sub-watershed. The methodological design was informed by insights synthesized from the literature review and implemented through a case study approach. An overview of the conceptual framework is illustrated in Figure 2, while a detailed stepwise methodological flowchart is presented in Figure 3.
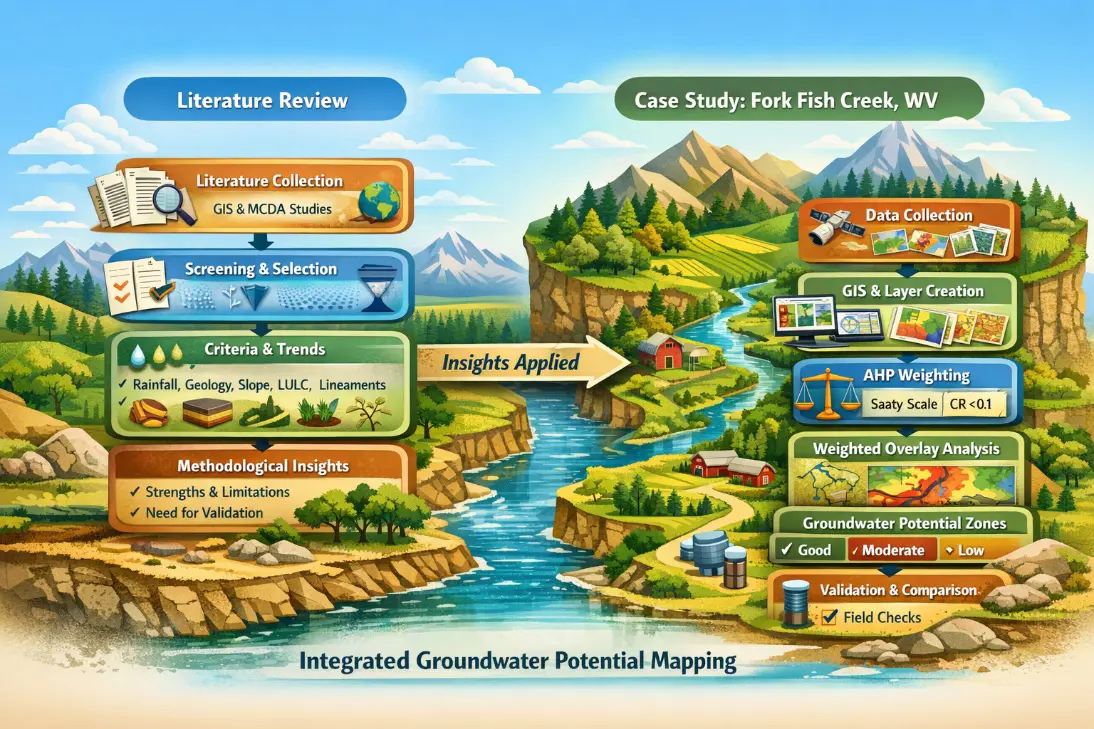
Figure 2. Conceptual framework illustrating the integration of the literature review and a GIS–AHP-based groundwater potential mapping case study for the Fork Fish Creek watershed, West Virginia. (Conceptual illustration initially AI-generated using OpenAI DALL·E 3 GPT-4 Vision model and manually refined in Photoshop CC 2024).
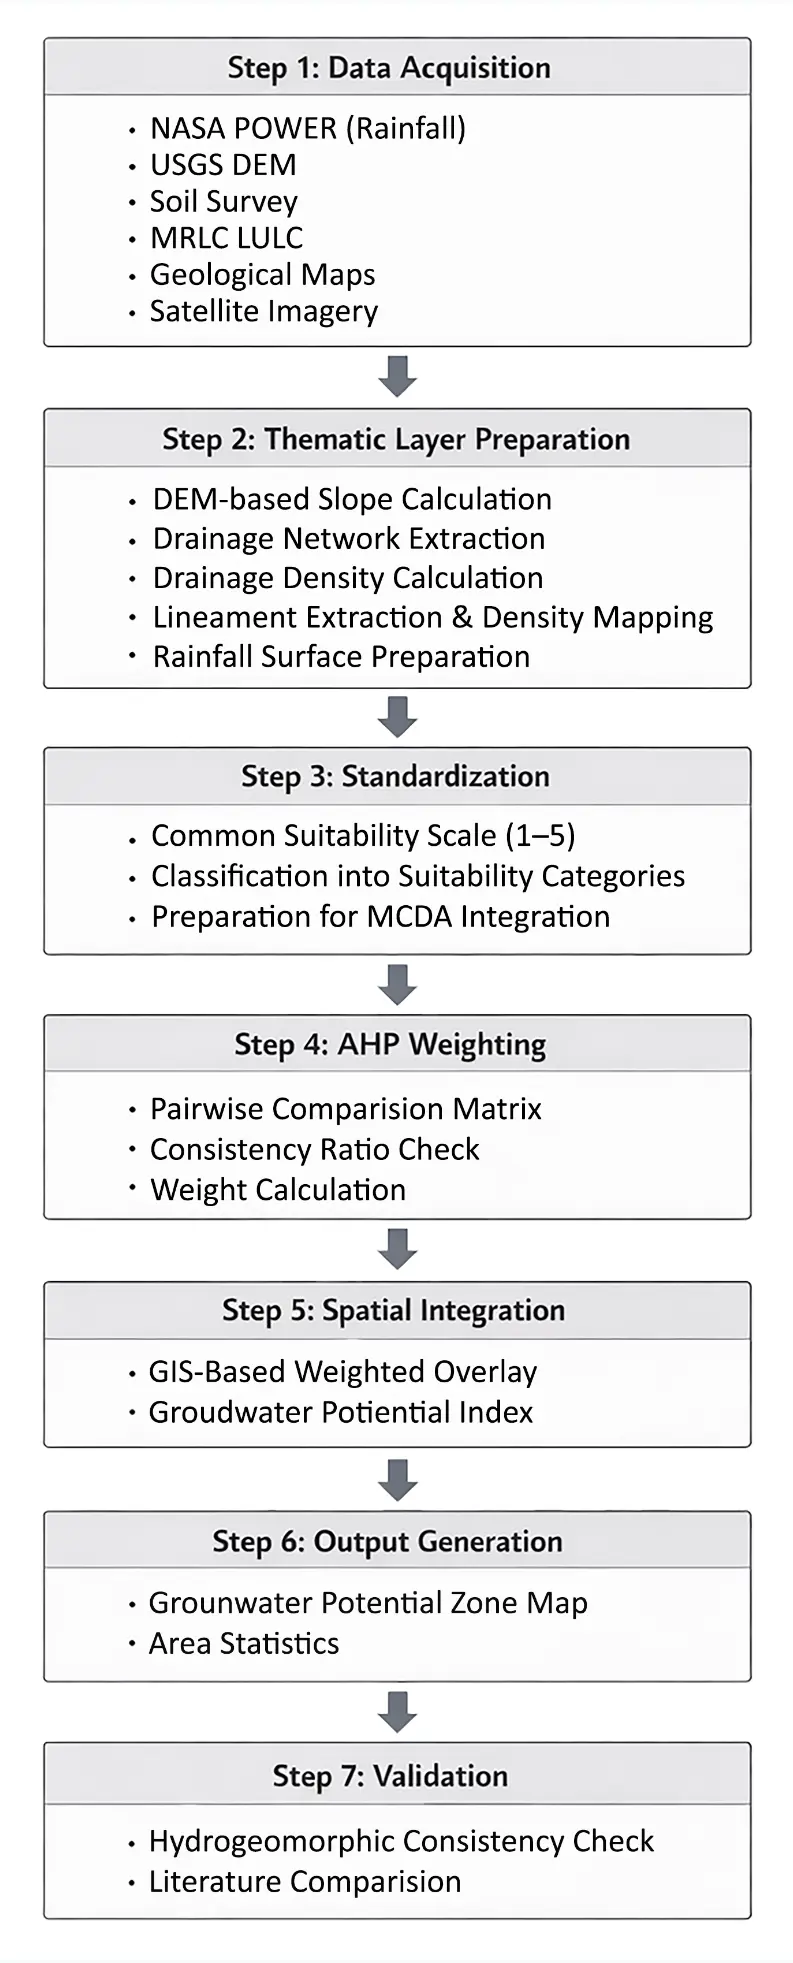
Figure 3. Stepwise methodological flowchart illustrating data acquisition, thematic layer preparation, standardization, AHP-based weighting, GIS-based weighted overlay integration, output generation, and validation procedures used for groundwater potential mapping.
4.1. Data Sources
The data sets used in this study were obtained from publicly available and authoritative sources and are summarized in Table 1. Precipitation data were acquired from the NASA Prediction of Worldwide Energy Resources (POWER) database, which provides gridded climate variables suitable for hydrological and environmental analyses. Topographic information was derived from a digital elevation model obtained from the United States Geological Survey National Map, which served as the basis for slope, drainage network, and drainage density calculations.
Table 1. Spatial datasets and thematic layer preparation for groundwater potential mapping.
|
Thematic Data |
Source |
Data Type |
Preparation Method |
Application in Study |
|---|---|---|---|---|
|
Precipitation |
NASA POWER |
Gridded climate data |
Mean annual precipitation extracted and spatially interpolated in ArcGIS Pro |
Representation of groundwater recharge potential |
|
Digital Elevation Model (DEM) |
USGS National Map |
Raster elevation data |
Used to derive slope, flow direction, flow accumulation, and drainage network |
Terrain analysis and drainage density calculation |
|
Slope |
Derived from USGS DEM |
Raster |
Generated using GIS terrain analysis tools in ArcGIS Pro |
Assessment of runoff and infiltration conditions |
|
Drainage Density |
Derived from USGS DEM |
Vector and raster |
Drainage network extracted from DEM, and stream length per unit area calculated |
An indirect indicator of surface runoff and recharge potential |
|
Soil |
USGS Soil Survey |
Polygon vector data |
Reclassified based on soil depth and hydraulic conductivity |
Evaluation of infiltration capacity and recharge |
|
Geology |
Regional geological maps |
Polygon vector data |
Lithological units reclassified by relative permeability |
Representation of groundwater storage and transmission properties |
|
Land Use/Land Cover |
MRLC Consortium |
Classified raster data |
Reclassified into hydrologically relevant categories |
Assessment of surface conditions affecting infiltration |
|
Lineaments |
Derived from satellite imagery and USGS DEM |
Vector |
Extracted through visual interpretation of satellite imagery and DEM hillshade in ArcGIS Pro |
Representation of secondary porosity and structural control on groundwater |
Soil data were obtained from the USGS Soil Survey database and used to represent soil depth and hydraulic properties relevant to groundwater recharge. Land use and land cover information were sourced from the Multi-Resolution Land Characteristics (MRLC) Consortium, providing classified land cover data suitable for watershed-scale analysis. All spatial analyses, thematic layer preparation, and weighted overlay operations were conducted using ArcGIS Pro in a GIS environment. Prior to analysis, all datasets were projected to a common coordinate system and resampled to a consistent spatial resolution.
4.2. Selection of Thematic Criteria
The selection of thematic criteria was guided by findings from previous groundwater potential mapping studies and by the physical characteristics of the Fork Fish Creek watershed. Based on literature consensus and data availability, six criteria were selected for analysis: rainfall, geology, soil characteristics, slope, drainage density, lineament density, and land use land cover (LULC). These factors are widely recognized as primary controls on groundwater recharge, storage, and movement, particularly in structurally complex and topographically dissected terrains.
4.3. Preparation of Thematic Layers
4.3.1. Rainfall
Rainfall represents the primary source of groundwater recharge and was therefore included as a key thematic criterion. Spatial precipitation data were obtained from gridded climate datasets and processed to represent mean annual rainfall across the watershed. The rainfall layer was classified into suitability classes, with areas receiving relatively higher precipitation assigned higher groundwater potential ranks, assuming similar infiltration conditions.
4.3.2. Geology and Soil
Geological and soil characteristics exert strong control on groundwater potential by influencing permeability, porosity, and infiltration capacity. The study area is underlain predominantly by Pennsylvanian-age sandstones and shales, with localized alluvial deposits along valley bottoms. Upland areas are characterized by residual soils, primarily Ultisols, which are generally fine-loamy and moderately permeable. In contrast, floodplain areas contain alluvial Inceptisols that are deeper and exhibit higher saturated hydraulic conductivity. Geological units and soil types were reclassified according to their relative suitability for groundwater storage and transmission. Alluvial deposits and permeable sandstone units were assigned higher suitability ranks, whereas shale-dominated units and shallow residual soils were assigned lower ranks.
4.3.3. Slope
Slope influences groundwater recharge by controlling surface runoff and infiltration processes. Slope was derived from the digital elevation model using standard GIS terrain analysis techniques. Areas with gentle slopes were assigned to higher groundwater potential ranks due to increased infiltration opportunity, while steep slopes were assigned lower ranks due to enhanced runoff and limited infiltration.
4.3.4. Drainage Density
Drainage density reflects the degree of landscape dissection and provides an indirect measure of surface runoff and infiltration behavior. The drainage network was extracted from the digital elevation model using flow direction and flow accumulation algorithms. Drainage density was calculated as the total length of streams per unit area and classified into suitability classes. Lower drainage density values were interpreted as favorable for groundwater recharge.
4.3.5. Lineament Density
Lineaments represent structural features such as fractures, joints, and faults that enhance secondary porosity and permeability, particularly in consolidated rock formations. Lineaments were extracted from satellite imagery and terrain derivatives using GIS-based techniques. Lineament density was calculated as the total length of lineaments per unit area. Areas with higher lineament density were assigned higher groundwater potential ranks due to their enhanced capacity for groundwater movement and storage.
4.3.6. Land Use and Land Cover
Land use and land cover influence groundwater recharge by modifying surface infiltration and runoff characteristics. Land cover data were classified into hydrologically relevant categories. Forested and agricultural areas were assigned higher suitability ranks due to greater infiltration potential, whereas residential and built-up areas were assigned lower ranks because of surface sealing effects.
4.4. Analytical Hierarchy Process
The Analytical Hierarchy Process was employed to determine the relative importance of the thematic layers used in groundwater potential mapping. AHP provides a structured framework for multi-criteria decision analysis by allowing pairwise comparison of criteria based on their relative influence on groundwater occurrence. In this study, six thematic layers were considered: rainfall, geology, slope, drainage density, land use and land cover, and lineament density. The relative importance of these layers was evaluated using Saaty’s fundamental scale, which ranges from 1 to 9, where a value of 1 indicates equal importance and higher values indicate increasing levels of preference. Pairwise comparisons were performed based on insights from previous studies and expert judgment, and the resulting comparison matrix is presented in Table 2.
Table 2. Pairwise comparison matrix of thematic layers used in the Analytical Hierarchy Process.
|
Layer |
Rainfall |
Geology |
Slope |
Drainage Density |
LULC |
Lineament Density |
|---|---|---|---|---|---|---|
|
Rainfall |
1 |
3 |
3 |
5 |
5 |
5 |
|
Geology |
1/3 |
1 |
3 |
3 |
5 |
5 |
|
Slope |
1/5 |
1/3 |
1 |
1 |
3 |
3 |
|
Drainage Density |
1/5 |
1/3 |
1 |
1 |
1 |
2 |
|
LULC |
1/5 |
1/5 |
1/3 |
1 |
1 |
1 |
|
Lineament Density |
1/5 |
1/5 |
1/3 |
1/2 |
1 |
1 |
The consistency ratio of the comparison matrix was calculated and found to be less than 0.1, indicating acceptable consistency in the pairwise judgments.
4.5. Groundwater Potential Mapping
All thematic layers were reclassified to a common suitability scale and weighted according to the AHP-derived weights. A weighted overlay analysis was performed in the GIS environment to generate a groundwater potential index map. The resulting index values were classified into groundwater potential zones, typically categorized as low, moderate, and good groundwater potential.
4.6. Validation Approach
Due to the limited availability of groundwater well yield data and long-term monitoring records within the watershed, validation was conducted qualitatively. The spatial distribution of groundwater potential zones was evaluated for consistency with favorable hydrogeomorphic conditions, including low slope areas, low drainage density regions, permeable geological and soil units, and areas of high lineament density. This qualitative validation approach is appropriate for small, data-limited headwater catchments and provides a reasonable assessment of model plausibility.
Alongside qualitative hydrogeomorphic consistency checks, an additional validation was performed utilizing groundwater monitoring-well depth data sourced from the USGS Water Data for the Nation database. Owing to the restricted availability of well yield and long-term pumping test data within the watershed, total well depth was employed as a surrogate measure of groundwater accessibility.
Prior studies on groundwater potential mapping have utilized borewell depth as a validation criterion, acknowledging that deeper boreholes are generally necessary in regions with relatively lower groundwater availability, while shallower wells are typically linked to areas of greater groundwater potential [51]. This methodology is especially relevant in data-scarce contexts when comprehensive pumping or water-level datasets are inaccessible.
The classification thresholds utilized in this study were established in relation to the regional hydrogeologic setting of northwestern West Virginia and the depth distribution of the chosen wells. According to the USGS hydrogeologic summary for the Appalachian Plateau region, household and monitoring wells typically range from around 60 to 100 feet in depth, with deeper wells frequently linked to upland environments and formations with lesser transmissivity. Wells ≤ 70 ft were classified as shallow (indicating more groundwater accessibility), wells between 70–95 ft were classified as intermediate (moderate potential), and wells > 95 ft were classified as deep (lower potential). These thresholds are not universal constants; rather, they signify dataset-specific categories suitable for the local hydrogeologic context. The resultant depth-proxy classes were juxtaposed with the delineated groundwater potential distribution.
5. Results and Discussion
5.1. Global Overview of GIS–MCDA Groundwater Potential Mapping
GIS-based multi-criteria decision analysis approaches have been widely applied for groundwater potential mapping across diverse climatic and hydrogeological settings. Results reported in the literature consistently demonstrate that integrating spatial datasets representing climate, geology, geomorphology, and land surface characteristics improves the identification of groundwater-favorable zones compared to single-factor approaches. Remote sensing and GIS techniques enable efficient handling of heterogeneous datasets, while MCDA frameworks provide a systematic means of weighting and combining thematic criteria based on their relative influence on groundwater occurrence.
Representative GIS–MCDA groundwater potential mapping studies reviewed in this paper are summarized in Table 3. These studies span humid, semi-arid, and arid regions and employ a range of methodological combinations, including GIS-based weighted overlay, Analytical Hierarchy Process, fuzzy logic, and hybrid approaches. Despite methodological differences, rainfall, geology or lithology, slope, drainage characteristics, lineament density, and land use and land cover emerge as the most frequently applied and influential criteria. Studies conducted in hard-rock and structurally complex terrains emphasize the role of lineaments and lithological variability in controlling secondary porosity, while investigations in humid regions highlight the moderating influence of topography and soil properties on recharge processes.
Validation strategies reported in the literature vary depending on data availability and study scale. Several studies rely on well yield or borehole correlation for validation, whereas others apply statistical techniques such as receiver operating characteristic analysis or qualitative consistency checks against known hydrogeological conditions. Although quantitative validation provides stronger performance metrics, qualitative validation remains common in data-limited regions and small catchments. Collectively, the reviewed studies demonstrate that GIS–MCDA frameworks are adaptable to different environmental contexts but require careful interpretation of results within local hydrogeological constraints.
The synthesis of global studies presented in Table 3 provides a comparative framework for evaluating the Fork Fish Creek case study. By situating the case study within the broader body of published GIS–MCDA research, the present study builds on established methodological practices while addressing groundwater potential mapping in a humid Appalachian headwater watershed.
Table 3. Summary of representative GIS–MCDA studies for groundwater potential mapping and validation approaches.
|
Study |
Region & Climate |
Methodology |
Key Thematic Criteria |
Validation Approach |
Key Findings |
|---|---|---|---|---|---|
|
Israil et al. (2006) [7] |
Himalayan foothills, India (humid–subtropical) |
GIS + Geophysical survey |
Geology, slope, resistivity |
Borehole correlation |
Integrated GIS improves hydrogeological zoning accuracy |
|
Jha et al. (2007) [13] |
Multiple basins, India |
RS–GIS framework |
Geology, LULC, slope, drainage |
Comparative analysis |
Demonstrated scalability of GIS for groundwater planning |
|
Shekhar & Pandey (2015) [52] |
Hard rock terrain, India |
RS + GIS + AHP |
Geology, geomorphology, slope, lineament, drainage |
Well yield comparison |
AHP improved the prioritization of groundwater zones |
|
Benjmel et al. (2020) [12] |
Anti-Atlas, Morocco (semi-arid) |
RS + GIS + MCDA |
Lithology, slope, lineament, drainage, LULC |
ROC curve |
Identified priority zones for groundwater exploration |
|
Rukundo & Doğan (2019) [22] |
Ergene River catchment, Turkey |
Recharge modeling + spatial analysis |
Soil, land use, climate variables |
Baseflow proxy validation |
Alluvial and land cover patterns influence recharge |
|
Al-Djazouli et al. (2021) [53] |
Comoro watershed, Timor-Leste |
GIS + RS + AHP |
Geology, slope, drainage, lineament, rainfall |
Spring/well inventory |
An integrated approach improved groundwater targeting |
|
Nag (2016) [35] |
Purulia district, India |
GIS weighted overlay |
Geology, geomorphology, slope, drainage, lineament |
Field verification |
Moderate to good zones aligned with geomorphic lows |
|
Elmahdy et al. (2020) [54] |
UAE (arid) |
GIS + MCDA approach |
Lineaments, slope, lithology, drainage |
Comparative assessment |
Structural controls are critical in arid terrains |
|
This study |
Fork Fish Creek, WV (humid) |
GIS + AHP weighted overlay |
Rainfall, geology, slope, drainage density, LULC, lineament density |
Qualitative validation |
Moderate zone dominates; high potential concentrated in valleys |
5.2. Fork Fish Creek Case Study Results
5.2.1. Thematic Layer Patterns
The spatial distribution of the thematic layers used in the groundwater potential analysis is illustrated in Figure 4. Each layer exhibits distinct spatial variability that reflects the hydrogeomorphic characteristics of the Fork Fish Creek watershed. Although mean annual precipitation is relatively uniform across the basin due to its limited spatial extent, terrain-related factors introduce substantial heterogeneity in groundwater recharge conditions.
Slope and drainage density show pronounced spatial contrasts between upland and valley-bottom areas. Steeper slopes and higher drainage density dominate the uplands, promoting surface runoff and limiting infiltration, whereas lower slope gradients and reduced drainage density are concentrated along stream corridors and floodplain areas. Similar relationships between slope, drainage density, and groundwater recharge have been reported in previous GIS–MCDA groundwater studies conducted in both humid and semi-arid environments [29,35].
Soil and geological layers further differentiate groundwater potential across the watershed. Upland areas are characterized primarily by residual soils developed on sandstone and shale formations, which tend to have moderate to low permeability. In contrast, localized alluvial deposits along valley bottoms exhibit greater soil depth and higher hydraulic conductivity, favoring groundwater storage and movement. The influence of lithology and soil properties on groundwater potential is consistent with findings from structurally complex terrains reported in earlier studies [7,22].
Land use and land cover within the watershed are predominantly forested, with limited agricultural and residential development. Forested areas generally promote higher infiltration compared to built-up surfaces, while agricultural areas may exhibit variable recharge behavior depending on soil management practices. Lineament density displays localized zones of higher concentration, suggesting potential structural control on groundwater movement. The importance of lineaments as conduits for groundwater flow in consolidated rock environments has been emphasized in several GIS–MCDA studies [52,54].
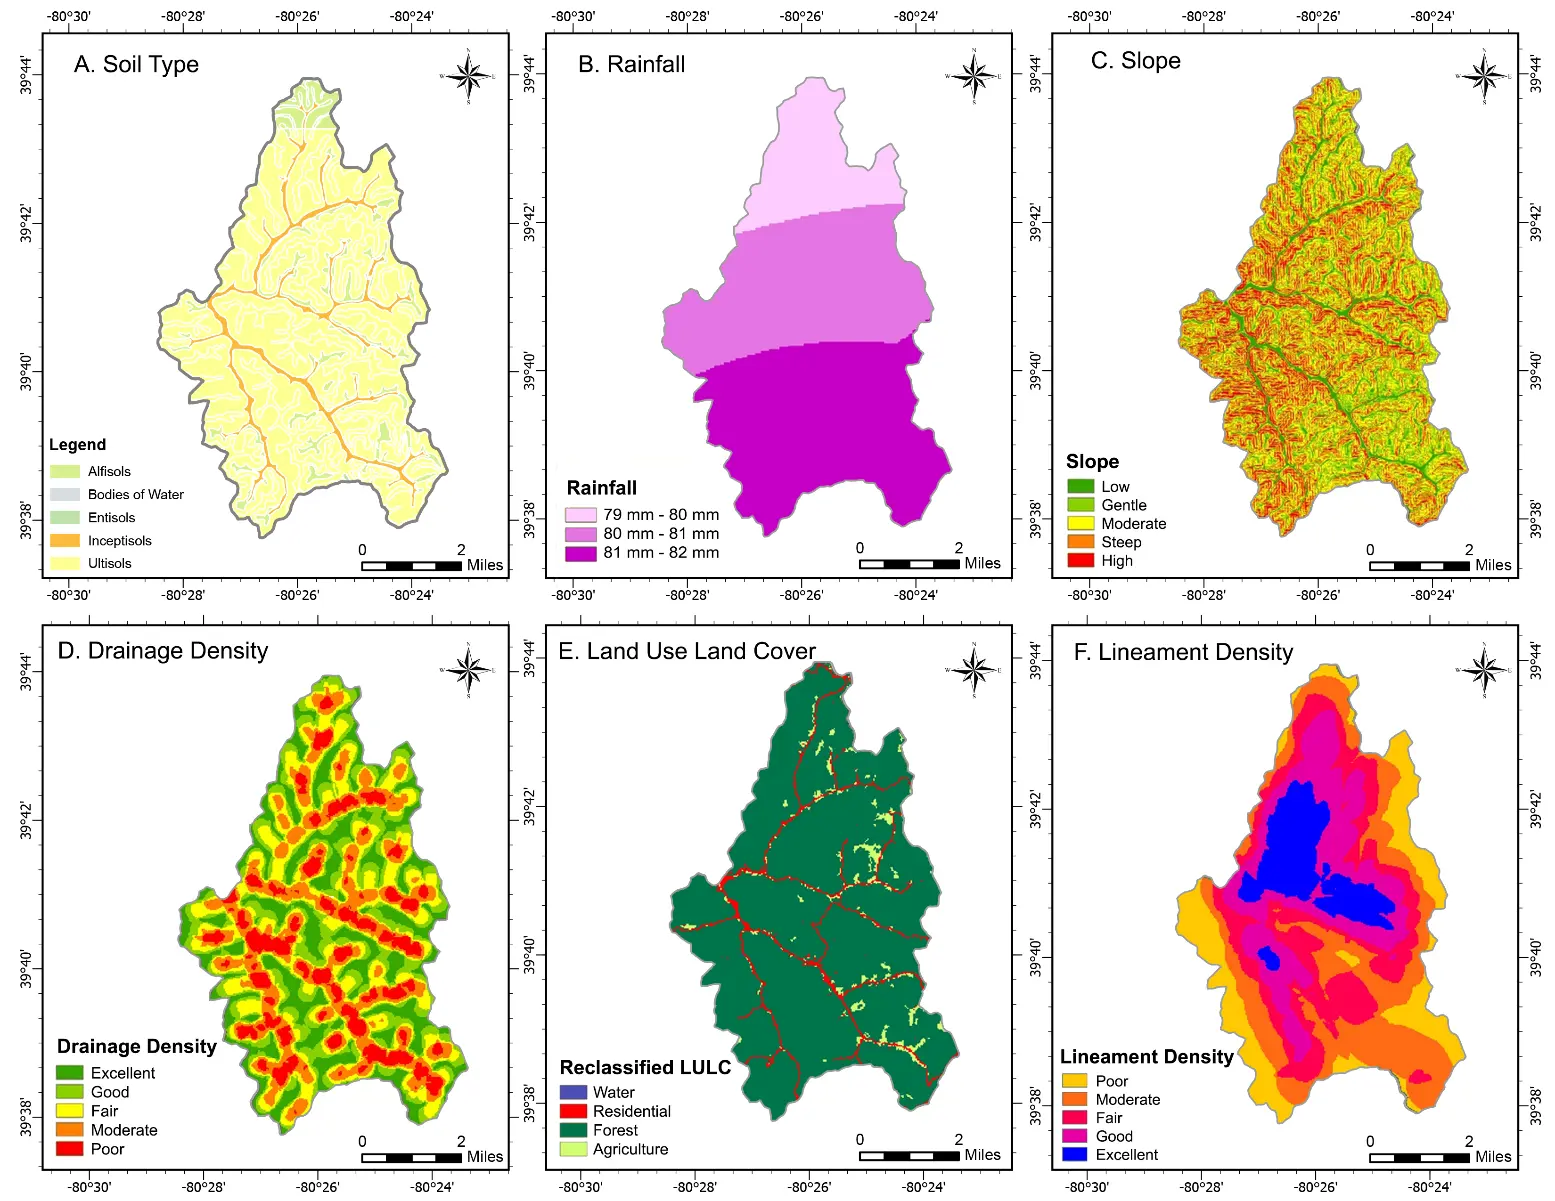
Figure 4. Spatial distribution of thematic layers used for groundwater potential mapping in the Fork Fish Creek watershed: (A) soil types classified by relative infiltration capacity, (B) mean annual rainfall (mm·year−1) derived from NASA POWER data, (C) slope (degrees) calculated from the digital elevation model, (D) drainage density (km·km−2) derived from the extracted stream network, (E) land use and land cover based on MRLC classification, and (F) lineament density (km·km−2) representing structural controls on groundwater movement. All thematic layers were reclassified into suitability classes prior to integration using the AHP-based weighted overlay method.
5.2.2. Criteria Weighting Results
The Analytical Hierarchy Process was applied to quantify the relative importance of the selected thematic layers influencing groundwater potential. The resulting weights indicate that rainfall and geology exert the strongest influence on groundwater potential within the Fork Fish Creek watershed, followed by slope and drainage density. Land use, land cover, and lineament density contribute comparatively lower influence. The consistency ratio of the pairwise comparison matrix was calculated and found to be less than 0.1, indicating acceptable consistency in the pairwise judgments. The relative distribution of criterion weights is summarized in Table 4.
The weighting pattern reflects the humid climatic setting of the study area, where sufficient precipitation provides recharge input, but subsurface permeability and topographic controls regulate the spatial distribution of groundwater potential. Similar weighting trends, in which climatic and geological factors dominate groundwater potential, have been reported in GIS–MCDA studies conducted in humid and sub-humid regions [29,55]. The acceptable consistency ratio of the AHP matrix indicates that the weighting scheme is internally coherent and suitable for subsequent spatial analysis.
Table 4. AHP-derived weights of thematic criteria used for groundwater potential mapping.
|
Criterion |
Weight |
Weight (%) |
|---|---|---|
|
Rainfall |
0.418 |
41.8 |
|
Geology |
0.260 |
26.0 |
|
Slope |
0.118 |
11.8 |
|
Drainage Density |
0.089 |
8.9 |
|
Land Use/Land Cover |
0.062 |
6.2 |
|
Lineament Density |
0.054 |
5.4 |
|
Total |
1.000 |
100.0 |
5.2.3. Groundwater Potential Zones (GWPZ) and Area Distribution
Integration of the weighted thematic layers through GIS-based overlay analysis resulted in the delineation of groundwater potential zones classified as low, moderate, and good potential, as shown in Figure 5. The spatial distribution of these zones reflects the combined influence of climatic input, terrain characteristics, and subsurface properties.
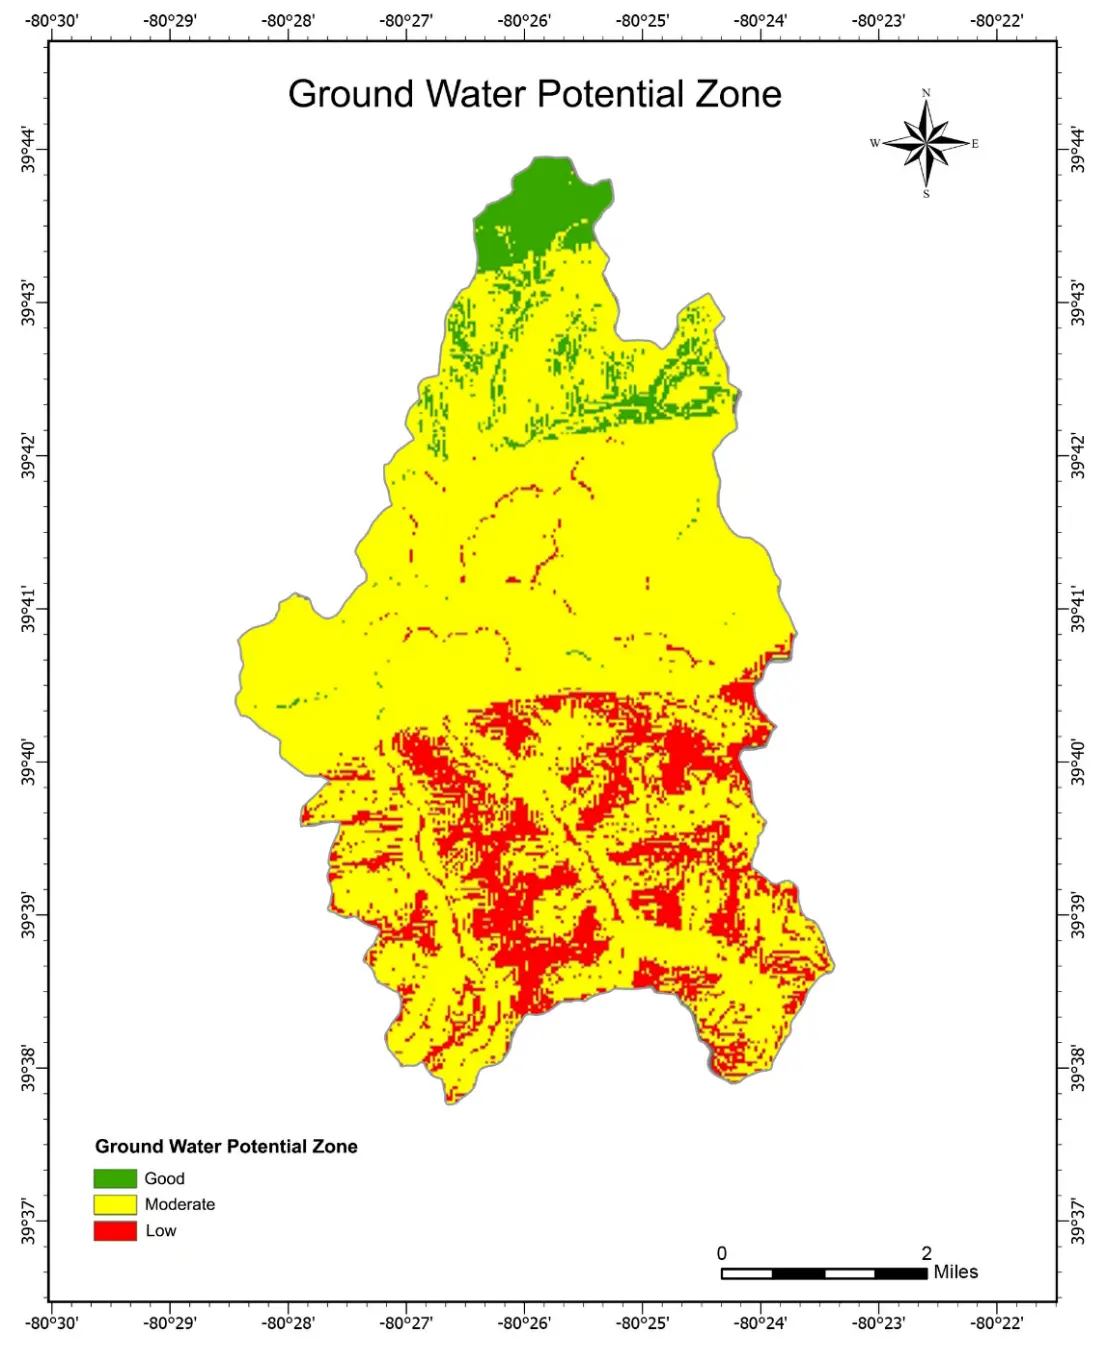
Figure 5. Groundwater potential zones in the Fork Fish Creek watershed were classified into good, moderate, and low potential based on GIS-based weighted overlay analysis.
Moderate groundwater potential occupies the largest proportion of the watershed, indicating that recharge and storage conditions are generally constrained by topography and lithology despite adequate precipitation. Zones classified as good groundwater potential are primarily associated with valley bottoms and floodplain areas characterized by gentle slopes, lower drainage density, favorable soil conditions, and higher lineament density. In contrast, low groundwater potential zones are concentrated in steep upland areas where rapid runoff and shallow soils limit infiltration.
The areal distribution of groundwater potential zones indicates that the moderate groundwater potential class occupies the largest proportion of the watershed, accounting for approximately 76.5% of the total area (Table 5). Zones classified as low groundwater potential cover about 16.8% of the watershed, while areas of good groundwater potential constitute a relatively small proportion (6.7%). The predominance of moderate potential zones reflects the combined influence of dissected topography, variable lithology, and structural controls that constrain extensive groundwater storage despite adequate precipitation. Areas of good groundwater potential are primarily associated with valley bottoms and floodplain environments, where gentler slopes, lower drainage density, and favorable soil conditions promote enhanced infiltration and subsurface storage. The dominance of moderate potential zones is consistent with findings reported in similar watershed-scale studies, where favorable groundwater conditions are spatially restricted to geomorphically advantageous locations [12,35].
Table 5. Areal distribution of groundwater potential zones in the Fork Fish Creek watershed.
|
Zone |
Description |
Area (km2) |
Area (%) |
|---|---|---|---|
|
1 |
Good GWPZ |
3.13 |
6.73 |
|
2 |
Moderate GWPZ |
35.63 |
76.53 |
|
3 |
Low GWPZ |
7.80 |
16.75 |
|
Total |
46.56 |
100.00 |
5.3. Discussion of Case Study Findings
5.3.1. Interpretation of Spatial Patterns and Controlling Factors
The spatial pattern of groundwater potential zones in the Fork Fish Creek watershed highlights the dominant influence of topographic and geological controls in humid Appalachian headwater catchments. Although precipitation provides sufficient recharge input, steep slopes and well-developed drainage networks promote rapid surface runoff, thereby limiting infiltration across much of the basin. Consequently, enhanced groundwater potential is primarily observed in areas where topographic constraints are reduced and subsurface permeability is relatively high.
Geology and soil properties exert strong control on groundwater storage and movement by regulating porosity and hydraulic conductivity. Alluvial deposits and permeable sandstone units provide favorable conditions for groundwater accumulation, whereas shale-dominated lithologies and shallow residual soils restrict subsurface flow. The contribution of lineament density, while lower in relative weight, highlights the role of secondary porosity in facilitating groundwater movement in consolidated rock environments, consistent with observations from structurally controlled aquifer systems [52,54].
5.3.2. Comparison with Published Studies
Comparison of the Fork Fish Creek results with previously published GIS–MCDA groundwater potential studies reveals broad agreement in both spatial patterns and proportional distribution of groundwater potential zones. Numerous studies conducted in humid and semi-arid regions report dominance of moderate groundwater potential zones, with high-potential areas typically confined to low-lying, gently sloping, or structurally favorable locations [12,29]. The prevalence of moderate potential zones observed in this study aligns with these findings and reflects the combined influence of relief, lithologic variability, and drainage characteristics.
The consistency of results across contrasting climatic settings suggests that topography and subsurface properties often exert stronger control on groundwater potential than precipitation alone. The methodological framework applied in this study follows established GIS–MCDA practices reported in the literature, reinforcing the applicability of such approaches for groundwater potential assessment in small, data-limited watersheds.
5.3.3. Validation Adequacy and Uncertainty
Validation of the groundwater potential map was conducted qualitatively due to the limited availability of groundwater well yield data and long-term monitoring records within the study area. The spatial distribution of groundwater potential zones was evaluated for consistency with known hydrogeomorphic characteristics, including slope, drainage density, soil type, and geological setting. Similar qualitative validation approaches have been adopted in previous groundwater potential studies where quantitative validation data were unavailable [7,35].
Uncertainty in the results arises primarily from subjectivity in the AHP weighting process and limitations in the spatial resolution of input datasets. These uncertainties should be considered when interpreting groundwater potential zones, particularly for site-specific groundwater development. Nevertheless, the strong agreement between the spatial patterns identified in this study and those reported in comparable investigations supports the overall robustness and reliability of the applied methodology.
5.3.4. Supplementary Depth-Based Validation
Table 6 displays the USGS monitoring wells utilized for depth-proxy validation. Of the five wells examined, three are categorized within the intermediate depth range (85–90 ft), whereas two display very shallow depths (64–68 ft). All selected wells are at a depth not exceeding 95 feet.
Table 6. USGS groundwater wells used for depth-proxy validation of GWPZ.
|
USGS Station ID |
Well Name |
Latitude (°N) |
Longitude (°W) |
Well Depth (ft) |
Depth-Proxy GWPZ |
|---|---|---|---|---|---|
|
393856080324501 |
Wet-0078 |
39.64897157 |
−80.54564060 |
90 |
Moderate |
|
393306080313301 |
Wet-0139 |
39.55169444 |
−80.52588889 |
85 |
Moderate |
|
393157080384202 |
Wet-0093 |
39.53258198 |
−80.64481870 |
68 |
Good |
|
392945080380201 |
Wet-0140 |
39.49580556 |
−80.63383330 |
85 |
Moderate |
|
393042080443101 |
Wet-0090 |
39.51174715 |
−80.74176889 |
64 |
Good |
This distribution corresponds with the delineated groundwater potential pattern, wherein nearly 76% of the watershed was categorized as Moderate potential. The prevalence of moderate-depth wells indicates that the watershed is primarily defined by intermediate groundwater availability, with specific areas exhibiting relatively higher potential. While well depth serves as an indirect proxy affected by local drilling methodologies and aquifer characteristics, the correlation between recorded well depths and classified potential maps offers corroborative empirical evidence for the reliability of the GIS–AHP groundwater potential delineation.
5.3.5. Regional Context and Comparative Interpretation
The GIS–AHP architecture utilized in this study adheres to recognized groundwater potential mapping techniques, although its implementation in humid Appalachian headwater catchments yields significant regional insights. Numerous GIS–MCDA/GIS–AHP groundwater potential investigations have been performed in semi-arid or dry environments, where recharge constraints and climatic water shortages significantly affect groundwater distribution patterns [13].
In these contexts, precipitation and lithology often serve as primary determinants, with groundwater potential zones typically aggregating around geomorphically advantageous or structurally impacted recharge regions [54].
The current study location is a humid, forested Appalachian headwater habitat marked by substantial precipitation, intricate terrain, and diverse lithology. Under these circumstances, terrain and drainage controls (e.g., slope and drainage density) can significantly influence infiltration opportunities and runoff distribution, indicating that geographic variations in groundwater potential are not only determined by precipitation magnitude. The prevalence of the moderate groundwater potential class (~76%) indicates the hydrogeomorphic intricacy of humid mountainous regions, where infiltration and subsurface storage conditions exhibit spatial heterogeneity without significant recharge limitations.
This pattern contrasts with several semi-arid studies that indicate broader zones of low groundwater potential resulting from climatic water constraints [8,13]. The relatively moderate-dominated distribution noted here indicates that in humid Appalachian environments, topography, drainage patterns, and subsurface conditions may have a more significant impact than climatic factors alone, highlighting that groundwater potential outcomes are highly region-specific and that findings from semi-arid areas cannot be directly extrapolated to humid mountainous watersheds.
6. Conclusions
This study integrated a comprehensive review of GIS and multi-criteria decision analysis approaches for groundwater potential mapping with a case study application in the Fork Fish Creek watershed, West Virginia. The review highlighted the widespread adoption of GIS-MCDA frameworks, particularly the Analytical Hierarchy Process, for synthesizing heterogeneous hydrogeological, topographic, and land surface information to delineate groundwater potential zones in data-limited regions. Common thematic criteria identified across the literature include precipitation, geology, slope, drainage characteristics, land use and land cover, and structural features, with variations in relative importance driven by regional physiographic and climatic conditions.
Application of the Geographic Information Systems (GIS) integrated with the Analytical Hierarchy Process (AHP) methodology to the Fork Fish Creek watershed demonstrated the effectiveness of this integrated approach in a small, humid Appalachian headwater basin characterized by complex terrain and variable lithology. The resulting groundwater potential map classified the watershed into good, moderate, and low potential zones, with moderate potential areas occupying the largest proportion of the basin. This spatial pattern reflects the combined influence of dissected topography, drainage density, and lithologic heterogeneity, which constrain extensive groundwater storage despite adequate precipitation. Areas of good groundwater potential were primarily confined to valley bottoms and floodplain environments where gentler slopes, lower drainage density, and favorable subsurface conditions enhance infiltration and groundwater accumulation.
The consistency of the case study results with patterns reported in comparable GIS-MCDA studies supports the broader applicability of the approach for groundwater assessment in structurally complex and data-scarce settings. Although the availability of groundwater monitoring data limited quantitative validation, qualitative evaluation against known hydrogeomorphic conditions and comparison with published studies indicate that the results are physically reasonable and methodologically robust.
Despite these strengths, several limitations should be acknowledged. Subjectivity inherent in AHP-based weighting, uncertainties associated with input data resolution, and the absence of extensive field-based validation may influence the precision of delineated groundwater potential zones. Future research should focus on incorporating groundwater level observations, well yield data, and hydrogeochemical indicators to strengthen validation, as well as exploring sensitivity and uncertainty analyses to assess the robustness of MCDA-derived results. Integration of machine learning approaches with GIS-MCDA frameworks also offers promising opportunities to improve predictive performance and reduce subjectivity in groundwater potential mapping.
Overall, this study demonstrates that GIS-based multi-criteria decision analysis provides a practical and transferable framework for groundwater potential assessment at the watershed scale. By combining insights from the literature with site-specific analysis, the approach offers valuable support for groundwater planning, resource prioritization, and sustainable water management in similar physiographic regions.
7. Limitations and Future Work
Despite the strengths of the integrated GIS–MCDA framework applied in this study, several limitations should be acknowledged. First, the Analytical Hierarchy Process relies on expert judgment for weighting thematic criteria, which introduces a degree of subjectivity into the analysis. Although consistency ratios indicated acceptable judgment reliability, alternative weighting schemes or sensitivity analyses could further evaluate the robustness of the results. Second, the spatial resolution and accuracy of input datasets, including soil, land use, and land cover, and lineament information, may influence the delineation of groundwater potential zones, particularly at local scales.
Validation of the groundwater potential map was constrained by the limited availability of groundwater well yield data and long-term monitoring records within the study area. As a result, validation was conducted qualitatively through comparison with known hydrogeomorphic conditions and previously published studies. Future research should prioritize the incorporation of quantitative field data, such as groundwater level measurements, pumping test results, and hydrogeochemical indicators, to improve validation and confidence in predicted groundwater potential zones.
Further advancements may be achieved by integrating machine learning and data-driven approaches with GIS–MCDA frameworks to reduce subjectivity and enhance predictive performance [56,57]. Comparative evaluation of MCDA-based results with machine learning models could provide valuable insights into the strengths and limitations of each approach. Future research could integrate GIS–AHP with machine learning techniques (e.g., Random Forest, Support Vector Machine, or Artificial Neural Networks) to enhance predictive accuracy and reduce subjectivity in weighting schemes. Additionally, incorporating climate change scenarios and projected precipitation variability would support long-term groundwater planning and resilience assessment in humid Appalachian headwater catchments. Additionally, extending the analysis to incorporate temporal variability in recharge, land use change, and climate-driven hydrological dynamics would improve the applicability of groundwater potential assessments for long-term water resource planning.
Statement of the Use of Generative AI and AI-Assisted Technologies in the Writing Process
During the preparation of this manuscript, the authors used OpenAI to improve readability and grammatical clarity. After using this tool/service, the authors reviewed and edited the content as needed and take full responsibility for the content of the published article.
Author Contributions
Conceptualization, A.S. and D.D.; Methodology, A.S. and A.K.; Software, D.D. and A.K.; Validation, B.P. (Bibas Pokhrel), S.S. and B.P. (Bishal Poudel); Formal Analysis, D.D. and S.S.; Investigation, S.S.; Resources, B.P. (Bishal Poudel); Data Curation, A.S.; Writing—Original Draft Preparation, B.P. (Bibas Pokhrel) and B.P. (Bishal Poudel); Writing—Review & Editing, A.S., B.P. (Bibas Pokhrel) and A.K.; Visualization, A.S. and S.S.; Supervision, A.K.
Ethics Statement
Not applicable.
Informed Consent Statement
Not applicable.
Data Availability Statement
All data used in the study are available on public websites, and the links are provided in the data section of the manuscripts.
Funding
This research received no external funding.
Declaration of Competing Interest
The authors declare that they have no known competing financial interests or personal relationships that could have appeared to influence the work reported in this paper.
References
- Famiglietti JS. The Global Groundwater Crisis. Nat. Clim. Change 2014, 4, 945–948, DOI:10.1038/nclimate2425 [Google Scholar]
- Taylor RG, Scanlon B, Döll P, Rodell M, van Beek R, Wada Y, et al. Ground Water and Climate Change. Nat. Clim. Change 2013, 3, 322–329. DOI:10.1038/nclimate1744 [Google Scholar]
- Dahal D, Bhattarai N, Silwal A, Shrestha S, Shrestha B, Poudel B, et al. A Review on Climate Change Impacts on Freshwater Systems and Ecosystem Resilience. Water 2025, 17, 3052. DOI:10.3390/W17213052 [Google Scholar]
- Zacharia F, Nobert J, Liwenga E. Geospatial Mapping of Groundwater Potential for Irrigated Agriculture in Semi-Arid Kongwa District, Central Tanzania. Front. Water 2025, 7, 1679500. DOI:10.3389/FRWA.2025.1679500 [Google Scholar]
- Famiglietti JS, Lo M, Ho SL, Bethune J, Anderson KJ, Syed TH, et al. Satellites Measure Recent Rates of Groundwater Depletion in California’s Central Valley. Geophys. Res. Lett. 2011, 38, L03403. DOI:10.1029/2010GL046442 [Google Scholar]
- Wada Y, van Beek LPH, Sperna Weiland FC, Chao BF, Wu Y, Bierkens MFP. Past and Future Contribution of Global Groundwater Depletion to Sea-Level Rise. Geophys. Res. Lett. 2012, 39, L09402. DOI:10.1029/2012GL051230 [Google Scholar]
- Israil M, Al-hadithi M, Singhal DC, Kumar B. Groundwater-Recharge Estimation Using a Surface Electrical Resistivity Method in the Himalayan Foothill Region, India. Hydrogeol. J. 2006, 14, 44–50. DOI:10.1007/S10040-004-0391-8 [Google Scholar]
- Machiwal D, Jha MK, Mal BC. GIS-Based Assessment and Characterization of Groundwater Quality in a Hard-Rock Hilly Terrain of Western India. Environ. Monitor. Assess. 2011, 174, 645–663. DOI:10.1007/S10661-010-1485-5 [Google Scholar]
- Kumar A, Krishna AP. Assessment of Groundwater Potential Zones in Coal Mining Impacted Hard-Rock Terrain of India by Integrating Geospatial and Analytic Hierarchy Process (AHP) Approach. Geocarto Int. 2018, 33, 105–129. DOI:10.1080/10106049.2016.1232314 [Google Scholar]
- Saaty TL. What Is the Analytic Hierarchy Process? In Mathematical Models for Decision Support; Springer: Berlin/Heidelberg, Germany, 1988; pp. 109–121. DOI:10.1007/978-3-642-83555-1_5 [Google Scholar]
- Ghosh A, Adhikary PP, Bera B, Bhunia GS, Shit PK. Assessment of Groundwater Potential Zone Using MCDA and AHP Techniques: Case Study from a Tropical River Basin of India. Appl. Water Sci. 2022, 12, 37. DOI:10.1007/s13201-021-01548-5 [Google Scholar]
- Benjmel K, Amraoui F, Boutaleb S, Ouchchen M, Tahiri A, Touab A. Mapping of Groundwater Potential Zones in Crystalline Terrain Using Remote Sensing, GIS Techniques, and Multicriteria Data Analysis (Case of the Ighrem Region, Western Anti-Atlas, Morocco). Water 2020, 12, 471. DOI:10.3390/W12020471 [Google Scholar]
- Machiwal D, Jha MK, Mal BC. Assessment of Groundwater Potential in a Semi-Arid Region of India Using Remote Sensing, GIS and MCDM Techniques. Water Resour. Manag. 2011, 25, 1359–1386. DOI:10.1007/s11269-010-9749-y [Google Scholar]
- Ajayi OG, Nwadialor IJ, Odumosu JO, Adetunji OO, Abdulwasiu IO. Assessment and Delineation of Groundwater Potential Zones Using Integrated Geospatial Techniques and Analytic Hierarchy Process. Appl. Water Sci. 2022, 12, 276. DOI:10.1007/S13201-022-01802-4 [Google Scholar]
- Sander P. Lineaments in Groundwater Exploration: A Review of Applications and Limitations. Hydrogeol. J. 2006, 15, 71–74. DOI:10.1007/S10040-006-0138-9 [Google Scholar]
- Elshalkany M, Ahmed M, Sauck W, Abouelmagd A, Mansour S, El-Nekhiely IN, et al. Geophysical and Remote-Sensing Constraints on the Fault Controls on Groundwater Accumulation in Basement Rock Aquifers in Sinai, Egypt. Surv. Geophys. 2025, 46, 627–664. DOI:10.1007/S10712-025-09883-X [Google Scholar]
- Embaby A, Youssef YM, Abu El-Magd SA. Delineation of lineaments for groundwater prospecting in hard rocks: inferences from remote sensing and geophysical data. Environ Earth Sci 2024, 83(2), 62. https://doi.org/10.1007/s12665-023-11389-x. [Google Scholar]
- Pappaka RK, Nakkala AB, Badapalli PK, Gugulothu S, Anguluri R, Hasher FFB, et al. Machine Learning-Driven Groundwater Potential Zoning Using Geospatial Analytics and Random Forest in the Pandameru River Basin, South India. Sustainability 2025, 17, 3851. DOI:10.3390/SU17093851 [Google Scholar]
- Naghibi SA, Pourghasemi HR, Dixon B. GIS-Based Groundwater Potential Mapping Using Boosted Regression Tree, Classification and Regression Tree, and Random Forest Machine Learning Models in Iran. Environ. Monit. Assess. 2016, 188, 44, DOI:10.1007/S10661-015-5049-6 [Google Scholar]
- Ayadi Y, Gentilucci M, Ncibi K, Hadji R, Hamed Y. Assessment of a Groundwater Potential Zone Using Geospatial Artificial Intelligence (Geo-AI), Remote Sensing (RS), and GIS Tools in Majerda Transboundary Basin (North Africa). Water 2025, 17, 331. DOI:10.3390/W17030331 [Google Scholar]
- Maurya S, Pradhan RM, Singh A. Characterization of Structurally Complex Granitic Basement Rocks Using Multi-Geophysical Data: Insights into Subsurface Weathered Bedrock Zones and Groundwater Exploration. Near Surf. Geophys. 2025, 23, 324–342. DOI:10.1002/nsg.70007 [Google Scholar]
- Rukundo E, Doğan A. Dominant Influencing Factors of Groundwater Recharge Spatial Patterns in Ergene River Catchment, Turkey. Water 2019, 11, 653. DOI:10.3390/W11040653 [Google Scholar]
- Saha P, Gayen SK. Identification of Suitable Land for Sustainable Agricultural Practices in Koch Bihar District, West Bengal: A RS-GIS Based MCDA Approach. Environ. Dev. Sustain. 2025, 27, 1–42. DOI:10.1007/S10668-025-06262-9 [Google Scholar]
- Tabassum F, Krishna AP. Groundwater Potential Mapping Using AHP and Machine Learning in the Upper Subarnarekha River Basin, India. In Proceedings of the 2024 IEEE India Geoscience and Remote Sensing Symposium (InGARSS), Goa, India, 2–5 December 2024. DOI:10.1109/INGARSS61818.2024.10983912 [Google Scholar]
- Maghribi AA, Dimyati M, Supriatna S. Geographic Information System and Multi-Criteria Decision Analysis for the Determination of Groundwater Recharge Potential: Systematic Review. Water Suppl. 2022, 22, 7027–7039, DOI:10.2166/WS.2022.297 [Google Scholar]
- Kodihal S, Akhtar MP. GIS Based Multi-Criteria Decision Making to Identify Regional Groundwater Potential Zones: A Critical Review. Sustain. Water Resour. Manag. 2024, 10, 61. DOI:10.1007/S40899-024-01080-9 [Google Scholar]
- Lee S, Hyun Y, Lee S, Lee MJ. Groundwater Potential Mapping Using Remote Sensing and GIS-Based Machine Learning Techniques. Remote Sens. 2020, 12, 1200. DOI:10.3390/rs12071200 [Google Scholar]
- Ramasubramanian S, Ravindran A, Abishek SR, Christinal J, Kingston JV, Promilton AA. An Application of Remote Sensing and GIS Used in Groundwater Potential Zones for Sustainable Urban Development in Coastal Areas between Chettikulam and Kolachal, Southern India. Appl. Geomat. 2025, 17, 83–102. DOI:10.1007/s12518-024-00604-4 [Google Scholar]
- Jha MK, Chowdhury A, Chowdary VM, Peiffer S. Groundwater Management and Development by Integrated Remote Sensing and Geographic Information Systems: Prospects and Constraints. Water Resour. Manag. 2006, 21, 427–467. DOI:10.1007/S11269-006-9024-4 [Google Scholar]
- Saraf AK, Choudhury PR. Integrated Remote Sensing and GIS for Groundwater Exploration and Identification of Artificial Recharge Sites. Int. J. Remote Sens. 1998, 19, 1825–1841. DOI:10.1080/014311698215018 [Google Scholar]
- Melese T, Belay T. Groundwater Potential Zone Mapping Using Analytical Hierarchy Process and GIS in Muga Watershed, Abay Basin, Ethiopia. Glob. Chall. 2022, 6, 2100068. DOI:10.1002/GCH2.202100068 [Google Scholar]
- Doke AB, Zolekar RB, Patel H, Das S. Geospatial Mapping of Groundwater Potential Zones Using Multi-Criteria Decision-Making AHP Approach in a Hardrock Basaltic Terrain in India. Ecol. Indic. 2021, 127, 107685. DOI:10.1016/J.ECOLIND.2021.107685 [Google Scholar]
- Pinheiro G, Raj A, Rather IH. Role of Remote Sensing and GIS in Sustainable Computing Practices. In Green Computing for Sustainable Development; Taylor & Francis Group: Oxfordshire, UK, 2025; pp. 66–84. DOI:10.1201/9781003471356-4 [Google Scholar]
- Moore ID, Grayson RB, Ladson AR. Digital Terrain Modelling: A Review of Hydrological, Geomorphological, and Biological Applications. Hydrol. Process. 1991, 5, 3–30. DOI:10.1002/HYP.3360050103 [Google Scholar]
- Nag SK. Delineation of Groundwater Potential Zones in Hard Rock Terrain in Kashipur Block, Purulia District, West Bengal, Using Geospatial Techniques. Int. J. Waste Resour. 2016, 6, 1–13. DOI:10.4172/2252-5211.1000201 [Google Scholar]
- Mabee SB, Hardcastle KC, Wise DU. A Method of Collecting and Analyzing Lineaments for Regional-Scale Fractured-Bedrock Aquifer Studies. Groundwater 1994, 32, 884–894. DOI:10.1111/J.1745-6584 [Google Scholar]
- Singh LK, Jha MK, Chowdary VM. Assessing the Accuracy of GIS-Based Multi-Criteria Decision Analysis Approaches for Mapping Groundwater Potential. Ecol. Indic. 2018, 91, 24–37. DOI:10.1016/J.ECOLIND.2018.03.070 [Google Scholar]
- Malczewski J. GIS and Multicriteria Decision Analysis; John Wiley & Sons: Hoboken, NJ, USA, 1999; p. 392. [Google Scholar]
- Forman EH. Multi Criteria Decision Making and the Analytic Hierarchy Process. In Readings in Multiple Criteria Decision Aid; Springer: Berlin/Heidelberg, Germany, 1990; pp. 295–318. DOI:10.1007/978-3-642-75935-2_13 [Google Scholar]
- Patel DK, Thakur TK, Thakur A, Karuppannan S, Swamy SL, Pant RR. Groundwater Potential Zone Mapping Using AHP and Geospatial Techniques in the Upper Narmada Basin, Central India. Discov. Sustain. 2024, 5, 355. DOI:10.1007/S43621-024-00560-4 [Google Scholar]
- Shinde SP, Barai VN, Gavit BK, Kadam SA, Atre AA, Pande CB, et al. Assessment of Groundwater Potential Zone Mapping for Semi-Arid Environment Areas Using AHP and MIF Techniques. Environ. Sci. Eur. 2024, 36, 87. DOI:10.1186/S12302-024-00906-9 [Google Scholar]
- Pirasteh S, Samad A, Ahmad R, Thakural LN, Khan HH, Chauhan P, et al. Geospatial and AHP Based Identification of Potential Zones for Groundwater Recharge in Haridwar District of India. Front. Environ. Sci. 2025, 13, 1421918. DOI:10.3389/fenvs.2025.1421918 [Google Scholar]
- Doke A. Delineation of the Groundwater Potential Using Remote Sensing and GIS: A Case Study of Ulhas Basin, Maharashtra, India. Arch. Photogram. Cartogr. Remote Sens. 2019, 31, 49–64. DOI:10.2478/apcrs-2019-0004 [Google Scholar]
- Singh SK, Zeddies M, Shankar U, Griffiths GA. Potential Groundwater Recharge Zones within New Zealand. Geosci. Front. 2019, 10, 1065–1072. DOI:10.1016/J.GSF.2018.05.018 [Google Scholar]
- Kamaraj P, Jothimani M, Panda B, Sabarathinam C. Mapping of Groundwater Potential Zones by Integrating Remote Sensing, Geophysics, GIS, and AHP in a Hard Rock Terrain. Urban Clim. 2023, 51, 101610. DOI:10.1016/J.UCLIM.2023.101610 [Google Scholar]
- Kinzelbach W, Wang H, Li Y, Wang L, Li N. Groundwater Overexploitation in the North China Plain: A Path to Sustainability; Springer: Singapore, 2022; p. 157. [Google Scholar]
- Horton RE. Erosional Development of Streams and Their Drainage Basins Hydrophysical Approach to Quantitative Morphology. Geol. Soc. Am. Bull. 1945, 56, 275–370. DOI:10.1130/0016-7606(1945)56[275:EDOSAT]2.0.CO;2 [Google Scholar]
- Achu AL, Reghunath R, Thomas J. Mapping of Groundwater Recharge Potential Zones and Identification of Suitable Site-Specific Recharge Mechanisms in a Tropical River Basin. Earth Syst. Environ. 2019, 4, 131–145. DOI:10.1007/S41748-019-00138-5 [Google Scholar]
- Meng F, Khan MI, Naqvi SAA, Sarwar A, Islam F, Ali M, et al. Identification and Mapping of Groundwater Recharge Zones Using Multi Influencing Factor and Analytical Hierarchy Process. Sci. Rep. 2024, 14, 19240. DOI:10.1038/s41598-024-70324-7 [Google Scholar]
- Ifediegwu SI. Assessment of Groundwater Potential Zones Using GIS and AHP Techniques: A Case Study of the Lafia District, Nasarawa State, Nigeria. Appl. Water Sci. 2021, 12, 10. DOI:10.1007/S13201-021-01556-5 [Google Scholar]
- Balasubramaniyan G, Ganesan DA, Murugesan B, Swaminathan B, Karuppannan S, Duraisamy K. AHP and Geospatial Technology-Based Assessment of Groundwater Potential Zones in Natham Taluk, Tamil Nadu, India. Sci. Rep. 2025, 15, 28045. DOI:10.1038/s41598-025-13829-z [Google Scholar]
- Shekhar S, Pandey AC. Delineation of Groundwater Potential Zone in Hard Rock Terrain of India Using Remote Sensing, Geographical Information System (GIS) and Analytic Hierarchy Process (AHP) Techniques. Geocarto Int. 2015, 30, 402–421. DOI:10.1080/10106049.2014.894584 [Google Scholar]
- Al-Djazouli MO, Elmorabiti K, Rahimi A, Amellah O, Fadil OAM. Delineating of Groundwater Potential Zones Based on Remote Sensing, GIS and Analytical Hierarchical Process: A Case of Waddai, Eastern Chad. GeoJournal 2020, 86, 1881–1894. DOI:10.1007/S10708-020-10160-0 [Google Scholar]
- Elmahdy S, Mohamed M, Ali T. Land Use/Land Cover Changes Impact on Groundwater Level and Quality in the Northern Part of the United Arab Emirates. Remote Sens. 2020, 12, 1715. DOI:10.3390/RS12111715 [Google Scholar]
- Jasrotia AS, Singh R. Modeling Runoff and Soil Erosion in a Catchment Area, Using the GIS, in the Himalayan Region, India. Environ. Geol. 2006, 51, 29–37. DOI:10.1007/S00254-006-0301-6 [Google Scholar]
- Dahal D, Ale Magar B, Aryal A, Poudel B, Banjara M, Kalra A. Analyzing Climate Dynamics and Developing Machine Learning Models for Flood Prediction in Sacramento, California. Hydroecol. Eng. 2024, 1, 10003. DOI:10.70322/HEE.2024.10003 [Google Scholar]
- Silwal A, Subedi A, Tamrakar R, Dahal K, Dahal D, Ekpetere KO, et al. A Comprehensive Review of Machine Learning and Deep Learning Methods for Flood Inundation Mapping. Earth 2026, 7, 44. DOI:10.3390/earth7020044 [Google Scholar]