Understanding the Genetic Diversity of Bacteria Isolated from Across the Atacama Desert

Understanding the Genetic Diversity of Bacteria Isolated from Across the Atacama Desert
Nicole Taylor Cavanaugh
1,†
 Alicyn Reverdy Pearson
1,†
Elliot Ingraham
1
Elizabeth Amorelli
1
Austen Herlihy
2
Nathan Thewedros
1
Matteo Couto Frignani
2
Marcello Twahirwa
1
Carlos Riquelme
3
Yunrong Chai
1
Veronica Godoy-Carter
1,*
Alicyn Reverdy Pearson
1,†
Elliot Ingraham
1
Elizabeth Amorelli
1
Austen Herlihy
2
Nathan Thewedros
1
Matteo Couto Frignani
2
Marcello Twahirwa
1
Carlos Riquelme
3
Yunrong Chai
1
Veronica Godoy-Carter
1,*
Received: 26 August 2025 Revised: 14 October 2025 Accepted: 04 December 2025 Published: 12 December 2025

© 2025 The authors. This is an open access article under the Creative Commons Attribution 4.0 International License (https://creativecommons.org/licenses/by/4.0/).
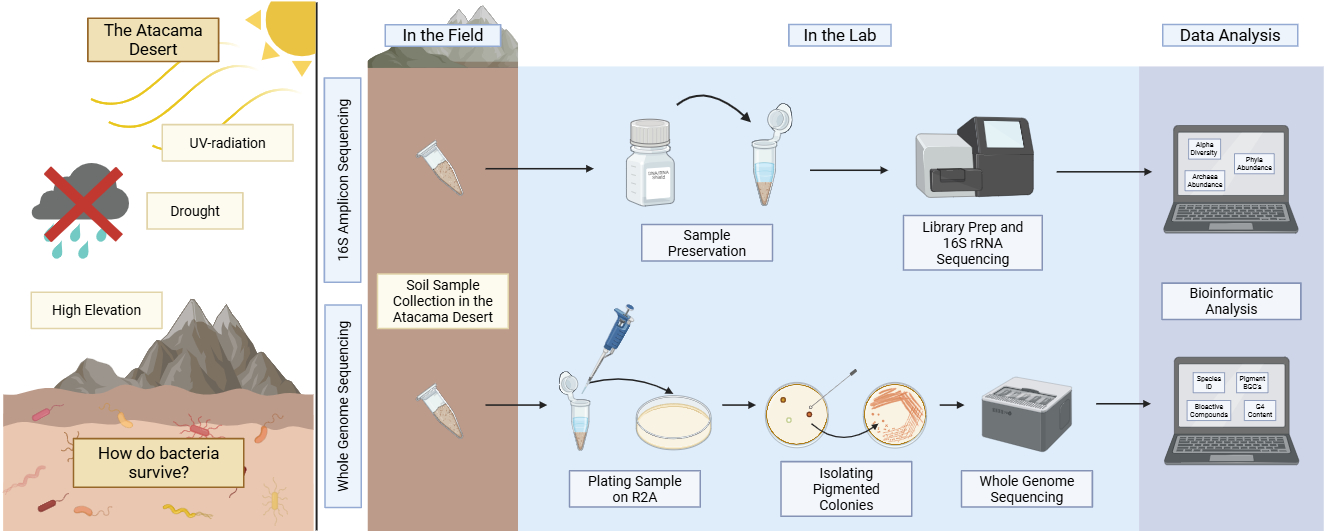
Graphical Abstract
1. Introduction
Even the harshest landscapes can be home to microbial life. Microbes have been identified as far as humans have been able to sample, from the deep depths of the sea floor to the Arctic to near the centers of active volcanoes [1,2,3]. The conventional wisdom has been that archaea, not bacteria, are usually found in the harshest environments since they have a number of key adaptations to survive in extreme conditions [4]. Understanding how bacteria survive stressful conditions is essential to many areas, including agriculture, biotechnology, and human health.
Bacteria capable of living in harsh conditions are called extremophiles, known for encoding adaptations to help them survive and thrive. Examples include structural changes in the DNA itself, such as G-quadruplex formation (G4), and/or high GC content, pigment production, biofilm formation, production of unique secondary metabolites, and antibiotic resistance mechanisms, among others. Some bacteria produce pigments that protect them from damage by UV rays, such as melanin or carotenoids [5,6]. These pigments provide a physical barrier against UV damage as well as protect cells from reactive oxygen species (ROS) and free radicals [5,6,7]. In addition, many bacteria produce antimicrobial compounds to help ward off competing species and/or be involved in signaling, quorum sensing, impacting virulence, and in DNA repair [8,9].
Many bacteria live in nature as biofilms, which are multicellular communities bound together by a self-produced matrix [10]. Many species can come together to form these matrix-bound communities [11]. The matrix is made up of sugars, proteins, DNA, etc., known to be beneficial to the community [10]. Benefits include providing a medium for concentrating and sharing nutrients, adding a protective barrier to protect the community from antimicrobials, maintaining hydration, and protecting cells from UV radiation [10,12,13,14]. In addition, some bacteria within the biofilm produce compounds that inhibit the growth of other organisms to protect their community and resources [15]. On the other hand, bacterial cells also develop resistance mechanisms to help them withstand inhibitory compounds produced by others [16,17].
Notably, the DNA sequence itself can be an adaptation. DNA is made up of nucleotide pairings, where adenine (A) pairs with thymine (T) and guanine (G) pairs with cytosine (C) [18]. DNA that is higher in GC content may have stronger DNA stability due to more favorable nucleotide stacking patterns [19]. It has also been shown in plants that individuals that live in cold or dry climates are more likely to have a high GC content [20]. Sections of DNA that contain several runs of guanines are sometimes capable of forming G-quadruplexes (G4’s), which are a non-helical secondary structure of DNA [21]. G4’s forms in a wide variety of organisms, including bacteria, and serves a variety of functions. While investigating bacterial G4 functions is a newly popular field, it has been shown that G4’s in bacteria often concentrate near promoter regions [22]. In particular, RecA-dependent DNA repair pathways in Deinococcus radiodurans and Deinococcus geothermalis, known for being able to withstand lethal doses of radiation, are partially regulated by G4’s [21].
One environment that is a high priority for scientists studying extremophiles is the Atacama Desert, located in northern Chile, South America. The Atacama Desert is recognized as one of the most ancient, driest, and most UV-irradiated deserts on Earth [23,24]. The desert spans approximately 128,000 km2 and sits at 2000–5000 m above sea level, limiting available oxygen and causing high levels of UV radiation [25,26]. Additionally, the desert lies between two mountain ranges, the Andes Mountains and the Chilean Coast mountain range, which severely limit precipitation in the area [23,24]. In fact, NASA has used the Atacama Desert as a testing ground for rovers and as a proxy for Mars [27]. For these reasons, the Atacama Desert remains an important site for studying how microorganisms can adapt to harsh environments. We have surveyed and sampled a variety of locations across the Atacama Desert to understand how eubacteria live there and the adaptations they have developed to survive this unique environment [28].
In July 2018, we performed global 16S sequencing on soil samples across 18 locations with the goal of understanding what bacterial species could live across the Atacama Desert. To enhance this work, in 2022 and 2024, we isolated and whole genome sequenced eight bacteria from a variety of locations throughout the desert. We selected environmental strains that produce pigments in different conditions. Pigments are visually obvious when produced by a bacterial colony, and thus pigment formation is a great starting point when looking for well-adapted bacterial candidates to sequence. Organisms may produce pigments for a variety of reasons, including ultra-violet (UV) protection, antioxidant purposes, biofilm control, and sequestering molecules, to name a few [6,29,30]. Using our genomic sequences, in addition to identifying the genes involved in pigment production, we can also identify other genes involved in mechanisms beneficial for survival in inhospitable environments, including production of antimicrobial and bioactive compounds, key biofilm formation genes, and cell to cell communication genes.
The knowledge gained from this survey will enable an evolutionary understanding of key survival strategies in bacteria, including pigment production, bioactive compound production, and biofilm formation. Comparing these data to similar data from known model bacteria provides insight into how distinctive these genes are across environmental species. Insight into how bacteria handle stress is relevant in many fields, including agriculture, biotechnology, and health.
2. Materials and Methods
2.1. 16S Amplicon Sequencing Methods
2.1.1. Sample Collection, Preparation, and Storage
Environmental samples were collected in May and June 2018 (Figure 1). Pictures of each location were reported by Reverdy Pearson in 2024 [28]. Each day had little to no cloud cover, no precipitation, temperatures ~16 °C at midday, and 10–20% humidity. At each location, soils were collected from a depth of 1–5 cm using sterile tools. Samples were stored in sterile 2 mL microcentrifuge tubes. The date and exact coordinates were recorded at each sampling location (Table S1). Samples were kept at ambient temperature, ranging from 1–21 °C, while in the field for up to 10 h. A fraction of some of the samples (~1 g) was kept in a solution in Zymo DNA/RNA shield (Zymo Research, Irvine, CA, USA) to preserve nucleic acids, and kept at room temperature as indicated by the manufacturer. Once brought to the laboratory, 20% (v/v) glycerol was added to the leftovers of all samples (~1 g). Samples were stored at −80 °C until thawed for further analysis.
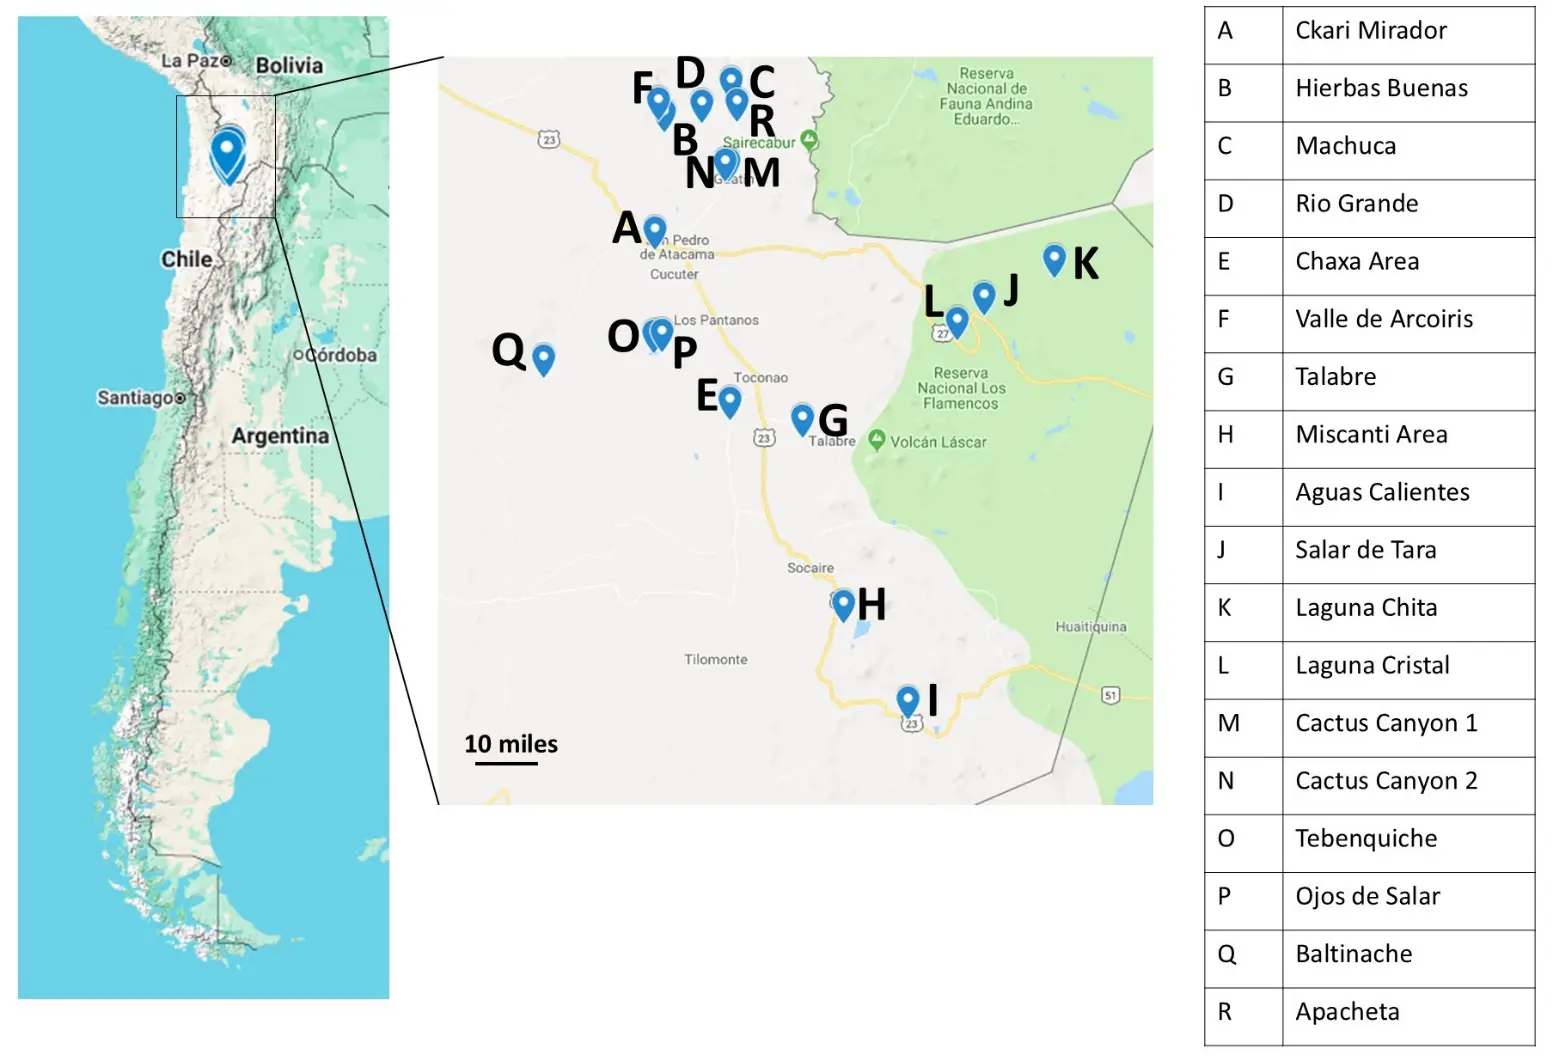
Figure 1. 2018 Soil Sampling Map. On a map of Chile (left) locations where samples were collected in 2018 for 16S rRNA sequencing analysis are highlighted. These are noted on a zoomed-in section of the map showing part of the Atacama Desert (center). Specific sampling locations are listed providing a key to each location (right).
2.1.2. 16S rRNA Analysis Sample Preparation
Approximately 1 g of soil sample was added to the UBiome microbiome sequencing kit tubes (UBiome, San Francisco, CA, USA). Samples were processed and analyzed with the ZymoBIOMICS® Service: Targeted Metagenomic Sequencing (Zymo Research, Irvine, CA, USA).
2.1.3. Targeted Library Preparation
The ZymoBIOMICS® DNA Miniprep Kit (Zymo Research, Irvine, CA, USA) was used for DNA extraction. Bacterial and archaeal 16S ribosomal RNA gene targeted sequencing was performed using the Quick-16STM NGS Library Prep Kit (Zymo Research, Irvine, CA, USA). The V3–V4 region of the 16S rRNA genes was amplified using primers 341f (CCTACGGGDGGCWGCAG, CCTAYGGGGYGCWGCAG, 17 bp) and 806r (GACTACNVGGGTMTCTAATCC, 24 bp) custom-designed by Zymo Research to provide the best coverage of the 16S rRNA gene while maintaining high sensitivity (Zymo Research, Irvine, CA, USA). The sequencing library was prepared using a Zymo-developed library preparation process in which PCR reactions were performed in real-time PCR machines to control cycles and limit PCR chimera formation. The final PCR products were quantified with qPCR fluorescence readings and pooled together based on equal molarity. The final pooled library was cleaned up with the Select-a-Size DNA Clean & ConcentratorTM (Zymo Research, Irvine, CA, USA), then quantified with TapeStation® and Qubit®.
2.1.4. 16S rRNA Sequencing
The final library was sequenced on Illumina® MiSeqTM with a v3 reagent kit (600 cycles). The sequencing was performed with >10% PhiX spike-in. Amplification was compared to a negative control standard.
2.1.5. Bioinformatic Analysis
Unique amplicon sequences, also termed amplicon sequence variants (ASV’s), were inferred from raw reads using the DADA2 pipeline [31]. Chimeric sequences were also removed with the DADA2 pipeline. Taxonomy was assigned based on the determined ASV’s using Uclust from Qiime v.1.9.1 with the Greengenes 16S database as the reference. The Visualization and Analysis of Microbial Population Structure (VAMPS) program was used for all subsequent diversity, abundance, and cluster plot analyses [32]. Alpha diversity, or richness, was quantified as the number of unique sequences found in the sample. Phyla and genera relative abundance were calculated as the percent number of sequences out of the total number of sequences in the sample. The cluster plots were calculated based on Morisita Horn parameters at the genus level.
2.2. Whole-Genome Methods
2.2.1. Sampling and Bacterial Isolation
To study how specific bacteria can handle stress, we started by isolating a variety of bacterial colonies from the desert soil. Samples were collected in July 2022 and July 2024. Weather conditions were similar across both years of sampling, with little to no cloud cover each day, no precipitation, and 10–20% humidity on average. Details are outlined in Table S2. At each sampling location, soils and other environmental samples were collected from between 1–5 cm depth using sterile tools (Figure 2). Samples were stored in sterile 2 mL microcentrifuge tubes. The date and exact coordinates were recorded at each sampling location (Table S2). Samples were kept at ambient temperature in the field, ranging from 1 °C to 20 °C. Within one week, samples were brought to the laboratory, and bacterial colonies were isolated after plating 100 µL of a water/sample slurry on Reasoner’s 2A (R2A) agar medium and incubating the plates at 28 °C for 48–72 h. R2A medium was selected because of its minimal nature, since sampling was done in areas that have low visible macro biodiversity, and nutrient availability is also likely low in these environments. This isolation yielded bacteria of many morphologies and colors. Each isolate was further purified by streaking and stocked in 20% (v/v) glycerol in water and stored at −80 °C.

Figure 2. Sampling locations 2022 and 2024. On a map of Chile (left), sampling locations from 2022 and 2024 are labeled. Locations are noted on a zoomed-in area of the map highlighting the Atacama Desert (center). In 2022, samples were collected from Baltinache (A), Geysers del Tatio (B), Quebrada de Aguas Blancas (C), and Valley of the Moon (D) (right). In 2024, samples were collected from Rio Grande-Bofedal (E) and from salt flats near the Valley of the Moon (F) (right).
2.2.2. Biofilm Growth
To test biofilm formation in isolates that were phenotypically like Bacillus subtilis, strains were grown for 4 h at 37 °C to OD600 = 1.0 in LB broth in shaking conditions. A volume of 2 µL of culture was spotted on LBGM agar plates-biofilm-inducing plates where LB is supplemented with 1% glycerol and 0.1 mM MnSO4 [33]. Colony biofilms were grown at 30 °C for 72 h before imaging.
A selection of pigment-producing isolates from a variety of desert environments became candidates for whole genome sequencing.
2.2.3. Genome Sequencing and Assembly
The genomes of three isolates, 0102A, 0209A, and 0909A, were sequenced by Illumina MiSeq (Illumina) as described in Cavanaugh et al., 2024. Details about sequencing and assembly can be found in the publication [34].
For isolates 1020B, 0516A, 0819A, Iso1_2024, and Iso2_2024, genomic DNA was isolated from 2-mL R2B cultures using Promega’s Wizard Genomic DNA Purification Kit (Promega, Madison, WI, USA), following the provided instructions for Gram-positive bacteria. Purified DNA was quantified using a NanoDrop spectrophotometer (Thermo Fisher Scientific, Waltham, MA, USA).
Purified gDNA was sequenced by Oxford Nanopore long-read sequencing (Oxford Nanopore Technologies, Oxford, UK) by Plasmidsaurus. Libraries were prepared using the V14 Ligation Sequencing Kit, and sequencing was performed using the MinION R10.4.1 flow cell (Oxford Nanopore Technologies). Before assembling the genomes, the 5% lowest quality reads were removed by Fitlong v0.2.1. [35]. Reads were downsampled to 250 Mb by Fitlong, and a rough assembly was generated with Miniasm v0.3. [36]. Reads were further downsampled to 100× coverage when coverage was over 100×. Quality reads were assembled using Flye v2.9.1 [37] and cleaned using Medaka v1.8.0 (Oxford Nanopore Technologies).
2.2.4. Construction of Phylogenetic Tree Using autoMLST
A phylogenetic tree was generated using the autoMLST2 web server using denovo mode [38]. The fasta files from each genome sequence obtained were uploaded to the webserver, and autoMLST2 compares the uploaded genomes to those in the Genome Taxonomy Database (GTDB) [39]. autoMLST2 was run using default parameters.
2.2.5. antiSMASH Analysis
Biosynthetic Gene Cluster (BGC) analysis was performed on all genomes using antiSMASH v8.0.2 using a relaxed detection strictness [40]. FASTA files were used, and KnownClusterBlast, TFBS analysis, activesitefinder, SubClusterBlast, and RREFinder analyses were selected from the “extra features” menu. Secondary metabolite-producing regions found in each genome were recorded.
2.2.6. Bioinformatic Analysis of Kocuria sp. Strains’ Carotenoid BGCs
For individual identification of carotenoid synthesis genes, DIAMOND v2.0.15 alignment software was utilized to align translated protein sequences against the RefSeq Bacterial Protein Database (REFSEQBP) [41]. Additionally, 0819A’s genome was aligned against all known Kocuria rhizophila proteins (KRAP), Iso2_2024’s genome was aligned against all known Kocuria turfanensis proteins (KTAP), and 1020B’s genome was aligned against all known Kocuria oceani proteins (KOAP). For REFSEQBP alignments, alignments were performed using very relaxed parameters, compared to the more stringent parameters used for the KTAP, KRAP, and KOAP alignments. For each strain, the top 15,000 best aligned proteins were selected and sorted for carotenoid biosynthesis genes. A pipeline was created using Bash and Python languages in the Linux environment, creating scripts to download databases, converting them to DIAMOND format, performing the DIAMOND alignments, assigning protein names to taxonomic IDs, arraying the data into an interpretable format, and back calculating genome positions of hits.
2.2.7. Analysis by G4 Hunter
Genome GC content and G4 quadruplex (G4) content were assessed by the G4 Hunter web application, available through DNA Analyser [42]. Genome FASTA files were uploaded to G4 Hunter and analyzed using a window size of 25 nt and a threshold of 1.2. The estimated number of G4’s, G4 frequency per thousand base pairs (kbp), GC content, and genome size were recorded.
3. Results
3.1. 16S rRNA Sequencing Analysis
To assess the microbial community composition of the samples, Illumina 16S rRNA sequencing was used directly on soil samples from the 18 sampling locations and analyzed for its Archaea and Bacteria composition. Importantly, the soil samples from Ojos de Salar and Baltinache did not provide reliable data when compared to the negative control and could not be analyzed any further. This indicates that the soil composition did not permit the identification of microbial life with the test used, or that the soil contained inhibitors of the processing used for the determination. Community composition was successful in the remaining 16 soil samples.
The focus of our search was on bacterial diversity. To infer the amount of diversity in each soil sample, ASV’s were assigned species identifications based on similarities with the Greengenes 16S database. The alpha diversity, a measurement of richness, ranged from 184 to 652 estimated species (Figure 3A). The two dominant phyla across all locations were Actinobacteria at 35.9% (brown bars) and Proteobacteria (dark blue bars) at 26.7% (Figure 3B). Our results are consistent with other studies that have investigated the bacterial content in the Atacama Desert [43,44,45]. Other studies have also found Bacteroidetes and Cyanobacteria to be the dominant phyla, however, they were sampling water, while we sampled soil [46,47,48]. Bacteroidetes is the third most abundant phylum across all the samples at 11.3% abundance (Figure 3B).
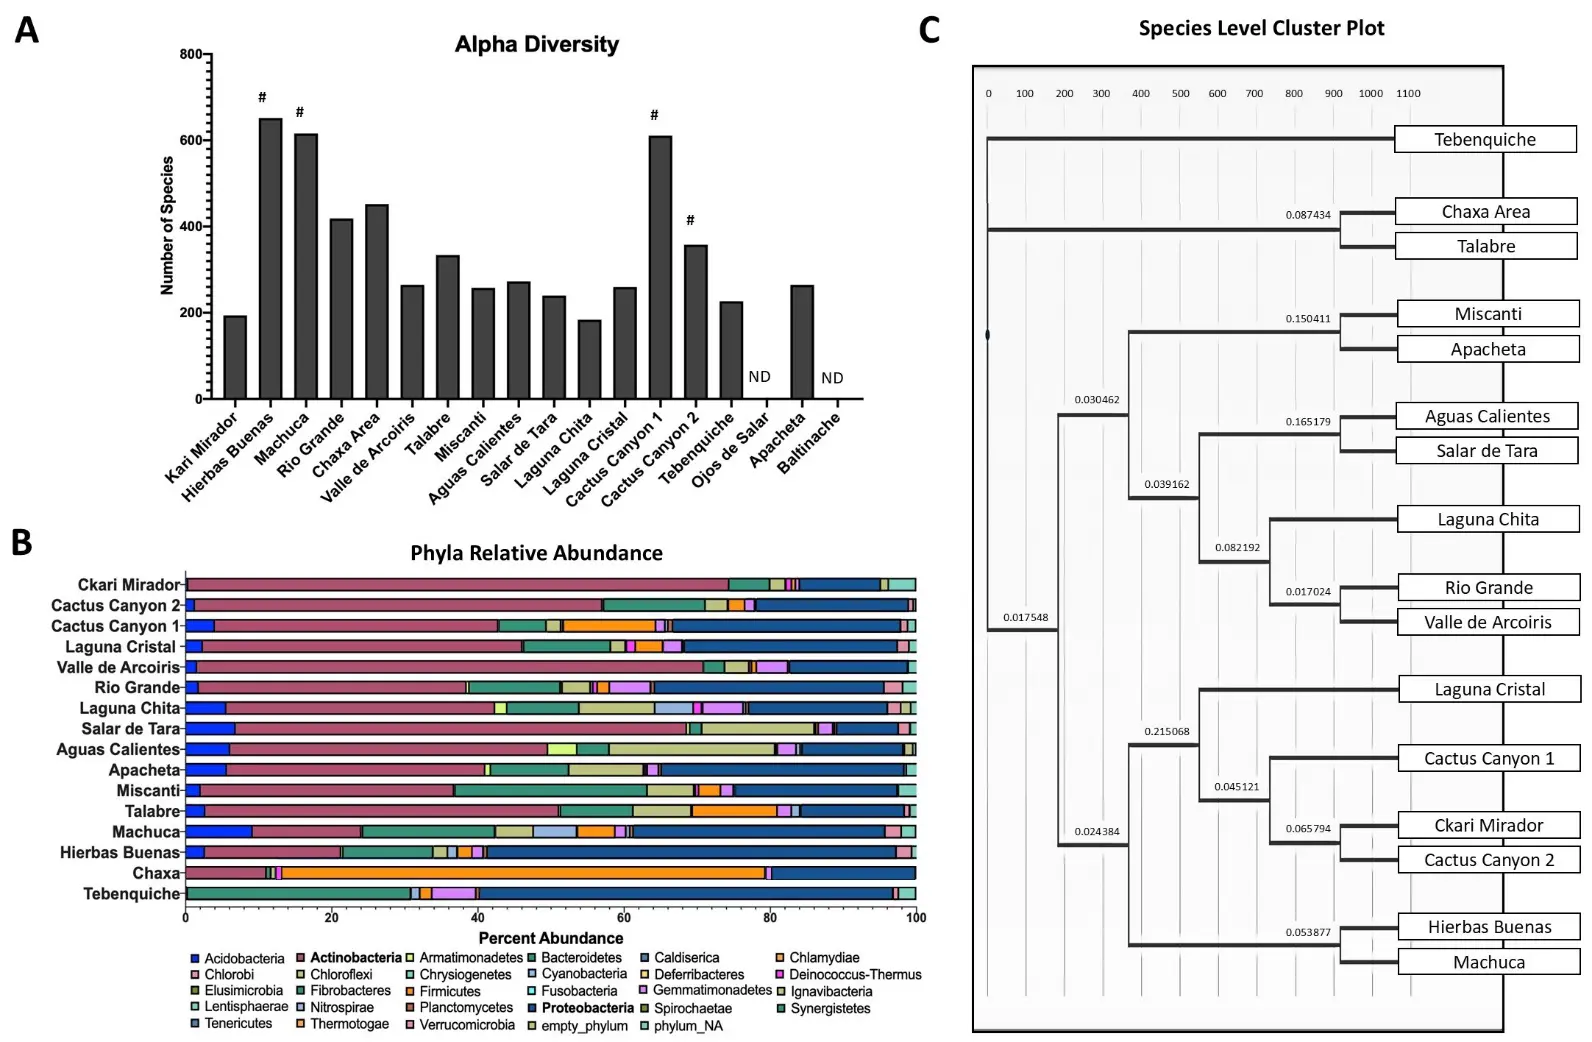
Figure 3. Illumina 16S rRNA sequencing provides a snapshot of bacterial diversity. (A) Quantification of alpha diversity in soil samples. Each bar represents the number of unique species detected in each soil sample. Limited but observable plant life is observed in the locations marked with a pound sign. Lack of sequences in Ojos de Salar or Baltinache is denoted as ND. (B) Bar chart of the phyla relative abundance within each sample. Each color represents a different phylum, and the length of the bar represents the percent abundance within that sample. Actinobacteria (brown) and Proteobacteria (dark blue) were the most abundant phyla. (C) Cluster plot dendrogram grouping samples based on genus similarities under Marisita-Horn analysis. Length of the bar represents the degree of similarity. Tebenquiche was the most different from the rest of the samples.
To compare bacterial diversity across the different sampling locations, we generated a genus level cluster plot (Figure 3C). The salt flat, Tebenquiche, was the outlier group, and the other salt flat, Chaxa, was in another outlier grouping with Talabre. The clustering of Apacheta and Miscanti is most likely due to their high altitude and shrub-containing characteristics. Salar de Tara and Aguas Calientes are closely located and near high altitude lakes (Figure 1). Rio Grande and Valle de Arcoiris are two dry and barren locations (Table S1). The clustering based on location similarities highlights that the genera are most likely selected by the environmental conditions.
Though our main interest was to find eubacteria, we were curious to learn about the percentage of Archaea in our samples, as they are well known extremophiles [49,50] and likely to be in the most extreme samples. In fact, we found that our levels of 1.1% (Figure 4) are comparable to levels of Archaea found in the other hyper-arid desert soils [43,49].
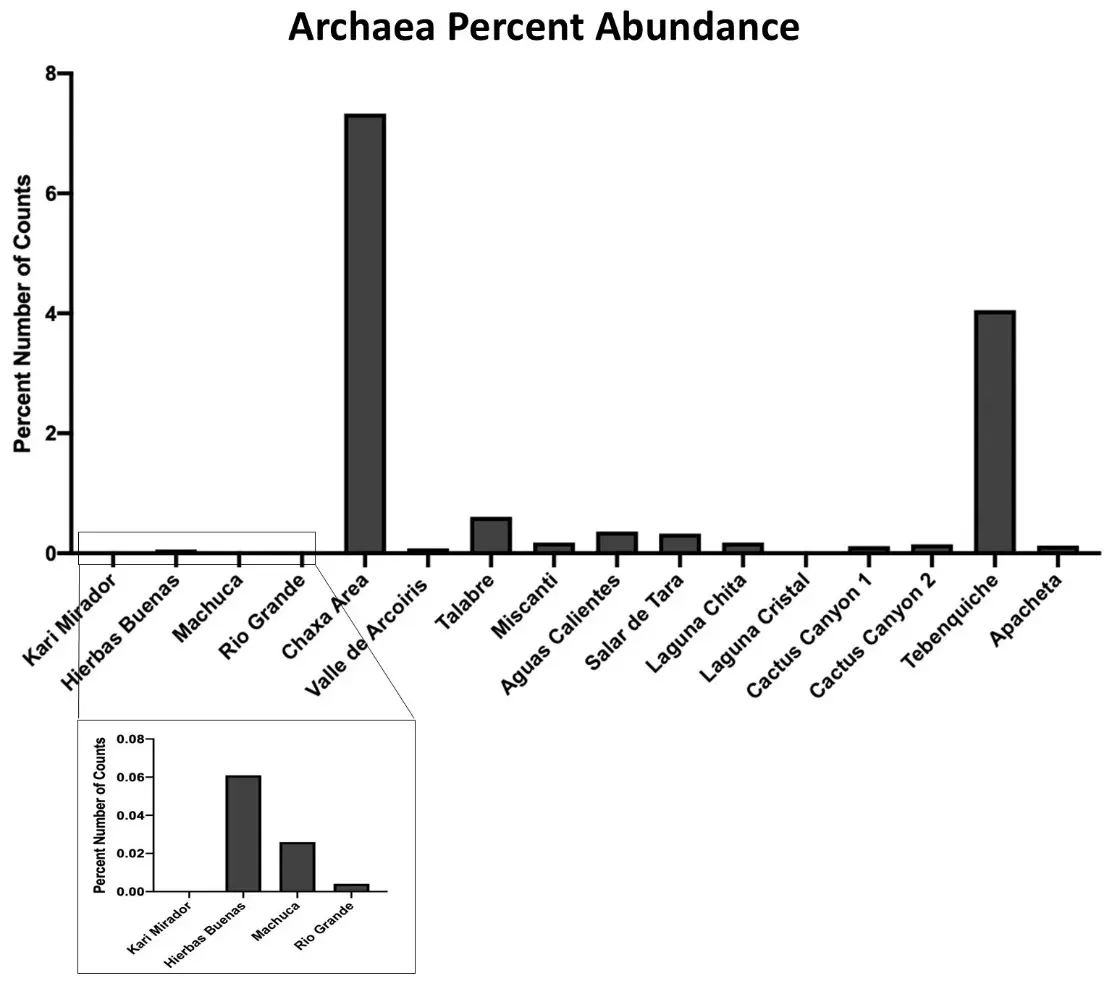
Figure 4. Archaeal makeup across sampling locations. The percent number of Archaea sequences of the total samples was calculated from the Illumina 16S rRNA sequencing data set for each location. The total makeup of all detected sequences was 1.14% Archaea. Chaxa and Tebenquiche had the highest abundance of Archaea. Ckari Mirador and Laguna Cristal contained no detection of Archaea (box is a zoomed in look at the values).
3.2. Genomic Evidence
Bacterial growth from environmental samples on R2A medium yielded many colonies (Figure S1). After bacteria were isolated from environmental samples on R2A medium, several (~30–50%) appeared to produce pigments. Isolates 1020B, 0819A, and Isolate 2 displayed strong yellow and orange pigmentation after growing on R2A medium for 3 days (Figure 5C–E). Two isolates also appeared to secrete blue and green pigments (Figure 5A,B).
Three isolates appeared to have similar colony morphology to Bacillus subtilis-0102A, 0209A, and 0909A. It is known that B. subtilis produces a pigment called pulcherrimin late in the biofilm formation cycle, regulating biofilm aging and disassembly [29]. When these isolates were grown on LBGM biofilm inducing medium, they produced a red-brown pigment that resembled pulcherrimin (Figure 5F–H). These eight isolates were selected to be subjected to whole genome sequencing (WGS) (Figure 5).
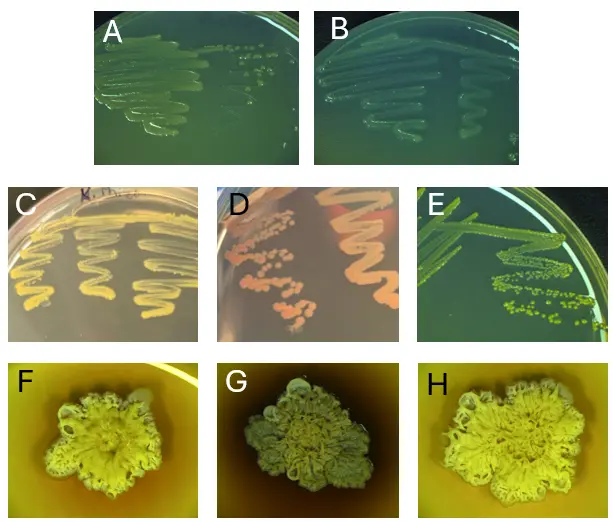
Figure 5. All isolates selected for WGS produce pigments. 0516A secretes a faint green pigment (A), Iso1_2024 secretes a blue pigment (B), 0819A and Iso2_2024 produce yellow pigments (C,E), and 1020B produces an orange pigment (D) on R2A medium. 0102A, 0209A, and 0909A secrete red-brown pigments when grown on LBGM biofilm-inducing medium (F–H).
After sequencing, all resulting genome FASTA files were aligned using autoMLST2 [38]. autoMLST2 uses multiple loci across the genome, focusing on housekeeping genes to provide higher resolution, to identify the most closely related species for each sequence by generating a multi-locus species tree (Figure S2). autoMLST2 automatically identified related genome sequences to create the species tree de novo and was able to identify the identities of most isolates to the species level. Iso1_2024 was identified as Pseudomonas aeruginosa, 0516A was identified as Pseudomonas rhodesiae, 0819A was identified as Kocuria rhizophila, 1020B was identified as Kocuria oceani, Iso2_2024 was identified as Kocuria turfanensis, and 0909A was identified as Bacillus mojavensis (Table 1). All identifications were made with a high level of confidence, according to the Mash distance [51], estimated average nucleotide identity (ANI), and p-value. The top hits for 0102A and 0209A identification were “Bacillus subtilis group”, rather than being matched directly with a species. The top three most similar species matches are listed in Table 2. Both strains are most closely related to Bacillus inaquosorum (Table 2).
Table 1. Species Identification for isolates with sequenced genomes by autoMLST2. Query organisms, those sequenced in this study, were aligned by autoMLST2 against a large database of sequences to find the most closely related species for each. Each organism’s top match is listed in the “Reference Name” column, and the sequence ID is listed under “Reference Assembly ID”. The genus, order, and whether the match was a type strain are listed in columns at the right. The quality of the match is assessed by Mash distance (a similarity assessment utilizing mutation distance and p-value significance, where a larger number indicates greater evolutionary distance), average estimated nucleotide identity (ANI—percent nucleotide similarity between two sequences), and p-value (statistical chance that the match was made by chance).
|
Query Organism |
Reference Assembly ID |
Reference Name |
Mash Distance |
Estimated Average Nucleotide Identity (ANI) |
p-Value |
Genus |
Order |
Type Strain |
|---|---|---|---|---|---|---|---|---|
|
0209A |
GCF_002153395 |
Bacillus subtilis Group |
0.0044 |
99.60% |
0 |
Bacillus |
Bacillales |
No |
|
Iso1_2024 |
GCF_001457615 |
Pseudomonas aeruginosa |
0.0072 |
99.30% |
0 |
Pseudomonas |
Pseudomonadales |
Yes |
|
0819A |
GCF_003667225 |
Kocuria rhizophila |
0.0135 |
98.70% |
0 |
Kocuria |
Actinomycetales |
Yes |
|
0909A |
GCF_000245335 |
Bacillus mojavensis |
0.0191 |
98.10% |
0 |
Bacillus |
Bacillales |
Yes |
|
1020B |
GCF_029524215 |
Kocuria oceani |
0.0198 |
98.00% |
0 |
Kocuria |
Actinomycetales |
No |
|
0102A |
GCF_002153395 |
Bacillus subtilis Group |
0.0208 |
97.90% |
0 |
Bacillus |
Bacillales |
No |
|
Iso2_2024 |
GCF_001580365 |
Kocuria turfanensis |
0.0211 |
97.90% |
0 |
Kocuria |
Actinomycetales |
Yes |
|
0516A |
GCF_007858255 |
Pseudomonas rhodesiae |
0.023 |
97.70% |
0 |
Pseudomonas_E |
Pseudomonadales |
Yes |
Table 2. The top three most similar species to 0102A and 0209A isolates identified by autoMLST2. Each organism’s top three species matches are listed in the “Reference Name” column, and the sequence ID’s are listed under “Reference Assembly ID”. For each match, the genus, order, and whether the match was a type strain are listed in columns at the right. The quality of the match is assessed by Mash distance (a similarity assessment utilizing mutation distance and p-value significance), average estimated nucleotide identity (ANI—percent nucleotide similarity between two sequences), and p-value (statistical chance that the match was made by chance). 0102A matches are listed in the gray rows, and 0209A matches are listed in the white rows.
|
Query Organism |
Reference Assembly ID |
Reference Name |
Mash Distance |
Estimated Average Nucleotide Identity (ANI) |
p-Value |
Genus |
Order |
Type Strain |
|---|---|---|---|---|---|---|---|---|
|
0102A |
GCF_000332645 |
Bacillus inaquosorum |
0.0596 |
94.00% |
0 |
Bacillus |
Bacillales |
Yes |
|
0102A |
GCF_004116955 |
Bacillus vallismortis |
0.0622 |
93.80% |
0 |
Bacillus |
Bacillales |
Yes |
|
0102A |
GCA_031316495 |
Bacillus spizizenii |
0.0633 |
93.70% |
0 |
Bacillus |
Bacillales |
Yes |
|
0209A |
GCF_000332645 |
Bacillus inaquosorum |
0.0598 |
94.00% |
0 |
Bacillus |
Bacillales |
Yes |
|
0209A |
GCF_004116955 |
Bacillus vallismortis |
0.0613 |
93.90% |
0 |
Bacillus |
Bacillales |
Yes |
|
0209A |
GCA_031316495 |
Bacillus spizizenii |
0.0656 |
93.40% |
0 |
Bacillus |
Bacillales |
Yes |
All genome FASTA files were analyzed by antiSMASH v8.0.2. [40]. antiSMASH identified 5–20 biosynthetic gene clusters (BGC’s) in each genome (Table 3). Potential pigment-producing BGC’s were identified in each genome that was sequenced (Table 4). Pulcherrimin clusters were identified in all Bacillus sp. genomes that were sequenced, 0102A, 0209A, and 0909A. Carotenoid clusters were identified in the three Kocuria sp. that were sequenced, 0102B, 0819A, and Iso2_2024. Pyoverdine SXM-1 and aryl polyene clusters were identified in 0516A, both of which may contribute to its green color. Pf-5 pyoverdine and pyocyanine clusters were both identified in Iso1_2024. These produce yellow-green and blue pigments, respectively.
Table 3. Number of Biosynthetic Gene Clusters (BGCs) Identified in Each Whole Genome Sequence. The total number of BGC’s was identified in each genome by antiSMASH.
|
Isolate |
# of BGC’s Identified |
|---|---|
|
0516A |
13 |
|
1020B |
7 |
|
0819A |
5 |
|
0102A |
17 |
|
0209A |
20 |
|
0909A |
17 |
|
Iso1_2024 |
16 |
|
Iso2_2024 |
7 |
Biosynthetic gene cluster analysis by antiSMASH identified that each Kocuria strain that was sequenced produced carotenoid pigments (Table 4) [40]. To understand what types of carotenoids each strain produces, DIAMOND v2.0.15 software was used to identify individual carotenoid genes [41]. It was determined that strains 0819A and 1020B produce yellow pigments that are like decaprenoxanthin and that strain Iso2_2024 produces an orange carotenoid closely related to bacterioruberin (Figure 6). Predicted colors of intermediates and products are depicted in small squares to the left of each pathway in Figure 6, which are colored either cream, yellow, orange, or red. The confidence in the enzyme identification is shown by placing enzyme names in empty white rectangles (high confidence) or grey rectangles (medium confidence). Confidence level was determined based on a combination of qualitative and quantitative assessments, factoring in percent identity matches, annotation name of the aligned protein, genome positioning relative to other genes in the pathway, and supporting literature from the Kocuria genus and species-specific carotenoid production.
Table 4. Pigment Clusters Identified by antiSMASH. antiSMASH identified potential pigment-producing BGC’s in each genome that was sequenced. Pulcherrimin clusters were identified in 0102A, 0209A, and 0909A. Carotenoid clusters were identified in 0102B, 0819A, and Iso2_2024. Pyoverdine SXM-1 and aryl polyene clusters were both identified in 0516A. Pf-5 pyoverdine and pyocyanine clusters were both identified in Iso1_2024. High similarity confidence is between 96–100%, while Low similarity is less than 50%.
|
Strain |
Contig |
From |
To |
Similarity Confidence |
Cluster Type |
Color |
|---|---|---|---|---|---|---|
|
0102A |
3 |
317,989 |
338,834 |
High |
pulcherriminic acid |
brown-red |
|
0209A |
2 |
625,311 |
646,057 |
High |
pulcherriminic acid |
brown-red |
|
0909A |
3 |
260,785 |
281,531 |
High |
pulcherriminic acid |
brown-red |
|
1020B |
1 |
3,314,706 |
3,356,792 |
Low |
carotenoid |
yellow |
|
0819A |
1 |
761,663 |
786,188 |
Low |
carotenoid |
yellow |
|
Iso2_2024 |
1 |
1,202,265 |
1,246,433 |
Low |
carotenoid |
orange |
|
0516A |
1 |
1,660,402 |
1,749,408 |
Low |
pyoverdine SXM-1 |
yellow-green |
|
0516A |
1 |
5,956,127 |
5,999,702 |
Low |
aryl polyene |
yellow |
|
Iso1_2024 |
1 |
3,827,676 |
3,961,195 |
Low |
Pf-5 pyoverdine |
yellow-green |
|
Iso1_2024 |
1 |
4,502,360 |
4,523,372 |
High |
pyocyanine |
blue |
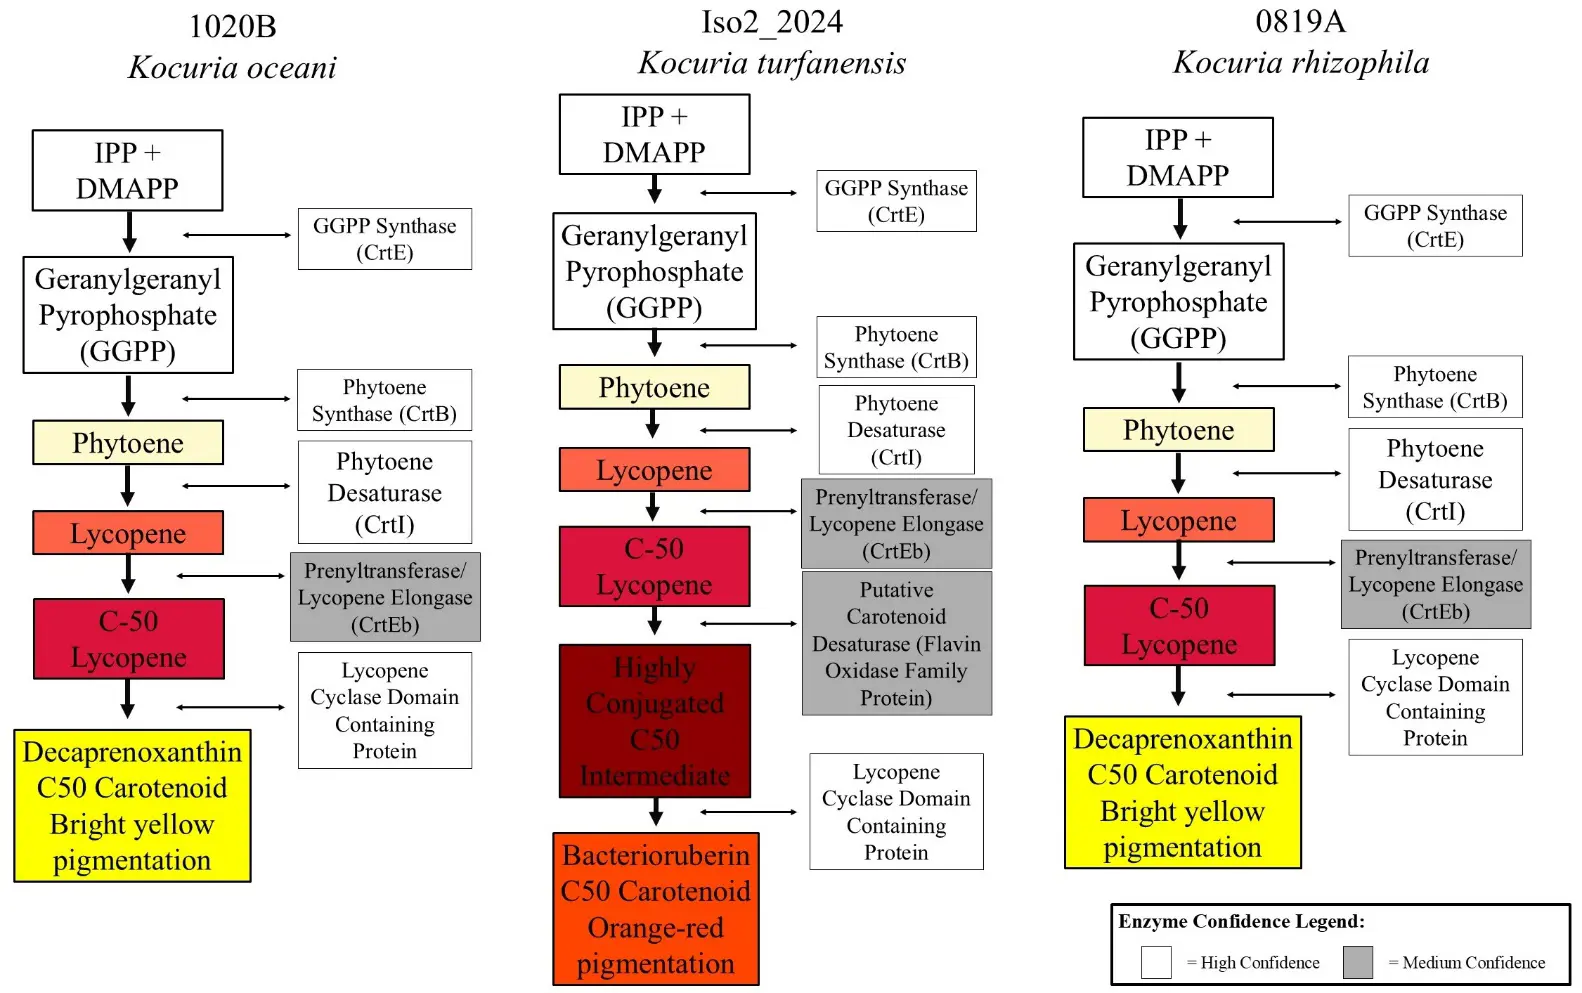
Figure 6. Theoretical pathways of carotenoid-producing Biosynthetic Gene Clusters in three Kocuria strains. K. oceani strain 1020B produces a yellow pigment like decaprenoxanthin (left). K. turfanensis produces an orange pigment like bacterioruberin (middle). K. rhizophila strain 0819A produces a yellow pigment like decaprenoxanthin (right). The intermediates and products that are produced through each pathway are shown in colored rectangles, each color representing the color of the compound listed. The enzymes that perform each reaction are listed in grey or white boxes, depending on the confidence of the prediction. High confidence is indicated by similarities of 96–100% and medium confidence by values that are 51–95%.
antiSMASH also identified antibiotic and/or bioactive compound BGC’s in each genome that was sequenced (Table 5) [40]. The Bacillus sp. isolates were predicted to produce a wide range of antibiotic compounds, including fengycin, bacillaene, macrolactin H, bacilysin, subtilosin A, bacillibactin, zwittermicin A, plipastatin, staphylococcin C55, and surfactins. The Kocuria sp. were each found to produce siderophores. The identified Pseudomonas sp. produces different varieties of bioactive compounds. 0516A, P. oceani, was shown to produce pyoverdine SXM-1, pyochelin, a betalactone, and ambactin. Iso1_2024, P. aeruginosa, was shown to produce pseudopaline, pyochelin, azetidomonamide, Pf-5 pyoverdine, L-2-amino-4-methoxy-trans-3-butenoic acid, hydrogen cyanide, pyocyanine, and a homoserine lactone.
Table 5. Identification of bioactive compound BGCs by antiSMASH in each genome sequence. All genomes are predicted to produce possible bioactive compounds. Results from each strain are clustered into rows with alternating gray or white colors for ease of visibility. High similarity indicates that the selected gene cluster is 96–100% similar to the predicted cluster type, and is likely to be as predicted. This likelihood decreases with medium and low similarities. Medium similarity indicates 51–95% similarity, while low similarity indicates less than 50% similarity.
|
Strain |
Contig |
From |
To |
Similarity |
Cluster Type |
|---|---|---|---|---|---|
|
0102A |
2 |
1 |
27,421 |
Medium |
fengycin |
|
0102A |
2 |
94,777 |
209,569 |
High |
bacillaene |
|
0102A |
2 |
473,171 |
563,633 |
High |
macrolactin H |
|
0102A |
3 |
31,390 |
72,808 |
High |
bacilysin |
|
0102A |
3 |
78,239 |
99,852 |
High |
subtilosin A |
|
0102A |
5 |
167,049 |
233,315 |
High |
bacillibactin |
|
0102A |
6 |
183,218 |
264,567 |
Low |
zwittermicin A |
|
0102A |
8 |
177,022 |
242,413 |
High |
surfactin |
|
0102A |
16 |
1 |
12,827 |
Low |
plipastatin |
|
0209A |
1 |
1 |
80,039 |
High |
fengycin |
|
0209A |
1 |
129,022 |
243,837 |
High |
bacillaene |
|
0209A |
1 |
475,315 |
565,767 |
High |
macrolactin H |
|
0209A |
2 |
88,066 |
115,943 |
High |
staphylococcin C55 α/staphylococcin C55 β |
|
0209A |
2 |
335,497 |
376,915 |
High |
bacilysin |
|
0209A |
2 |
379,906 |
401,519 |
High |
subtilosin A |
|
0209A |
2 |
920,550 |
986,881 |
High |
bacillibactin |
|
0209A |
3 |
1 |
22,199 |
Low |
plipastatin |
|
0209A |
4 |
212,369 |
293,721 |
Low |
zwittermicin A |
|
0209A |
5 |
194,941 |
220,118 |
Low |
surfactin |
|
0209A |
7 |
1 |
27,593 |
Low |
surfactin |
|
0209A |
12 |
1 |
13,658 |
Low |
plipastatin |
|
0209A |
13 |
1 |
10,500 |
Low |
plipastatin |
|
0909A |
2 |
1 |
27,607 |
High |
fengycin |
|
0909A |
3 |
528,659 |
550,271 |
High |
subtilosin A |
|
0909A |
3 |
554,481 |
595,899 |
High |
bacilysin |
|
0909A |
5 |
196,546 |
222,617 |
Low |
surfactin |
|
0909A |
6 |
1 |
27,764 |
Low |
surfactin |
|
0909A |
7 |
23,680 |
75,454 |
High |
bacillibactin |
|
0909A |
11 |
1 |
12,886 |
Low |
plipastatin |
|
1020B |
1 |
3,435,405 |
3,465,789 |
Low |
siderophore |
|
0819A |
1 |
2,248,980 |
2,278,905 |
na |
siderophore |
|
Iso2_2024 |
1 |
1,344,235 |
1,374,619 |
Low |
siderophore |
|
0516A |
1 |
1,660,402 |
1,749,408 |
Low |
pyoverdine SXM-1 |
|
0516A |
1 |
2,115,018 |
2,168,603 |
High |
pyochelin |
|
0516A |
1 |
3,080,942 |
3,109,289 |
na |
betalactone |
|
0516A |
1 |
5,598,641 |
5,642,018 |
Low |
ambactin |
|
Iso1_2024 |
1 |
150,340 |
172,429 |
High |
pseudopaline |
|
Iso1_2024 |
1 |
1,788,812 |
1,850,153 |
High |
pyochelin |
|
Iso1_2024 |
1 |
2,788,139 |
2,835,197 |
High |
azetidomonamide A/azetidomonamide B |
|
Iso1_2024 |
1 |
3,827,676 |
3,961,195 |
Low |
Pf-5 pyoverdine |
|
Iso1_2024 |
1 |
4,015,469 |
4,067,749 |
High |
L-2-amino-4-methoxy-trans-3-butenoic acid |
|
Iso1_2024 |
1 |
4,165,722 |
4,178,683 |
High |
hydrogen cyanide |
|
Iso1_2024 |
1 |
4,502,360 |
4,523,372 |
High |
pyocyanine |
|
Iso1_2024 |
1 |
5,016,612 |
5,037,217 |
na |
homoserine lactone |
Each genome from this study, along with similar strains from other environments, was analyzed by the G4 Hunter online server [42,52,53]. The Kocuria strains from this study had the highest G-quadruplex (G4) frequencies, above 4 occurrences per thousand base pairs (kb), or 11,606–19,373 total G4’s (Table 6). This was slightly higher than K. rhizophila strain 7_17 (GenBank ID: CP124833.1), which contained 10,368 G4’s at a frequency of 3.8 per 1 kb. The Pseudomonas sp. have comparatively lower G4 content. Strains 0516A and Iso1_2024 have a G4 frequency of 1.5 per 1 kb with a total of 9072 or 9632 total G4’s, respectively. These were slightly lower than G4 concentration in P. aeruginosa clinical strain AR_0230, which contained 10,336 G4s at a frequency of 1.5 per 1 kb [52]. The Bacillus strains have the lowest estimated G4 content and are each estimated to have a 0.4 per 1 kb frequency, or 1462–1693 G4’s. This is consistent with estimated values for B. subtilis strain 3610 [53]. These differences in frequency align with the GC content of each genome. The Kocuria species had GC contents over 70%, the Pseudomonas strains had GC percents in the 60%’s, and the Bacillus strains all had GC percents in the 40%’s.
Table 6. G4s and GC Content of isolates as assessed by G4 Hunter. Sequence files of environmental strains from this study (white rows) and similar strains from other environments (gray rows) were assessed by the G4 Hunter webserver. The number of G4’s per sequence, frequency of G4 occurrences, GC content of the genome, and genome size for each sequence are outlined here.
|
Strain |
Species |
G4’s |
Frequency per kb |
GC% |
Genome Size (Mbp) |
|---|---|---|---|---|---|
|
1020B |
Kocuria oceani |
19,373 |
4.8 |
72.8 |
4.03 |
|
0819A |
Kocuria rhizophila |
11,606 |
4.1 |
70.5 |
2.8 |
|
Iso2_2024 |
Kocuria turfanensis |
18,314 |
4.8 |
73.3 |
3.78 |
|
7_17 |
Kocuria rhizophila |
10,368 |
3.8 |
71.3 |
2.69 |
|
0102A |
Bacillus inaquosorum |
1676 |
0.4 |
43.9 |
4.2 |
|
0209A |
Bacillus inaquosorum |
1693 |
0.4 |
44 |
4.17 |
|
0909A |
Bacillus mojavensis |
1462 |
0.4 |
43.7 |
3.9 |
|
3610 |
Bacillus subtilis |
1601 |
0.4 |
43.5 |
4.22 |
|
0516A |
Pseudomonas rhodesiae |
9072 |
1.5 |
60.1 |
6.24 |
|
Iso1_2024 |
Pseudomonas aeruginosa |
9632 |
1.5 |
66.3 |
6.51 |
|
AR_0230 |
Pseudomonas aeruginosa |
10,336 |
1.5 |
65.9 |
7.00 |
4. Discussion
In this study, we used sequencing technologies and bioinformatics to assess microbial diversity and identify genes that are beneficial for bacterial survival in inhospitable environments. Using the wide-range method of Illumina 16S rRNA sequencing, we identified the dominant phyla to be Actinobacteria and Proteobacteria in Atacama soil (Figure 3B). This agrees with other studies using similar approaches in the Atacama [47,54]. Locations that have more plant life had a greater richness (Figure 3A). Hierbas Buenas has a larger abundance of low grass and bushes, and accordingly, had the largest estimated richness at 652 species (Figure 3A). Conversely, the locations with the driest and most barren soil had the lowest richness as seen at Laguna Chita, Ckari Mirador, Tebenquiche, Salar de Tara, and Valle de Arcoiris with an estimated 184, 194, 227, 240, and 265 species, respectively (Figure 3A). As expected, some of these locations also had the highest levels of Archaea (Figure 4), which are well known extremophiles [49,50].
The correlation of “plant-rich” areas containing higher bacterial richness is expected due to the strong symbiosis and known importance that the bacterial rhizobiome has for plant growth and survival. Overall, this richness is low compared to other environments. Sea water has an estimated 10,000 species richness, the temperate forest and grasslands soil has a few thousand species, and Arctic soils have been shown to have a species richness between 950 and 1250 species [55,56,57]. As predicted, our results suggest that the extreme environment has a significantly lower number of unique species detected using the direct sequencing method. It is important to note that 16S amplicon sequencing is not sufficient to determine species. Rather, it provides an estimate for diversity.
Eight isolates that produce pigments were selected for whole-genome sequence (Figure 5). Using autoMLST2, three Kocuria strains were identified, which are closely related to K. rhizophila, K. turfanensis, and K. oceani (Table 1) [38]. Two Pseudomonas strains were identified, which are closely related to P. aeruginosa and P. rhodesiae. Three Bacillus strains were identified, two of which are closely related to B. inaquosorum and one of which is related to B. mojavensis (Table 1 and Table 2). Previously, both B. inaquosorum isolates were identified as B. vallismortis using autoMLST v1 [58]. B. inaquosorum was previously considered a subspecies of B. subtilis [59], which is very closely related to B. vallismortis [60]. autoMLST2 improves upon autoMLST1 by including new databases of sequence data to create alignments. This added information slightly altered the identification of these bacteria. Our findings agree with previous findings [61,62,63,64] including the finding that bacteria were more prominent than archaea [43]. In addition, it is notable that some of these species may not be necessarily native to the Atacama, but brought in by the wind [65].
Potential pathways for producing the observed pigments were identified bioinformatically (Figure 5 and Table 4). The types of pigments identified have different roles in species survival. Carotenoids often exhibit strong antioxidant activity and confer UV resistance [6]. They are a class of tetraterpenoids made through the assembly of 8 isoprene units to make a 40 carbon (C40) backbone. A major differentiating characteristic is their conjugated double bond system, which absorbs light between 400 and 550 nm in the UV-Vis range. Aryl polyene has a very similar structure and functionality to carotenoids [30]. They serve as antioxidants and have a yellow/green color. Pulcherrimin is a red-brown pigment produced by B. subtilis and other bacteria and yeast that controls biofilm aging and disassembly [29]. It has iron chelating activity and protects the cells from oxidative stress by lowering the levels of reactive oxidative species (ROS). Pyoverdine and pyocyanine are blue/green pigments that are secreted into the environment. These pigments are siderophores, secreted to chelate mainly iron and other metal ions from the environment for cellular processes [66]. Pyocyanin also acts as an antimicrobial [67,68]. These pigments also act as signaling molecules for virulence factors and are quorum sensors [69]. In the low nutrient R2 media, there is abundant pigment production, visible within 24 h after plating, since metals are in low abundance in the minimal medium. Pulcherrimin and pyoverdine pigments also play roles in biofilm formation in Bacillus and Pseudomonas sp., respectively [29,70]. Azetidomonamide has also been shown to control biofilm formation in Pseudomonas [71]. Biofilm has been shown to play a role in the survival of bacteria by providing a hydrated coating (matrix) and providing a physical barrier against UV [10].
Potentially bioactive compounds were identified in every species that was sequenced (Table 5). Production of antibacterial compounds allows for bacterial communities to ward off other species and protect their limited resources in a low-nutrient environment. Bioactive compounds were especially abundant in the Bacilli sp. (Table 5). This is not surprising, since several antibiotics were discovered from B. subtilis and related species [8,72,73] Fengycin, bacillaene, bacilysin, subtilosin A, bacillibactin, plipastatin, and surfactin, which were identified in the B. mojavensis and B. inaquosorum strains, are known to be produced by B. subtilis group organisms (Table 5) [72,73,74,75,76,77]. Notably, though well known to be produced by Bacillus sp., some of these have low similarity to well-known compounds, suggesting they may have a similar core but with differences (Table 5). Unexpectedly, it was predicted that B. inaquosorum strains may produce zwittermicin A, known to be produced by Bacillus cereus, which is not part of the B. subtilis group. It is also unexpected that strain 0209A, B. inaquosorum, is predicted to produce staphylococcin C55, known to be produced by Staphylococcus aureus strain C55 [78]. Each Kocuria strain was shown to produce siderophores, essential for iron uptake, which hold potential for antimicrobial activity [79]. P. oceani and P. aeruginosa strains were also shown to produce several siderophores, including pyoverdine, pyochelin, and polycinine [66]. Iso1_2024, P. aeruginosa, is capable of producing pseudopaline, an iron chelator for zinc uptake [66] as well as two additional bioactive compounds: L-2-amino-4-methoxy-trans-3-butenoic acid, an antimicrobial, and hydrogen cyanide, which is a generally toxic compound that helps suppress plant fungal diseases [80,81]. 0516A, P. oceani, produces two additional antimicrobial compounds: one beta lactone and ambactin (Table 5). Closely related Pseudomonas species are known to produce beta-lactone antibiotics, such as P. fluorescens, which produces obafluorin [82]. Ambactin is infrequently described in literature, but has been identified in other genera, including Streptomyces and Ochrobactrum [83,84]. It has been shown to have anti-MRSA activities in some species [84]. All other compounds produced by 0516A and Iso1_2024 are known to be produced by Pseudomonas sp. [66,80,81,82]. It is remarkable that many of the predicted antibiotics or other bioactive compounds have low similarity with known compounds, suggesting these are likely to be novel. This is one of the reasons studying these bacteria is advantageous. The same is true for some of the predicted pigments. It will be beneficial to isolate these pigments and characterize their activities in the future.
Several strains had very high GC content and a high frequency of G4 formation (Table 6). Increased GC content may increase the stability of DNA since guanines and cytosines form more favorable nucleotide stacking patterns than adenine and thiamine [19]. Areas that are GC-rich are sometimes capable of forming G4 quadruplexes, a non-helical DNA secondary structure [21]. It has been shown that in some bacteria, G4’s regulate RecA-dependent DNA repair pathways [22]. This shows that G4 formation could play a role in helping organisms survive in a highly irradiated environment. While the strains from the Atacama did not have significantly different GC content or G4 count from similar strains from less extreme environments (Table 6), these features may aid in maintaining DNA stability. Future work will include a more in-depth analysis of G4 placement in these genomes as opposed to the high-level overview provided here.
This survey presents a small dataset that enables an evolutionary glimpse into bacterial survival strategies found throughout the Atacama Desert. This study does have limitations. For example, while 16S rRNA sequencing gives us an idea of what bacteria are present, it does not provide enough detail to resolve bacterial identities to the species level accurately. For genome-level data, we are working to sequence and characterize more isolates from our sampling trips. However, this study focuses on a culturable subset of pigment-producing isolates. This makes the research of interest since the pigment can be isolated and not just predicted. Future work will include the functional validation of predicted bioactive compounds.
5. Conclusions
Using the genomic sequences of the selected isolates, we identified genes and possible pathways beneficial for bacterial survival and fending off competitors in inhospitable environments. The isolates chosen for WGS were selected for their pigment-production properties, and we learned that though many of these are carried out by known enzymes and pathways, some are not. This suggests that these bacteria and the pigments they produce are an untapped source of novel enzymatic activities. The same is true for other compounds. For example, we identified and predicted the production of antimicrobial and bioactive compounds, key biofilm formation genes, molecules used for nutrient sequestering, and high GC content. Moreover, we also got a glimpse of possible gene horizontal transfer as we detected bioactive compounds normally found in other species in Bacillus sp., suggesting that extreme conditions may push genetic exchange for full adaptation. There is obviously much to be done, but the knowledge gained from this survey will enable further evolutionary understanding of key survival strategies in bacteria. Insights into how bacteria handle stress are relevant in many fields, including agriculture, biotechnology, and biomedical sciences.
Supplementary Materials
The following supporting information can be found at: https://www.sciepublish.com/article/pii/795. Figure S1: An example of a plate from which bacteria were isolated for WGS; Figure S2: A phylogenetic tree generated by autoMLST2; Table S1: Locations, coordinates, and elevations of sampling locations for 16S sequencing; Table S2: Locations, coordinates, and elevations of sampling locations where bacteria where isolated from for WGS.
Acknowledgments
We would like to thank all Northeastern University (NU) students who participated in Dialogue of Civilizations (DOC) trips to Chile (2018, 2022, 2024). These students helped perform sample collection and bacterial isolation. Thank you to Joey Lehman Morris for co-teaching these DOC courses and participating in sample collection. Thank you also to our OneSeed team, including Sofia Mardones and Guillermo Maluenda, for guiding us to sampling locations. A special thanks also to the Riquelme Lab for supporting our team while in Chile.
Author Contributions
Conceptualization: V.G.-C., C.R., Y.C., A.R.P. and N.T.C.; Methodology: V.G.-C., N.T.C., A.R.P. and E.I.; Formal Analysis: N.T.C., A.R.P., E.I., E.A., A.H. and M.C.F.; Investigation: N.T.C., A.R.P., E.I., E.A., A.H., N.T., M.C.F. and M.T.; Writing—Original Draft: N.T.C. and A.R.P.; Writing—Review & Editing: N.T.C., A.R.P. and V.G.-C.; Supervision: Y.C., C.R. and V.G.-C.; Project Administration: V.G.-C. and Y.C.; Funding Acquisition: V.G.-C. and Y.C.
Ethics Statement
Not applicable.
Informed Consent Statement
Not applicable.
Data Availability Statement
WGS projects have been deposited into NCBI. Each sample is deposited under the following BioSample numbers: 0102A is under SAMN39706723, 0209A is under SAMN39706724, 0909A is under SAMN39706725, 0516A is under SAMN50557742, 1020B is under SAMN50557744, 0819A is under SAMN50557743, Iso1_2024 is under SAMN50557745, and Iso2_2024 is under SAMN50557746. Additionally, we assessed the G4 and GC content of three strains which are publicly available on NCBI. We assessed Bacillus subtilis with an NCBI ID of CP020102.1, Pseudomonas aeruginosa with an NCBI ID of NZ_CP027174.1, and Kocuria rhizophila with an NCBI ID of CP124833.1.
Funding
This work was funded by the Northeastern University (NU) Global Experience Office. E.I., E.A., A.H., N.T., M.C.F. and M.T. were funded by NU’s PEAK Undergraduate Research Fellowships. A.R.P. was funded by the NU Provost Dissertation Completion Fellowship. N.T.C. was funded by the National Science Foundation (NSF) Graduate Research Fellowship Program (1938052). V.G.-C. was funded by NuSci, a grant from HHMI. Y.C. was supported by NSF grant MCB1651732.
Declaration of Competing Interest
The authors declare that they have no known competing financial interests or personal relationships that could have appeared to influence the work reported in this paper.
References
-
Teske A, de Beer D, McKay LJ, Tivey MK, Biddle JF, Hoer D, et al. The Guaymas Basin Hiking Guide to Hydrothermal Mounds, Chimneys, and Microbial Mats: Complex Seafloor Expressions of Subsurface Hydrothermal Circulation. Front. Microbiol. 2016, 7, 75. doi:10.3389/fmicb.2016.00075. [Google Scholar]
-
Buongiorno J, Herbert LC, Wehrmann LM, Michaud AB, Laufer K, Røy H, et al. Complex Microbial Communities Drive Iron and Sulfur Cycling in Arctic Fjord Sediments. Appl. Environ. Microbiol. 2019, 85, e00949-19. doi:10.1128/AEM.00949-19. [Google Scholar]
-
Hadland N, Hamilton CW, Duhamel S. Young volcanic terrains are windows into early microbial colonization. Commun. Earth Environ. 2024, 5, 114. doi:10.1038/s43247-024-01280-3. [Google Scholar]
-
Reed CJ, Lewis H, Trejo E, Winston V, Evilia C. Protein Adaptations in Archaeal Extremophiles. Archaea 2013, 2013, 373275. doi:10.1155/2013/373275. [Google Scholar]
-
Azua-Bustos A, Urrejola C, Vicuña R. Life at the dry edge: Microorganisms of the Atacama Desert. FEBS Lett. 2012, 586, 2939–2945. doi:10.1016/j.febslet.2012.07.025. [Google Scholar]
-
Bull AT, Asenjo JA. Microbiology of hyper-arid environments: Recent insights from the Atacama Desert, Chile. Antonie Van Leeuwenhoek 2013, 103, 1173–1179. doi:10.1007/s10482-013-9911-7. [Google Scholar]
-
Pavan ME, López NI, Pettinari MJ. Melanin biosynthesis in bacteria, regulation and production perspectives. Appl. Microbiol. Biotechnol. 2019, 104, 1357–1370. doi:10.1007/s00253-019-10245-y. [Google Scholar]
-
Stein T. Bacillus subtilis antibiotics: Structures, syntheses and specific functions. Mol. Microbiol. 2005, 56, 845–857. doi:10.1111/j.1365-2958.2005.04587.x. [Google Scholar]
-
Sengupta S, Chattopadhyay MK, Grossart HP. The multifaceted roles of antibiotics and antibiotic resistance in nature. Front. Microbiol. 2013, 4, 47. doi:10.3389/fmicb.2013.00047. [Google Scholar]
-
Hall-Stoodley L, Costerton JW, Stoodley P. Bacterial biofilms: From the Natural environment to infectious diseases. Nat. Rev. Microbiol. 2004, 2, 95–108. doi:10.1038/nrmicro821. [Google Scholar]
-
Pandit A, Adholeya A, Cahill D, Brau L, Kochar M. Microbial biofilms in nature: Unlocking their potential for agricultural applications. J. Appl. Microbiol. 2020, 129, 199–211. doi:10.1111/jam.14609. [Google Scholar]
-
Vlamakis H, Chai Y, Beauregard P, Losick R, Kolter R. Sticking together: Building a biofilm the Bacillus subtilis way. Nat. Rev. Microbiol. 2013, 11, 157–168. doi:10.1038/nrmicro2960. [Google Scholar]
-
de Carvalho CCCR. Biofilms: Microbial Strategies for Surviving UV Exposure. In Ultraviolet Light in Human Health, Diseases and Environment; Ahmad SI, Ed.; Springer International Publishing: Cham, Switzerland, 2017; pp. 233–239. doi:10.1007/978-3-319-56017-5_19. [Google Scholar]
-
Hall CW, Mah TF. Molecular mechanisms of biofilm-based antibiotic resistance and tolerance in pathogenic bacteria. FEMS Microbiol. Rev. 2017, 41, 276–301. doi:10.1093/femsre/fux010. [Google Scholar]
-
Gerardin Y, Springer M, Kishony R. A competitive trade-off limits the selective advantage of increased antibiotic production. Nat. Microbiol. 2016, 1, 16175. doi:10.1038/nmicrobiol.2016.175. [Google Scholar]
-
Ferri M, Ranucci E, Romagnoli P, Giaccone V. Antimicrobial resistance: A global emerging threat to public health systems. Crit. Rev. Food Sci. Nutr. 2015, 57, 2857–2876. doi:10.1080/10408398.2015.1077192. [Google Scholar]
-
Lewis K, Caboni M. The Making of a Pathogen. Cell Host Microbe 2017, 21, 653–654. doi:10.1016/j.chom.2017.06.001. [Google Scholar]
-
Kool ET. Hydrogen Bonding, Base Stacking, and Steric Effects in DNA Replication. Annu. Rev. Biophys. Biomol. Struct. 2001, 30, 1–22. doi:10.1146/annurev.biophys.30.1.1. [Google Scholar]
-
Yakovchuk P, Protozanova E, Frank-Kamenetskii MD. Base-stacking and base-pairing contributions into thermal stability of the DNA double helix. Nucleic Acids Res. 2006, 34, 564–574. doi:10.1093/nar/gkj454. [Google Scholar]
-
Šmarda P, Bureš P, Horová L, Leitch IJ, Mucina L, Pacini E, et al. Ecological and evolutionary significance of genomic GC content diversity in monocots. Proc. Natl. Acad. Sci. USA 2014, 111, E4096–E4102. doi:10.1073/pnas.1321152111. [Google Scholar]
-
Beaume N, Pathak R, Yadav VK, Kota S, Misra HS, Gautam HK, et al. Genome-wide study predicts promoter-G4 DNA motifs regulate selective functions in bacteria: Radioresistance of D. radiodurans involves G4 DNA-mediated regulation. Nucleic Acids Res. 2013, 41, 76–89. doi:10.1093/nar/gks1071. [Google Scholar]
-
Yadav P, Kim N, Kumari M, Verma S, Sharma TK, Yadav V, et al. G-Quadruplex Structures in Bacteria: Biological Relevance and Potential as an Antimicrobial Target. J. Bacteriol. 2021, 203, 10–1128. doi:10.1128/JB.00577-20. [Google Scholar]
-
Bull AT, Andrews BA, Dorador C, Goodfellow M. Introducing the Atacama Desert. Antonie Van Leeuwenhoek 2018, 111, 1269–1272. doi:10.1007/s10482-018-1100-2. [Google Scholar]
-
Veblen TT, Young KR, Orme AR. The Physical Geography of South America; Oxford University Press: Oxford, UK, 2015; p. 751. [Google Scholar]
-
Cordero RR, Seckmeyer G, Damiani A, Riechelmann S, Rayas J, Labbe F, et al. The world’s highest levels of surface UV. Photochem. Photobiol. Sci. 2013, 13, 70–81. doi:10.1039/c3pp50221j. [Google Scholar]
-
Cordero RR, Damiani A, Jorquera J, Sepúlveda E, Caballero M, Fernandez S, et al. Ultraviolet radiation in the Atacama Desert. Antonie Van Leeuwenhoek 2018, 111, 1301–1313. doi:10.1007/s10482-018-1075-z. [Google Scholar]
-
Stoker CR, Glass BJ, Stucky TR, Dave AI, Kobayashi LT, Quinn RC, et al. A Mission Simulating the Search for Life on Mars with Automated Drilling, Sample Handling, and Life Detection Instruments Performed in the Hyperarid Core of the Atacama Desert, Chile. Astrobiology 2023, 23, 1284–1302. doi:10.1089/ast.2022.0055. [Google Scholar]
-
Reverdy A, Hathaway D, Jha J, Michaels G, Sullivan J, McAdoo DD, et al. Insights into the diversity and survival strategies of soil bacterial isolates from the Atacama Desert. Front. Microbiol. 2024, 15, 1335989. doi:10.3389/fmicb.2024.1335989. [Google Scholar]
-
Angelini LL, dos Santos RAC, Fox G, Paruthiyil S, Gozzi K, Shemesh M, et al. Pulcherrimin protects Bacillus subtilis against oxidative stress during biofilm development. NPJ Biofilms Microbiomes 2023, 9, 50. doi:10.1038/s41522-023-00418-z. [Google Scholar]
-
Schöner TA, Gassel S, Osawa A, Tobias NJ, Okuno Y, Sakakibara Y, et al. Aryl Polyenes, a Highly Abundant Class of Bacterial Natural Products, Are Functionally Related to Antioxidative Carotenoids. ChemBioChem 2016, 17, 247–253. doi:10.1002/cbic.201500474. [Google Scholar]
-
Callahan BJ, McMurdie PJ, Rosen MJ, Han AW, Johnson AJA, Holmes SP. DADA2: High-resolution sample inference from Illumina amplicon data. Nat. Methods 2016, 13, 581–583. doi:10.1038/nmeth.3869. [Google Scholar]
-
Huse SM, Mark Welch DB, Voorhis A, Shipunova A, Morrison HG, Eren AM, et al. VAMPS: A website for visualization and analysis of microbial population structures. BMC Bioinform. 2014, 15, 41. doi:10.1186/1471-2105-15-41. [Google Scholar]
-
Shemesh M, Chai Y. A Combination of Glycerol and Manganese Promotes Biofilm Formation in Bacillus subtilis via Histidine Kinase KinD Signaling. J. Bacteriol. 2013, 195, 2747–2754. doi:10.1128/JB.00028-13. [Google Scholar]
-
Cavanaugh NT, Kumar G, Couto Frignani M, Thewedros N, Twahirwa M, Riquelme C, et al. Whole-genome sequencing of three extremophile Bacillus sp. strains isolated from the Atacama Desert. Microbiol. Resour. Announc. 2025, 14, e00679-24. doi:10.1128/mra.00679-24. [Google Scholar]
-
Wick R. rrwick/Filtlong. 2025. Available online: https://github.com/rrwick/Filtlong (accessed on 14 August 2025). [Google Scholar]
-
Li H. Minimap and miniasm: Fast mapping and de novo assembly for noisy long sequences. Bioinformatics 2016, 32, 2103–2110. doi:10.1093/bioinformatics/btw152. [Google Scholar]
-
Kolmogorov M, Yuan J, Lin Y, Pevzner PA. Assembly of long, error-prone reads using repeat graphs. Nat. Biotechnol. 2019, 37, 540–546. doi:10.1038/s41587-019-0072-8. [Google Scholar]
-
Pourmohsenin B, Wiese A, Ziemert N. AutoMLST2: A web server for phylogeny and microbial taxonomy. Nucleic Acids Res. 2025, 53, W45–W50. doi:10.1093/nar/gkaf397. [Google Scholar]
-
Parks DH, Chuvochina M, Rinke C, Mussig AJ, Chaumeil PA, Hugenholtz P. GTDB: An ongoing census of bacterial and archaeal diversity through a phylogenetically consistent, rank normalized and complete genome-based taxonomy. Nucleic Acids Res. 2022, 50, D785–D794. doi:10.1093/nar/gkab776. [Google Scholar]
-
Blin K, Shaw S, Vader L, Szenei J, Reitz ZL, Augustijn HE, et al. antiSMASH 8.0: Extended gene cluster detection capabilities and analyses of chemistry, enzymology, and regulation. Nucleic Acids Res. 2025, 53, W32–W38. doi:10.1093/nar/gkaf334. [Google Scholar]
-
Buchfink B, Xie C, Huson DH. Fast and sensitive protein alignment using DIAMOND. Nat. Methods 2014, 12, 59–60. doi:10.1038/nmeth.3176. [Google Scholar]
-
Brázda V, Kolomazník J, Lýsek J, Bartas M, Fojta M, Šťastný J, et al. G4Hunter web application: A web server for G-quadruplex prediction. Bioinformatics 2019, 35, 3493–3495. doi:10.1093/bioinformatics/btz087. [Google Scholar]
-
Schulze-Makuch D, Wagner D, Kounaves SP, Mangelsdorf K, Devine KG, de Vera JP, et al. Transitory microbial habitat in the hyperarid Atacama Desert. Proc. Natl. Acad. Sci. USA 2018, 115, 2670–2675. doi:10.1073/pnas.1714341115. [Google Scholar]
-
Demergasso C, Escudero L, Casamayor EO, Chong G, Balagué V, Pedrós-Alió C. Novelty and spatio–temporal heterogeneity in the bacterial diversity of hypersaline Lake Tebenquiche (Salar de Atacama). Extremophiles 2008, 12, 491–504. doi:10.1007/s00792-008-0153-y. [Google Scholar]
-
Aguayo P, González P, Campos V, Maugeri TL, Papale M, Gugliandolo C, et al. Comparison of Prokaryotic Diversity in Cold, Oligotrophic Remote Lakes of Chilean Patagonia. Curr. Microbiol. 2017, 74, 598–613. doi:10.1007/s00284-017-1209-y. [Google Scholar]
-
Demergasso C, Dorador C, Meneses D, Blamey J, Cabrol N, Escudero L, et al. Prokaryotic diversity pattern in high-altitude ecosystems of the Chilean Altiplano. J. Geophys. Res. Biogeosci. 2010, 115. doi:10.1029/2008JG000836. [Google Scholar]
-
Mandakovic D, Maldonado J, Pulgar R, Cabrera P, Gaete A, Urtuvia V, et al. Microbiome analysis and bacterial isolation from Lejía Lake soil in Atacama Desert. Extremophiles 2018, 22, 665–673. doi:10.1007/s00792-018-1027-6. [Google Scholar]
-
Dorador C, Fink P, Hengst M, Icaza G, Villalobos AS, Vejar D, et al. Microbial community composition and trophic role along a marked salinity gradient in Laguna Puilar, Salar de Atacama, Chile. Antonie Van Leeuwenhoek 2018, 111, 1361–1374. doi:10.1007/s10482-018-1091-z. [Google Scholar]
-
Bates ST, Berg-Lyons D, Caporaso JG, Walters WA, Knight R, Fierer N. Examining the global distribution of dominant archaeal populations in soil. ISME J. 2011, 5, 908–917. doi:10.1038/ismej.2010.171. [Google Scholar]
-
Dorador C, Vila I, Remonsellez F, Imhoff JF, Witzel KP. Unique clusters of Archaea in Salar de Huasco, an athalassohaline evaporitic basin of the Chilean Altiplano. FEMS Microbiol. Ecol. 2010, 73, 291–302. doi:10.1111/j.1574-6941.2010.00891.x. [Google Scholar]
-
Ondov BD, Treangen TJ, Melsted P, Mallonee AB, Bergman NH, Koren S, et al. Mash: Fast genome and metagenome distance estimation using MinHash. Genome Biol. 2016, 17, 132. doi:10.1186/s13059-016-0997-x. [Google Scholar]
-
Lutgring JD, Machado MJ, Benahmed FH, Conville P, Shawar RM, Patel J, et al. FDA-CDC Antimicrobial Resistance Isolate Bank: A Publicly Available Resource To Support Research, Development, and Regulatory Requirements. J. Clin. Microbiol. 2018, 56, 10–1128. doi:10.1128/JCM.01415-17. [Google Scholar]
-
Nye TM, Schroeder JW, Kearns DB, Simmons LA. Complete Genome Sequence of Undomesticated Bacillus subtilis Strain NCIB 3610. Genome Announc. 2017, 5, 10–1128. doi:10.1128/genomeA.00364-17. [Google Scholar]
-
Connon SA, Lester ED, Shafaat HS, Obenhuber DC, Ponce A. Bacterial diversity in hyperarid Atacama Desert soils. J. Geophys. Res. Biogeosci. 2007, 112. doi:10.1029/2006JG000311. [Google Scholar]
-
Kerrigan Z, Kirkpatrick JB, D’Hondt S. Influence of 16S rRNA Hypervariable Region on Estimates of Bacterial Diversity and Community Composition in Seawater and Marine Sediment. Front. Microbiol. 2019, 10, 1640. doi:10.3389/fmicb.2019.01640. [Google Scholar]
-
George PBL, Lallias D, Creer S, Seaton FM, Kenny JG, Eccles RM, et al. Divergent national-scale trends of microbial and animal biodiversity revealed across diverse temperate soil ecosystems. Nat. Commun. 2019, 10, 1107. doi:10.1038/s41467-019-09031-1. [Google Scholar]
-
Wagner R, Zona D, Oechel W, Lipson D. Microbial community structure and soil pH correspond to methane production in Arctic Alaska soils. Environ. Microbiol. 2017, 19, 3398–3410. doi:10.1111/1462-2920.13854. [Google Scholar]
-
Alanjary M, Steinke K, Ziemert N. AutoMLST: An automated web server for generating multi-locus species trees highlighting natural product potential. Nucleic Acids Res. 2019, 47, W276–W282. doi:10.1093/nar/gkz282. [Google Scholar]
-
Rooney AP, Price NPJ, Ehrhardt C, Swezey JL, Bannan JD. Phylogeny and molecular taxonomy of the Bacillus subtilis species complex and description of Bacillus subtilis subsp. inaquosorum subsp. nov. Int. J. Syst. Evol. Microbiol. 2009, 59, 2429–2436. doi:10.1099/ijs.0.009126-0. [Google Scholar]
-
Roberts MS, Nakamura LK, Cohan FM. Bacillus vallismortis sp. nov., a Close Relative of Bacillus subtilis, Isolated from Soil in Death Valley, California. Int. J. Syst. Bacteriol. 1996, 46, 470–475. doi:10.1099/00207713-46-2-470. [Google Scholar]
-
Hartley AJ, Chong G, Houston J, Mather AE. 150 million years of climatic stability: Evidence from the Atacama Desert, northern Chile. J. Geol. Soc. 2022, 162, 421–424. doi:10.1144/0016-764904-071. [Google Scholar]
-
Houston J, Hartley AJ. The central Andean west-slope rainshadow and its potential contribution to the origin of hyper-aridity in the Atacama Desert. Int. J. Climatol. 2003, 23, 1453–1464. doi:10.1002/joc.938. [Google Scholar]
-
Navarro-González R, Rainey FA, Molina P, Bagaley DR, Hollen BJ, de la Rosa J, et al. Mars-Like Soils in the Atacama Desert, Chile, and the Dry Limit of Microbial Life. Science 2003, 302, 1018–1021. doi:10.1126/science.1089143. [Google Scholar]
-
Li CJ, Jiang ZM, Zhi XY, Chen HH, Yu LY, Li GF, et al. Genomic insights into Kocuria: Taxonomic revision and identification of five IAA-producing extremophiles. Front. Microbiol. 2025, 16, 1547983. doi:10.3389/fmicb.2025.1547983. [Google Scholar]
-
Azua-Bustos A, González-Silva C, Fernández-Martínez MÁ, Arenas-Fajardo C, Fonseca R, Martín-Torres FJ, et al. Aeolian transport of viable microbial life across the Atacama Desert, Chile: Implications for Mars. Sci. Rep. 2019, 9, 11024. doi:10.1038/s41598-019-47394-z. [Google Scholar]
-
Ghssein G, Ezzeddine Z. A Review of Pseudomonas aeruginosa Metallophores: Pyoverdine, Pyochelin and Pseudopaline. Biology 2022, 11, 1711. doi:10.3390/biology11121711. [Google Scholar]
-
Hassan HM, Fridovich I. Mechanism of the antibiotic action pyocyanine. J. Bacteriol. 1980, 141, 156–163. doi:10.1128/jb.141.1.156-163.1980. [Google Scholar]
-
Jayaseelan S, Ramaswamy D, Dharmaraj S. Pyocyanin: Production, applications, challenges and new insights. World J. Microbiol. Biotechnol. 2013, 30, 1159–1168. doi:10.1007/s11274-013-1552-5. [Google Scholar]
-
Dumas Z, Ross-Gillespie A, Kümmerli R. Switching between apparently redundant iron-uptake mechanisms benefits bacteria in changeable environments. Proc. R. Soc. B Biol. Sci. 2013, 280, 20131055. doi:10.1098/rspb.2013.1055. [Google Scholar]
-
Visca P, Imperi F, Lamont IL. Pyoverdine siderophores: From biogenesis to biosignificance. Trends Microbiol. 2007, 15, 22–30. doi:10.1016/j.tim.2006.11.004. [Google Scholar]
-
Ernst S, Volkov AN, Stark M, Hölscher L, Steinert K, Fetzner S, et al. Azetidomonamide and Diazetidomonapyridone Metabolites Control Biofilm Formation and Pigment Synthesis in Pseudomonas aeruginosa. J. Am. Chem. Soc. 2022, 144, 7676–7685. doi:10.1021/jacs.1c13653. [Google Scholar]
-
Tamehiro N, Okamoto-Hosoya Y, Okamoto S, Ubukata M, Hamada M, Naganawa H, et al. Bacilysocin, a Novel Phospholipid Antibiotic Produced by Bacillus subtilis 168. Antimicrob. Agents Chemother. 2002, 46, 315–320. doi:10.1128/AAC.46.2.315-320.2002. [Google Scholar]
-
Chakraborty K, Kizhakkekalam VK, Joy M, Chakraborty RD. Bacillibactin class of siderophore antibiotics from a marine symbiotic Bacillus as promising antibacterial agents. Appl. Microbiol. Biotechnol. 2021, 106, 329–340. doi:10.1007/s00253-021-11632-0. [Google Scholar]
-
Geissler M, Heravi KM, Henkel M, Hausmann R. Lipopeptide Biosurfactants from Bacillus Species. In Biobased Surfactants, 2nd ed.; Hayes DG, Solaiman DKY, Ashby RD, Eds.; AOCS Press: Champaign, IL, USA, 2019; pp. 205–240. Available online: https://www.sciencedirect.com/science/article/pii/B978012812705600006X (accessed on 14 August 2025). [Google Scholar]
-
Butcher RA, Schroeder FC, Fischbach MA, Straight PD, Kolter R, Walsh CT, et al. The identification of bacillaene, the product of the PksX megacomplex in Bacillus subtilis. Proc. Natl. Acad. Sci. USA 2007, 104, 1506–1509. doi:10.1073/pnas.0610503104. [Google Scholar]
-
Babasaki K, Takao T, Shimonishi Y, Kurahashi K. Subtilosin A, a New Antibiotic Peptide Produced by Bacillus subtilis 168: Isolation, Structural Analysis, and Biogenesis1. J. Biochem. 1985, 98, 585–603. doi:10.1093/oxfordjournals.jbchem.a135315. [Google Scholar]
-
Stannius RO, Kovács ÁT. Plipastatin is a shared good by Bacillus subtilis during combating Fusarium spp. FEMS Microbiol. Ecol. 2025, 101, fiaf020. doi:10.1093/femsec/fiaf020. [Google Scholar]
-
O’Connor EB, Cotter PD, O’Connor P, O’Sullivan O, Tagg JR, Ross RP, et al. Relatedness between the two-component lantibiotics lacticin 3147 and staphylococcin C55 based on structure, genetics and biological activity. BMC Microbiol. 2007, 7, 24. doi:10.1186/1471-2180-7-24. [Google Scholar]
-
Schalk IJ. Bacterial siderophores: Diversity, uptake pathways and applications. Nat. Rev. Microbiol. 2024, 23, 24–40. doi:10.1038/s41579-024-01090-6. [Google Scholar]
-
Rojas Murcia N, Lee X, Waridel P, Maspoli A, Imker HJ, Chai T, et al. The Pseudomonas aeruginosa antimetabolite L -2-amino-4-methoxy-trans-3-butenoic acid (AMB) is made from glutamate and two alanine residues via a thiotemplate-linked tripeptide precursor. Front. Microbiol. 2015, 6, 170. doi:10.3389/fmicb.2015.00170. [Google Scholar]
-
Blumer C, Haas D. Mechanism, regulation, and ecological role of bacterial cyanide biosynthesis. Arch. Microbiol. 2000, 173, 170–177. doi:10.1007/s002039900127. [Google Scholar]
-
Tymiak AA, Culver CA, Malley MF, Gougoutas JZ. Structure of obafluorin: An antibacterial .beta.-lactone from Pseudomonas fluorescens. J. Org. Chem. 2002, 50, 5491–5495. doi:10.1021/jo00350a010. [Google Scholar]
-
Schimming O, Fleischhacker F, Nollmann FI, Bode HB. Yeast Homologous Recombination Cloning Leading to the Novel Peptides Ambactin and Xenolindicin. ChemBioChem 2014, 15, 1290–1294. doi:10.1002/cbic.201402065. [Google Scholar]
-
Asnani A, Amaliyah R, Yuniaty A. Screening Anti-MRSA Activities of Indigenous Microbes and Prediction of The Biosynthetic Gene Clusters. J. Phys. Conf. Ser. 2020, 1665, 012001. doi:10.1088/1742-6596/1665/1/012001. [Google Scholar]