The Impact of Digital Infrastructure on Economic Resilience: Evidence from the Four Major Regions of China

The Impact of Digital Infrastructure on Economic Resilience: Evidence from the Four Major Regions of China
Received: 31 October 2025 Revised: 13 November 2025 Accepted: 18 November 2025 Published: 25 November 2025

© 2025 The authors. This is an open access article under the Creative Commons Attribution 4.0 International License (https://creativecommons.org/licenses/by/4.0/).
1. Introduction
In recent years, the global economy has faced mounting downward pressures exacerbated by a confluence of factors, including climate-related disasters, trade frictions, the unprecedented COVID-19 pandemic, and et al. As highlighted in the International Monetary Fund’s World Economic Outlook Update, January 2025, the projected global economic growth rates for 2025 and 2026 stand at 3.3%, significantly below the 3.7% average recorded during 2000–2019 [1]. This heightened economic uncertainty has propelled research on economic resilience to the forefront of academic inquiry. The concept of resilience, originally rooted in ecological studies, has evolved into a multidimensional framework encompassing natural ecosystems, social systems, economic structures, and infrastructure networks—all unified by their capacity to withstand shocks and maintain adaptive recovery capabilities [2].
Infrastructure development has played a pivotal role in China’s socio-economic progress, serving not only as a crucial counter-cyclical measure during economic downturns but also laying a solid foundation for sustained national development. During the 1997 Asian Financial Crisis, China implemented an expansive fiscal policy, channeling substantial Treasury bond investments into infrastructure projects to stimulate domestic demand. This strategic allocation of resources provided essential physical prerequisites for China’s deeper integration into the global economy at the turn of the century. Similarly, in response to the 2008 Global Financial Crisis, China allocated an additional 25 billion yuan to critical infrastructure sectors, including railways, highways, and airports. These investments yielded dual benefits: significantly upgrading the nation’s infrastructure landscape while effectively sustaining economic growth momentum during a period of global economic turmoil [3]. Amidst the transformative wave of the Fourth Industrial Revolution, nations worldwide are actively advancing their digital infrastructure development. Initiatives such as the European Union’s Digital Compass strategy, which sets ambitious targets for connectivity and digital skills, and the United States’ CHIPS and Science Act, aimed at reinforcing technological supply chains, highlight that digital capability is a cornerstone of geopolitical and economic competition in the 21st century. China has implemented comprehensive strategic deployments focusing on synergistic 5G network and gigabit optical network construction, large-scale IPv6 deployment and application, comprehensive development of mobile Internet of Things (IoT), and optimization of computing infrastructure. The subsequent accelerated implementation of China’s New Infrastructure initiative may exert further influence. Notably, China has proposed an ambitious initiative to establish a robust digital infrastructure artery [4].
This raises critical research questions: can digital infrastructure enhance economic resilience? Does the impact of digital infrastructure on economic resilience exhibit marginal effects? What are the underlying mechanisms through which digital infrastructure influences economic resilience, and do these mechanisms demonstrate regional heterogeneity? Addressing these questions is crucial for identifying effective pathways to enhance economic resilience. Given this research context, this study employs panel data from 31 Chinese provinces (excluding Hong Kong, Macao, and Taiwan) spanning 2008–2022 to investigate the threshold effects of digital infrastructure on economic resilience through threshold regression model; Utilizing industrial diversification and specialization as mediating variables to empirically examine the transmission mechanisms through mediation framework; Furthermore, systematic heterogeneity analyses are conducted across China’s four major regions.
2. Literature Review
The conceptual evolution of resilience theory merits particular attention. Canadian ecologist Holling (1973) pioneered this field by defining resilience as “the capacity of an ecosystem to absorb disturbance and reorganize while changing to retain essentially the same functions, structure, and feedbacks”, and emphasized system persistence through flexibility maintenance [5]. Since the 1990s, resilience research has progressively expanded into socio-ecological systems, undergoing three distinct conceptual phases: engineering resilience, ecological resilience, and evolutionary resilience. Evolutionary resilience, which emphasizes dynamic adaptation mechanisms and conceptualizes resilience as an evolutionary process wherein systems continuously adjust through interactions with disturbances to achieve sustainable development, provides the most relevant framework for economic systems analysis [6,7].
Existing literature has explored the influencing factors of economic resilience from various perspectives, with common factors including human capital [8], industrial structure [9], innovation capacity [10], technology coherence [11], social cohesion [12], and geographical location [13]. Among these, industrial structure emerges as a particularly salient determinant of economic resilience [6,14]. Economists represented by Frenken et al. (2007) proposed the concept of related variety, suggesting that diversified industries are interconnected in terms of products, technologies, inputs/outputs, labor, and applications [15]. Industrial diversification functions as an automatic stabilizer, dispersing risk and mitigating the impact of economic fluctuations during severe external shocks. It possesses the capacity for rapid self-recovery and renewal, thereby constituting a critical resilience-enhancing mechanism [16]. Brown & Greenbaum (2017), through an empirical study of 35 years of county-level employment data in Ohio, found that counties with diversified industrial structures exhibited stronger economic resilience after external shocks [9]. However, the resilience implications of industrial transformation remain contested. Some perspectives argue that while industrial structure upgrading fosters new industrial chains and systems, it may also disrupt existing industries; the trend towards advanced services in industrial upgrading may lead to potential hollowing-out effects in manufacturing sectors, which could be detrimental to the enhancement of economic resilience [17].
With the advancement of digitalization, research on digitalization and economic resilience has been increasing. Although the literature has confirmed the positive impact of digital infrastructure on economic resilience [18,19,20], there is still a lack of research on the threshold effect of digital infrastructure on economic resilience. Ma et al. (2019) systematically categorized the economic impacts of digital infrastructure in the context of digital transformation, identifying three predominant effects: First, the industrial synergy and agglomeration effect, which enhances inter-industry collaboration and spatial concentration; second, the radial diffusion effect, where central cities extend their economic influence to surrounding regions; and third, the multiplier effect, characterized by sustained reinforcement of economic activities through enhanced geographical connectivity and industrial upgrading [21]. The economic effects of digital infrastructure also manifest in facilitating low-carbon development [22], enabling green transformation [23], and promoting high-quality economic growth [24]. A difference-in-differences analysis of the Broadband China strategy demonstrates that digital infrastructure enhances economic resilience through channels such as boosting economic vitality and facilitating industrial structure upgrading and rationalization [25]. Digital technologies have played an important role in enhancing economic resilience by improving government services and facilitating post-pandemic recovery [26,27]. At the sectoral level, recent studies have demonstrated that digitalization enhances resilience in the logistics industry [28], and that the implementation of smart supply chains significantly boosts agricultural economic resilience [29]. Studies have also found that the digital economy not only enhances urban innovation capacity but also moderates economic resilience, thereby facilitating high-quality economic development [30]. Only by further exploring the marginal effects of digital infrastructure on economic resilience can we provide a scientifically feasible basis for formulating policies for digital infrastructure construction in the context of enhancing economic resilience.
While existing studies have predominantly focused on provincial-level or prefecture-level analyses, there remains a significant research gap in regional-level investigations in China. Although literature has identified a pronounced digital access divide between eastern and non-eastern regions [31] and documented sluggish resilience growth in most northeastern cities from 2009 to 2018 [32], research examining the heterogeneous marginal effects and differential mechanisms of digital infrastructure on economic resilience across China’s four major regions remains limited. Given substantial variations in geographical conditions, resource endowments, and factor conditions across regions, it is imperative to investigate the threshold effects of digital infrastructure on regional economic resilience and the pathway differences in its mechanisms. Such exploration is essential for formulating precise and effective policy recommendations tailored to each region’s specific context.
3. Research Hypothesis
3.1. The Threshold Effect of Digital Infrastructure on Economic Resilience
The evolution of digital infrastructure and its transformative impact on economic systems can be systematically understood through three interconnected dimensions. First, the theoretical foundation was established by George Gilder, the prominent American technology theorist, whose seminal prediction—known as Gilder’s Law—posits that the total bandwidth of communication systems triples annually while the price per bit transmission asymptotically approaches zero [33]. This law not only forecasts the exponential growth trajectory of information technology but also establishes the economic principle of cost elimination in digital transmission. Building upon this theoretical framework, contemporary technological advancements have manifested Gilder’s predictions in tangible forms. Block chain, big data, and cloud computing technologies have emerged as critical enablers of regional economic development, facilitating factor complementarity and resource sharing across regions [34]. These technologies empower optimized allocation of capital markets and human resources through digital transformation, generating substantial momentum for regional economic growth. Second, the operational mechanisms of digital infrastructure reveal its fundamental role in economic systems. Functioning as the connective tissue of modern economies, digital infrastructure exhibits three distinctive characteristics: (i) it enhances network accessibility and node connectivity, enabling efficient information and data flow across spatial boundaries; (ii) it facilitates the movement of new production factors, particularly data, while creating scale advantages in knowledge and economic agglomeration; and (iii) through the convergence of digital Internet and Internet of Things (IoT) technologies, it enables comprehensive data collection and processing, thereby supporting more flexible management of economic activities and social processes [35]. Third, the resilience-enhancing capabilities of digital infrastructure stem from its unique spatial and temporal advantages. With minimal physical space constraints and the capacity for efficient cross-regional, cross-temporal resource allocation [36], digital infrastructure serves as a critical mechanism for optimizing resource distribution and information circulation. These characteristics collectively establish digital infrastructure as an effective tool for mitigating economic disruptions and enhancing system resilience.
Building on the theoretical foundation of network economics, Metcalfe’s Law provides crucial insights into the value creation mechanisms of digital infrastructure: the value of a network is proportional to the square of the number of connected users, indicating that network effects generate exponential value growth as user participation increases [37]. This fundamental principle, as scholars have noted, underscores the network externality advantages inherent in digital infrastructure [38], which become particularly crucial in enhancing economic resilience. The operational significance of these network effects manifests most prominently during uncertainty shocks. When facing disruptions, the integration of emergency resources—including human capital, material resources, information flows, policy instruments, and technological capabilities—requires a systematic framework to form a complex, dynamic response system. Digital infrastructure enhances this system’s performance through three mechanisms: (i) enabling scientific prediction of resource allocation and crisis severity, (ii) establishing feedback mechanisms between system integration and emergency response capabilities, and (iii) optimizing operational efficiency through networked information sharing and resource coordination [34]. These capabilities create positive externalities that fundamentally distinguish digital infrastructure from traditional infrastructure systems. The unique characteristics of digital infrastructure—including strong technological innovation capacity, continuous scope expansion, rapid technological iteration, substantial investment requirements, and high interconnectivity—present both opportunities and challenges for enhancing economic resilience. Unlike traditional infrastructure projects, the impact of digital infrastructure on economic resilience is temporally complex: the resilience-enhancing effects may not increase proportionally with infrastructure development due to longer construction cycles and implementation lags. This relationship evolves through distinct phases: in the initial development stage, digital infrastructure primarily facilitates information flow and resource sharing, enhancing the economy’s responsiveness to shocks; as intelligent technologies mature, it fosters innovation clusters, thereby playing a more substantial role in innovation-driven development pathways. Drawing on Metcalfe’s Law and considering these developmental dynamics, Hypothesis 1 is proposed: With the development of digital infrastructure, its impact on economic resilience exhibits a threshold effect, with the marginal effect increasing.
3.2. The Resilience-Enhancing Mechanism of Digital Infrastructure
In the theory of evolutionary economic geography, diversification is regarded as a protective mechanism against external shocks [39]. This perspective aligns with Jeremy’s (2022) assertion that resilience fundamentally stems from redundancy and diversification, in which efficiency and resilience maintain a delicate balance. While efficiency represents a temporal value, resilience serves as its prerequisite condition, emphasizing adaptability over mere efficiency gains [35]. Taking the growth and maturity rate of a specific crop variety as an example, monoculture planting may be more efficient, but once this monoculture planting is affected by wilt disease, the losses may be incalculable. Within economic systems, empirical evidence consistently supports the positive correlation between industrial diversification and regional economic resilience [9,16]. Digital infrastructure provides new opportunities for the integration of new information technologies with traditional industries through three primary mechanisms: (i) enabling precise data analytics and intelligent decision-making support systems that facilitate deep integration with industrial processes; (ii) driving the transformation of traditional production relations through advanced digital technologies, thereby fostering industrial diversification [24]; and (iii) serving as a new engine for information transmission, generating innovative business models that enrich industrial diversity through its universal applicability and strong penetrative capabilities. For instance, the Broadband China policy emphasizes integrating broadband network construction with independent innovation to stimulate innovation and entrepreneurship in pilot cities [40]. Furthermore, the resilience-enhancing effects of industrial diversification operate through two complementary channels: risk dispersion through inter-industry complementarity and synergy, and adaptive structural adjustment capacity [41]. Based on this, this article proposes Hypothesis 2: Digital infrastructure indirectly enhances economic resilience by promoting industrial diversification.
The resilience of economic systems is fundamentally determined by two dimensions: the nature, characteristics, intensity, and scope of external/internal shocks, and the system’s internal economic structure. Industrial specialization, characterized by deepening differentiation in final product production across sectors, creates unique competitive advantages through focused expertise and optimized production processes. Digital infrastructure plays a transformative role in this context by facilitating the integration of emerging information technologies with traditional industries. Through precise data analysis, intelligent decision support, and efficient operation management, it deeply integrates with industries, promoting the transformation and upgrading of traditional industries towards digitization and intelligence. This transformation is particularly evident in China’s current technological landscape, where AI, cloud computing, and big data technologies are accelerating their integration across economic sectors, driving industrial digital transformation and the implementation of intelligent manufacturing initiatives [42]. Digital infrastructure enhances industrial specialization through three key capabilities: (i) providing robust data processing power, (ii) establishing efficient information exchange platforms, and (iii) implementing intelligent production management systems. These capabilities enable enterprises to precisely identify market demands and develop specialized production and service systems in specific domains. On the one hand, an efficient production system and unique technological advantages formed by industrial specialization can promote the formation of sufficient disturbance resistance, thereby enhancing economic resilience. On the other hand, industrial specialization may lead to dependence on specific resources or markets, thereby reducing the diversity and flexibility of the economic system. When faced with uncertain shocks such as sudden changes in market demand, supply chain disruptions, or lagging technological innovation, this high dependence will increase the vulnerability of the economy. Based on this, this article proposes Hypothesis 3: Digital infrastructure indirectly enhances economic resilience by promoting industrial specialization; Hypothesis 4: Digital infrastructure indirectly weakens economic resilience by promoting industrial specialization.
4. Research Methods
4.1. Model Settings
Firstly, to examine the overall effect of digital infrastructure on economic resilience, this article constructs the following baseline econometric model:
| ```latexere{s}_{i,t}={\alpha }_{0}+{\alpha }_{1}digin{f}_{i,t}+{\alpha }_{j}control{s}_{i,t}+{\gamma }_{i}+{u}_{t}+{\epsilon }_{i,t}``` | (1) |
where eresi,t and diginfi,t representatively denote the economic resilience and digital infrastructure of city i in year t, respectively. controls are control variables, αj is the influence coefficient of the control variable. α0 denotes the constant term, α1 represents the impact coefficient of digital infrastructure on economic resilience, while γi, ut and εi,t represent the regional fixed effect, time fixed effect, and random error term, respectively.
To verify Hypothesis 1, construct the following threshold regression model:
| ```latexere{s}_{i,t}={\varphi }_{0}+{\varphi }_{1}digin{f}_{i,t}×I\left(digin{f}_{i,t}\le \theta \right)+\\{\varphi }_{2}digin{f}_{i,t}×I\left(digin{f}_{i,t}>\theta \right)+{\varphi }_{c}control{s}_{i,t}+{\gamma }_{i}+{\epsilon }_{i,t}``` | (2) |
In Equation (2), the threshold variable is digital infrastructure. θ is the threshold value, and I (•) is an indicator function with a value of 1 or 0. If the conditions in parentheses are met, it is 1; otherwise, it is 0. When the value of digital infrastructure is less than the threshold, the impact coefficient of digital infrastructure on economic resilience is denoted as φ1; when the digital infrastructure exceeds the threshold value, the impact coefficient of digital infrastructure on economic resilience is denoted as φ2. Equation (2) is a single threshold case, which can be extended to multiple threshold cases according to the sample measurement and testing steps.
To verify Hypotheses 2–4, construct a mediation effect model based on Equation (1) as follows:
| ```latexMI{D}_{i,t}={\alpha }_{0}+{\alpha }_{1}\prime digin{f}_{i,t}+{\alpha }_{2}control{s}_{i,t}+{\gamma }_{i}+{\mu }_{t}+{\epsilon }_{i,t}``` | (3) |
| ```latexERE{S}_{i,t}={\beta }_{0}+{\beta }_{1}digin{f}_{i,t}+{\beta }_{2}MI{D}_{i,t}+{\beta }_{3}control{s}_{i,t}+{\gamma }_{i}+{\mu }_{t}+{\epsilon }_{i,t}``` | (4) |
In Equation (3) and Equation (4), MID is the mechanism variable. The mediation analysis follows a rigorous sequential testing procedure. First, examine the significance of coefficient α1. If statistically significant, proceed with mediation effect analysis. Then test the coefficients α1′ and β2 sequentially. If both coefficients are statistically significant, conclude the presence of a significant indirect effect; If either α1′ or β2 proves insignificant, implement the Bootstrap test for robustness verification. Third, if the test fails, conclude the absence of significant mediation. If the test is passed and the coefficient β1 is also significant, proceed to effect comparison. If α1′β2 and β1 have the same sign, report the mediating effect as α1′β2; If signs are inconsistent, classify as inconsistent mediation. If |β1| > |α1|, classify as a masking effect [43].
4.2. Data Sources
The dependent variable is economic resilience (eres). Resistance, recovery, adaptation, and transformation are the four basic pillars of economic resilience [7]. Therefore, combined with literature review and high-frequency indicators [44,45] as the focus, this article constructs the following economic resilience evaluation index system. The standard deviation modified G1 weighting method [46] is used to weight the indicators. The specific economic resilience evaluation index system is shown in Table 1.
Table 1. Economic resilience evaluation index system.
|
Criterion Layer |
Indicators and Explanations |
Indicator Weight |
|
|---|---|---|---|
|
Resistance to recovery |
Economic level |
Per capita regional GDP (yuan/person) |
0.0909 |
|
Employment level |
Employed personnel in urban units (10,000 people) |
0.0904 |
|
|
Government finance |
General budget revenue of local finance (in billions of yuan) |
0.0850 |
|
|
Social security |
Number of people participating in unemployment insurance (person) |
0.0723 |
|
|
Environmental protection |
Industrial pollution control completed investment (10,000 yuan) |
0.0668 |
|
|
Public transportation |
Freight turnover (100 million ton kilometers) |
0.0855 |
|
|
Reconstruction to renewal |
Industrial foundation |
Number of units in large and medium-sized industrial enterprises |
0.0925 |
|
R&D investment |
R&D funds for industrial enterprises above designated size (10,000 yuan) |
0.0722 |
|
|
Financial development |
Value added of the financial industry (in billions of yuan) |
0.0788 |
|
|
Educational investment |
Local fiscal education expenditure (in billions of yuan) |
0.0798 |
|
|
Entrepreneurial vitality |
Number of newly established private enterprises per 10,000 people |
0.0814 |
|
|
Human capital |
Number of students enrolled in regular higher education institutions (in 10,000) |
0.1042 |
|
The core explanatory variable is digital infrastructure. This study employs the length of optical cables and the number of broadband access ports as the core proxies for digital infrastructure. This choice is grounded in their role as the foundational backbone of the information economy. As delineated in the Digital Infrastructure Assessment System Research Report (2024) published by the China Institute of Industry and Planning, digital infrastructure comprises three primary domains: network infrastructure, computing infrastructure, and application infrastructure [47]. The White Paper on China’s Broadband Development 2023 identifies broadband infrastructure as encompassing communication network infrastructure, computing infrastructure, and application infrastructure within the broader framework of digital infrastructure [4]. Broadband infrastructure, therefore, constitutes a critical component of digital infrastructure, serving as a foundational pillar for the development of a digital economy and society. Furthermore, these metrics provide consistent, province-level panel data for the entire 2008–2022 study period. Given the robust continuity, precision, and authoritative nature of broadband infrastructure-related data compiled by the National Bureau of Statistics of China, this study adopts two key indicators as proxy variables for digital infrastructure: the length of optical cable lines measured in 10,000 km (Opt) and the number of Internet broadband access ports measured in 10,000 units (Int). These metrics provide a reliable and comprehensive representation of the state and development of digital infrastructure.
In addition to the core explanatory variable, it is necessary to control for other factors that may influence the level of economic resilience. The control variables included in this study are Foreign direct investment (FDI), Urbanization (Urb), Market size (Mar), Natural resources (Nat), and Spiritual civilization (Cul). These variables are operationalized as follows: Total import and export volume of foreign-invested enterprises (in billions of yuan), Urban population density (100 people/square kilometer), Per capita water resources (cubic meters per person), Total sales of retail goods (in billions of yuan), and Total circulation of public libraries (10,000 people). All control variables are in logarithmic form.
The mechanism variables are industrial diversification (Div) and industrial specialization (Spe). Industrial diversification is proxied by the Herfindahl-Hirschman Index (HHI), which is calculated as the negative sum of the natural logarithm of the proportion of employment in each of the 19 industries (The 19 industries listed in the statistical yearbooks of province include agriculture, forestry, animal husbandry, and fisheries; mining; manufacturing; electricity, heat, gas and water production and supply; construction; wholesale and retail; transportation, storage and postal services; accommodation and catering; information transmission, software and information technology services; finance; real estate; leasing and business services; scientific research and technology services; water conservancy, environment and public facilities management; residential services, repair and other services; education; health and social work; culture, sports and entertainment; public administration, social security and social organizations.) across the primary, secondary, and tertiary sectors relative to total employment in each province [48]. Industrial specialization is measured using the location quotient (LQ), which is computed as the ratio of the employment share of each of the 19 industries in a province to the corresponding national employment share of that industry [49]. The highest location quotient among the industries is selected to represent the level of industrial specialization in each province.
The data utilized in this study were sourced from the statistical yearbooks of each province from 2009 to 2023. Descriptive statistics for the variables are presented in Table 2.
Table 2. Descriptive statistics.
|
Variable |
Obs |
Ave |
Std |
Min |
Max |
|
|---|---|---|---|---|---|---|
|
Dependent Variable |
Eres |
465 |
0.1848 |
0.1354 |
0.0077 |
0.7773 |
|
Independent Variable |
Opt |
465 |
4.0805 |
1.0579 |
0.9103 |
6.0851 |
|
Int |
465 |
6.9739 |
1.2161 |
2.4423 |
9.1995 |
|
|
Control Variables |
FDI |
465 |
6.2303 |
2.6220 |
0.0061 |
10.5097 |
|
Urb |
465 |
3.2597 |
0.4340 |
1.6390 |
4.0888 |
|
|
Mar |
465 |
7.2099 |
1.4914 |
3.9493 |
11.9812 |
|
|
Nat |
465 |
7.5717 |
1.1966 |
3.6000 |
9.7972 |
|
|
Cul |
465 |
6.9156 |
1.2802 |
0.8961 |
9.5422 |
|
|
Mechanism Variables |
Div |
465 |
2.4141 |
0.1701 |
1.9168 |
2.7145 |
|
Spe |
465 |
3.0112 |
2.4063 |
1.2055 |
14.9685 |
5. Discussion of Results
5.1. Analysis of Baseline Regression Results
Table 3 presents the regression results of the impact of digital infrastructure on economic resilience. Without the inclusion of control variables, the positive effects of both optical cable line length and Internet broadband access ports on economic resilience are statistically significant at the 1% level. After incorporating control variables, the coefficient signs of the core explanatory variables remain consistent, further confirming the enhancing effect of digital infrastructure on economic resilience.
Table 3. Regression results of the impact of digital Infrastructure on economic resilience.
|
(1) |
(2) |
(3) |
(4) |
|
|---|---|---|---|---|
|
Opt |
0.0614 *** [0.0025] |
0.0386 *** [0.0052] |
||
|
Int |
0.0505 *** [0.0023] |
0.0173 *** [0.0062] |
||
|
FDI |
0.0078 ** [0.0038] |
0.0092 ** [0.0041] |
||
|
Urb |
0.0168 * [0.0100] |
0.0282 *** [0.0105] |
||
|
Mar |
−0.0129 ** [0.0064] |
−0.0113 * [0.0068] |
||
|
Nat |
0.0377 *** [0.0073] |
0.0546 *** [0.0095] |
||
|
Cul |
−0.0064 [0.0056] |
−0.0016 [0.0061] |
||
|
cons |
−0.0657 *** [0.0105] |
−0.224 *** [0.0731] |
−0.167 *** [0.0164] |
−0.406 *** [0.0786] |
|
Fixed region and time |
YES |
YES |
YES |
YES |
|
BP test |
96.20 *** |
105.85 *** |
59.95 *** |
37.07 *** |
|
N |
465 |
465 |
465 |
465 |
|
R2 |
0.576 |
0.612 |
0.518 |
0.570 |
Note: Standard errors in parentheses. * p < 0.1; ** p < 0.05; *** p < 0.01.
To address potential endogeneity issues, such as reverse causality and omitted variable bias between digital infrastructure and economic resilience, this paper uses the instrumental variable (IV) approach. The interaction term (logarithm) between the number of post offices per million people in each province in 1984 and the annual number of Internet users in each province is selected as the instrumental variable for digital infrastructure. On the one hand, the historical data on post offices in 1984 had little impact on economic resilience and did not meet exogenous needs; on the other hand, the number of Internet users reflects the level of digital infrastructure to some extent, meeting the relevance criterion. As shown in Table 4, the DWH test statistics are significant at the 1% level, rejecting the null hypothesis that all variables are exogenous. The first-stage F-statistics exceed the empirical threshold of 10, and the Anderson canon. corr. LM statistics are significant at the 1% level, passing the weak instrument test. These results confirm the validity of the chosen instrumental variable. The second-stage regression results indicate that digital infrastructure continues to have a significantly positive impact on economic resilience, with coefficient signs consistent with those in the baseline regression. This further supports the robustness of the baseline regression findings.
Table 4. Endogeneity test: instrumental variable method (2SLS).
|
(1) |
(2) |
|||
|---|---|---|---|---|
|
First Stage |
Second Stage |
First Stage |
Second Stage |
|
|
iv |
0.7138 *** [0.0478] |
0.6785 *** [0.0522] |
||
|
Opt |
0.0355 *** [0.0098] |
|||
|
Int |
0.0374 ** [0.0104] |
|||
|
cons |
−7.2116 *** [0.3803] |
−0.2277 *** [0.0525] |
−3.5466 *** [0.4159] |
−0.3513 ** [0.0414] |
|
Controls |
YES |
YES |
YES |
YES |
|
Fixed region and time |
YES |
YES |
YES |
YES |
|
N |
465 |
465 |
465 |
465 |
|
R2 |
0.771 |
0.696 |
0.792 |
0.690 |
|
DWH test |
6.8665 ** |
8.4945 *** |
||
|
F value for the first stage |
223.41 ** |
168.84 *** |
||
|
LM statistics |
152.236 ** |
125.05 *** |
||
Note: Standard errors in parentheses. * p < 0.1; ** p < 0.05; *** p < 0.01.
5.2. Threshold Effect Analysis
Given the phased nature of digital infrastructure development, the impact of different levels of digital infrastructure construction on economic resilience may vary. After conducting 400 Bootstrap resampling iterations, the core explanatory variables consistently passed the double threshold test with statistical significance. Figure 1 presents the likelihood ratio function plot for threshold estimates of opt and int, constructed with a 95% confidence interval. Taking opt as an example, the minimum point of the likelihood ratio statistic indicates the true threshold value. The dashed line denotes the critical value at a 95% significance level, which exceeds the threshold estimates, thereby validating the threshold value for opt. Similarly, threshold values for int also pass this validation criterion.
Based on this, a double threshold regression model was established, and the regression results are presented in Table 5. Columns (1) and (2) present the threshold regression results using the length of optical cable lines and the number of Internet broadband access ports as proxy variables for digital infrastructure, respectively. As shown in the results, when ln(opt) < 5.0632 (optical cable length < 1.58 million kilometers), the coefficient of the impact of optical cable length on economic resilience is 0.0145. When 5.0632 < ln(opt) < 5.641 (1.58 million kilometers < optical cable length < 2.82 million kilometers), the coefficient increases to 0.0224. When ln(opt) > 5.641 (optical cable length > 2.82 million kilometers), the coefficient further rises to 0.0379. Similarly, when the number of Internet broadband access ports is less than 34.81 million, the impact coefficient is 0.0063. When 34.81 million < the number of ports < 70.37 million, the coefficient increases to 0.0148. When the number of ports exceeds 70.37 million, the coefficient reaches 0.0298. Columns (3)–(5) serve as a robustness check. To incorporate dynamic adjustments, this study introduced a two-period lag of the dependent variable into the threshold regression model. The results, as shown in Columns (3) and (4), are based on 400 Bootstrap sampling iterations. Column (5) reports the threshold regression results using the number of Internet broadband users as a proxy variable for digital infrastructure. Columns (3)–(5) show significant double threshold effects, with increasing marginal effects. These findings support the robustness of the conclusion. The findings in China resonate with international experiences. For instance, studies on intelligent transport systems in European cities (Tsonkov & Petrov, 2024) also highlight the importance of reaching a critical mass of infrastructure deployment for significant benefits [50]. In summary, digital infrastructure exhibits a significantly positive and nonlinear impact on economic resilience, characterized by increasing marginal effects. These findings validate Hypothesis 1.
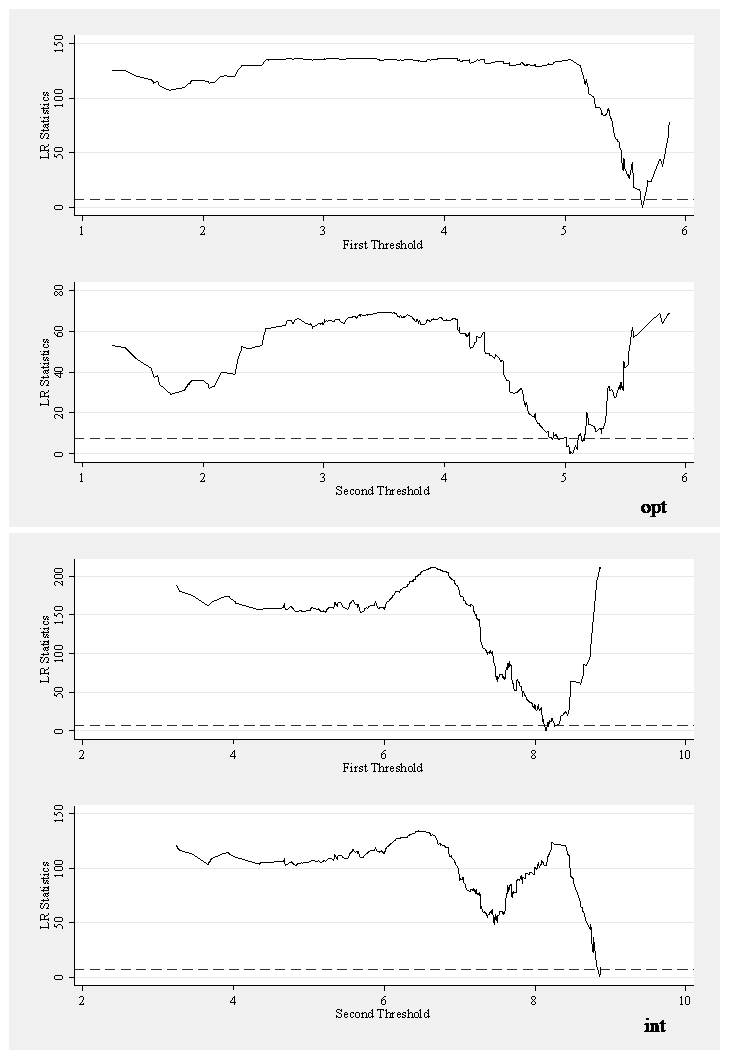
Figure 1. Estimation results of dual thresholds.
Table 5. Regression results of the threshold model.
|
(1) |
(2) |
(3) |
(4) |
(5) |
||
|---|---|---|---|---|---|---|
|
threshold value |
q1 |
5.0632 |
8.1552 |
4.7457 |
7.4991 |
7.5798 |
|
q2 |
5.6410 |
8.8589 |
5.4686 |
8.6300 |
8.1792 |
|
|
diginf × I (Th ≤ q1) |
0.0145 *** [0.0046] |
0.0063 *** [0.0043] |
0.0085 *** [0.0050] |
0.0238 *** [0.0032] |
0.0394 *** [0.0038] |
|
|
diginf × I (q1 < Th < q2) |
0.0224 *** [0.0043] |
0.0148 *** [0.0042] |
0.0142 *** [0.0046] |
0.0283 *** [0.0030] |
0.0480 *** [0.0037] |
|
|
diginf × I (Th ≥ q2) |
0.0379 *** [0.0044] |
0.0298 *** [0.0043] |
0.0295 *** [0.0046] |
0.0393 *** [0.0030] |
0.0598 *** [0.0038] |
|
|
cons |
−0.2012 *** [0.0582] |
−0.2937 *** [0.0536] |
−0.1768 *** [0.0554] |
−0.0306 *** [0.0538] |
−0.1222 *** [0.0559] |
|
|
Controls |
YES |
YES |
YES |
YES |
YES |
|
|
Fixed region and time |
YES |
YES |
YES |
YES |
YES |
|
|
N |
465 |
465 |
403 |
403 |
465 |
|
|
R2 |
0.776 |
0.835 |
0.772 |
0.756 |
0.780 |
|
Note: I (•) is an indicator function with a value of 1 or 0. If the conditions in parentheses are met, it is 1; otherwise, it is 0. Standard errors in parentheses. * p < 0.1; ** p < 0.05; *** p < 0.01.
5.3. Spatiotemporal Analysis
To further investigate the regional disparities in the impact of digital infrastructure on economic resilience, this paper employs the GTWR (Geographically and Temporally Weighted Regression) model in ArcGIS to map the influence coefficients of optical cable length and broadband access ports on economic resilience across 31 provinces for the periods 2008–2012, 2013–2017, and 2018–2022. This analysis lays the groundwork for a regional examination of the threshold effects of digital infrastructure on economic resilience. Using the natural breaks algorithm method [51], the influence coefficients are categorized into five classes, as illustrated in Figure 2, revealing distinct regional characteristics. During the three periods, the influence coefficients of digital infrastructure on economic resilience in the eastern region consistently rank the highest, while those in the western and northeastern regions remain significantly lower. The central region generally exhibits influence coefficients at a medium to high level. Overall, the minimum influence coefficient of optical cable length on economic resilience increases from 0.017 to 0.024, while the maximum coefficient rises from 0.073 to 0.115. Similarly, the minimum influence coefficient of Internet broadband access ports on economic resilience grows from 0.013 to 0.015, and the maximum coefficient increases from 0.071 to 0.156. These findings further corroborate the increasing marginal effects of digital infrastructure on economic resilience. The Spatial Durbin Model (SDM) was used to test for spillover effects of digital infrastructure, with the results presented in Appendix B confirming the presence of significant spatial spillovers. Next, the 31 provinces are divided into four major regions—eastern, central, western, and northeastern—for grouped regression analysis using the threshold model.
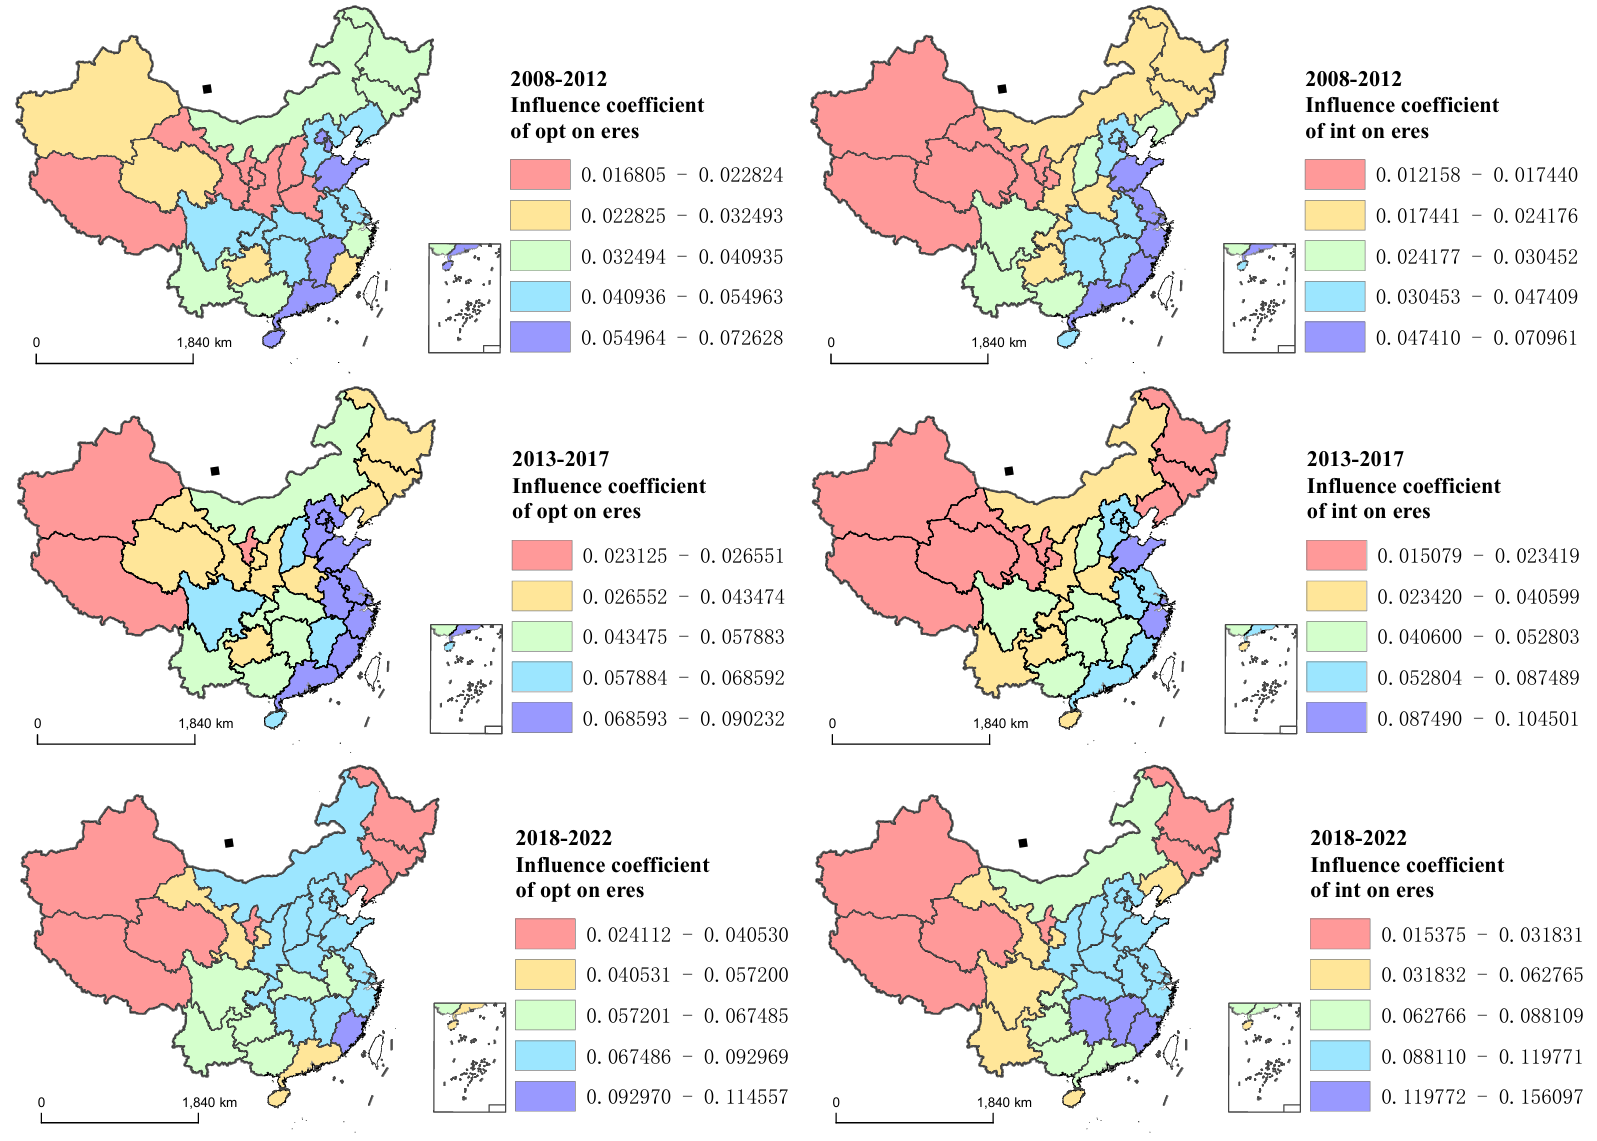
Figure 2. Spatiotemporal of digital infrastructure on economic resilience. Source: Calculate and draw according to the GTWR tool in ArcGIS 10.8.1 software.
5.4. Regional Threshold Effect Analysis
Table 6 presents the threshold regression results of digital infrastructure on economic resilience across the four major regions. After 400 Bootstrap resampling iterations, the length of optical cable lines passed the double threshold test in the eastern, central, and western regions, demonstrating an increasing marginal effect on enhancing economic resilience. However, in the northeastern region, the double threshold test was not met, although a single threshold was identified. The results indicate that when the length of optical cable lines exceeds 770,700 km, it negatively impacts the economic resilience of the northeastern region. This phenomenon may be attributed to the fact that moderate and orderly construction of optical cables can enhance economic resilience, but exceeding this threshold could lead to issues such as over-construction, rising costs, and resource misallocation. Alternatively, while the physical infrastructure of optical cables in the northeastern region is relatively well developed, the lack of advanced network equipment, cutting-edge technologies, and adequate maintenance may hinder its potential to positively influence economic resilience. Regarding internet broadband access ports, the eastern, central, and western regions all exhibit increasing marginal effects on economic resilience. In contrast, the threshold effect in the northeastern region remains statistically insignificant.
To further illuminate the regional heterogeneity, particularly the issues of over-investment and resource misallocation, this study contrasts the divergent development pathways of Liaoning and Zhejiang provinces. Liaoning Province, emblematic of the Northeast region, has historically exhibited a growth model characterized by significant capital investment, often channeled into traditional heavy industries and large-scale physical infrastructure. This approach has, over time, led to capital concentration in sectors with diminishing returns, resulting in challenges with asset utilization and the underperformance of certain major projects. While recent policy efforts have aimed at revitalizing these assets, the region continues to navigate the challenges of structural path dependency. Conversely, Zhejiang Province exemplifies a development paradigm driven more by market dynamism and entrepreneurial activity. Its economic structure, dominated by a vibrant private sector, demonstrates a pronounced capacity for agile resource reallocation. Investments are naturally directed toward high-value, emerging sectors like the digital economy and advanced manufacturing. This inherent flexibility allows for more efficient capital absorption and reduces the systemic risk of widespread resource misallocation, thereby sustaining higher marginal returns on digital and other infrastructure investments. This comparative analysis underscores that the efficacy of digital infrastructure is not merely a function of its scale but is profoundly shaped by the underlying regional economic structure and its capacity for efficient resource allocation.
Table 6. Regression results of threshold models for the four major regions.
| Opt | Int | |||
|---|---|---|---|---|
| Threshold | Influence Coefficient | Threshold | Influence Coefficient | |
| Eastern | Th ≤ 4.3342 | 0.0765 *** [0.0090] | Th ≤ 7.4991 | 0.0394 *** [0.0090] |
| 4.3342 < Th < 5.6265 | 0.0889 *** [0.0084] | 7.4991 < Th < 8.8589 | 0.0493 *** [0.0083] | |
| Th ≥ 5.6265 | 0.1050 *** [0.0084] | Th ≥ 8.8589 | 0.0644 *** [0.0083] | |
| Central | Th ≤ 3.7997 | 0.0376 *** [0.0079] | Th ≤ 8.0057 | 0.0541 *** [0.0044] |
| 3.7997 < Th < 5.0375 | 0.0432 *** [0.0068] | - | - | |
| Th ≥ 5.0375 | 0.0454 *** [0.0060] | Th > 8.0057 | 0.0572 *** [0.0043] | |
| Western | Th ≤ 3.6611 | 0.0250 *** [0.0022] | Th ≤ 7.4232 | 0.0245 *** [0.0016] |
| 3.6611 < Th < 5.5640 | 0.0294 *** [0.0018] | 7.4232 < Th < 8.4559 | 0.0269 *** [0.0014] | |
| Th ≥ 5.56405 | 0.0372 *** [0.0018] | Th ≥ 8.4559 | 0.0321 *** [0.0014] | |
| Northeastern | Th ≤ 4.3447 | 0.0484 *** [0.0071] | - | - |
| - | - | - | - | |
| Th > 4.3447 | 0.0383 *** [0.0055] | - | - | |
Note: Standard errors in parentheses. * p < 0.1; ** p < 0.05; *** p < 0.01.
5.5. Mechanism Analysis
The results of the mechanism test for industrial diversification (Div) are detailed in Model (1) of Table 7. The results show that the coefficients for digital infrastructure on industrial diversification are positive and statistically significant at the 1% level, indicating that digital infrastructure promotes industrial diversification. Further analysis reveals that the coefficients of both digital infrastructure and industrial diversification on economic resilience are also significantly positive. When the industrial diversification variable is controlled for, the absolute value of the coefficient of the core explanatory variable on economic resilience decreases, suggesting that industrial diversification acts as a partial mediator. In other words, digital infrastructure can indirectly enhance economic resilience by promoting industrial diversification. This is further confirmed by the Bootstrap test results in Table 8, which show that the 95% confidence intervals for both the direct and indirect effects do not include zero, thereby validating Hypothesis 2.
As for the mechanism test results for industrial specialization (Spe), they are presented in Model (2) of Table 7. When the length of optical cable lines is used as the core explanatory variable, the coefficient of digital infrastructure on industrial specialization is negative, and the coefficient of industrial specialization on economic resilience is also negative. After controlling for the industrial specialization variable, the coefficient for digital infrastructure on economic resilience remains significantly positive but decreases in magnitude, indicating that industrial specialization also plays a partial mediating role. According to the data in Table 8, the mediating effect of industrial specialization passes the Bootstrap test only when the length of optical cable lines is used as the core explanatory variable. Based on the above analysis, it can be concluded that industrial specialization has a significant inhibitory effect on economic resilience, while digital infrastructure exerts a certain promoting effect on economic resilience. However, this promoting effect primarily stems from the inhibitory impact of digital infrastructure on industrial specialization, thereby indirectly enhancing economic resilience. Consequently, Hypotheses 3 and 4 are not validated. This may be due to the widespread adoption and application of digital infrastructure, which lower the barriers for firms to enter new industries, reducing reliance on a single industry and, to some extent, mitigating the homogeneity and vulnerability caused by excessive industrial specialization, thereby strengthening economic resilience.
Table 7. Mechanism test of the impact of digital infrastructure on economic resilience.
|
(1) div |
(2) spe |
||||
|---|---|---|---|---|---|
|
eres |
MID |
ERES |
MID |
ERES |
|
|
Opt |
0.0376 *** [0.0052] |
0.0486 *** [0.0088] |
0.0329 *** [0.0053] |
−0.0708 [0.1450] |
0.0373 *** [0.0052] |
|
MID |
0.0949 ** [0.0282] |
−0.0032 ** [0.0017] |
|||
|
cons |
−0.324 *** [0.0536] |
2.377 *** [0.0906] |
−0.550 *** [0.0854] |
−1.180 [1.4988] |
−0.328 *** [0.0534] |
|
R2 |
0.609 |
0.154 |
0.619 |
0.034 |
0.612 |
|
Int |
0.0155 ** [0.0061] |
0.0397 *** [0.0100] |
0.0103 * [0.0061] |
0.0356 [0.1628] |
0.0156 ** [0.0061] |
|
MID |
0.131 *** [0.0289] |
−0.0035 * [0.0018] |
|||
|
cons |
−0.498 *** [0.0555] |
2.274 *** [0.0908] |
−0.796 *** [0.0852] |
−0.449 [1.4774] |
−0.500 *** [0.0553] |
|
R2 |
0.567 |
0.126 |
0.587 |
0.034 |
0.571 |
|
Controls |
YES |
YES |
YES |
YES |
YES |
|
Fixed region and time |
YES |
YES |
YES |
YES |
YES |
Note: Standard errors in parentheses. * p < 0.1; ** p < 0.05; *** p < 0.01.
Table 8. Bootstrap test.
|
Observed Coef. |
Bootstrap Std. Err. |
z |
P > |z| |
Normal-Based [95% Conf. Interval] |
|||
|---|---|---|---|---|---|---|---|
|
Div |
Opt |
r(ind_eff) |
0.0094 |
0.0030 |
3.10 |
0.002 |
[0.0034, 0.0153] |
|
r(dir_eff) |
0.0291 |
0.0045 |
6.53 |
0.000 |
[0.0204, 0.0379] |
||
|
Int |
r(ind_eff) |
−0.0060 |
0.0030 |
−2.02 |
0.043 |
[−0.0118, −0.0002] |
|
|
r(dir_eff) |
0.0320 |
0.0050 |
6.36 |
0.000 |
[0.0222, 0.0419] |
||
|
Spe |
Opt |
r(ind_eff) |
0.0018 |
0.0009 |
2.02 |
0.043 |
[0.0001, 0.0035] |
|
r(dir_eff) |
0.0367 |
0.0051 |
7.15 |
0.000 |
[0.0267, 0.0468] |
||
|
Int |
r(ind_eff) |
−0.0020 |
0.0014 |
−1.39 |
0.165 |
[−0.0047, 0.0008] |
|
|
r(dir_eff) |
0.0280 |
0.0054 |
5.15 |
0.000 |
[0.0174, 0.0387] |
5.6. Regional Mechanisms Analysis
Figure 3 illustrates the mechanisms of industrial diversification and specialization in mediating the impact of digital infrastructure on economic resilience across the four major regions, as validated by Bootstrap testing. Due to the fact that neither the western nor the northeastern regions have passed the Bootstrap test, Figure 1 does not include the western and northeastern regions.
In the eastern region, while digital infrastructure promotes industrial diversification, such diversification weakens rather than strengthens economic resilience. Conversely, digital infrastructure suppresses industrial specialization, yet specialization enhances resilience. This phenomenon may be attributed to limitations in low-quality diversification and to the synergy between specialization and digitization. On the one hand, some eastern provinces pursue “full industrial chain” strategies, simultaneously developing high-end manufacturing, traditional processing, and emerging industries. However, the lack of technological or market synergies between these sectors may lead to redundant investments and resource misallocation. Also, the export-oriented economy is significant in the eastern region, which amplifies risks when diversification relies excessively on global supply chains. External shocks such as trade wars and supply chain disruptions may simultaneously destabilize multiple sectors, triggering systemic vulnerabilities. Therefore, diversification’s effectiveness depends on structural quality—high-value-added industries with strong technological linkages and balanced domestic and external demand are critical for resilience. On the other hand, digital infrastructure reduces the eastern region’s barriers to cross-sector entry, diluting traditional specialization. The mature specialized clusters established supply chains and talent pools to enhance horizontal connectivity across geographically specialized clusters. For instance, the Yangtze River Delta integrates Shanghai’s financial resources, Suzhou’s manufacturing capabilities, and Hangzhou’s digital platforms, creating a resilient network. Specialization achieves economies of scale and cost efficiency, while digitization enables adaptive resource reallocation and innovation during market fluctuations. This interplay highlights that resilience in the eastern region stems not from diversification alone but from balancing specialized depth with digitally enabled coordination.
In the central region, digital infrastructure promotes industrial diversification, thereby strengthening economic resilience. However, its impact on industrial specialization is context-dependent, exhibiting both positive and negative effects. Critically, regardless of whether digital infrastructure enhances or weakens specialization, industrial specialization consistently undermines economic resilience. This phenomenon may arise from three interrelated factors: structural vulnerabilities of traditional specialization, institutional and innovation gaps, and digital-traditional sector misalignment. Firstly, industrial specialization in the central region predominantly focuses on resource-intensive, low-value-added sectors (e.g., mining, basic manufacturing). These industries exhibit weak risk resistance and face path dependency risks under digital transformation. While digitization accelerates technological substitution and demand shifts, entrenched specialization—characterized by rigid asset specificity and technological inertia—hinders structural adaptation, amplifying systemic fragility. Secondly, compared to the eastern region, the central region lags in market mechanisms and innovation capacity. Specialized industries fail to develop cluster synergies or scale efficiencies, instead leading to resource overconcentration and oversimplified supply chains. External shocks can trigger cascading economic decline; For instance, a downturn in the coal or steel industries could disproportionately destabilize the entire regional economy. Lastly, digital infrastructure primarily supports the diversification of emerging sectors (e.g., e-commerce, logistics), while traditional specialized industries struggle to integrate digitization due to high transformation costs and delayed returns. This creates a mismatch: digitization marginalizes legacy sectors, deepening their competitiveness gap. For example, traditional manufacturing firms may lack the capital or expertise to adopt smart technologies, leaving them vulnerable to disruption. These dynamics highlight a critical divergence: industrial diversification leverages digitization to build adaptive capacity, whereas specialization—rooted in outdated structures—exacerbates systemic risks. The central region’s resilience thus hinges on rebalancing toward high-value diversification while mitigating the drag of legacy specialization.
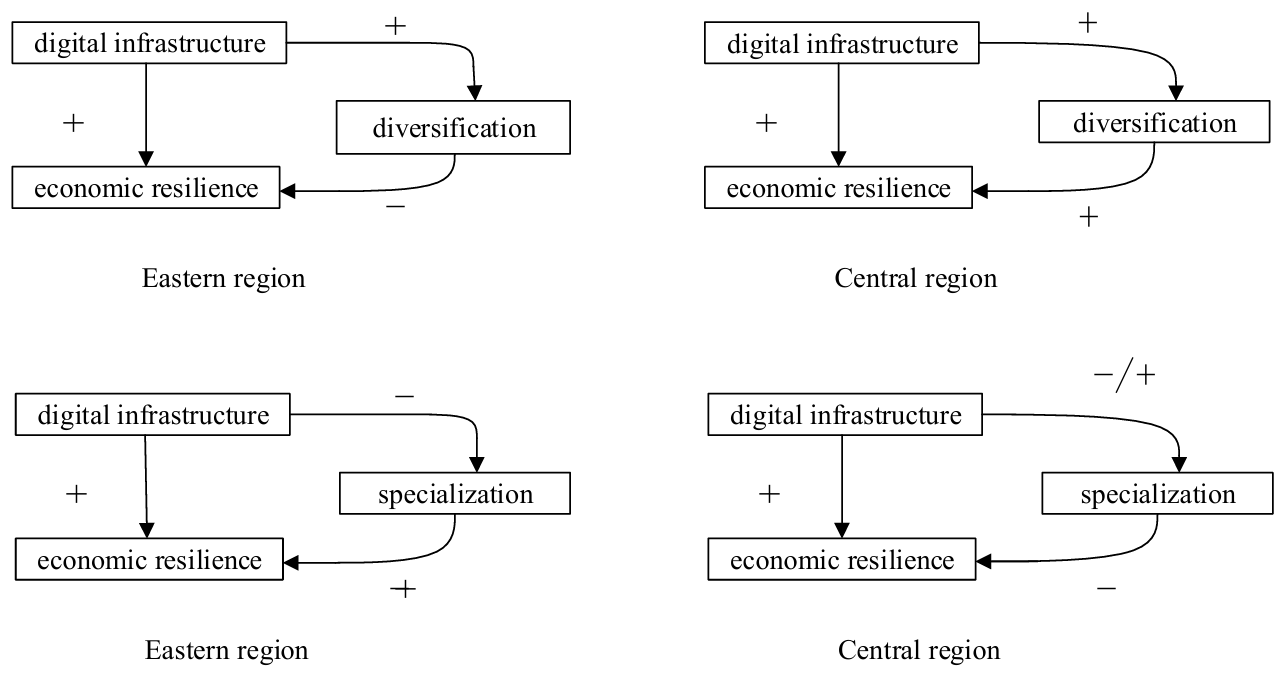
Figure 3. Regional mechanisms analysis. Source: own compilation based on results of regional mechanisms and its Bootstrap tests.
6. Conclusions
The paper concludes that digital infrastructure has a significantly positive, nonlinear impact on economic resilience, characterized by increasing marginal effects. Compared to the eastern region, the threshold values for digital infrastructure in the central, western, and northeastern regions are lower. Notably, in the northeastern region, exceeding a certain threshold of digital infrastructure weakens its positive impact on economic resilience. The mechanisms through which digital infrastructure enhances economic resilience include promoting industrial diversification and reducing industrial specialization. Regionally, digital infrastructure significantly fosters industrial diversification in the eastern and central regions, but in the eastern region, industrial diversification exhibits a masking effect. Industrial specialization enhances economic resilience in the eastern region but weakens it in the central region. The mechanisms of industrial diversification and specialization in the western and northeastern regions are not statistically significant. Our findings highlight the identification of nonlinear threshold effects in the digital infrastructure-resilience relationship, with particular emphasis on inter-regional heterogeneity—providing empirical foundations for optimizing the spatial allocation of digital infrastructure to maximize resilience enhancement. The conditional impact of digital infrastructure observed in our study finds a compelling parallel in European research. While Aleca and Mihai (2025) identify digital skills as the critical complement that determines the productivity payoff of high-speed internet in the EU [52], our mediation analysis reveals that in China, industrial diversification is the key channel through which digital infrastructure builds economic resilience. Ultimately, both contexts lead to the same conclusion: the efficacy of digital infrastructure is not automatic but is fundamentally shaped by a region’s specific structural endowments. Also, reveal region-specific transmission mechanisms through rigorous heterogeneity testing, advancing theoretical understanding of how digital infrastructure differentially influences regional economic resilience across diverse developmental contexts.
To enhance an economy’s resilience—its ability to withstand shocks and adapt to new developmental demands—it is essential to continue advancing digital infrastructure. Building on empirical findings of significant threshold effects and pronounced regional heterogeneity, this study proposes the following refined policy recommendations that emphasize strategic differentiation over a one-size-fits-all approach. The northeastern region calls for shifting from scale control to efficiency-oriented restructuring. This entails that new digital infrastructure projects must demonstrate a clear pathway to achieving predefined benchmarks for economic returns, such as gains in productivity, employment in new-economy sectors, or measurable industrial upgrading. Concurrently, public investment should be strategically realigned to serve as a catalyst for the integration of the digital and traditional industries. Instead of blanket investments, resources should be channeled into modernizing the region’s foundational industries—for instance, by deploying Industrial Internet platforms to revitalize the equipment manufacturing sector or leveraging digital twins and IoT technologies to create a competitive smart agriculture ecosystem. This precision in targeting investments is essential to break the cycle of resource misallocation and foster a new, resilient economic structure. For the central and western regions, the strategic imperative is to avoid homogenized competition with the more developed eastern region. Instead, policy should empower them to leapfrog by leveraging their unique comparative advantages. These regions often possess abundant renewable energy resources, favorable climates, and lower operational costs, making them ideal candidates for developing non-competing digital industries. A targeted strategy would position these regions as the nation’s backbone for data storage, cloud computing, and AI training hubs. By attracting investments in national-level data centers and computing power infrastructure that capitalize on their green energy advantages, they can secure a vital and sustainable role within the national digital division of labor. This approach not only promotes balanced regional development but also enhances the overall resilience and efficiency of China’s digital economy by geographically diversifying its critical infrastructure. In the eastern region, the focus should shift toward achieving effective diversification by promoting relational innovation and fostering technological synergies across industries. This can be achieved by cultivating domestic markets to absorb diversified production capacities, reducing reliance on external fluctuations, and guiding inter-provincial industrial collaboration through top-level planning. Regional differentiation in industrial roles should be emphasized to avoid homogeneous competition. As the only region where industrial specialization significantly enhances economic resilience, the eastern region benefits from the technological barriers and efficiency advantages that specialization brings. These remain core capabilities for dynamic adjustment and refocusing. Moving forward, the eastern region should strategically position itself based on regional characteristics and core strengths, maintaining an appropriate level of industrial specialization. Certain industries can achieve flexible specialization through digital transformation, preserving their specialized core while enhancing adaptability through digitization, thereby further enhancing economic resilience.
Our study has several limitations that may inform future research directions. Firstly, given the accelerating integration and shortening iteration cycles of digital technologies, the classification boundaries for digital infrastructure indicators are becoming increasingly blurred. This poses significant challenges to the acquisition of consistent, long-term panel data, which may lead to deviations from the current quantitative framework in fully capturing the picture of digital infrastructure development. Secondly, the process of building economic resilience is a dynamic, ordered progression that evolves through the development of elements, structures, systems, and functions within risk mitigation and security maintenance mechanisms. The recovery and adjustment cycles may vary across regions facing the same shock or within the same region facing different shocks, influenced by factors such as resource endowments, geographical conditions, and the nature, intensity, and duration of the shocks. Given these complexities, the 16-year study period of our study sample may not be sufficient to fully capture regional variations. Future research could extend the temporal scope of the study samples and conduct comparative regional studies to extract more universally applicable patterns and insights.
Appendix A
Table A1. VIF.
|
Opt |
Int |
FDI |
Urb |
Mar |
Nat |
Cul |
|
|---|---|---|---|---|---|---|---|
|
VIF |
4.37 |
6.59 |
4.81 |
1.12 |
1.78 |
8.51 |
6.05 |
|
1/VIF |
0.2290 |
0.1518 |
0.2080 |
0.8920 |
0.5619 |
0.1175 |
0.1654 |
Appendix B
Table A2. SDM model.
|
(1) opt WG |
(2) int WG |
|
|---|---|---|
|
```latex\rho``` |
0.471 *** [0.0640] |
0.638 *** [0.0973] |
|
Direct |
1.200 * [0.7229] |
1.511 * [0.8067] |
|
Indirect |
0.951 * [0.5373] |
2.150 * [1.2147] |
|
Total |
2.150 * [1.1497] |
3.661 * [1.8722] |
|
cons |
−18.10 [19.2740] |
−11.79 [18.4498] |
|
Huasman |
12.63 * |
9.60 |
|
LM-err |
8.070 ** |
1.624 |
|
LM-lag |
43.441 *** |
6.590 ** |
|
LR-err |
19.03 ** |
37.74 *** |
|
LR-lag |
17.16 ** |
25.42 *** |
|
WALD-err |
17.17 ** |
25.41 *** |
|
WALD-lag |
18.98 ** |
37.89 *** |
|
Controls |
YES |
YES |
|
N |
465 |
465 |
|
R2 |
0.214 |
0.533 |
Note: Standard errors in parentheses.* p < 0.1; ** p < 0.05; *** p < 0.01. WG is the spatial weight matrix (the reciprocal of the squared distance between two provinces, calculated based on the latitude and longitude of their provincial capitals).
Statement of the Use of Generative AI and AI-Assisted Technologies in the Writing Process
During the preparation of this manuscript, the author(s) used DeepSeek in order to proofread. After using this tool/service, the author(s) reviewed and edited the content as needed and take(s) full responsibility for the content of the published article.
Author Contributions
Data curation, K.C.; Formal analysis, Y.J.; Methodology, Y.J.; Supervision, G.L.; Writing, original draft, Y.J.; Review and editing, G.L. and K.C. All authors have read and agreed to the published version of the manuscript.
Ethics Statement
Not applicable.
Informed Consent Statement
Not applicable.
Data Availability Statement
The data that support the findings of this study are available from the corresponding author upon reasonable request.
Funding
This study was funded by the National Natural Science Foundation of China (71971051).
Declaration of Competing Interest
The authors declare that they have no known competing financial interests or personal relationships that could have appeared to influence the work reported in this paper.
References
-
International Monetary Fund. World Economic Outlook Update, January 2025, Global Growth: Divergent and Uncertain; IMF: Washington, DC, USA, 2015. [Google Scholar]
-
Ostarkova J, Stanickova M. How well do we know the issue of resilience? Literary research of current levels of knowledge. East. J. Eur. Stud. 2021, 12, 12–42. doi:10.47743/EJES-2021-SI02. [Google Scholar]
-
Wen TJ. Eight Crises, China’s True Experience 1949–2009; The Oriental Press: Beijing, China, 2012. [Google Scholar]
-
China Academy of Information and Communications Technology. White Paper on Broadband Development in China 2023; China Academy of Information and Communications Technology: Beijing, China, 2023. [Google Scholar]
-
Holling CS. Resilience and stability of ecological systems. Annu. Rev. Ecol. Syst. 1973, 4, 1–23. doi:10.12987/9780300188479-023. [Google Scholar]
-
Martin P, Sunley P. On the notion of regional economic resilience: conceptualization and explanation. J. Econ. Geogr. 2015, 15, 1–42. doi:10.1093/jeg/lbu015. [Google Scholar]
-
Hu X, Hassink R. Handbook on Regional Economic Resilience; Edward Elgar Publishing: Cheltenham, UK, 2020. [Google Scholar]
-
Giannakis E, Bruggeman A. Determinants of regional resilience to economic crisis: a european perspective. Eur. Plann. Stud. 2017, 25, 1394–1415. doi:10.1080/09654313.2017.1319464. [Google Scholar]
-
Brown L, Greenbaum RT. The role of industrial diversity in economic resilience: An empirical examination across 35 years. Urban Stud. 2017, 54, 1347–1366. doi:10.1177/0042098015624870. [Google Scholar]
-
Bishoh P. Knowledge diversity and entrepreneurship following an economic crisis: An empirical study of regional resilience in Great Britain. Entrep. Reg. Dev. 2019, 31, 496–515. doi:10.1080/08985626.2018.1541595. [Google Scholar]
-
Cappelli R, Montobbio F, Morrison A. Unemployment resistance across EU regions: The role of technological and human capital. J. Evol. Econ. 2021, 31, 147–178. doi:10.1007/S00191-020-00693-5. [Google Scholar]
-
Murua JR, Ferrero AM. Talking about regional resilience: Evidence from two formerly rural Spanish regions. Eur. Plann. Stud. 2019, 27, 2312–2328. doi:10.1080/09654313.2019.1615037. [Google Scholar]
-
Petrakos G, Psycharis Y. The spatial aspects of economic crisis in Greece. Camb. J. Reg. Econ. Soc. 2016, 9, 137–152. doi:10.1093/cjres/rsv028. [Google Scholar]
-
Martini B. Resilience and economic structure: Are they related? Struct. Change Econ. Dyn. 2020, 54, 62–91. doi:10.1016/j.strueco.2020.03.006. [Google Scholar]
-
Frenken K, Van FO, Verburg T. Related variety, unrelated variety and regional economic growth. Reg. Stud. 2007, 41, 685–697. doi:10.1080/00343400601120296. [Google Scholar]
-
Goschin Z. Specialization vs. diversification. Which one better upholds regional resilience to economic crises? J. Soc. Econ. Stat. 2019, 8, 11–23. doi:10.2478/jses-2019-0002. [Google Scholar]
-
Hu ZQ, Miao CH, Xiong XL. Research on the impact of industrial agglomeration on industrial resilience in the Yellow River Basin. Geogr. Sci. 2021, 41, 824–831. doi:10.13249/j.cnki.sgs.2021.05.010. [Google Scholar]
-
Chao XJ, Xue ZX. The impact of new information infrastructure on China’s economic resilience: empirical evidence from Chinese Cities. Econ. Dyn. 2023, 8, 44–62. [Google Scholar]
-
Song M, Liu XY. The spatiotemporal evolution and driving factors of the coupling coordination degree between China’s new infrastructure and economic resilience. Econ. Geogr. 2023, 43, 13–22. doi:10.15957/j.cnki.jjdl.2023.10.002. [Google Scholar]
-
He B, Ding W, Zhang D. Does the digital economy matter for carbon emissions in China? Mechanism and path. Pol. J. Environ. Stud. 2024, 34, 7123–7135. doi:10.15244/pjoes/193384. [Google Scholar]
-
Ma R, Guo LH, Li MX. Research on the model and path of new infrastructure construction in China in the new era. Economist 2019, 10, 58–65. doi:10.16158/j.cnki.51-1312/f.2019.10.006. [Google Scholar]
-
Tang KJ, Yang GY. Does digital infrastructure cut carbon emissions in Chinese cities? Sustain. Prod. Consum. 2023, 35, 431–443. doi:10.1016/j.spc.2022.11.022. [Google Scholar]
-
Ma RY, Lin BQ. Digital infrastructure construction drives green economic transformation: evidence from Chinese Cities. Humanit. Soc. Sci. Commun. 2023, 10, 460. doi:10.1057/s41599-023-01839-z. [Google Scholar]
-
Jiao H, Cui Y, Zhang YM. Digital infrastructure and attraction of high skilled entrepreneurial talents in cities. Econ. Res. 2023, 58, 150–166. [Google Scholar]
-
Zhang JF, Yang ZR, He B. Does digital infrastructure improve urban economic resilience? Evidence from the Yangtze River Economic Belt in China. Sustainability 2023, 15, 14289. doi:10.3390/su151914289. [Google Scholar]
-
Sitinjak EB, Meidityawati R, Ichwan NO, Aryani P. Enhancing urban resilience through technology and social media: Case study of urban jakarta. Proc. Eng. 2018, 212, 222–229. doi:10.1016/j.proeng.2018.01.029. [Google Scholar]
-
Karanina EV, Sozinova AA, Bunkovsky DV. Quality management in Industry 4.0 in the Post-COVID-19 period for economic security and sustainable development. Int. J. Qual. Res. 2022, 16, 877–890. doi:10.24874/IJQR16.03-15. [Google Scholar]
-
Zhang J, Yang Z, He B. Empowerment of digital technology for the resilience of the logistics industry: Mechanisms and paths. Systems 2024, 12, 278. doi:10.3390/systems12080278. [Google Scholar]
-
Zhang D, Jiang D, He B. Empowering agricultural economic resilience with smart supply chain: Theoretical mechanism and action path. Sustainability 2025, 17, 2930. doi:10.3390/su17072930. [Google Scholar]
-
Sun H, Yuan WP. Research on the relationship between economic resilience and high quality economic development in Western Regions. Reg. Econ. Rev. 2020, 5, 23–35. doi:10.14017/j.cnki.2095-5766.2020.0086. [Google Scholar]
-
Wan XY, Luo YQ. Measurement of the development level of digital economy and its impact on total factor productivity. Reform 2022, 1, 101–118. [Google Scholar]
-
Zhang MD, Li WL. Research on spatial differences and convergence of urban resilience in northeast China. Ind. Technol. Econ. 2020, 39, 3–12. doi:10.3969/j.issn.1004-910X.2020.05.001. [Google Scholar]
-
Kncovic P. Four laws for today and tomorrow. J. Appl. Res. Technol. 2008, 6, 133–146. doi:10.1002/rnc.1313. [Google Scholar]
-
Yang B, Yang YX. Digital Economics: Theory and Applications; Social Sciences Literature Press: Beijing, China, 2023. [Google Scholar]
-
Jeremy R. The Age of Resilience; Hodgman Literary Press: Flagstaff, USA, 2022. [Google Scholar]
-
Shen JJ. Resilience of the Chinese Economy; China Friendship Publishing Company: Beijing, China, 2021. [Google Scholar]
-
Rong K, Zhou D. Digital Economics; Tsinghua University Press: Beijing, China, 2023. [Google Scholar]
-
Zhang HS, Li SP. Digital infrastructure and advanced energy industry: Effects and mechanisms. Ind. Econ. Res. 2022, 5, 15–27. doi:10.13269/j.cnki.ier.2022.05.005. [Google Scholar]
-
Boschma R, Martin R. The Handbook of Evolutionary Economic Geography; Edward Elgar Publishing: Cheltenham, UK, 2010. [Google Scholar]
-
He B, Nan G, Xu D, Sun J. Bridging or widening? The impact of the broadband china policy on urban-rural income inequality. Humanit. Soc. Sci. Commun. 2025, 12, 555. doi:10.1057/s41599-025-04875-z. [Google Scholar]
-
Xu Y, Deng HY. Diversification, innovation capability, and urban economic resilience. Econ. Dyn. 2020, 8, 88–104. [Google Scholar]
-
China Academy of Information and Communications Technology. White Paper on China’s Computing Power Development Index 2023; China Academy of Information and Communications: Beijing, China, 2024. [Google Scholar]
-
Wen ZL, Liu HY. Methods and Applications of Mediating and Moderating Effects; Education Science Press: Beijing, China, 2021. [Google Scholar]
-
Ringwood L, Watson P, Lewin P. A quantitative method for measuring regional economic resilience to the great recession. Growth Change 2019, 50, 381–402. doi:10.1111/grow.12265. [Google Scholar]
-
Sutton J, Arku G. The importance of local characteristics: an examination of Canadian cities’ resilience during the 2020 economic crisis. Can. Geogr. 2022, 66, 712–727. doi:10.1111/cag.12780. [Google Scholar]
-
Li G, Li JP, Sun XL. Research on the combination of subjective and objective weights and their rationality. Manag. Rev. 2017, 29, 17–26. doi:10.14120/j.cnki.cn11-5057/f.2017.12.002. [Google Scholar]
-
Institute of Industry and Planning, China Academy of Information and Communications Technology. Digital Infrastructure Assessment System Research Report 2024; China Academy of Information and Communications Technology: Beijing, China, 2025. [Google Scholar]
-
Spiegel Y. The Herfindahl-Hirschman Index and the distribution of social surplus. J. Ind. Econ. 2021, 69, 561–594. doi:10.1111/joie.12253. [Google Scholar]
-
Roy S, Majumder S, Bose A, Chowdhury TR. The Rich-poor divide: Unraveling the spatial complexities and determinants of wealth inequality in India. Appl. Geogr. 2024, 166, 103267. doi:10.1016/j.apgeog.2024.103267. [Google Scholar]
-
Tsonkov NI, Petrov KD. Model for analysis and evaluation of sustainable cities in Bulgaria in the context of local public policy appliance. Public Policy Adm. 2024, 23, 308–323. doi:10.5755/j01.ppaa.23.3.35309. [Google Scholar]
-
Jenks GF. The data model concept in statistical mapping. Int. Yearb. Cartogr. 1967, 7, 186–190. [Google Scholar]
-
Aleca OE, Mihai F. The role of digital infrastructure and skills in enhancing labor productivity: Insights from Industry 4.0 in the European Union. Systems 2025, 13, 113. doi:10.3390/systems13020113. [Google Scholar]