Bridging the Urban-Rural Divide: How Urban Agriculture Enhances Food Security in High-Urbanized Regions in Guangdong, China

Bridging the Urban-Rural Divide: How Urban Agriculture Enhances Food Security in High-Urbanized Regions in Guangdong, China
Xinyun Liu 1 Jianya Zhao 1 Yanglan Zhang 2 Shu Wang 1,2,*
Received: 21 August 2025 Revised: 16 September 2025 Accepted: 20 October 2025 Published: 24 November 2025

© 2025 The authors. This is an open access article under the Creative Commons Attribution 4.0 International License (https://creativecommons.org/licenses/by/4.0/).
1. Introduction
The COVID-19 pandemic has profoundly disrupted global food systems, revealing significant vulnerabilities in food supply chains. Government-imposed lockdowns severely impacted the entire food supply chain, affecting producers, suppliers, and consumers alike. Agricultural production faced disruptions due to shortages of essential inputs, such as labor and agricultural materials [1]. Concurrently, food processing and logistics operations were compelled to suspend activities [2]. These disruptions led to increased costs and food prices, thereby diminishing consumer welfare [3,4,5,6,7]. Ultimately, the fragile state of food supply chains during lockdown periods resulted in heightened household food insecurity [8,9,10]. This crisis affected both developed and developing nations [11,12,13,14], as well as rural and urban areas [15]. The reduction in food production and distribution capacities, coupled with a surge in demand, exacerbated malnutrition issues [16,17], even in developed countries such as the United States [18]. Particularly during a period when enhanced energy and nutrition were essential to combat the COVID-19 pandemic, concerns over food fraud intensified [19].
Building resilience in food supply chains is imperative to address future public crises. On the one hand, digital technologies can enhance the resilience of food supply chains [20,21]. For instance, the adoption of blockchain technologies can make food supply chains more innovative and more efficient [22,23]. On the other hand, shortening food supply chains [10,20,22,24,25,26,27,28] through localization [29,30] and regionalization [31,32] can improve the resilience of food supply systems in the face of large-scale disruptions. By reducing the distance between farmers and consumers both spatially and practically, the risks associated with food supply chains can be correspondingly mitigated.
Under conventional circumstances, the delineation of urban centres as nodes of commerce and industry and rural hinterlands as zones of agricultural production leverages economies of scale and scope to maximise economic efficiency [30,33]. According to the core–periphery paradigm, industrial activities concentrate in densely populated urban cores, while agricultural production remains peripheral, reflecting agglomeration economies that minimise input and distribution costs [34,35]. However, this spatial specialisation proved vulnerable during crises such as the COVID-19 pandemic, when extended supply chains experienced significant disruptions, exposing the fragility of long-distance food distribution systems [30,36]. In this context, urban agriculture emerges as a strategic mechanism to enhance local self-sufficiency, mitigate supply chain risks, and ensure access to fresh produce in densely populated cities [37,38,39,40,41,42]. Furthermore, urban agriculture complements rural production by supplying highly perishable commodities that require swift delivery to maintain freshness, alleviating pressure on extended distribution systems and offering niche market advantages [43,44]. Despite its potential to bolster urban food security, the role of urban agriculture in achieving municipal self-sufficiency remains underexplored in rapidly urbanizing regions [44].
Because of the expansion of cities, past rural areas have been incorporated into urban boundaries. The land use has not changed entirely for municipal development or commercial purposes, whereas some farmland and facilities remain for agricultural production, which creates urban agriculture. Compared to long-distance food supply from rural areas, which has been hit the hardest during COVID-19 lockdowns and damaged the welfare of urban consumers and farmers [15], food produced from urban agriculture and supplied to urban consumers is an instant and straightforward way to achieve shorter food supply chains [22,24,27]. The panic from COVID-19 lockdowns reshaped the consumption behavior of urban residents who became more favorable of local food supply [30]. Therefore, urban agriculture is also an important source for supply, and its contribution to safeguarding urban food security as well as national food security requires more comprehensive understanding.
Before the COVID-19 pandemic, urban agriculture had already been widely recognized for its pivotal role in strengthening urban self-sufficiency by countering the vulnerabilities inherent in long-distance food networks shaped by globalization and liberalized trade regimes. Mok et al. (2014) comprehensively reviewed urban agriculture across developed countries, demonstrating its capacity to supply substantial volumes of fresh produce within city boundaries and reduce dependence on external sources [30]. Jarosz (2008) argued that alternative food networks—such as community gardens and farmers’ markets—resocialize food distribution, fostering localized producer–consumer linkages that mitigate the concentration of corporate control over global supply chains [39]. At the landscape scale, Tscharntke et al. (2005) showed that diversified, spatially proximate agricultural practices enhance ecosystem services and resilience by shortening supply distances and maintaining biodiversity, thereby fortifying local food security against systemic disruptions [40].
China’s vast territory exhibits significant regional disparities in economic development and agricultural capacity, with coastal regions generally outperforming inland and upland areas [45,46]. Guangdong Province epitomizes these contrasts: as one of China’s most economically advanced (see Figure 1) and rapidly urbanizing provinces (see Table 1), it has undergone profound industrial and urban transformation since the reform and opening-up era [47,48]. Internally, Guangdong comprises four distinct subregions: the Pearl River Delta, and the eastern, western, and northern prefectures, characterized by marked divergence in GDP per capita and urbanization levels [49,50]. The Pearl River Delta, including Guangzhou, Shenzhen, Foshan, Zhuhai, Dongguan, and Zhongshan, has achieved an urbanization rate exceeding 85% by 2022, forming the backbone of the Guangdong–Hong Kong–Macao Greater Bay Area, a global economic hub [51]. The province’s varied topography—from alluvial delta plains to mountainous uplands—yields heterogeneous agricultural endowments that shape local production patterns [52]. However, accelerated urban expansion has precipitated extensive land-use change, leading to farmland loss and environmental degradation [53]. Concurrently, massive population inflows have driven food demand to levels that outpace local production capacity, increasing reliance on external food sources [54,55]. These dynamics render Guangdong an especially representative case for examining how urban agriculture can bolster city-level self-sufficiency and enhance resilience in food supply chains.
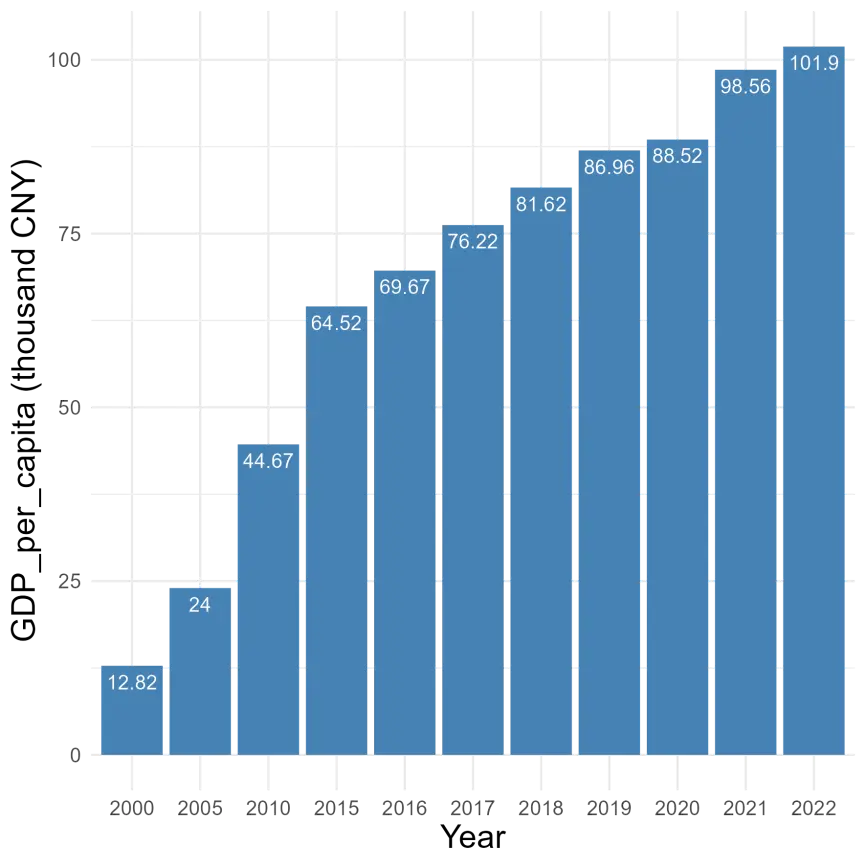
Figure 1. The rise of GDP per capita in Guangdong from 2000 to 2022. Data Source: Guangdong Statistical Yearbook.
Table 1. The urbanization rate in Guangdong from 2000 to 2022. Data Source: Guangdong Statistical Yearbook.
|
Region |
2000 |
2010 |
2020 |
2022 |
|---|---|---|---|---|
|
Guangzhou |
83.79 |
83.79 |
86.19 |
86.48 |
|
Shenzhen |
92.46 |
99.76 |
99.54 |
99.79 |
|
Zhuhai |
85.48 |
87.66 |
90.47 |
90.76 |
|
Foshan |
75.06 |
94.10 |
95.20 |
95.22 |
|
Dongguan |
60.04 |
88.47 |
92.15 |
92.25 |
|
Zhongshan |
60.67 |
87.84 |
86.96 |
87.02 |
|
Average |
55.00 |
66.18 |
74.15 |
74.79 |
|
Shantou |
67.00 |
68.47 |
70.70 |
70.75 |
|
Shaoguan |
51.13 |
52.54 |
57.33 |
58.54 |
|
Heyuan |
26.53 |
40.06 |
48.50 |
50.25 |
|
Meizhou |
37.21 |
43.03 |
51.58 |
52.68 |
|
Huizhou |
51.66 |
61.85 |
72.80 |
72.91 |
|
Shanwei |
52.58 |
54.03 |
57.12 |
57.86 |
|
Jiangmen |
47.08 |
62.31 |
67.63 |
67.85 |
|
Yangjiang |
41.92 |
46.82 |
54.16 |
55.26 |
|
Zhanjiang |
38.47 |
36.69 |
45.46 |
47.31 |
|
Maoming |
37.45 |
35.08 |
43.56 |
45.84 |
|
Zhaoqing |
32.52 |
42.40 |
51.02 |
52.14 |
|
Qingyuan |
32.60 |
47.56 |
54.50 |
56.30 |
|
Chaozhou |
43.41 |
62.78 |
64.19 |
64.81 |
|
Jieyang |
37.91 |
47.33 |
50.65 |
51.93 |
|
Yunfu |
35.86 |
36.97 |
43.77 |
45.04 |
Building on identified gaps in the literature and the empirical context of Guangdong Province, this study delivers three principal contributions: We develop a novel, data-driven framework that classifies prefecture-level cities by an 85% urbanization-rate threshold to operationalize “urban” versus “non-urban” agricultural contexts, and validates the assumption that all agricultural output in these high-urbanization cities serves as a proxy for urban agriculture (see Table 1). This dual approach overcomes the common lack of direct urban-farm statistics and offers a replicable methodology for future urban food-system research in other rapidly urbanizing regions. Our paper is the first to compute grain, vegetable, and fruit self-sufficiency ratios for all 21 prefecture-level cities in Guangdong over a six-year horizon (2017–2022). By integrating panel data with geospatial techniques, we uncover distinct resilience trajectories in high-degree urbanized versus other cities, revealing how food-supply vulnerabilities evolve and space in response to urban expansion. We translate our empirical findings into clear, actionable recommendations—such as prioritizing perishable-food support in high-density zones, incentivizing rooftop and peri-urban farming, and preserving urban greenbelts—to enhance localized supply chains. These policy prescriptions are grounded in city-level performance metrics and provide decision-makers with precise levers to bolster urban food security under future crises.
2. Data and Methods
2.1. Method
Self-sufficiency of food can be assessed using various metrics, including caloric value, production volume, or monetary value [44,56]. To evaluate the balance between food production and consumption, the most intuitive and straightforward approach is to compare actual food production with the region’s standard per capita food consumption and the population it supports. This method provides a practical framework for analyzing regional food security dynamics and identifying areas where localized interventions may be necessary to address imbalances. This study analyzes the self-sufficiency of food at the prefecture-level cities in Guangdong Province. The urbanization rate is chosen as the separation threshold to split the city into two groups: high-degree urbanized cities (urbanization rate > 85% in 2022, see Table 1, Guangzhou, Shenzhen, Zhuhai, Foshan, Zhongshan, Dongguan) and others (Shantou, Shaoguan, Heyuan, Meizhou, Huizhou, Shanwei, Jiangmen, Yangjiang, Zhanjiang, Maoming, Zhaoqing, Qingyuan, Chaozhou, Jieyang, Yunfu).
In this study, we operationally define “urban agriculture” as the total agricultural output from prefecture-level cities with an urbanization rate exceeding 85%. This proxy is adopted due to the lack of direct urban farm statistics. It is justified by the high degree of urbanization in these cities, where remaining agricultural activities are typically small-scale, peri-urban, or technologically intensive. This approach allows for a consistent and replicable assessment of UA’s contribution to food self-sufficiency.
The analysis is grounded in the fundamental concepts of division between food production and consumption:
where RSSGi,y indicates the ratio of self-sufficiency of grain in region i of year y; YRi,y is grain production in region i of year y; SR is the standard of individual grain consumption, and P is the population in region i of year y. VSSGi,y indicates the ratio of self-sufficiency of vegetable and melon in region i of year y; YVi,y is vegetable and melon production in region i of year y; SV is the standard of individual vegetable and melon consumption. FSSGi,y indicates the ratio of self-sufficiency of fruit in region i of year y; YFi,y is fruit production in region i of year y; SF is the standard of individual fruit consumption. If RSSG, VSSG, and FSSG are greater than 1, it indicates that the grain, vegetable, and melon, fruit production in the region exceeds the local consumption needs, ensuring self-sufficiency. Conversely, it implies the deficit, requiring imports from other regions (via domestic allocation or international trade).
Several factors influence the calculation of actual food production and consumption. Apart from direct consumption for diet, grain has been consumed indirectly for forage and food processing. These factors act as additional constraints and are often estimated using conversion coefficients. For example, grain loss accounts for approximately 12% of total production [57,58], and the direct consumption of grain in Guangdong is 42.2% [59]. Considering the direct and indirect consumption of grain, an annual 400 kg per capita has been set as the grain consumption standard [60]. Vegetable and melon, as well as fruit consumption, are used at the direct consumption level reported from the Guangdong Rural Statistical Yearbook. This methodological framework provides a structured approach to quantifying food self-sufficiency and identifying regional disparities in food production and consumption, which are critical for ensuring food security.
2.2. Statistical Analytical Framework
The analyses in this study were conducted in three distinct stages (Figure 2). First, a descriptive statistical analysis was performed to identify the structure and trend of food production in Guangdong.
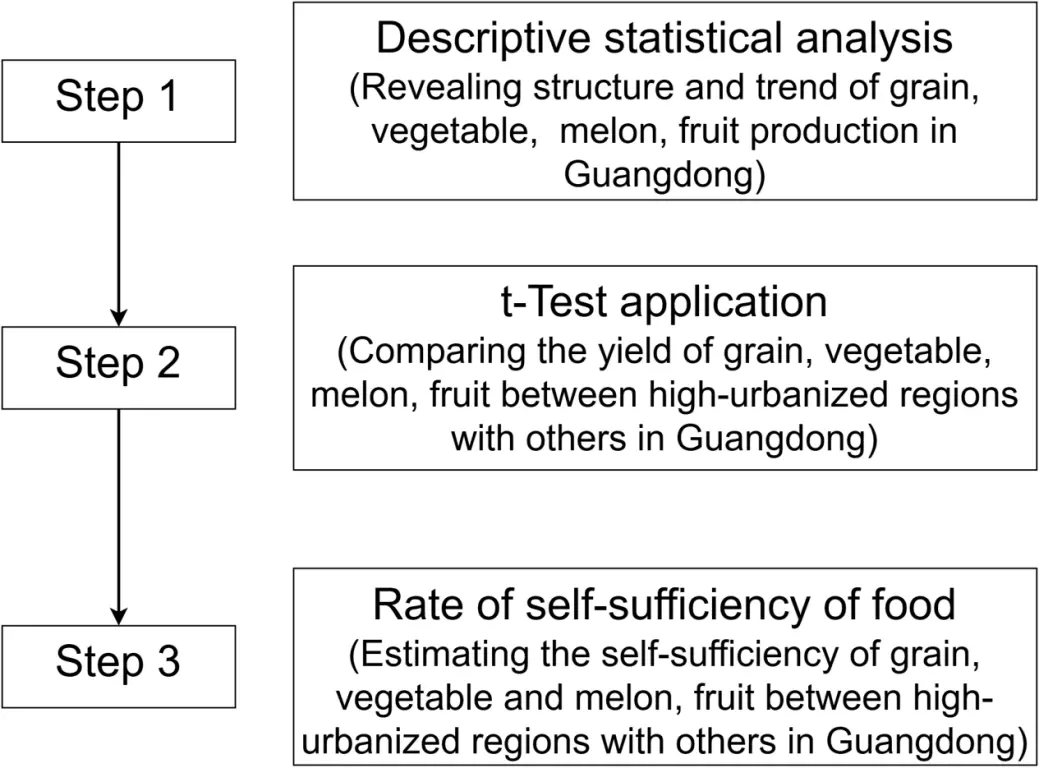
Second, the study compared the yield of grain, vegetable, melon, and fruit between high-urbanized regions and others in Guangdong with the t-test application. The continuously annual yield data from 2017 to 2022 were used.
Finally, the study estimated the self-sufficiency of grain, vegetable, and melon (the data for vegetable and melon consumption are merged together), and fruit in Guangdong. To mitigate potential bias from extreme one-year values, the average yield data from 2017 to 2022 were used. Additionally, the spatial distribution of food self-sufficiency was analyzed to uncover the patterns of food production and consumption across Guangdong.
2.3. Data
Benefiting from a comprehensive and well-established statistical system, this study utilizes annual data from 21 prefecture-level cities in Guangdong Province, drawn from the Guangdong Rural Statistical Yearbook.
3. Results
3.1. Structure and Trend of Food Production in Guangdong Province
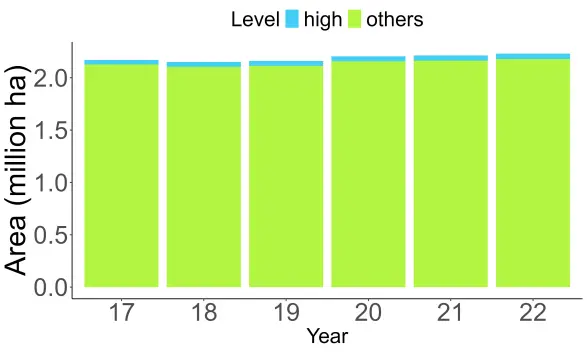
Figure 3 compares the evolution of cultivated area for grain, vegetables, melons, and fruit between high-degree urbanized cities (urbanization rate > 85%) and all other prefecture-level regions in Guangdong from 2017 through 2022. In Figure 3a, the grain-sown area in high-degree urbanized cities expanded steadily from 0.0432 million ha in 2017 to 0.0515 million ha in 2022, indicating modest but persistent growth in urban agricultural initiatives. By contrast, non-highly urbanized regions sustained much larger grain-cultivation areas, fluctuating slightly around 2.10–2.18 million ha, with a minor dip in 2018 followed by stabilization and a marginal rebound through 2022. This stark scale differential underscores that, although metropolitan jurisdictions are increasingly engaging in urban farming, their contribution to overall provincial grain output remains limited.
Turning to Figure 3b, vegetable-sown area within the most urbanized cities rose marginally from 0.225 million ha in 2017 to a peak of 0.236 million ha in 2020, before leveling off at 0.234 million ha by 2022. Such stability suggests that urban vegetable production has reached a mature plateau under current land-use constraints. In contrast, other regions exhibited a clear upward trajectory, from 1.00 million ha in 2017 to 1.19 million ha in 2022, reflecting continued expansion of suburban and rural vegetable cultivation and reinforcing their dominant role in meeting provincial demand.
 |
 |
|
(a) |
(b) |
 |
 |
|
(c) |
(d) |
Figure 3. The Comparison between high-degree urbanized regions and others and Trends of Grain Area (a), Vegetable Area (b), Melon Area (c), and Fruit Area (d) in Guangdong Province, 2017–2022. Data Source: Guangdong Rural Statistical Yearbook.
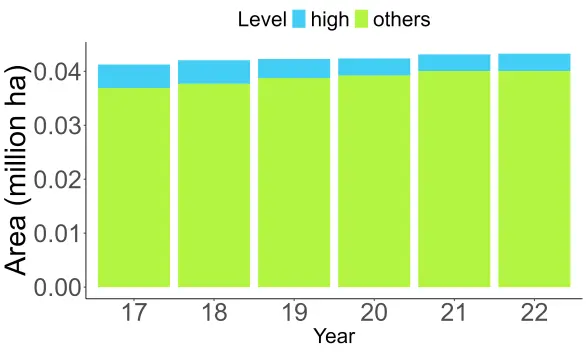
Figure 3c illustrates melon cultivation, where high-degree urbanized cities saw a decline from 0.00433 million ha in 2017 to 0.00308 million ha in 2021, followed by a slight recovery to 0.00322 million ha in 2022. This volatility suggests challenges in sustaining specialized crop production under urban pressure. Meanwhile, non-highly urbanized areas maintained a steady increase in melon-sown area—from 0.0369 million ha to 0.0401 million ha—outstripping their urban counterparts by a factor of ten or more and highlighting the peripheral regions’ comparative advantage in niche horticulture.
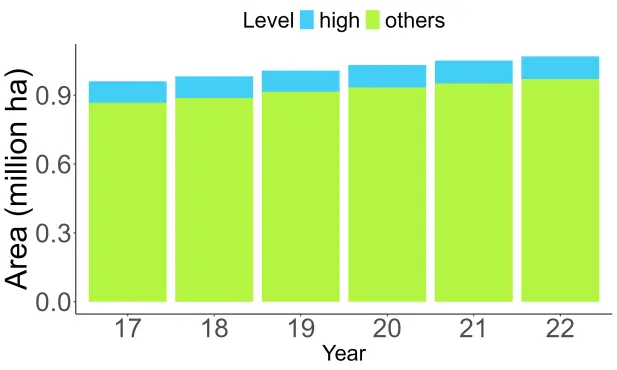
Finally, Figure 3d shows that fruit-sown area in high-degree urbanized cities experienced minor interannual fluctuations, rising from 0.0937 million ha in 2017 to 0.0992 million ha in 2021 before a slight dip to 0.0990 million ha in 2022. In comparison, other regions saw continuous growth from 0.867 million ha to 0.970 million ha over the same period. The roughly tenfold disparity between the two groups reaffirms that, despite stable urban fruit production, non-urbanized prefectures remain the primary source of Guangdong’s fruit supply.
Overall, these trends reveal a pronounced production gap between highly urbanized and less urbanized regions: metropolitan areas are gradually scaling up urban agriculture but still account for only a small fraction of provincial cultivation. In contrast, the substantial and growing land base in other regions guarantees their critical role in sustaining Guangdong’s food security.
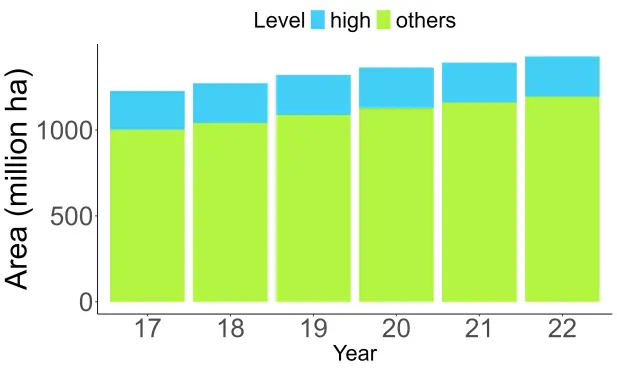
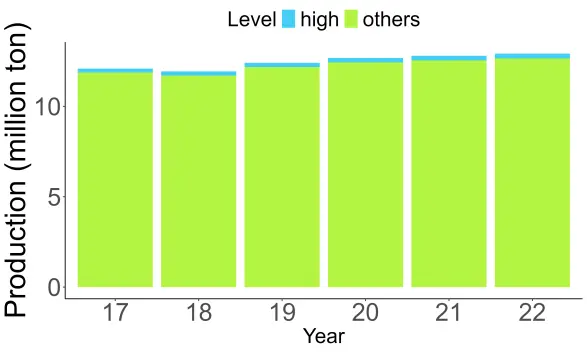
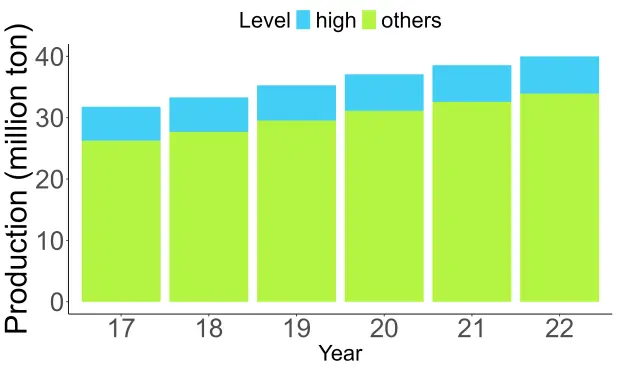
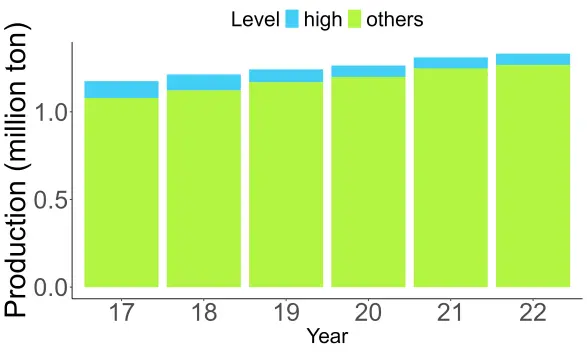
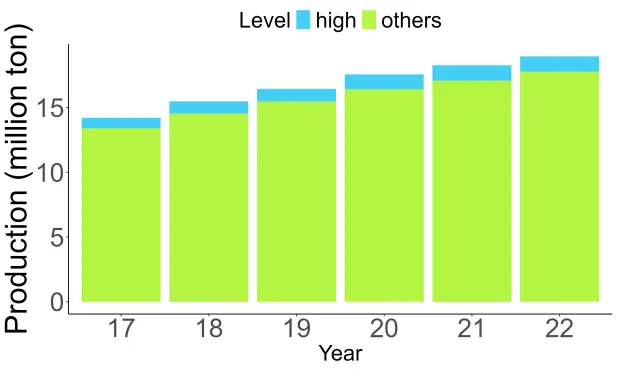
Figure 4a–d contrasts the evolution of grain, vegetable, melon, and fruit production between high-degree urbanized cities and all other prefecture-level regions in Guangdong from 2017 to 2022. During this period, grain output in the six most urbanized jurisdictions rose modestly from 0.218 million t to 0.268 million t, whereas other regions maintained substantially larger yields—growing from 11.9 million t to 12.6 million t—resulting in a persistent 50–55-fold production gap and underscoring the minor yet positive contribution of urban agriculture to provincial grain supply. Vegetable production in urban cores also increased steadily, from 5.53 million t to 6.06 million t, but remained far below the 26.2 million t to 33.9 million t expansion observed in less urbanized areas, reinforcing their continued dominance in meeting Guangdong’s vegetable demand. Melon cultivation within highly urbanized cities exhibited an overall decline—from 0.0962 million t in 2017 to a low of 0.0633 million t in 2021, before marginally rebounding to 0.0644 million t in 2022—while non-urbanized regions demonstrated uninterrupted growth from 1.08 million t to 1.27 million t, reflecting a ten- to twenty-fold advantage in peripheral areas. Similarly, urban fruit production rose from 0.815 million t to a peak of 1.19 million t in 2021 before settling at 1.17 million t in 2022; in contrast, other regions expanded fruit yields from 13.4 million t to 17.8 million t. Together, these trends reveal a pronounced disparity in production scale -ranging from 4.7- to over 55-fold- between metropolitan and non-metropolitan areas, highlighting the indispensable role of rural and suburban agriculture in sustaining Guangdong’s food security and the incremental but constrained gains achievable through urban farming.
 |
 |
|
(a) |
(b) |
 |
 |
|
(c) |
(d) |
Figure 4. The Comparison between high-degree urbanized regions and others and Trends of Grain Production (a), Vegetable Production (b), Melon Production (c), and Fruit Production (d) in Guangdong Province, 2017–2022. Data Source: Guangdong Rural Statistical Yearbook.
3.2. The Yield Comparison of Food Production in Guangdong Province
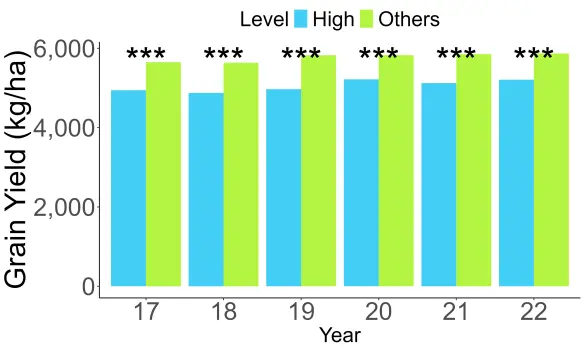
As shown in Figure 5a, grain yield in the six high-degree urbanized cities fluctuated between 4875 and 5217 kg/ha from 2017 to 2022, exhibiting no clear upward trend. In contrast, the other prefecture-level regions achieved higher and steadily increasing yields, rising from 5637 kg/ha in 2017 to 5869 kg/ha in 2022. Annual Student’s t-tests (t = 4.15–5.47, p < 0.001) confirm a persistent 12–16% yield advantage in non-urbanized areas, highlighting the greater productivity of extensive rural farming systems under current management practices.
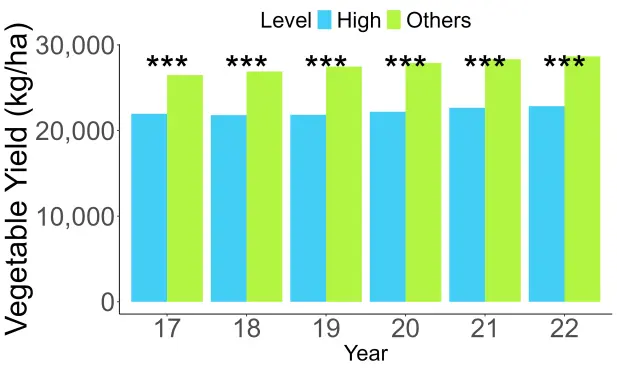
Figure 5b illustrates that vegetable yields in high-degree urbanized cities increased modestly from 21,902 to 22,848 kg/ha over the study period, whereas non-urbanized regions posted higher yields—26,468 to 28,660 kg/ha. Student’s t-values for each year (t = 2.88–3.47, p ≤ 0.01) demonstrate statistically significant differences, with the absolute yield gap widening from 4515 kg/ha in 2017 to 5812 kg/ha in 2022. These results underscore the sustained productivity edge of suburban and rural cultivation systems despite parallel upward trends.
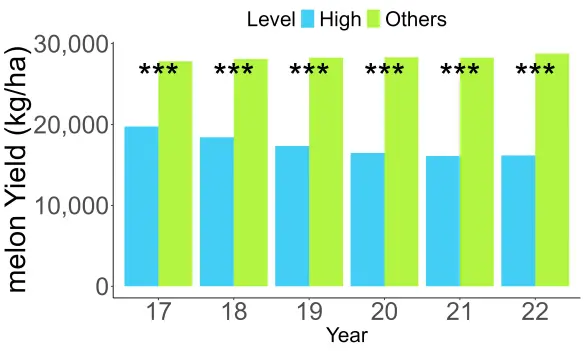
As depicted in Figure 5c, melon yields in high-degree urbanized cities declined from 19,758 kg/ha in 2017 to 16,178 kg/ha in 2022, while other regions maintained stable yields between 27,823 and 28,787 kg/ha. The widening yield gap—from 8066 kg/ha to 12,610 kg/ha—is reflected the challenges that dense urban environments face in sustaining specialized horticultural production.
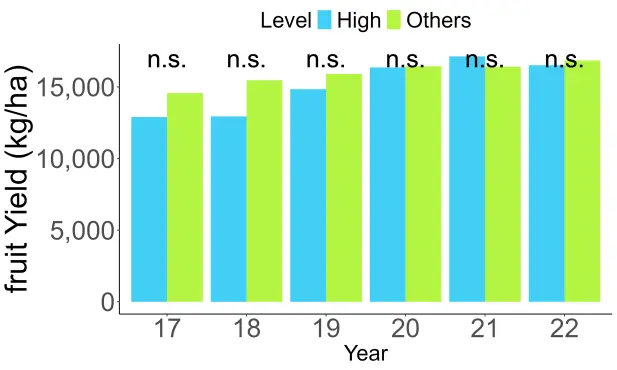
Figure 5d shows that fruit yields in urban cores climbed from 12,903 kg/ha in 2017 to 16,518 kg/ha in 2022, while yields in other prefectures grew from 14,576 to 16,855 kg/ha. Unlike the other crops, Student’s t-tests yielded no significant differences (t = −0.47 to 1.73; p > 0.05), indicating convergence: the yield gap narrowed from 1672 kg/ha to 337 kg/ha, with urban yields briefly exceeding rural yields in 2021. This pattern suggests that intensified peri-urban fruit cultivation and technology adoption are closing the productivity divide.
 |
 |
|
(a) |
(b) |
 |
 |
|
(c) |
(d) |
Figure 5. The Student-T statistical Test between high-degree urbanized regions and others and Trends of Grain Yield (a), Vegetable Yield (b), Melon Yield (c), and Fruit Yield (d) in Guangdong Province, 2017–2022. (*** p < 0.001; n.s., not significant (t-test)). Data Source: Guangdong Rural Statistical Yearbook.
3.3. The Self-Sufficiency of Food Production in Guangdong Province
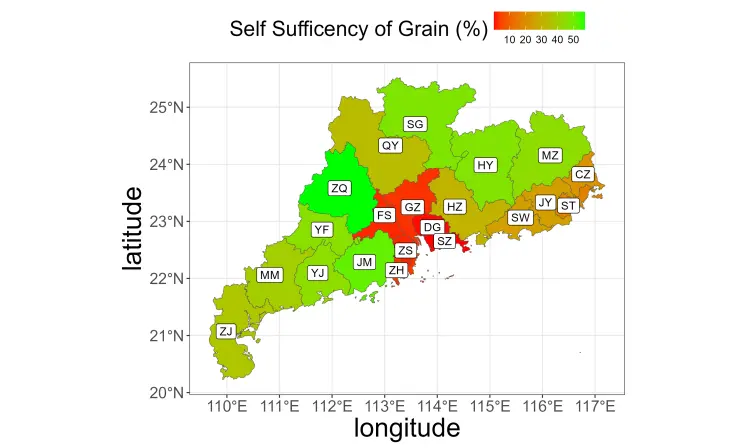
Figure 6a–c collectively reveal stark spatial heterogeneity in Guangdong’s capacity to meet local consumption through in-situ production. Grain self-sufficiency (RSSG) declines sharply with urbanization intensity, whereas vegetable and melon self-sufficiency (VSSG) and fruit self-sufficiency (FSSG) exhibit pronounced center-to-periphery gradients, with suburban ring cities showing moderate surpluses and peripheral prefectures delivering exceptional outputs. These results underscore the inverse relationship between urban density and staple-crop resilience, the buffering role of peri-urban agriculture for high-demand HVPs (high-value produce), and the critical function of non-urbanized regions in underpinning Guangdong’s overall food security [61,62].
Figure 6a maps the mean RSSG for Guangdong’s 21 prefecture-level cities (2017–2022), revealing stark territorial disparities. Shenzhen (0.28%) and Dongguan (0.55%) occupy the lowest sufficiency tier, followed by other high-urbanization cities such as Guangzhou (2.97%) and Zhuhai (3.74%), whose local grain outputs meet less than 5% of consumption needs. Mid-level sufficiency is observed in transitional zones—Shantou (17.35%), Shanwei (25.04%), and Chaozhou (21.71%)—where limited peri-urban cultivation yields modest buffers against imports. The highest RSSG values are concentrated in Guangdong’s western and northern prefectures: Zhaoqing (57.09%), Jiangmen (51.70%), Shaoguan (47.49%), and Meizhou (45.06%). Nevertheless, even these outlying hubs fall well below self-sufficiency, underscoring the province’s overall vulnerability. Spatially, core urban centers cluster in the lowest RSSG quintile, whereas peripheral cities dominate higher quintiles, highlighting their indispensable role as grain production bases and buffers for metropolitan demand. This pronounced center–periphery pattern emphasizes the need to strengthen peri-urban grain cultivation and to streamline interregional grain flows to mitigate urban deficits.
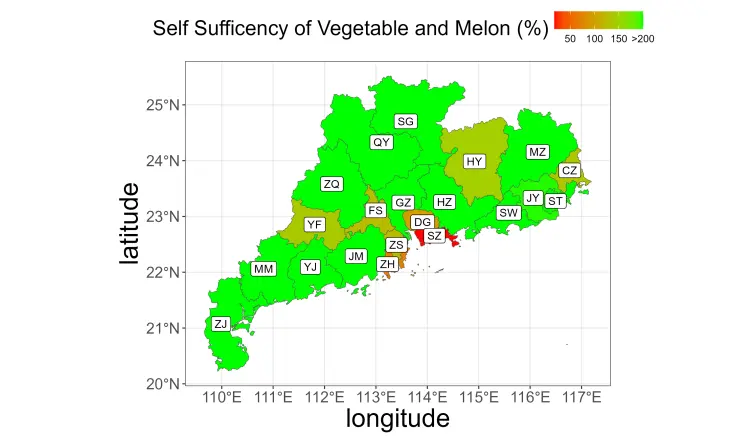
Figure 6b illustrates the mean vegetable and melon self-sufficiency ratio for each of Guangdong’s 21 prefecture-level cities over 2017–2022. A clear center-to-periphery gradient emerges: core metropolitan jurisdictions such as Shenzhen (17.47%), Zhuhai (68.73%), and Dongguan (97.34%) fall below the 100% self-sufficiency threshold, reflecting acute land scarcity and limited peri-urban cultivation, whereas the Pearl River Delta’s suburban ring cities—Guangzhou (264.51%), Foshan (126.28%), and Zhongshan (125.05%)—achieve moderate surpluses by integrating peri-urban agricultural zones. The highest surpluses occur in less urbanized northern and western prefectures (e.g., Qingyuan 559.20%, Huizhou 550.21%, Zhaoqing 480.60%, Meizhou 313.56%, Shaoguan 306.93%), underscoring their capacity as major production bases for intra-provincial distribution. This spatial pattern highlights the necessity of reinforcing urban agriculture in land-constrained cores and optimizing logistics from high-surplus peripheries to ensure resilient provincial food security.
 |
 |
|
(a) |
(b) |
 |
|
|
(c) |
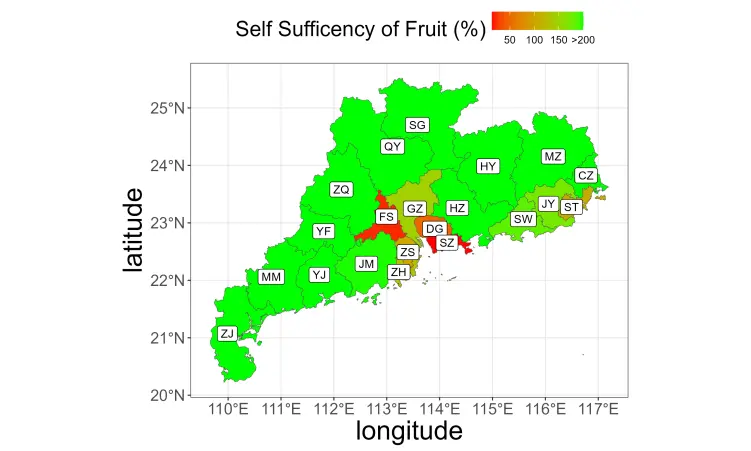
Figure 6. Spatial Distribution of Grain (a), Vegetable and Melon (b) and Fruit (c) Self-Sufficiency in Guangdong Province. Data Source: Guangdong Rural Statistical Yearbook.
Figure 6c reveals a pronounced spatial gradient in average fruit self-sufficiency across Guangdong’s 21 prefecture-level cities over 2017–2022: the most highly urbanized cores—Shenzhen (13.22%) and Dongguan (47.85%)—exhibit severe deficits, while Zhuhai (125.82%), Guangzhou (146.52%) and Zhongshan (103.26%) in the Pearl River Delta’s suburban ring achieve modest surpluses through peri-urban cultivation. Beyond this ring, production capacity intensifies markedly: coastal and northern-western prefectures such as Zhanjiang (723.53%), Maoming (1064.34%), Zhaoqing (888.60%), and Meizhou (579.29%) deliver the highest surpluses, followed by Huizhou (475.87%), Qingyuan (370.55%), and Yunfu (358.40%). Mid-level surplus cities—including Shantou (107.79%), Shanwei (184.32%), and Jieyang (172.79%)—underscore the broad regional ability to generate fruit outputs well in excess of local consumption. This pattern highlights acute land constraints and limited urban agriculture in core metropolises, contrasted with expansive cultivation zones on the provincial periphery, suggesting the need to bolster urban-center production technologies and optimize cross-regional distribution networks.
4. Discussion and Policy Recommendation: Transformation to Modern Urban Agriculture
4.1. Storing Food in the Land: Urban Agriculture and the Red Line of Farmland Protection
China has experienced rapid and massive urban expansion in recent decades, with cropland loss driven primarily by built-up land conversion. Wang et al. (2019) estimated that 5.92 million ha—or 3.31% of national cropland—was lost between 2000 and 2010 [63]. Huang et al. (2019) further reported that, during 1990–2015, 291 Chinese cities saw farmland occupation expand by nearly 1900 ha per year at an average annual growth rate of 5% [64]. More recent analysis by Wu et al. (2024) suggests this pressure intensified, with approximately 4000 ha of farmland lost each year between 1990 and 2020 [65].
To arrest further decline in arable area, the Chinese government enshrined a “Red Line of Farmland Protection” policy, mandating a minimum of 1.8 billion mu (120 million ha) of farmland to secure national food supply [63,66,67]. In 2015, this commitment was reinforced under the “storing grain in the land” strategy [68]. Parallel to urban pressures, significant tracts of farmland have been diverted to ecological restoration—such as grain-for-green programs—to bolster environmental resilience, despite short-term reductions in harvest area [69,70].
Our spatial analysis of Guangdong Province confirms a pronounced inverse relationship between urban density and staple-crop self-sufficiency. Highly urbanized cities such as Shenzhen (RSSG = 0.28) and Dongguan (RSSG = 0.55) remain heavily dependent on external grain sources (Figure 6a), whereas peripheral prefectures, Zhaoqing (RSSG = 57.09), Jiangmen (RSSG = 51.70), and Shaoguan (RSSG = 47.49), achieve exceptional surpluses. Similar center–periphery gradients characterize vegetable and melon self-sufficiency (e.g., Shenzhen VSSG = 17.47%, Guangzhou VSSG = 264.51%, Qingyuan VSSG = 559.20%) and fruit self-sufficiency (e.g., Shenzhen FSSG = 13.22%, Guangzhou FSSG = 146.52%, Maoming FSSG = 1064.34%) (Figure 6b,c). These findings underscore that, while non-urbanized regions underpin Guangdong’s overall food security, urban agriculture—even in highly developed cities—remains insufficient to offset staple-crop deficits. However, it exhibits promising gains in fruit production.
Moreover, the provincial trend in sown grain area has remained remarkably stable at both district and county levels—despite substantial urban encroachment—testifying to Guangdong’s vigorous enforcement of farmland protection measures [71]. This stability provides a solid foundation for sustainable food supply, but also signals the need for more targeted interventions to harness urban agricultural potential where land is scarce.
Furthermore, it is important to note that food self-sufficiency is not a static metric but evolves dynamically over time. Our findings represent a snapshot under current conditions; however, the trajectory of self-sufficiency is influenced by the interplay of several long-term trends. Ongoing urbanization and land consumption continue to exert downward pressure on the availability of land for agriculture, particularly within city cores. Conversely, advancements in agricultural technology—such as the adoption of high-yield vertical farming, hydroponics, and optimized crop varieties—can significantly increase productivity per unit area, thereby exerting a positive influence on self-sufficiency rates. Future longitudinal studies tracking these factors—urban sprawl, technological adoption, and yield changes—across a diverse set of cities would be invaluable. Such research would better isolate key drivers and allow for more targeted and effective policy interventions that can anticipate future trends rather than merely responding to current conditions.
In alignment with China’s “Red Line of Farmland Protection”, which codifies a minimum of 1.8 billion mu (120 million ha) of permanent basic farmland to secure national food supplies [66,67], Guangdong should formally integrate these red-line quotas into its multi-level territorial spatial plans, thereby delimiting urban growth boundaries and safeguarding high-quality arable land within municipal master plans. Simultaneously, the province must accelerate high-standard farmland construction in peri-urban belts by upgrading soil management, irrigation infrastructure, and mechanization, ensuring that outer-ring prefectures sustain and enhance their pivotal role as surplus food producers.
Moreover, to bolster food self-sufficiency in land-constrained urban cores (e.g., Shenzhen, Dongguan), Guangdong should deploy targeted support—such as grants, tax incentives, and streamlined land-leasing—for vertical farms, rooftop greenhouses, and other controlled-environment agriculture systems, while strengthening peri-urban–urban supply chains through GIS-enabled logistics and cold-chain networks. This dual approach of modern urban agriculture and optimized distribution will maximize local production of fresh, high-value crops and more effectively channel peripheral surpluses into metropolitan markets.
4.2. Storing Food in Technology: Upgrade of Urban Agriculture
A comprehensive assessment of food self-sufficiency must also consider the demand side, particularly the role of evolving dietary patterns. The level of sufficiency is not only a function of production but also of consumption. Rapid shifts in urban diets, particularly towards more resource-intensive patterns such as increased consumption of animal proteins, would necessitate substantially more land and water resources to produce the same caloric value compared to plant-based diets. Therefore, a city’s actual and future self-sufficiency capacity is profoundly shaped by the dietary choices of its inhabitants. Policies aimed at enhancing urban food resilience must therefore be holistic, considering not only production-side strategies but also demand-side measures. Promoting sustainable and less land-intensive dietary choices among urban consumers is crucial for easing the pressure on local production systems. Integrating consumption patterns and their evolution into future models and policies for urban food self-sufficiency will provide a more comprehensive and realistic assessment of a city’s ability to feed itself.
Apart from promoting sustainable farmland use with the “storing food in the land” policy, China also promotes agricultural technology innovation as “storing food in the technology” [72,73,74]. Urban agriculture can achieve higher food yield than conventional agriculture, mainly because of technical and managerial factors:
- (1)
-
Climate change and controlled environment agriculture: Climate change is predicted to increase the vulnerability of food production and uncertainty in food yield, urban agriculture could utilize controlled environments that maintain optimal growing conditions, leading to higher yield [75,76,77,78,79].
- (2)
-
Land use competition and vertical farming: Agriculture is particularly vulnerable in the land use competition [80], and the use of vertical farming systems increases the amount of grain produced per area [81,82,83].
- (3
-
Input reduction and precise agriculture: The massive input of water and chemicals harasses sustainable farming in China, and urban agriculture is seen as a solution to reduce the ecological footprint from implementing digital transformation and precise application in agriculture [84,85,86,87,88].
- (4)
-
Location advantage and technology dissemination: Location advantage plays vital role in technology dissemination and transfer. By taking advantage of a preferred location, a city, especially a rising megacity, can attract the dwelling of high-quality talent and achieve scientific and technological innovation [89,90]. In China, agricultural extension services make great qualified technical assistance for appropriate technology dissemination and transfer [91,92], and it heavily relies on the network consists of agricultural institutes, university and promotion centers [93,94]. By taking advantage of a closer distance to the city, urban agriculture can more easily receive the technical assistance.
- (5)
-
Municipal subsidy and ecosystem service to the city: As for the emerging economies, China also encounters severe urban-rural imbalance during the development process [95]. Accompanied with the implementation of the fiscal decentralization scheme [96], the gap of fiscal status between district and county also exacerbates [95,97,98]. Therefore, the district can provide relatively higher subsidies for supporting grain production per unit in the district. On the other hand, city also has higher realization of the necessity and importance of ecosystem services from urban agriculture [99,100,101], and they also are more capable for paying higher compensation to urban agriculture [102], which is one of the crucial supporting arguments for subsiding urban agriculture with public finance.
Despite these technological and managerial advantages, Guangdong’s high-degree urbanized cities continue to underperform relative to peripheral regions: grain yields in cores average only ~5050 kg/ha versus ~5750 kg/ha in other areas (Figure 5a), and self-sufficiency ratios remain below unity (Figure 6a). To bridge this gap, Guangdong should accelerate technology transfer by establishing pilot plant factories in Shenzhen and Guangzhou, linking municipal R&D centers with urban farm cooperatives, and integrating digital platforms that consolidate sensor, weather, and market data to enhance decision-making and resource allocation [103]. By coupling these upgrades with strict enforcement of the Red Line farmland protection policy, the province can demonstrate a scalable model of high-quality urban agriculture that both sustains metropolitan consumption and exemplifies China’s broader transition toward resilient, technology-driven food systems.
4.3. Food Loss Reduction
Grain and food loss in Guangdong—and more broadly in China—occurs across the entire value chain, with on-farm losses (during sowing, cultivation, and harvesting) and off-farm losses (post-harvest handling, storage, and distribution) contributing distinctly to overall inefficiency [104]. Within the farm boundary, yield losses are relatively uniform between districts and counties [104]. In contrast, post-harvest losses are highly sensitive to local infrastructure: improper handling, inadequate drying, and substandard storage can lead to substantial quality deterioration and weight loss before grain reaches the market [105]. Research shows that modern storage facilities—hermetic silos, mechanical dryers and automated aeration systems—can reduce storage losses by 20–30% [106], but these technologies demand reliable electricity—something urban centers can provide more consistently than rural areas, where grid instability persists [104,107].
Beyond storage, rapid and dependable transport links are crucial to minimize losses en route to consumers. Urban areas in Guangdong benefit from superior transport infrastructure—including dense road networks and refrigerated logistics nodes—resulting in lower spoilage rates compared to rural counterparts [103,108]. Moreover, urban agriculture inherently shortens the supply chain, delivering grain from peri-urban plots to local markets over shorter distances and further reducing handling stages. As such, targeted investments in modern post-harvest facilities—powered by stable urban grids—and in last-mile logistics within city boundaries can substantially curb food losses, boosting effective yield and advancing self-sufficiency. Although surveys in Guangdong document preliminary gains in loss reduction through improved storage [104,109], a systematic study of how urban agricultural systems uniquely leverage these advantages is needed to inform scalable policy and practice.
5. Conclusions
By operationalizing an 85% urbanization threshold to distinguish urban from non-urban agricultural contexts, this study offers a robust proxy framework for quantifying urban agriculture. It addresses the common lack of direct urban-farm statistics. Our province-wide spatial–temporal analysis across 21 prefecture-level cities reveals pronounced heterogeneity in self-sufficiency patterns: high-degree urbanized cities exhibit persistent deficits in staples, underscoring the inverse relationship between urban density and staple-crop resilience. Conversely, urban cores demonstrate comparable or even higher self-sufficiency ratios in high-value horticultural products, highlighting the niche advantage of urban and peri-urban agriculture in delivering fresh vegetables and fruits where demand is concentrated.
These findings support targeted policy interventions, such as farmland titling reform to secure land tenure, integration of “storing food in the land” and “storing food in the technology” strategies, and incentives for controlled-environment agriculture and rooftop farms, to safeguard arable land, optimize input use, and boost production in land-constrained cores. Moreover, strengthening logistics and cold-chain networks between high-surplus peripheral zones and urban markets can further shorten supply chains, reduce losses, and enhance food system resilience to future crises.
Overall, this study not only deepens understanding of urban agriculture’s contribution to municipal food security in Guangdong but also provides a replicable methodological and analytical framework for other rapidly urbanizing megaregions seeking to integrate local food production into urban planning and emergency response strategies. Future research should focus on deploying digital monitoring, precise agronomic management, and cross-sector partnerships to further optimize urban food networks under evolving climate, demographic, and public health uncertainties.
Statement of the Use of Generative AI and AI-Assisted Technologies in the Writing Process
The conceptualization, analysis, and original drafting of this manuscript were conducted entirely by the authors. In the subsequent editing phase, Chat GPT was employed solely to assist with checking for grammatical errors and consistency in terminology. All outputs generated by the AI were critically evaluated and integrated by the authors, who assume complete responsibility for the final work.
Author Contributions
Conceptualization, S.W.; methodology, S.W.; software, S.W.; validation, X.L.; formal analysis, S.W. and X.L.; investigation, S.W. and Y.Z.; resources, S.W. and J.Z.; data curation, Y.Z.; writing—original draft preparation, S.W. and X.L.; writing—review and editing, Y.Z. and J.Z.; visualization, X.L.; supervision, S.W.; project administration, X.L.; funding acquisition, S.W. and J.Z. All authors have read and agreed to the published version of the manuscript.
Ethics Statement
Not applicable.
Informed Consent Statement
Not applicable.
Data Availability Statement
The raw data supporting the conclusions of this article will be made available by the corresponding author on request due to specific reason or restrictions.
Funding
Jinan University Enterprise Development Research Institute 2023 Annual Research Project (QF20230902); Guangdong Province College Students’ Innovation and Entrepreneurship Training Program Supported Project (S202410559033); Special Funds for Cultivation of Guangdong College Students’ Scientific and Technological Innovation (“Climbing Program” Special Funds).
Declaration of Competing Interest
The authors declare that they have no known competing financial interests or personal relationships that could have appeared to influence the work reported in this paper.
References
- Deconinck K, Avery E, Jackson LA. Food Supply Chains and COVID-19: Impacts and Policy Lessons. Eurochoices 2020, 19, 34–39. [Google Scholar]
- Singh S, Kumar R, Panchal R, Tiwari MK. Impact of COVID-19 on logistics systems and disruptions in food supply chain. Int. J. Prod. Res. 2021, 59, 1993–2008. [Google Scholar]
- Chari F, Muzinda O, Novukela C, Ngcamu BS. Pandemic outbreaks and food supply chains in developing countries: A case of COVID-19 in Zimbabwe. Cogent Bus. Manag. 2022, 9, 2026188. [Google Scholar]
- Paul A, Shukla N, Trianni A. Modelling supply chain sustainability challenges in the food processing sector amid the COVID-19 outbreak. Socio-Econ. Plan. Sci. 2023, 87, 101535. [Google Scholar]
- Burgos D, Ivanov D. Food retail supply chain resilience and the COVID-19 pandemic: A digital twin-based impact analysis and improvement directions. Transp. Res. Part E-Logist. Transp. Rev. 2021, 152, 102412. [Google Scholar]
- Godrich SL, Lo J, Kent K, Macau F, Devine A. A mixed-methods study to determine the impact of COVID-19 on food security, food access and supply in regional Australia for consumers and food supply stakeholders. Nutr. J. 2022, 21, 17. [Google Scholar]
- Huss M, Brander M, Kassie M, Ehlert U, Bernauer T. Improved storage mitigates vulnerability to food-supply shocks in smallholder agriculture during the COVID-19 pandemic. Glob. Food Secur.-Agric. Policy Econ. Environ. 2021, 28, 100468. [Google Scholar]
- Zhong TY, Crush J, Si ZZ, Scott S. Emergency food supplies and food security in Wuhan and Nanjing, China, during the COVID-19 pandemic: Evidence from a field survey. Dev. Policy Rev. 2022, 40, e12575. [Google Scholar]
- Kumar R, Ganapathy L, Gokhale R, Kumar M, Tiwari MK. Managing COVID-19 food supply chain disruptions in India: A case study of public distribution system. Int. J. Logist.-Res. Appl. 2024, 1–12. https://www.tandfonline.com/doi/full/10.1080/13675567.2024.2355944 [Google Scholar]
- Khan SAR, Ponce P. Investigating the effects of the outbreak of COVID-19 on perishable food supply chains: An empirical study using PLS-SEM. Int. J. Logist. Manag. 2022, 33, 773–795. [Google Scholar]
- Sharma H, Shanker S, Barve A, Muduli K, Kumar A, Luthra S. Interval-valued intuitionistic fuzzy digraph-matrix approach with PERMAN algorithm for measuring COVID-19 impact on perishable food supply chain. Environ. Dev. Sustain. 2022, 1–40. https://link.springer.com/article/10.1007/s10668-022-02487-0 [Google Scholar]
- Zhao GQ, Vazquez-Noguerol M, Liu SF, Prado-Prado JC. Agri-food supply chain resilience strategies for preparing, responding, recovering, and adapting in relation to unexpected crisis: A cross-country comparative analysis from the COVID-19 pandemic. J. Bus. Logist. 2024, 45, e12361. [Google Scholar]
- Mahajan K, Tomar S. COVID-19 and supply chain disruption: Evidence from food markets in India. Am. J. Agric. Econ. 2021, 103, 35–52. [Google Scholar]
- Dalal J. Food donation management under supply and demand uncertainties in COVID-19: A robust optimization approach. Socio-Econ. Plan. Sci. 2022, 82, 101210. [Google Scholar]
- Nordhagen S, Igbeka U, Rowlands H, Shine RS, Heneghan E, Tench J. COVID-19 and small enterprises in the food supply chain: Early impacts and implications for longer-term food system resilience in low-and middle-income countries. World Dev. 2021, 141, 105405. [Google Scholar]
- Marino JA, Meraz K, Dhaliwal M, Payán DD, Wright T, Hahn-Holbrook J. Impact of the COVID-19 pandemic on infant feeding practices in the United States: Food insecurity, supply shortages and deleterious formula-feeding practices. Matern. Child Nutr. 2023, 19, e13498. [Google Scholar]
- Sinclair JMS, Nyarugwe S, Jack L. Food fraud and mitigating strategies of UK food supply chain during COVID-19. Food Control 2023, 148, 109670. [Google Scholar]
- Sharma D, Singh A, Kumar A, Mani V, Venkatesh VG. Reconfiguration of food grain supply network amidst COVID-19 outbreak: An emerging economy perspective. Ann. Oper. Res. 2024, 335, 1177–1207. [Google Scholar]
- Kumar P, Singh RK. Strategic framework for developing resilience in Agri-Food Supply Chains during COVID 19 pandemic. Int. J. Logist.-Res. Appl. 2022, 25, 1401–1424. [Google Scholar]
- Joshi S, Sharma M. Digital technologies (DT) adoption in agri-food supply chains amidst COVID-19: An approach towards food security concerns in developing countries. J. Glob. Oper. Strateg. Sourc. 2022, 15, 262–282. [Google Scholar]
- Marusak A, Sadeghiamirshahidi N, Krejci CC, Mittal A, Beckwith S, Cantu J, et al. Resilient regional food supply chains and rethinking the way forward: Key takeaways from the COVID-19 pandemic. Agric. Syst. 2021, 190, 103101. [Google Scholar]
- Alabi MO, Ngwenyama O. Food security and disruptions of the global food supply chains during COVID-19: Building smarter food supply chains for post COVID-19 era. Br. Food J. 2023, 125, 167–185. [Google Scholar]
- Sharma M, Joshi S, Luthra S, Kumar A. Managing disruptions and risks amidst COVID-19 outbreaks: Role of blockchain technology in developing resilient food supply chains. Oper. Manag. Res. 2022, 15, 268–281. [Google Scholar]
- Kazancoglu Y, Sezer MD, Ozbiltekin-Pala M, Lafçi C, Sarma PRS. Evaluating resilience in food supply chains during COVID-19. Int. J. Logist.-Res. Appl. 2024, 27, 688–704. [Google Scholar]
- Thulasiraman V, Nandagopal MSG, Kothakota A. Need for a balance between short food supply chains and integrated food processing sectors: COVID-19 takeaways from India. J. Food Sci. Technol. Mysore 2021, 58, 3667–3675. [Google Scholar]
- Vilalta-Perdomo E, Salinas-Navarro DE, Michel-Villarreal R, Bustamante RG. Digitalization of the Logistics Process in Short Food Supply Chains. An online Viable System Model application during the COVID-19 pandemic. Syst. Pract. Action Res. 2023, 36, 509–534. [Google Scholar]
- Benedek Z, Báráth L, Ferto I, Merino-Gaibor E, Molnár A, Orban É, et al. Survival strategies of producers involved in short food supply chains following the outbreak of COVID-19 pandemic: A Hungarian case-study. Sociol. Rural. 2022, 62, 68–90. [Google Scholar]
- Hobbs JE. Food supply chains during the COVID-19 pandemic. Can. J. Agric. Econ. 2020, 68, 171–176. [Google Scholar]
- Anderson JD, Mitchell JL, Maples JG. Invited review: Lessons from the COVID-19 pandemic for food supply chains. Appl. Anim. Sci. 2021, 37, 738–747. [Google Scholar]
- Mok HF, Williamson VG, Grove JR, Burry K, Barker SF, Hamilton AJ. Strawberry fields forever? Urban agriculture in developed countries: A review. Agron. Sustain. Dev. 2014, 34, 21–43. [Google Scholar]
- Langemeyer J, Madrid-Lopez C, Beltran AM, Mendez GV. Urban agriculture—A necessary pathway towards urban resilience and global sustainability? Landsc. Urban Plan. 2021, 210, 104055. [Google Scholar]
- Liu Y, Zhou Y. Reflections on China’s food security and land use policy under rapid urbanization. Land Use Policy 2021, 109, 105699. [Google Scholar]
- Krugman PR. Geography and Trade; MIT Press: Cambridge, MA, USA, 1991. [Google Scholar]
- Glaeser EL. (Ed.) Agglomeration Economics; NBER Conference Report No. 138; University of Chicago Press: Chicago, IL, USA, 2010. [Google Scholar]
- Goodarzian F, Taleizadeh AA, Ghasemi P, Abraham A. An integrated sustainable medical supply chain network during COVID-19. Eng. Appl. Artif. Intell. 2021, 100, 104188. [Google Scholar]
- Grewal SS, Grewal PS. Can cities become self-reliant in food? Cities 2012, 29, 1–11. [Google Scholar]
- Mougeot LJA. (Ed.) Agropolis: The Social 2012, Political and Environmental Dimensions of Urban Agriculture; Earthscan/IDRC: Ottawa, ON, Canada, 2005. [Google Scholar]
- Pearson LJ, Pearson CJ, Pearson L. Sustainable urban agriculture: Stocktake and opportunities. Int. J. Agric. Sustain. 2010, 8, 7–19. [Google Scholar]
- Jarosz L. The city in the country: Growing alternative food networks in Metropolitan areas. J. Rural Stud. 2008, 24, 231–244. [Google Scholar]
- Tscharntke T, Klein AM, Kruess A, Steffan-Dewenter I, Thies C. Landscape perspectives on agricultural intensification and biodiversity: Ecosystem service management. Ecol. Lett. 2005, 8, 857–874. [Google Scholar]
- Altieri MA, Companioni N, Cañizares K, Murphy C, Rosset P, Bourque M, et al. The greening of the “barrios”: Urban agriculture for food security in Cuba. Agric. Hum. Values 1999, 16, 131–140. [Google Scholar]
- Food and Agriculture Organization of the United Nations. The Urban Producer’s Resource Book: A Practical Guide for Working with Low-Income Urban and Peri-Urban Producers’ Organizations; FAO: Rome, Italy, 2007. [Google Scholar]
- Armar-Klemesu M. Urban Livelihoods and Food and Nutrition Security in Greater Accra, Ghana; IFPRI Research Report 112; International Food Policy Research Institute: Washington, DC, USA, 2000. [Google Scholar]
- Clapp J. Food self-sufficiency: Making sense of it, and when it makes sense. Food Policy 2017, 66, 88–96. [Google Scholar]
- Sun Y, Xu C, Zhang H, Wang Z. Migration in response to climate change and its impact in China. Int. J. Clim. Change Strateg. Manag. 2017, 9, 352–373. [Google Scholar]
- Chen A, Groenewold N. Reducing regional disparities in China: An evaluation of alternative policies. J. Comp. Econ. 2010, 38, 189–198. [Google Scholar]
- Yu W, Elleby C, Zobbe H. Food security policies in India and China: Implications for national and global food security. Food Secur. 2015, 7, 405–414. [Google Scholar]
- Zhang Y, Lu S. Food politics in China: How strengthened accountability enhances food security. Food Policy 2024, 128, 102692. [Google Scholar]
- Liu G, Wang H, Cheng Y, Zheng B, Lu Z. The impact of rural out-migration on arable land use intensity: Evidence from mountain areas in Guangdong, China. Land Use Policy 2016, 59, 569–579. [Google Scholar]
- Zhang P, Zhou Y, Xie Y, Wang Y, Yang Z, Cai Y. Spatial transmission mechanism of the water, energy and food nexus risks for the Guangdong-Hong Kong-Macao region of China. J. Clean. Prod. 2023, 405, 136906. [Google Scholar]
- Yang H, Zou R, Hu Y, Wang L, Xie Y, Tan Z, et al. Sustainable utilization of cultivated land resources based on “element coupling-function synergy” analytical framework: A case study of Guangdong, China. Land Use Policy 2024, 146, 107316. [Google Scholar]
- Fang W, Yang Z, Liu Z, Hatab AA. Green recovery of cropland carrying capacity in developed regions: Empirical evidence from Guangdong, China. Econ. Change Restruct. 2023, 56, 2405–2436. [Google Scholar]
- Mutelo AM, Zhen C, Wei S, Hamukwaya SL. High-standard farmland destruction monitoring by high-resolution remote sensing methods: A 2017–2018 case study of Hebei and Guangdong, China. Environ. Monit. Assess. 2023, 195, 742. [Google Scholar]
- Fan S, Brzeska J. Feeding more people on an increasingly fragile planet: China’s food and nutrition security in a national and global context. J. Integr. Agric. 2014, 13, 1193–1205. [Google Scholar]
- Yu X, Schweikert K, Li Y, Ma J, Doluschitz R. Farm size, farmers’ perceptions and chemical fertilizer overuse in grain production: Evidence from maize farmers in northern China. J. Environ. Manag. 2023, 325, 116347. [Google Scholar]
- Niu Y, Xie G, Xiao Y, Liu J, Zou H, Qin K, et al. The story of grain self-sufficiency: China’s food security and food for thought. Food Energy Secur. 2022, 11, e344. [Google Scholar]
- Xiao Y, Cheng SK, Xie GD, Liu AM, Lu CX, Wang YY, et al. The balance between supply and consumption of the main types of grain in China. J. Nat. Resour. 2017, 32, 927–936. (In Chinese) [Google Scholar]
- Wu WH. Research Report on Cherishing Food and Opposing Waste by the Special Investigation Team of the Standing Committee of the National People’s Congress. In Proceedings of the 24th Meeting of the 13th Standing Committee of the National People’s Congress, Beijing, China, 20–24 December 2020. [Google Scholar]
- Meng ZD, Li GX. Analysis of the Evolution of the Spatiotemporal Pattern of China’s Grain Production and Demand Balance-From the Perspective of Grain Use and Provincial Level. Agric. Mod. Res. 2020, 41, 928–936. [Google Scholar]
- Li C. China Must Have Control over Its Own Food Supply. 2022. Available online: http://en.cppcc.gov.cn/2022-07/08/c_788500.htm (accessed on 10 March 2025). [Google Scholar]
- Xiao Y, Zhao J, Zhang Y, Wang S. Grain Self-Sufficiency in Guangdong, China: Current Trends and Future Perspectives. Foods 2025, 14, 1126. [Google Scholar]
- Zhu Z, Chan FKS, Li G, Xu M, Feng M, Zhu YG. Implementing urban agriculture as nature-based solutions in China: Challenges and global lessons. Soil Environ. Health 2024, 2, 100063. [Google Scholar]
- Wang LY, Anna H, Zhang LY, Xiao Y, Wang YQ, Xiao Y, et al. Spatial and Temporal Changes of Arable Land Driven by Urbanization and Ecological Restoration in China. Chin. Geogr. Sci. 2019, 29, 809–819. [Google Scholar]
- Huang X, Xia JH, Xiao R, He T. Urban expansion patterns of 291 Chinese cities 2019, 1990–2015. Int. J. Digit. Earth 2019, 12, 62–77. [Google Scholar]
- Wu XR, Zhao N, Wang YW, Zhang LQ, Wang W, Liu YS. Cropland non-agriculturalization caused by the expansion of built-up areas in China during 1990–2020. Land Use Policy 2024, 146, 107312. [Google Scholar]
- Cao Y, Zhang XL, Zhang XK, Li H. The incremental construction land differentiated management framework:The perspective of land quota trading in China. Land Use Policy 2020, 96, 104675. [Google Scholar]
- Chen GQ, Han MY. Virtual land use change in China 2002–2010: Internal transition and trade imbalance. Land Use Policy 2015, 47, 55–65. [Google Scholar]
- Wu S, Wang D. Storing Grain in the Land:The Gestation 2015, Delineation Framework, and Case of the Two Zones Policy in China. Land 2023, 12, 806. [Google Scholar]
- Shi P, Feng ZH, Gao HD, Li P, Zhang XM, Zhu TT, et al. Has “Grain for Green” threaten food security on the Loess Plateau of China? Ecosyst. Health Sustain. 2020, 6, 1709560. [Google Scholar]
- Dong Y, Ren Z, Fu Y, Yang R, Sun H, He X. Land use/cover change and its policy implications in typical agriculture-forest ecotone of central Jilin Province 2020, China. Chin. Geogr. Sci. 2021, 31, 261–275. [Google Scholar]
- Department of Natural Resources of Guangdong Province. (2024-02-27). Preserving Cultivated Land and Safeguarding the Red Line to Strengthen the Foundation of Grain Production. Available online: https://nr.gd.gov.cn/ztzlnew/dzhdflzjs/content/post_4382011.html (accessed on 5 May 2025). [Google Scholar]
- Sun CZ, Hao S. Research on the competitive and synergistic evolution of the water-energy-food system in China. J. Clean. Prod. 2022, 365, 132743. [Google Scholar]
- Li XL, Wu KN, Yang QJ, Hao SH, Feng Z, Ma JL. Quantitative assessment of cultivated land use intensity in Heilongjiang Province 2022, China, 2001–2015. Land Use Policy 2023, 125, 106505. [Google Scholar]
- Xu DD, Liu Y, Li YC, Liu SQ, Liu GH. Effect of farmland scale on agricultural green production technology adoption:Evidence from rice farmers in Jiangsu Province, China. Land Use Policy 2024, 147, 107381. [Google Scholar]
- Dietze V, Alhashemi A, Feindt PH. Controlled-environment agriculture for an urbanised world? A comparative analysis of the innovation systems in London 2024, Nairobi and Singapore. Food Secur. 2024, 16, 371–396. [Google Scholar]
- Marvin S, Rickards L, Rutherford J. The urbanisation of controlled environment agriculture: Why does it matter for urban studies? Urban Stud. 2024, 61, 1430–1450. [Google Scholar]
- Casey L, Freeman B, Francis K, Brychkova G, McKeown P, Spillane C, et al. Comparative environmental footprints of lettuce supplied by hydroponic controlled-environment agriculture and field-based supply chains. J. Clean. Prod. 2022, 369, 133214. [Google Scholar]
- Engler N, Krarti M. Review of energy efficiency in controlled environment agriculture. Renew. Sustain. Energy Rev. 2021, 141, 110786. [Google Scholar]
- Goodman W, Minner J. Will the urban agricultural revolution be vertical and soilless? A case study of controlled environment agriculture in New York City. Land Use Policy 2019, 83, 160–173. [Google Scholar]
- Stanghellini C, Katzin D. The dark side of lighting: A critical analysis of vertical farms’environmental impact. J. Clean. Prod. 2024, 458, 142359. [Google Scholar]
- Srinivasan K, Yadav VK. An integrated literature review on Urban and peri-urban farming:Exploring research themes and future directions. Sustain. Cities Soc. 2023, 99, 104878. [Google Scholar]
- Sandison F, Yeluripati J, Stewart D. Does green vertical farming offer a sustainable alternative to conventional methods of production? A case study from Scotland. Food Energy Secur. 2023, 12, 107381. [Google Scholar]
- Debolini M, Valette E, François M, Chéry JP. Mapping land use competition in the rural-urban fringe and future perspectives on land policies: A case study of Meknes (Morocco). Land Use Policy 2015, 47, 373–381. [Google Scholar]
- Liu L, Liu K. Can digital technology promote sustainable agriculture? Empirical evidence from urban China. Cogent Food Agric. 2023, 9, 2282234. [Google Scholar]
- Gill SS, Chana I, Buyya R. IoT based agriculture as a cloud and big data service: The beginning of digital India. J. Organ. End User Comput. 2017, 29, 1–23. [Google Scholar]
- FAO. Digital Technologies in Agriculture and Rural Areas; Food and Agriculture Organization of the United Nations: Rome, Italy, 2019. [Google Scholar]
- Rotz S, Duncan E, Small M, Botschner J, Dara R, Mosby I, et al. The Politics of Digital Agricultural Technologies: A Preliminary Review. Sociol. Rural. 2019, 59, 203–229. [Google Scholar]
- Benke K, Tomkins B. Future food-production systems:Vertical farming and controlled-environment agriculture. Sustain. Sci. Pract. Policy 2017, 13, 13–26. [Google Scholar]
- Cheng J, Chen M, Tang S. Shenzhen–A typical benchmark of Chinese rapid urbanization miracle. Cities 2023, 140, 104421. [Google Scholar]
- Pan Y, Ma L, Wang Y. How and what kind of cities benefit from the development of digital inclusive finance? Evidence from the upgrading of export in Chinese cities. Econ. Res. Ekon. Istraživanja 2022, 35, 3979–4007. [Google Scholar]
- Fan L, Ge Y, Niu H. Effects of agricultural extension system on promoting conservation agriculture in Shaanxi Plain, China. J. Clean. Prod. 2022, 380, 134896. [Google Scholar]
- Lin Y, Hu R, Zhang C, Chen K. Effect of agricultural extension services in the post-reform era since the mid-2000s on pesticide use in China: Evidence from rice production. Int. J. Agric. Sustain. 2022, 20, 955–966. [Google Scholar]
- Jin S, Huang J, Hu R, Rozelle S. The creation and spread of technology and total factor productivity in China’s agriculture. Am. J. Agric. Econ. 2002, 84, 916–930. [Google Scholar]
- Huang J, Hu R, Rozelle S. China’s agricultural research system and reforms: Challenges and implications for developing countries. Asian J. Agric. Dev. 2004, 1, 98–112. [Google Scholar]
- Yan DS, Sun W, Li PX, Liu CG, Li YJ. Effects of economic growth target on the urban-rural income gap in China: An empirical study based on the urban bias theory. Cities 2025, 156, 105518. [Google Scholar]
- Fan F, Li M, Tao R, Yang DL. Transfer-based decentralisation 2025, economic growth and spatial inequality: Evidence from China’s 2002–2003 tax sharing reform. Urban Stud. 2020, 57, 806–826. [Google Scholar]
- Liu ZX, Zhong H, Zhen DY. The impact of tax competition on urban-rural income gap: A local governance perspective. Appl. Econ. 2024, 56, 8802–8819. [Google Scholar]
- He L, Zhang XL. The distribution effect of urbanization: Theoretical deduction and evidence from China. Habitat Int. 2022, 123, 102544. [Google Scholar]
- Camacho-Caballero D, Langemeyer J, Segura-Barrero R, Ventura S, Beltran AM, Villalba G. Assessing Nature-based solutions in the face of urban vulnerabilities: A multi-criteria decision approach. Sustain. Cities Soc. 2024, 103, 105257. [Google Scholar]
- Chen S, Chen H, Yang RJ, Ye YM. Linking social-ecological management and ecosystem service bundles: Lessons from a peri-urban agriculture landscape. Land Use Policy 2023, 131, 106697. [Google Scholar]
- Yang Y, Zhang YY, Yang H, Yang FY. Horizontal ecological compensation as a tool for sustainable development of urban agglomerations: Exploration of the realization mechanism of Guanzhong Plain urban agglomeration in China. Environ. Sci. Policy 2022, 137, 301–313. [Google Scholar]
- Evans DL, Falagán N, Hardman CA, Kourmpetli S, Liu L, Mead BR, et al. Ecosystem service delivery by urban agriculture and green infrastructure-a systematic review. Ecosyst. Serv. 2022, 54, 101405. [Google Scholar]
- Xu Y, Zhu SJ. Transport Infrastructure, Intra-Regional Inequality and Urban-Rural Divide: Evidence from China’s High-Speed Rail Construction. Int. Reg. Sci. Rev. 2024, 47, 378–406. [Google Scholar]
- Yang D, Liu XJ, Hao XP, Li JK. Tracing environmental impacts of grain losses along the supply chain in the North China Plain: An integrated framework. Resour. Conserv. Recycl. 2023, 189, 106771. [Google Scholar]
- Shafiee-Jood M, Cai X. Reducing food loss and waste to enhance food security and environmental sustainability. Environ. Sci. Technol. 2016, 50, 8432–8443. [Google Scholar]
- Luo Y, Huang D, Wu LP. On-farm post-harvest loss and loss reduction methods: Evidence from China. Int. J. Agric. Sustain. 2022, 20, 1322–1332. [Google Scholar]
- Xu WP, Gong SH, Wang NS, Zhao WB, Yin HL, Yang RG, et al. Temperature reduction and energy-saving analysis in grain storage: Field application of radiative cooling technology to grain storage warehouse. Renew. Energy 2023, 218, 119272. [Google Scholar]
- Lu HY, Zhao PJ, Hu HY, Zeng LG, Wu KS, Lv D. Transport infrastructure and urban-rural income disparity: A municipal-level analysis in China. J. Transp. Geogr. 2022, 99, 103292. [Google Scholar]
- Luo Y, Huang D, Li DY, Wu LP. On farm storage, storage losses and the effects of loss reduction in China. Resour. Conserv. Recycl. 2020, 162, 105062. [Google Scholar]