Turbulent Characteristics in an Egg-Shaped Orifice Fishway and a Comparison with a Rectangular Orifice

Turbulent Characteristics in an Egg-Shaped Orifice Fishway and a Comparison with a Rectangular Orifice
Zhiyong Dong
1,*
 Long Cheng
1
Zhiping Guo
2,*
Zhou Huang
3
Long Cheng
1
Zhiping Guo
2,*
Zhou Huang
3
Received: 10 July 2025 Revised: 19 August 2025 Accepted: 10 November 2025 Published: 18 November 2025

© 2025 The authors. This is an open access article under the Creative Commons Attribution 4.0 International License (https://creativecommons.org/licenses/by/4.0/).
1. Introduction
Hydraulic structures, such as sluices and dams in rivers, affect the natural habitat environment of fish species, especially hindering migratory fish spawning, feeding, and overwintering [1]. In general, a fishway is arranged in hydraulic structures to provide a passageway for migratory fish and to maintain biological diversity. As indicated by the investigated data, the built operation fishways that allow fish to swim through smoothly are much lower than anticipated [2]. Based on the monitoring data of Atlantic salmon migration over 30 years, Parrish et al. [3] warned about the effectiveness of fishways. Therefore, it is of great importance for the rehabilitation of fish habitat to further study the hydraulic characteristics in fishways, especially the turbulent characteristics in fishways.
The general principle of fishways is to attract fish to a specific location in the river downstream of the obstruction to induce them to pass upstream by a waterway. Upstream passage can be provided through several types of fishways, including pool-type [4], Denil type [5] and nature-like bypass channel [6] etc. The pool-type fishways can be divided into vertical slot, overflow weir, orifice and their combined ones, which are widely used in the world. The principle of the pool-type fishway is separated into a series of pools by baffles. Flow from one pool to another can be either by overflow weir, through orifice, or through a vertical slot. Combined fishways with part of the flow through a notch, a vertical slot in combination with an orifice [7,8]. Whether the fishway flow field design is reasonable key to the fishway to exert its fish-passing effect [9,10]. A vertical slot fishway was built in the Hell’s Gate fishway of Canada [11]. Flow patterns, slot position, turbulent kinetic energy, eddy structures, and water level fluctuations in the vertical slot were studied [12,13,14]. Hydrodynamic parameters, fish passage efficiency, fish swimming behavior and fish swimming trajectories in a vertical slot fishway were estimated [9]. Li et al. investigated the effect of vertical slot width on hydraulic characteristics [12]. Zheng et al. explored the effect of the type of vertical slot guide wall on flow fields [13]. Wang et al. [15] studied the hydrodynamic characteristics in resting pools of a vertical slot fishway, focusing on the influence of vertical slot position, resting pool length and auxiliary baffle on the hydraulic characteristics of the resting pools located in the straight and turning sections. Also, Puertas et al. [16], Dong et al. [17], Cao et al. [18], Tan et al. [19] experimentally investigated flow characteristics in a vertical slot fishway. For the last few years, many researchers [20,21,22,23,24,25,26,27] utilized computational fluid dynamics to numerically simulate hydraulic characteristics in vertical slot fishway, for example, numerical simulation of the flow structures in vertical slot fishways indicated that the length-width ratio of the pool had a significant effect on flow patterns, and the effect of the central baffle was minor [21]. Numerical results for a 90° turning pool of the vertical slot fishway showed that the main stream zone was located in the middle of the 90° turning pool after the installation of the rectifier plate [25]. A great deal of research work has been done on vertical slot fishways. Recently, Sun et al. summarized the theory and method of hydraulic design in a vertical slot fishway [28]. For fish preference for jumping or swimming in the surface layer, the flat-crested or notched overflow weir fishway is widely used for the swimming behavior of fish [29]. For orifice fishways, the conventional orifice shape is rectangular or circular. The flow characteristics are characterized by three-dimensional submerged jets [30,31]. The turbulent structures in rectangular central and bottom orifices of the fishway of the tidal sluice complex were experimentally studied [32]. Despite extensive research on vertical slots, overflow weirs and rectangular orifice fishways, little is known about egg-shaped orifice fishways. It was found that the morphology of most anadromous fish species is characterized by egg-shaped aspects. A conceptual egg-shaped orifice fishway was developed [33].
In the past, the study of fishways focused on one-dimensional flow characteristics. Actually, fish species live in a three-dimensional space, being able to sense changes in the flow field, relative position and tail-beat phase difference with their neighbors using both vision and the lateral-line system [34]. The studies on the effects of turbulence on fish behavior, energy, and distribution indicated that fish benefit from turbulence; for example, adult rainbow salmon benefited from vortex energy when swimming in Karman vortex street behind an obstacle [35]. The similar experimental results indicated fish could benefit from vortex [36,37,38]. Fish swimming behavior involves complex fluid-structure interactions, Mi et al. [39] used CFD OpenFOAM to simulate circular swimming behaviors of fish within offshore aquaculture environments. The simulated results highlight that circular swimming generated distinct vortex structures, enhancing water mixing and significantly improving oxygen distribution in regions of poor circulation. To investigate the hydrodynamic performance of double manta rays swimming in a staggered formation with different combinations of vertical and streamwise spacing, a three-dimensional computational model and kinematic equations of manta rays were established based on biological observations [40], showing that the streamwise spacing was the main factor affecting the propulsive performance of manta rays in staggered groups. Pan et al. [41] numerically investigated the hydrodynamics interactions between a pair of 3D fish-like bodies arranged in both in-line and side-by-side configurations. The morphology and kinematics of fish-like bodies were modeled on a live rainbow trout observed during steady swimming in the laboratory. The findings indicated that the hydrodynamic performance of individual fish in both arrangements was influenced by their spatial separation when in close proximity as well as by the relative phase difference between the two fish. In the case of in-phase in-line schools, the leading fish experienced a 5.3% increase in propulsive efficiency. Fish behavior is strongly influenced by hydrodynamics, but little is known about the relation between hydraulics and fish fine-scale movement. Silva et al. [42] combined computational fluid dynamics modeling with 2D and 3D fish positioning to investigate the relation between hydrodynamics and the downstream movement of Atlantic salmon smolts, which showed fish used fine-scale flow velocity and turbulence as navigation cues of fine-scale movement behavior. Padgett et al. [43] modeled the swimming performance of elvers using cellular automata (CA) and individual-based models. A computational fluid dynamics model was used to compute three-dimensional flow fields for eel passes at five different installation angles and three inflow discharges. CA and individual-based models were employed to assess upstream passage efficiency for a range of elver sizes. In this paper, the turbulence characteristics in an egg-shaped orifice fishway were experimentally investigated and analyzed, and a comparison was made with a rectangular orifice fishway of the same aspect ratio.
2. Materials and Methodology
2.1. Experimental Facility
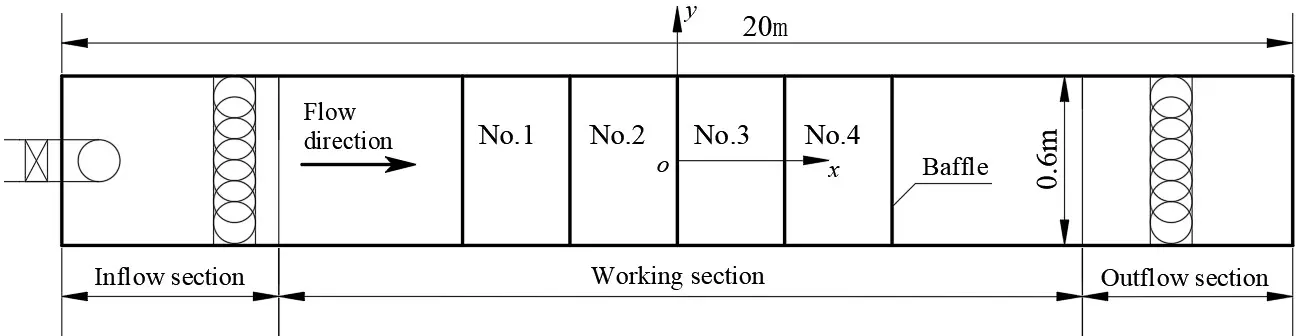
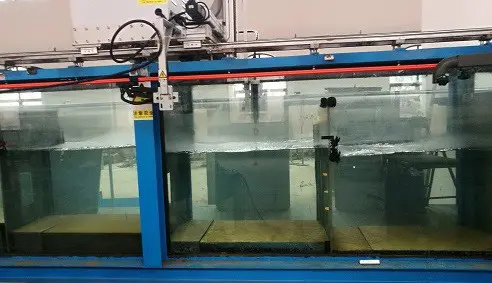
The experimental study was carried out in a large scale fishway flume. The fishway flume consisted of inflow, working and outflow sections as shown in Figure 1. The flume is 20 m long, 60 cm wide and 100 cm deep. The baffle spacing L = 180 cm. Flow rate was measured using a tail rectangular weir in the flume, and water level by the Sinfo Tek automatic water level measuring system. Three-dimensional velocity at each measuring point was measured with SonTek16MHz Micro acoustic Doppler velocimeter (ADV, SonTek, San Diego, CA, USA) carried by a Sinfo Tek acoustic topographic automatic measuring system, as shown in Figure 1b, which consisted of a 3D down-looking probe, a 3D side-looking probe, a processor, a computer and a data acquisition system. The sampling frequency of 25 Hz and the sampling duration of 60 s were selected based on a comparison with the durations of 30 s and 90 s. The control volume at each point was 0.09 cm3, the signal to noise ratio SNR ≥ 15 dB, and the correlation approached 90%. Three replicate instantaneous velocities were realtimely acquired, and then an average of three measurements was taken. If the correlation of the acquired data was lower than 80% or the data variability occurred, the supplementary measurement was added. The positioning accuracy is less than 1 mm, the distance of the probe from the sampling point is 5 cm, and the measurement accuracy of velocity is 1%. Measuring velocity range is 0.03–2.5 m/s. For the egg-shaped orifice at Q = 24 L/s, Reynolds number of the orifice in terms of hydraulic radius Re = 36,218 > 580, it belongs to turbulent flow, and Froude number of the pool Fr = 0.038 < 1, it belongs to subcritical flow; also, for the egg-shaped orifice at Q = 32 L/s, Re = 48,230, Fr = 0.047; for the rectangular orifice at Q = 37 L/s, Re = 46,080, Fr = 0.053.
 |
|
(a) |
 |
|
(b) |
Figure 1. Fishway flume. (a) Plan view of fishway flume; (b) Experimental setup of fishway flume.
2.2. Materials and Methods
The inflow and outflow sections were fabricated by a steel plate; the working section mainly contained 4 pools, which exhibited a stepped layout from the lower pool to the upper one, and a drop between the neighboring pools was 5 cm. Both sides of the flume were installed with toughened glass and the baffles with a polyethylene plate. The orifice shape is egg-shaped, consisting of an upper semi-circle and a lower semi-ellipse as shown in Figure 2a. The egg-shaped orifice is located in the centerline of the baffle, the long axis of the orifice l = 24 cm, and the short axis d = 16 cm; the long semi-axis of the lower semi-ellipse a = 16 cm, and the short semi-axis b = 8 cm, with the aspect ratio e = d/l = 0.67. The coordinates of the flume are shown in Figure 2b, the origin located at the central point of the baffle bottom, the flow direction refers to the x-axis, the transverse to the y-axis, and the vertical to the z-axis. The experimental arrangements: based on three typical flow rates Q = 24, 32 and 37 L/s, different horizontal planes z = 49.5, 45.5, 41.5, 37.5, 33.5, 29.5, 25.5, 21.5, 17.5 and 13.5 cm were measured at each flow rate, different cross-sections x = 10, 15, 20, 30, 50, 70, 90, 110, 130, 150, 160, 165, 170 and 175 cm were laid on each horizontal plane, and different measuring points y = −20, −12, −8, −4, 0, 4, 8, 12 and 20 cm were arranged at each cross-section.
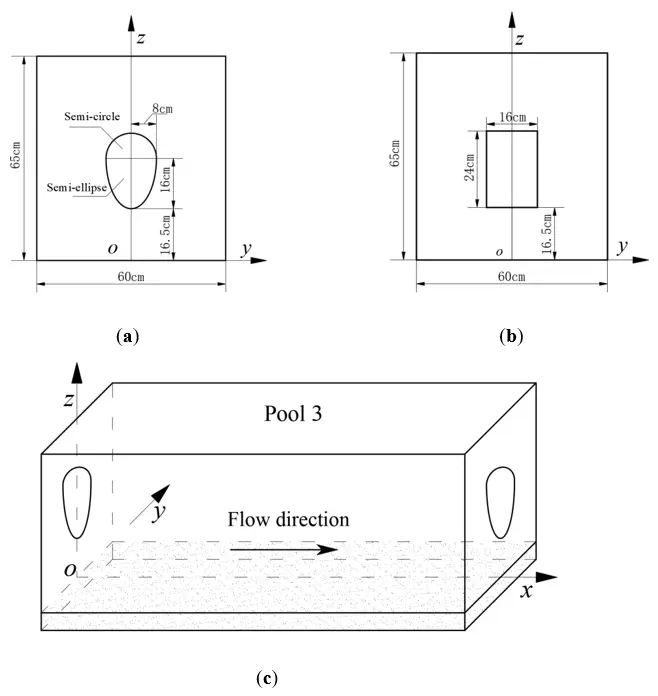
Figure 2. Egg-shaped orifice and coordinate system. (a) Egg-shaped orifice; (b) Rectangular orifice; (c) Coordinates definition of flume (The pool is 180 cm long, 60 cm wide and 100 cm deep).
3. Results and Discussion
3.1. Velocity Vector
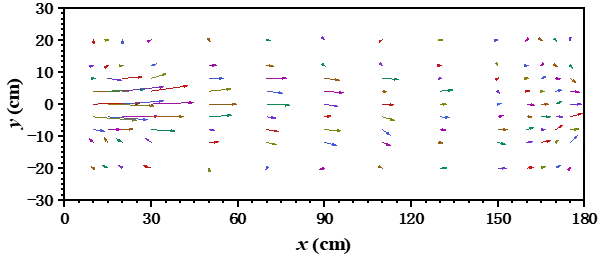
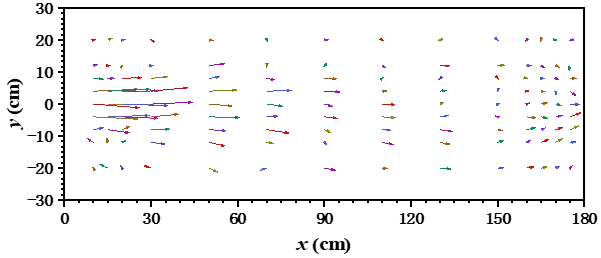
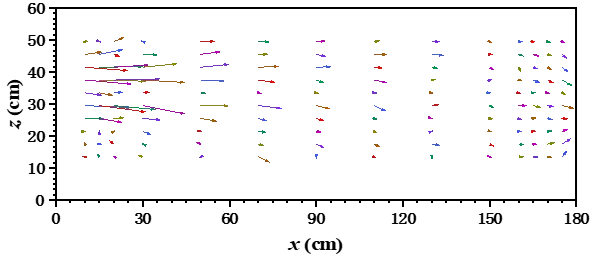
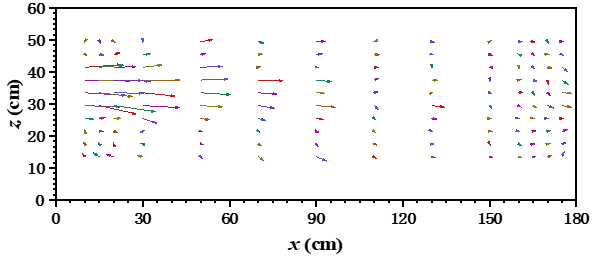
Velocity vectors on different horizontal planes and longitudinal profiles of egg-shaped orifice fishway pool are shown in Figure 3 and Figure 4. It follows from the figures that jet issuing from an egg-shaped orifice diffuses in the pool, expanding to both sides on the horizontal planes and up and down on the longitudinal profiles, and exhibiting the convergent trend near the lower baffle. A three-dimensional turbulent jet was formed after flowing through the egg-shaped orifice, and the velocity decays along the flow direction due to entrainment and mixing of jet.
 |
|
(a) |
 |
|
(b) |
Figure 3. Velocity vector on different horizontal planes of egg-shaped orifice (The jet issues from the left end). (a) Horizontal plane at the focus of lower semi-ellipse; (b) Horizontal plane at the short axis of the lower semi-ellipse.
 |
|
(a) |
 |
|
(b) |
Figure 4. Velocity vector on different longitudinal profiles of egg-shaped orifice (The jet issues from the left end). (a) Longitudinal profile at the long axis of the lower semi-ellipse; (b) Longitudinal profile at 3b/4.
3.2. The Maximum Longitudinal Velocity
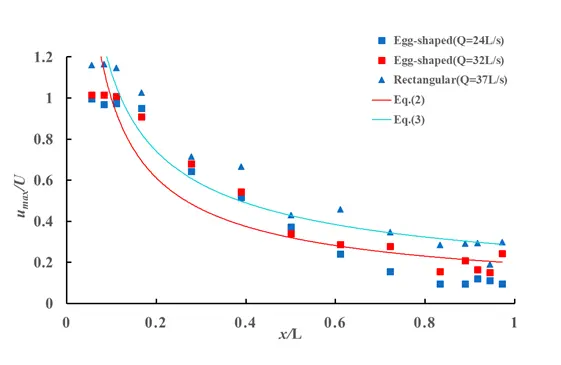
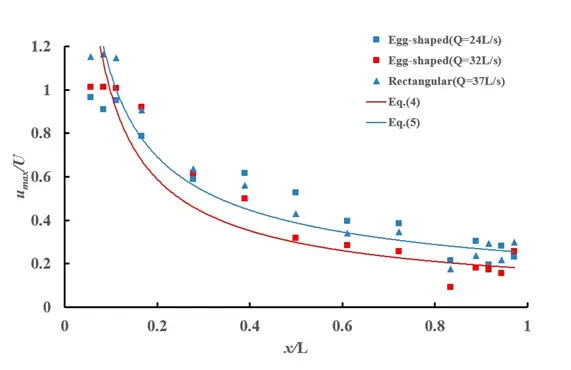
On the longitudinal profile at the long axis and horizontal plane at the short axis of egg-shaped orifice, variations in the maximum longitudinal velocity along the flow direction are shown in Figure 5, and a comparison with a rectangular orifice with the same aspect ratio (width to height ratio) is made. As can be seen from the figure, the variations of the maximum longitudinal velocity along the flow path on the horizontal plane and the longitudinal profile exhibit similarities. Under the two typical flow rates for egg-shaped orifice, all the experimental point data get together, exhibiting a better change trend and decaying along the flow direction. A comparison of variations of the maximum longitudinal velocity along flow direction on the horizontal plane and longitudinal profile between the egg-shaped orifice and the rectangular orifice showed that the decay of the maximum longitudinal velocity along flow direction for the egg-shaped orifice was faster than that for the rectangular orifice at the same water level. The maximum velocity decays faster for the egg-shaped orifice due to its bluff-body nature and the associated enhanced mixing and energy dissipation caused by more vigorous vortex generation. The complex three-dimensional jet and wake result from the egg-shaped geometry, which is created by a bluff face in the flow.
 |
|
(a) |
 |
|
(b) |
Figure 5. Variation in the maximum longitudinal velocity along flow direction for egg-shaped and rectangular orifices. (a) Variation of the maximum longitudinal velocity along flow direction on the horizontal plane (The velocity for the egg-shaped orifice decays more rapidly than that for the rectangular one); (b) Variation of the maximum longitudinal velocity along flow direction on the longitudinal profile.
For an orifice jet, the decay of longitudinal velocity typically follows a power law, which can be approximately expressed as
|
```latex\frac{{u}_{max}}{U}=A{\left(\frac{x}{L}\right)}^{\left(-n\right)}``` |
(1) |
where umax represents the maximum longitudinal velocity, U denotes the cross-sectional mean velocity at the orifice, A is the decay coefficient, and n is the decay exponent. Larger n value indicates faster velocity decay. On the horizontal plane, fitting the data in Figure 5, the decay rates of the maximum longitudinal velocity for the egg-shaped and rectangular orifices can be expressed as Equation (2) and Equation (3), respectively. The egg-shaped orifice exhibits a larger decay exponent, with its maximum longitudinal velocity decay approximately 10% faster than that of the rectangular orifice.
|
```latex\frac{{u}_{max}}{U}=0.267{\left(\frac{x}{L}\right)}^{\left(-0.528\right)}``` |
(2) |
|
```latex\frac{{u}_{max}}{U}=0.344{\left(\frac{x}{L}\right)}^{\left(-0.48\right)}``` |
(3) |
On the longitudinal profile, the decay rates for the maximum longitudinal velocity of the egg-shaped and rectangular orifices are given by Equation (4) and Equation (5), respectively. The egg-shaped orifice also shows a larger decay exponent, with its maximum longitudinal velocity decay approximately 15% faster than that of the rectangular orifice.
|
```latex\frac{{u}_{max}}{U}=0.25{\left(\frac{x}{L}\right)}^{\left(-0.55\right)}``` |
(4) |
|
```latex\frac{{u}_{max}}{U}=0.302{\left(\frac{x}{L}\right)}^{\left(-0.52\right)}``` |
(5) |
3.3. Three-Dimensional Time-Averaged Velocity
Under the typical flow rates, non-dimensional distribution of longitudinal time-averaged velocity u along the transverse for egg-shaped orifice is shown in Figure 6. It follows from the figure that the maximum velocity occurs at the long axis of the egg-shaped orifice, and gradually decreases toward the left and right non-orifice region. In the figure, the Gaussian distribution of the plane jet Equation (1), is also plotted for comparison. It is easy to see that the egg-shaped orifice jet is apparently different from the two-dimensional plane jet, which is considerably characterized by three-dimensionality. The complex three-dimensional jet results from the egg-shaped geometry, which is created by a bluff face in the flow. This profile strongly suggests the presence of two counter-rotating vortex pairs or a complex system of streamwise vortices generated at the upper and lower lips of the orifice.
|
```latex\frac{u}{U}=exp\left[-{\left(\frac{y}{B}\right)}^{2}\right]``` |
(6) |
where u denotes longitudinal time-averaged velocity, U longitudinal mean velocity at the orifice cross-section, y abscissa, B pool width.
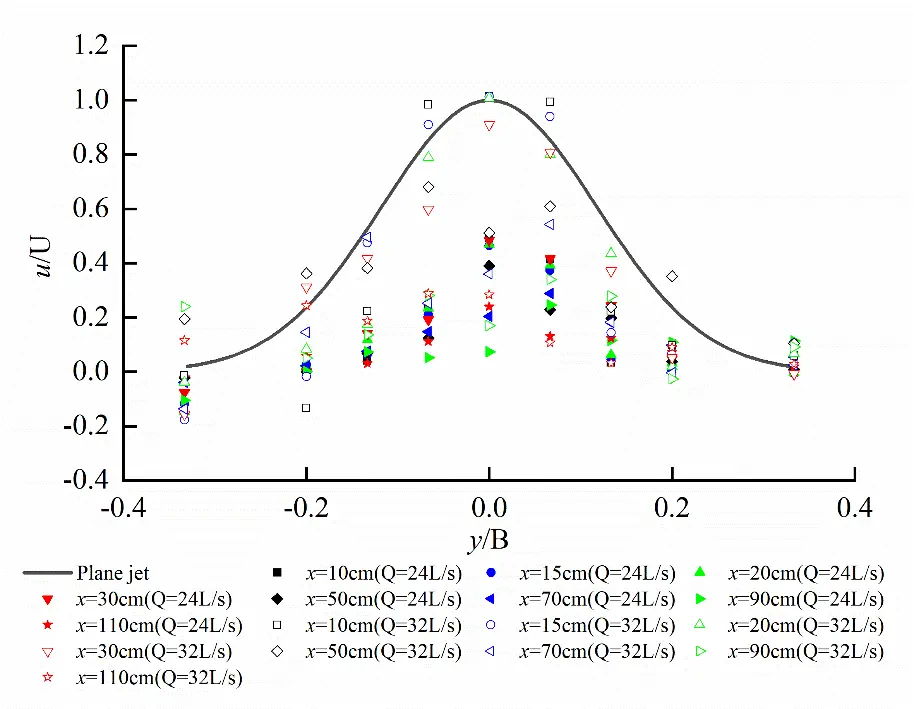
Figure 6. Transverse distribution of longitudinal velocity on the horizontal plane at the short axis of the egg-shaped orifice (It is considerably characterized by three-dimensionality, apparently different from a plane jet).
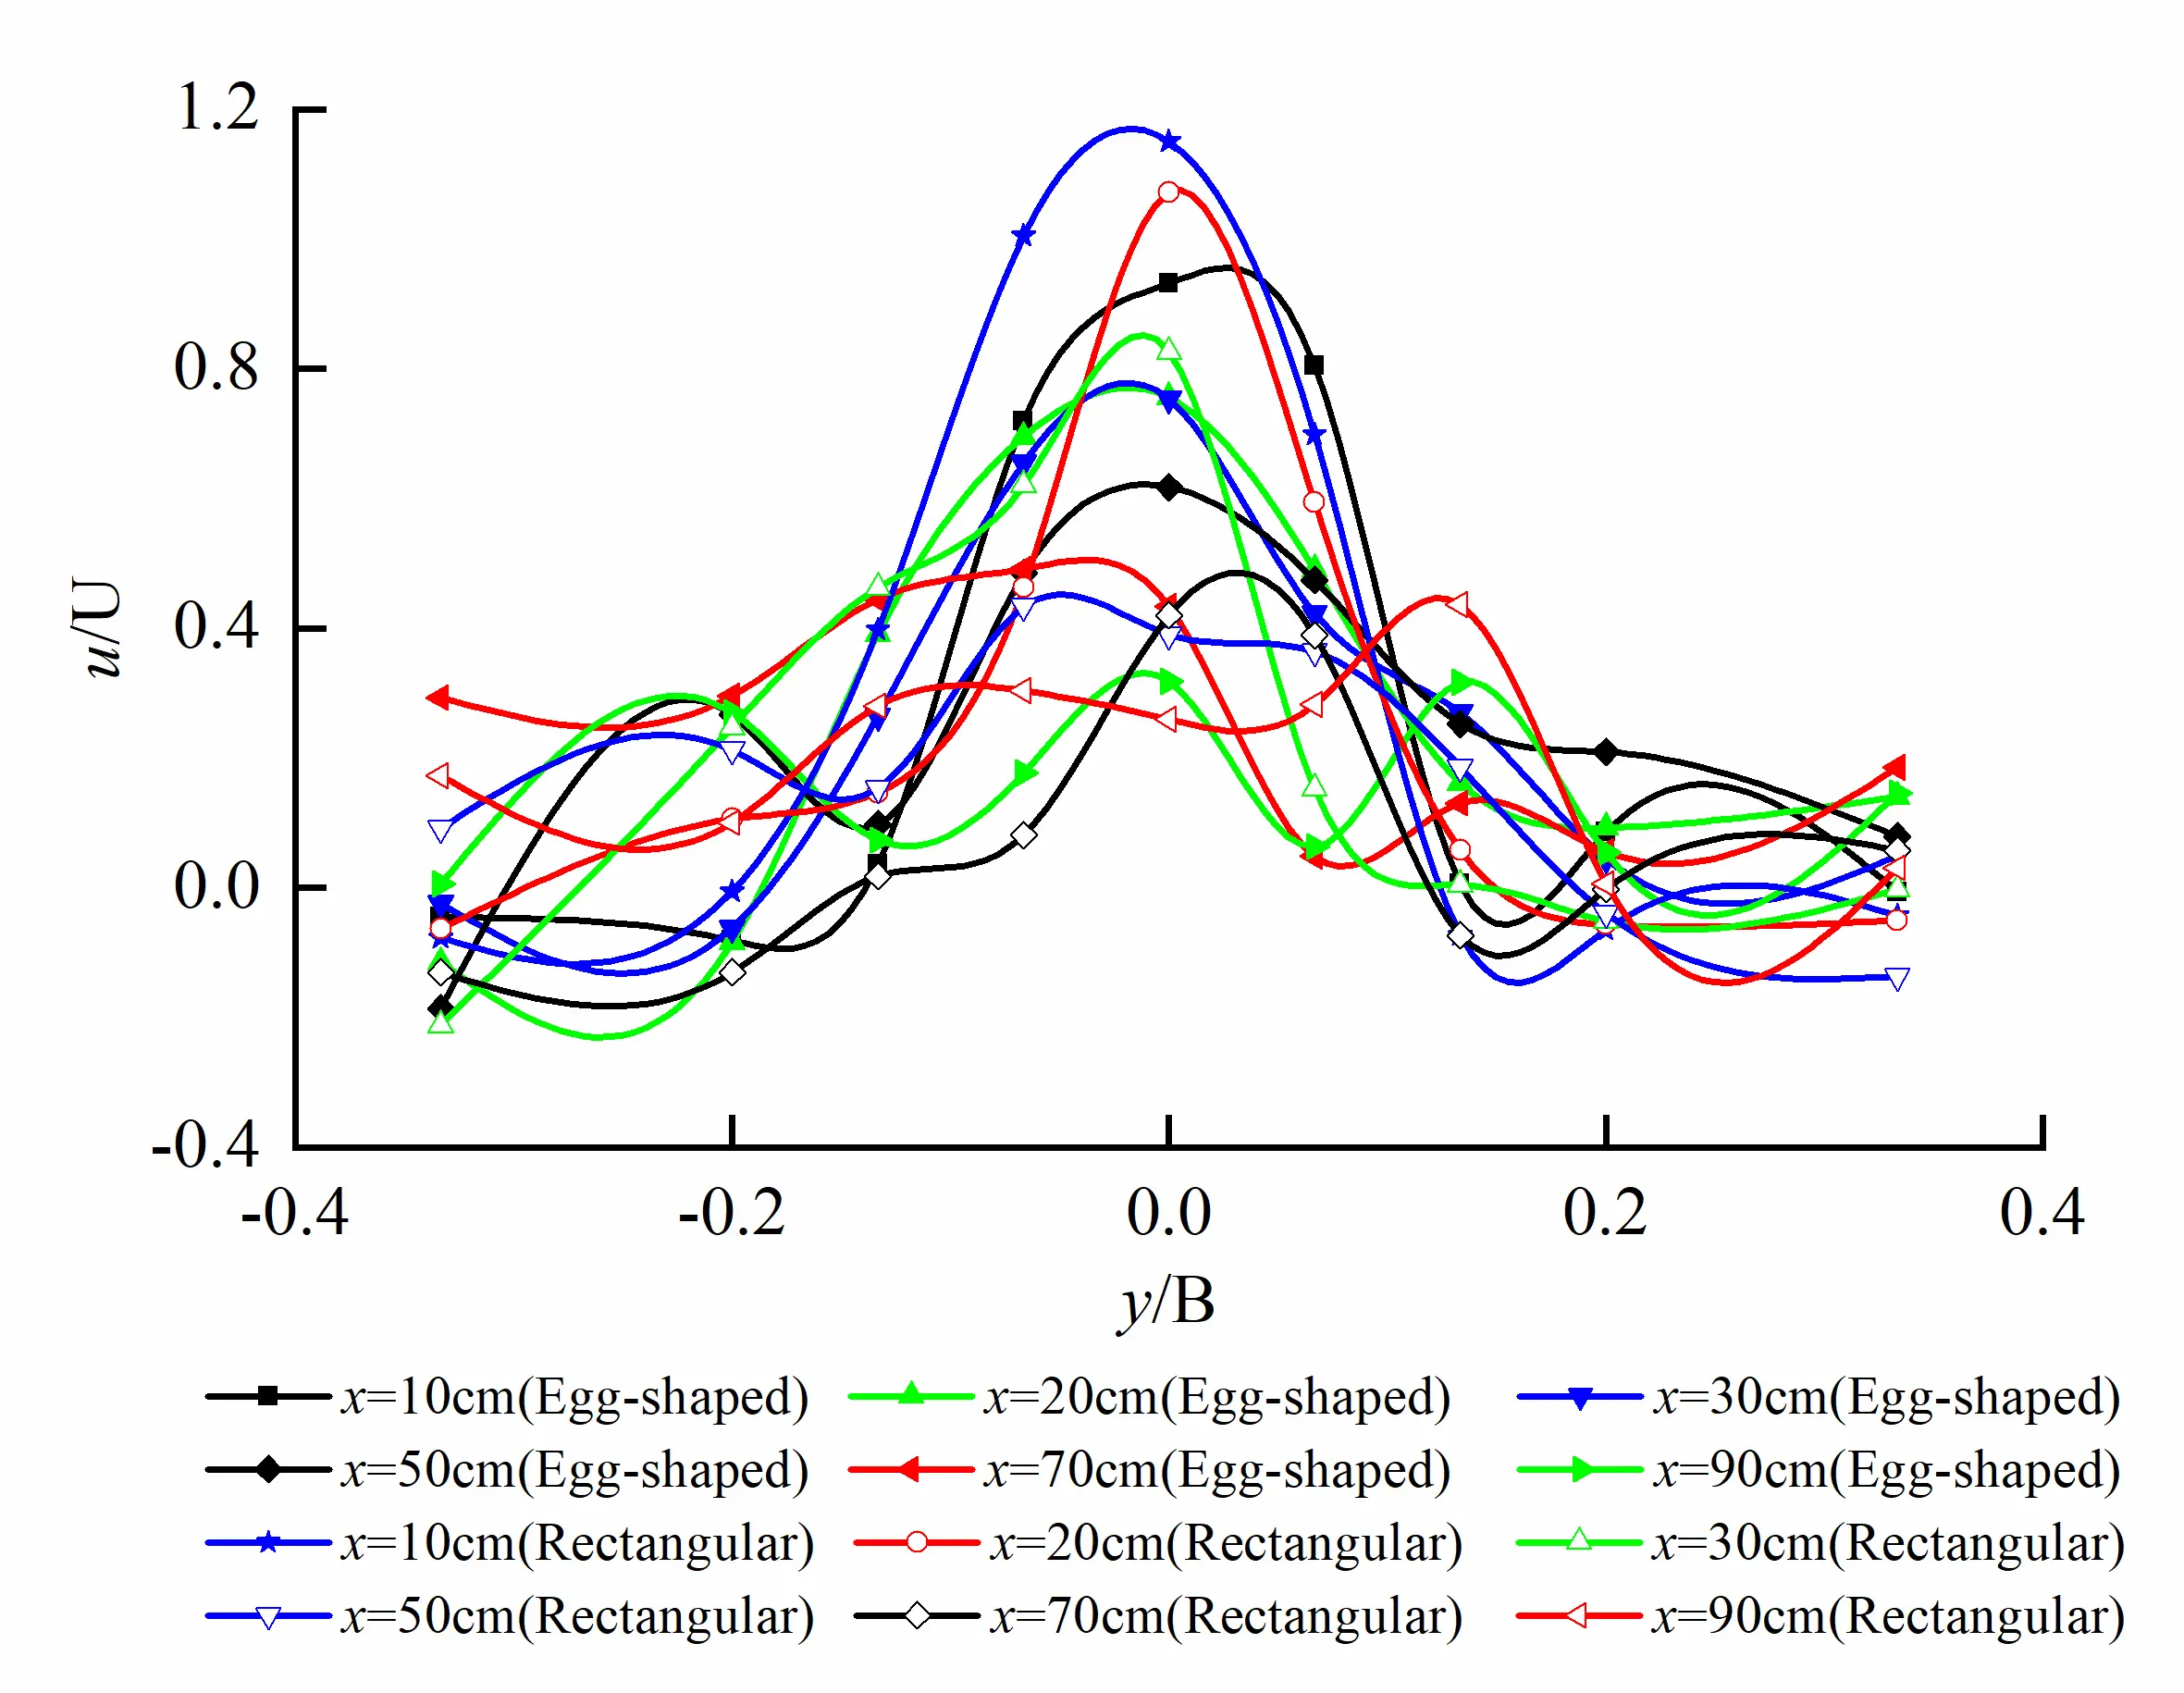
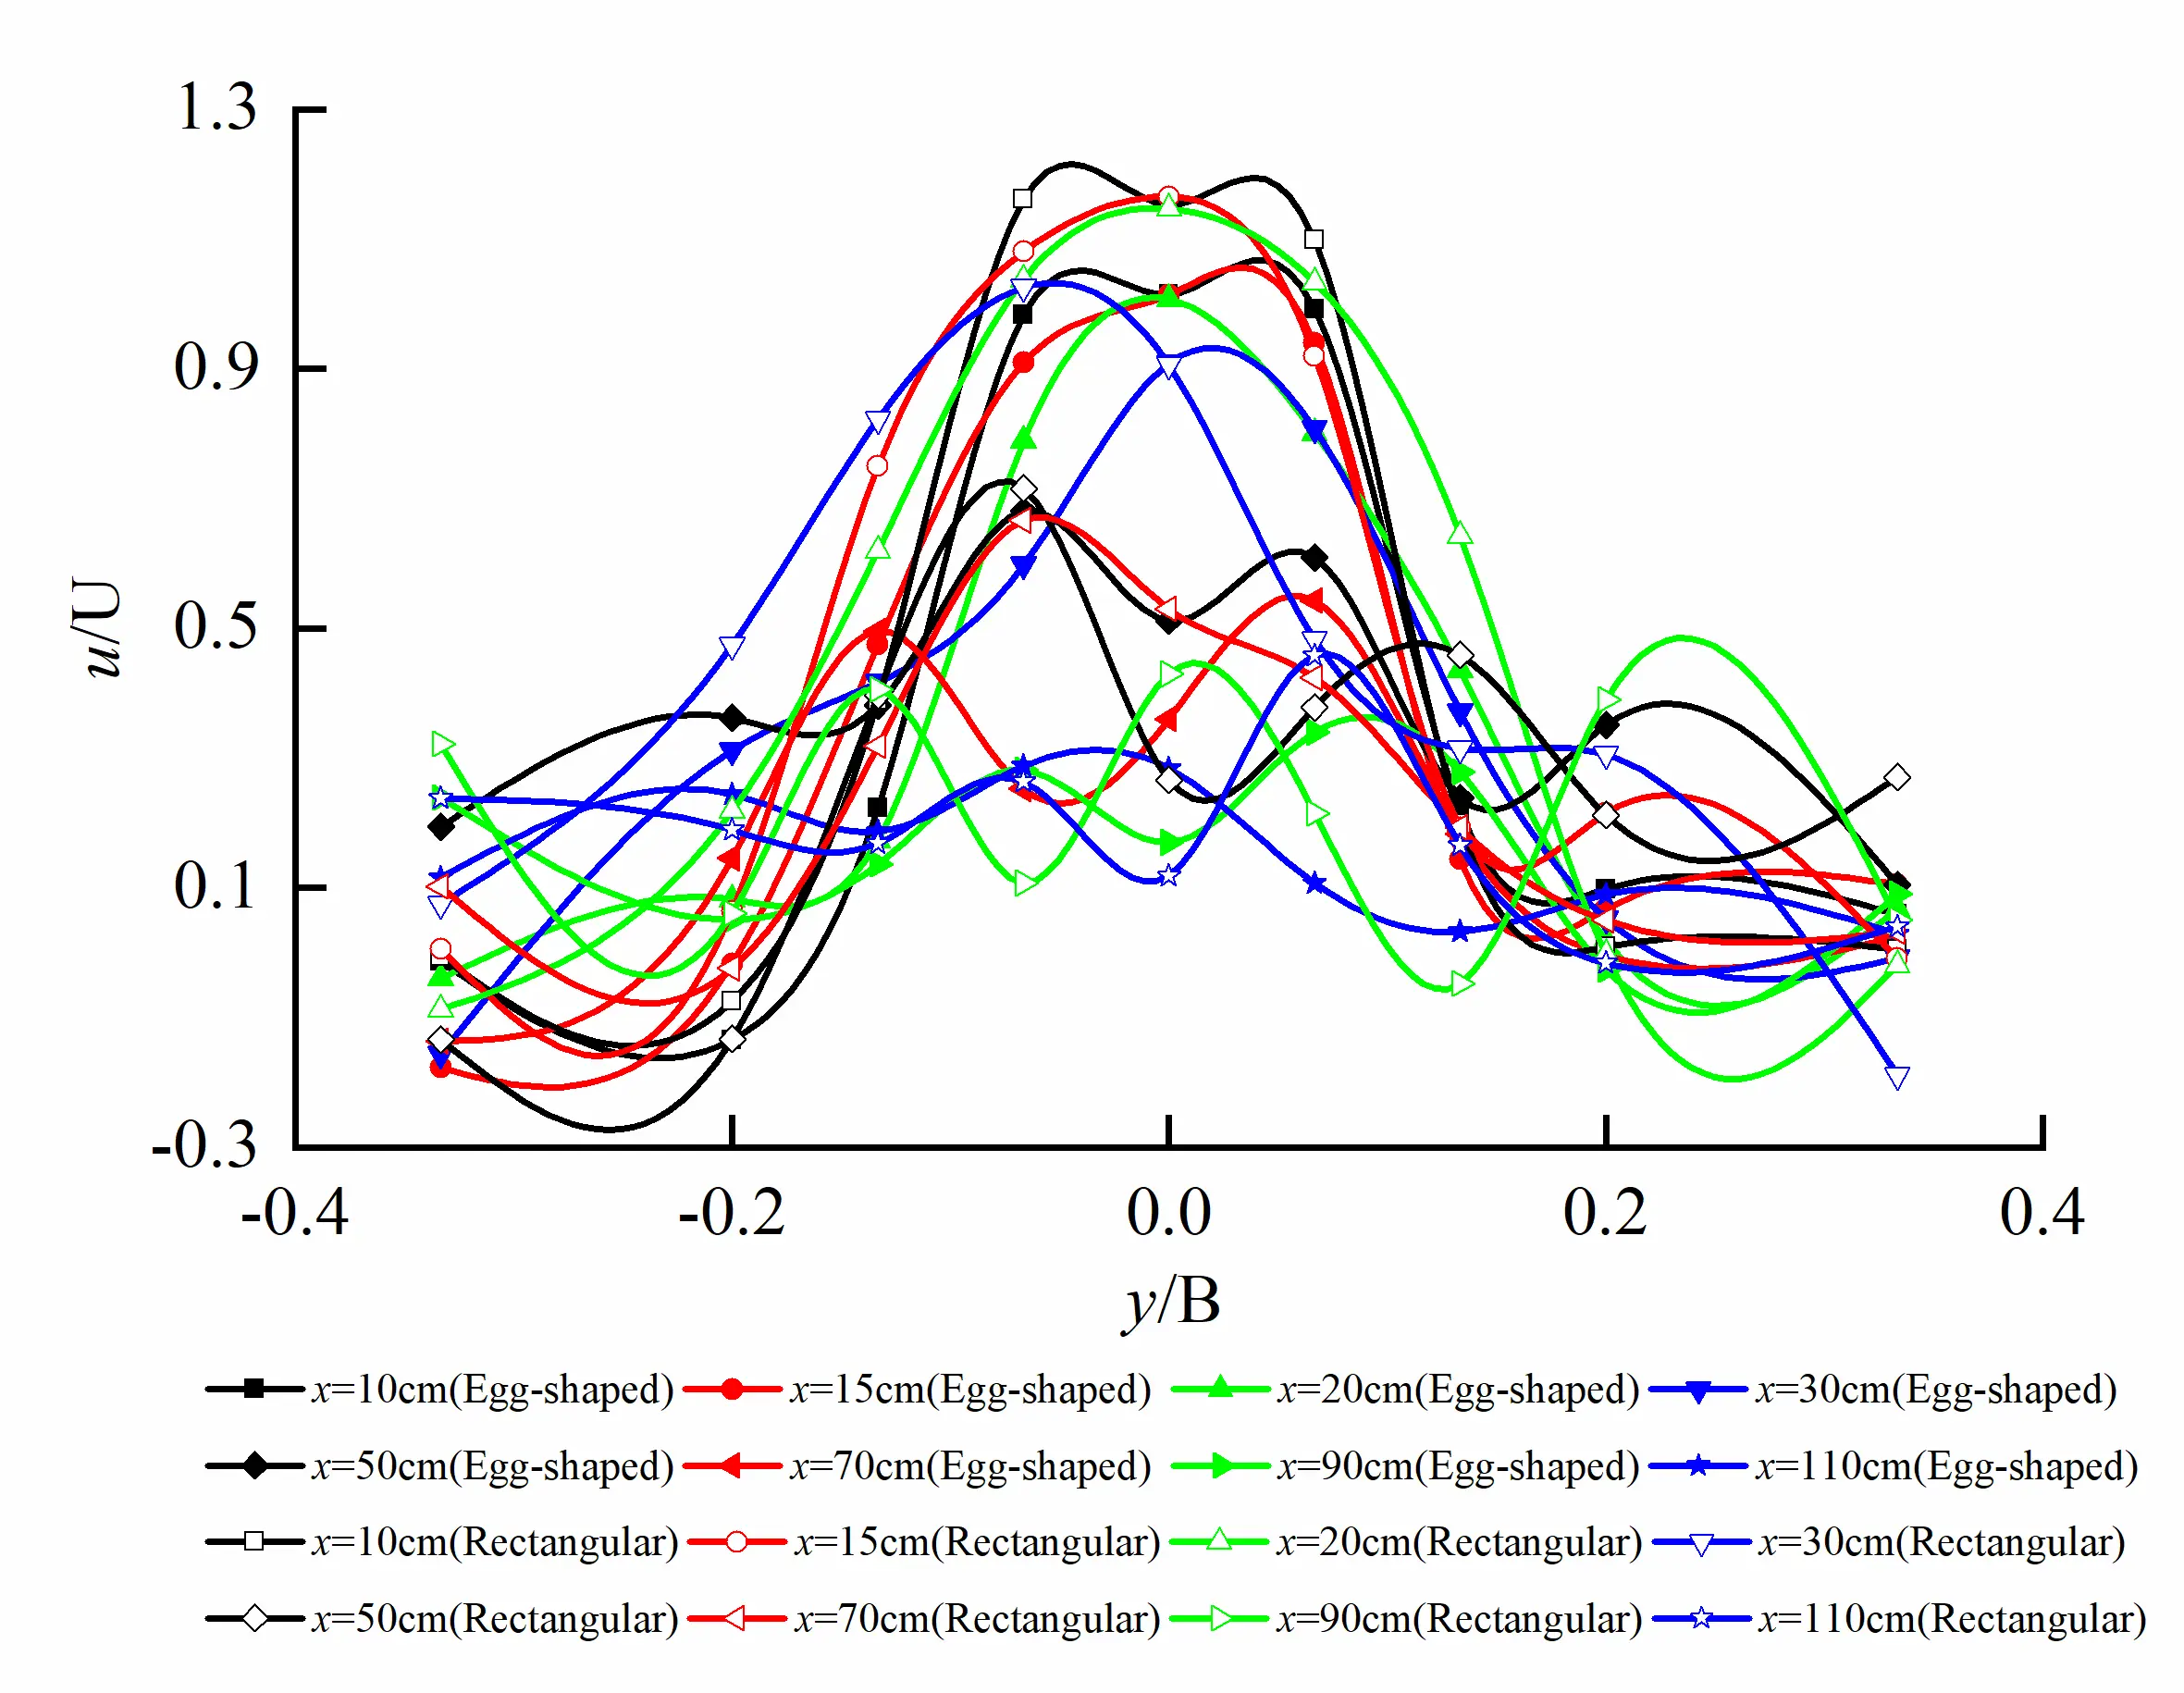
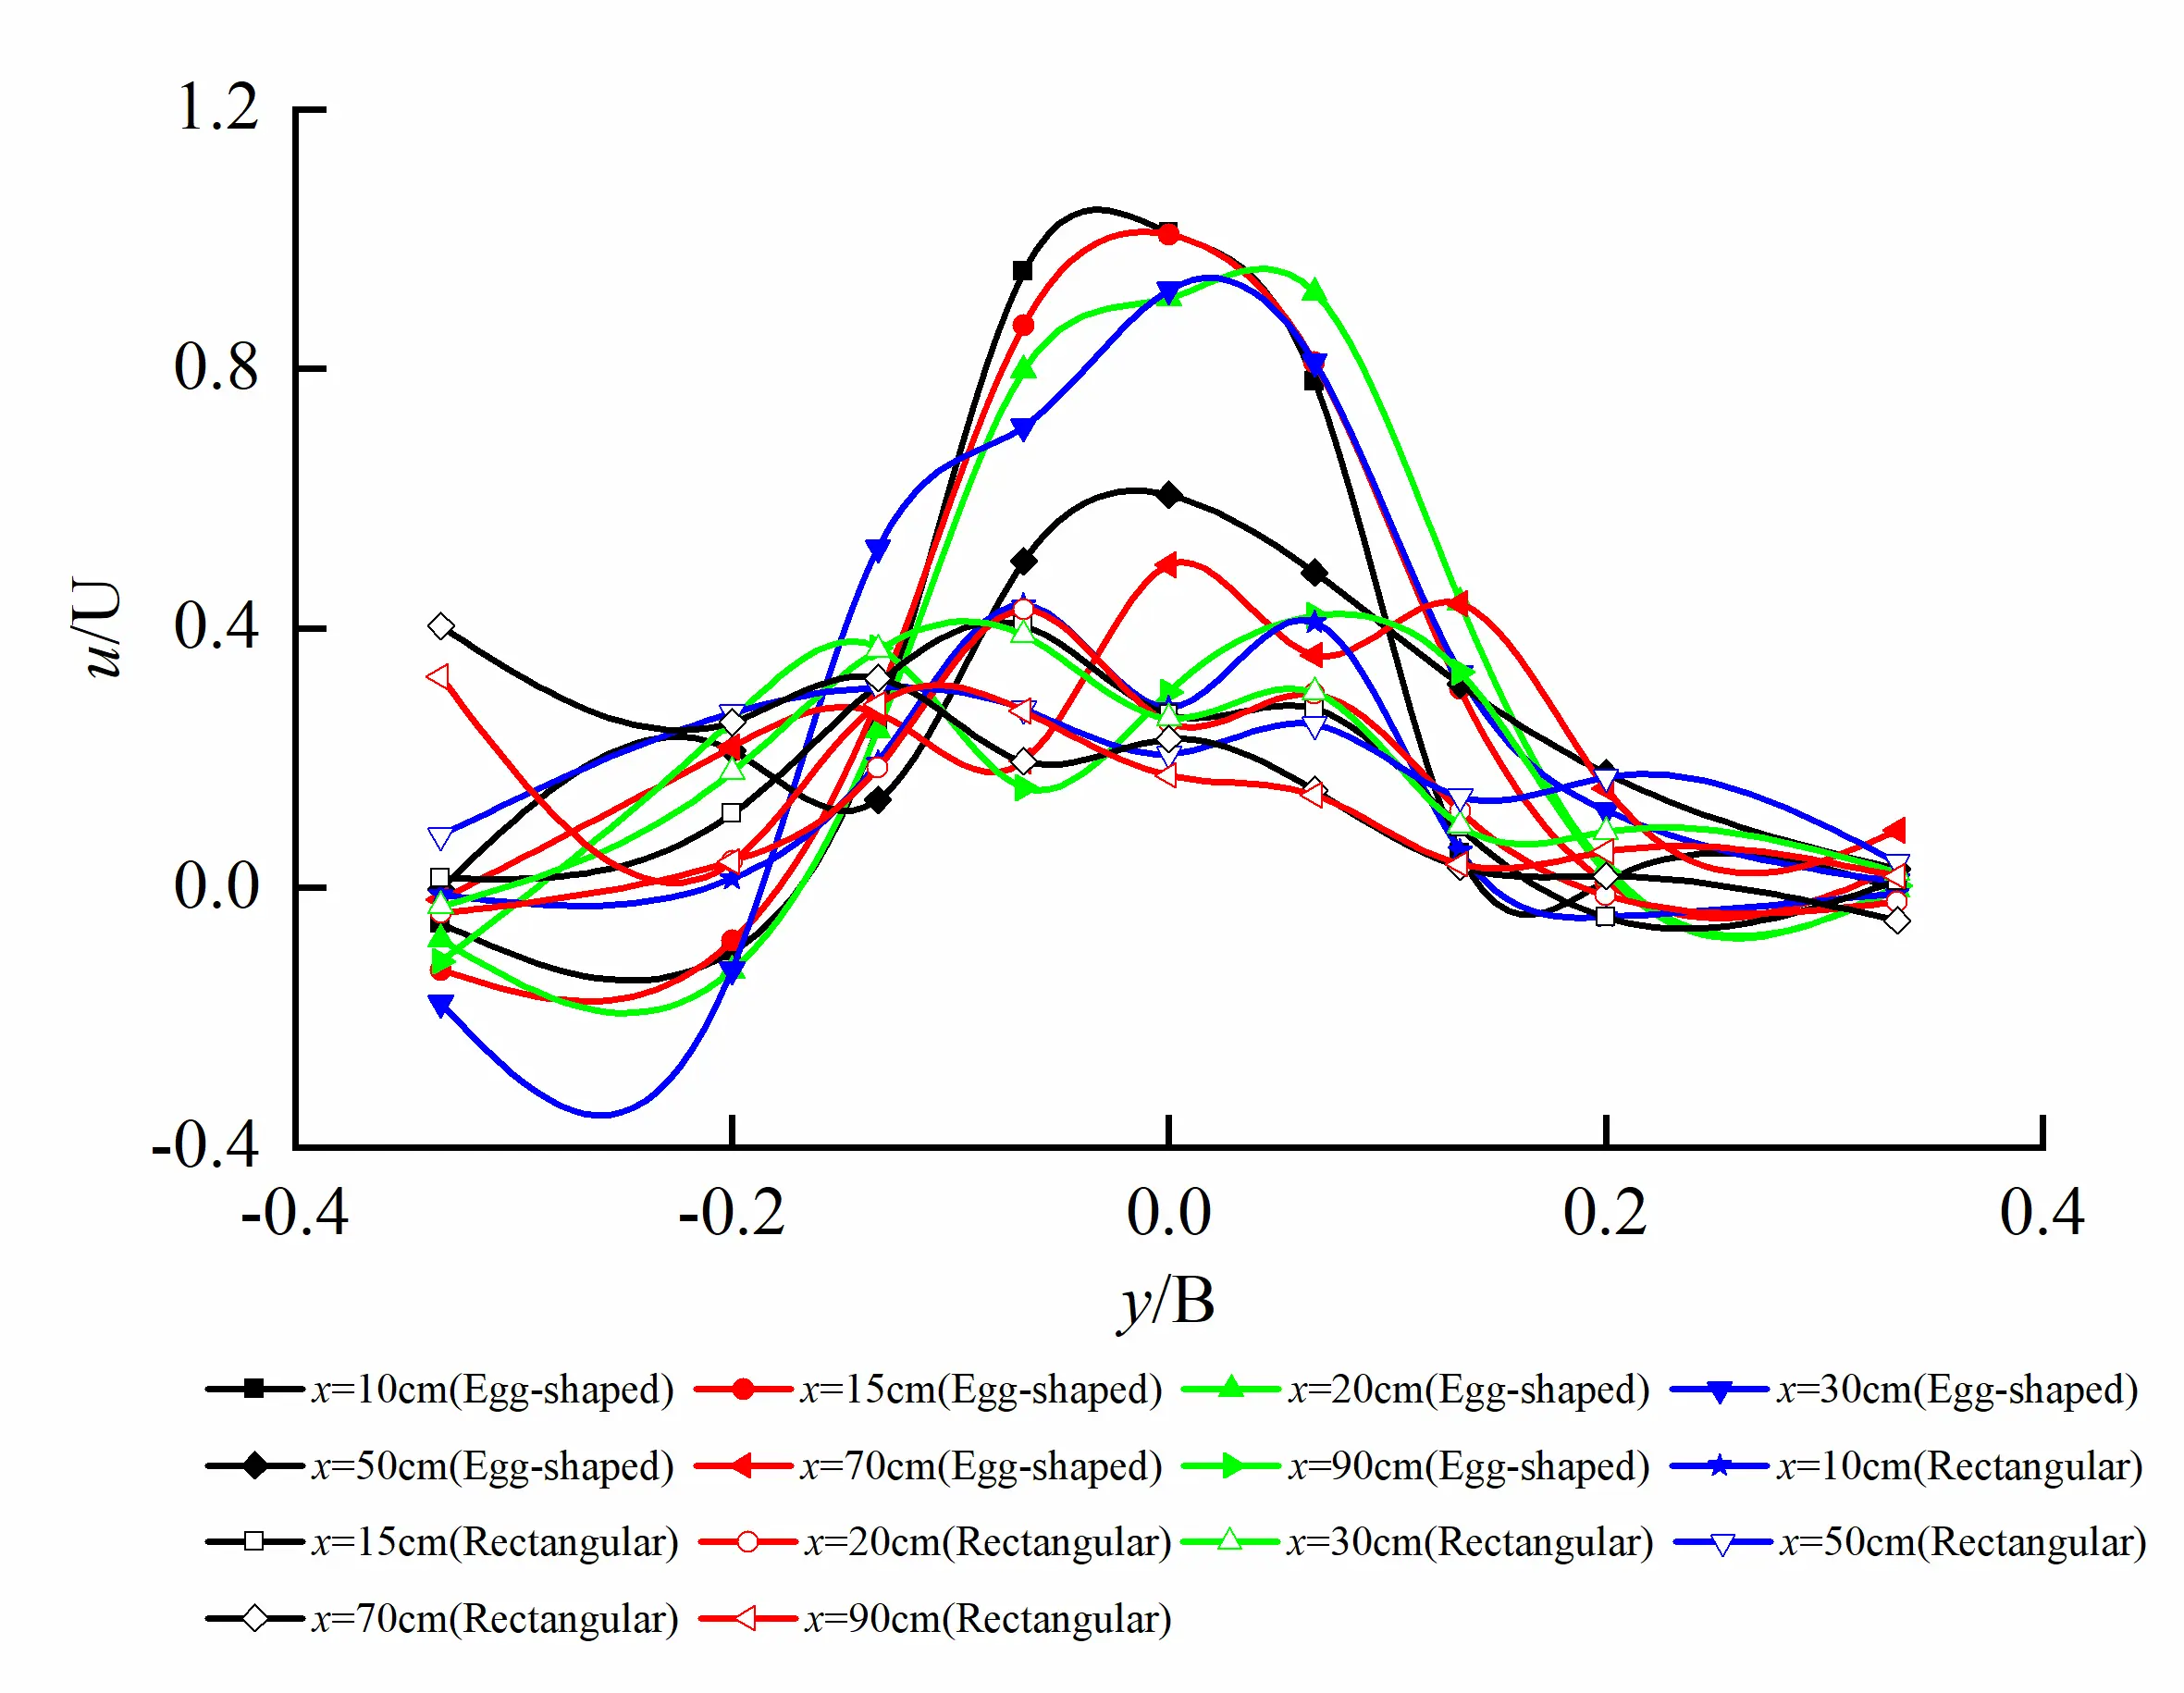
Transverse non-dimensional distribution of longitudinal velocity on different horizontal planes for both egg-shaped and rectangular orifices at the same water level is shown in Figure 7. We can see from the figure that longitudinal velocity distributions for egg-shaped orifice are not characterized by two-dimensional plane jet at R/2 in upper semi-circle, short axis and focal point in lower semi-ellipse of the orifice; correspondingly, the characteristics occur at same positions for rectangular orifice, and the similarity of velocity distribution on each cross-section along flow direction does not exist. On the horizontal plane at R/2 in the upper semi-circle of the orifice, the velocity close to the rectangular orifice is higher than that close to the corresponding egg-shaped orifice, and the velocity distribution for the rectangular orifice appears to be broad. On the horizontal plane at the short axis of orifice, velocity distribution both egg-shaped orifice and rectangular orifice is similar; and on the horizontal plane at the focal point of lower semi-ellipse, velocity for the egg-shaped orifice is much higher than that for the rectangular orifice, and velocity distribution for the egg-shaped orifice seems to be steepening, whereas velocity distribution for the rectangular orifice becomes flattening.
 |
|
(a) |
 |
|
(b) |
 |
|
(c) |
Figure 7. Transverse distribution of longitudinal velocity on different horizontal planes for egg-shaped and rectangular orifices (Poor similarity). (a) Transverse distribution of longitudinal velocity on the horizontal plane at R/2 in the upper semi-circle of the orifice; (b) Transverse distribution of longitudinal velocity on the horizontal plane at the short axis of the orifice; (c) Transverse distribution of longitudinal velocity on the horizontal plane at the focal point in the lower semi-ellipse of the orifice.
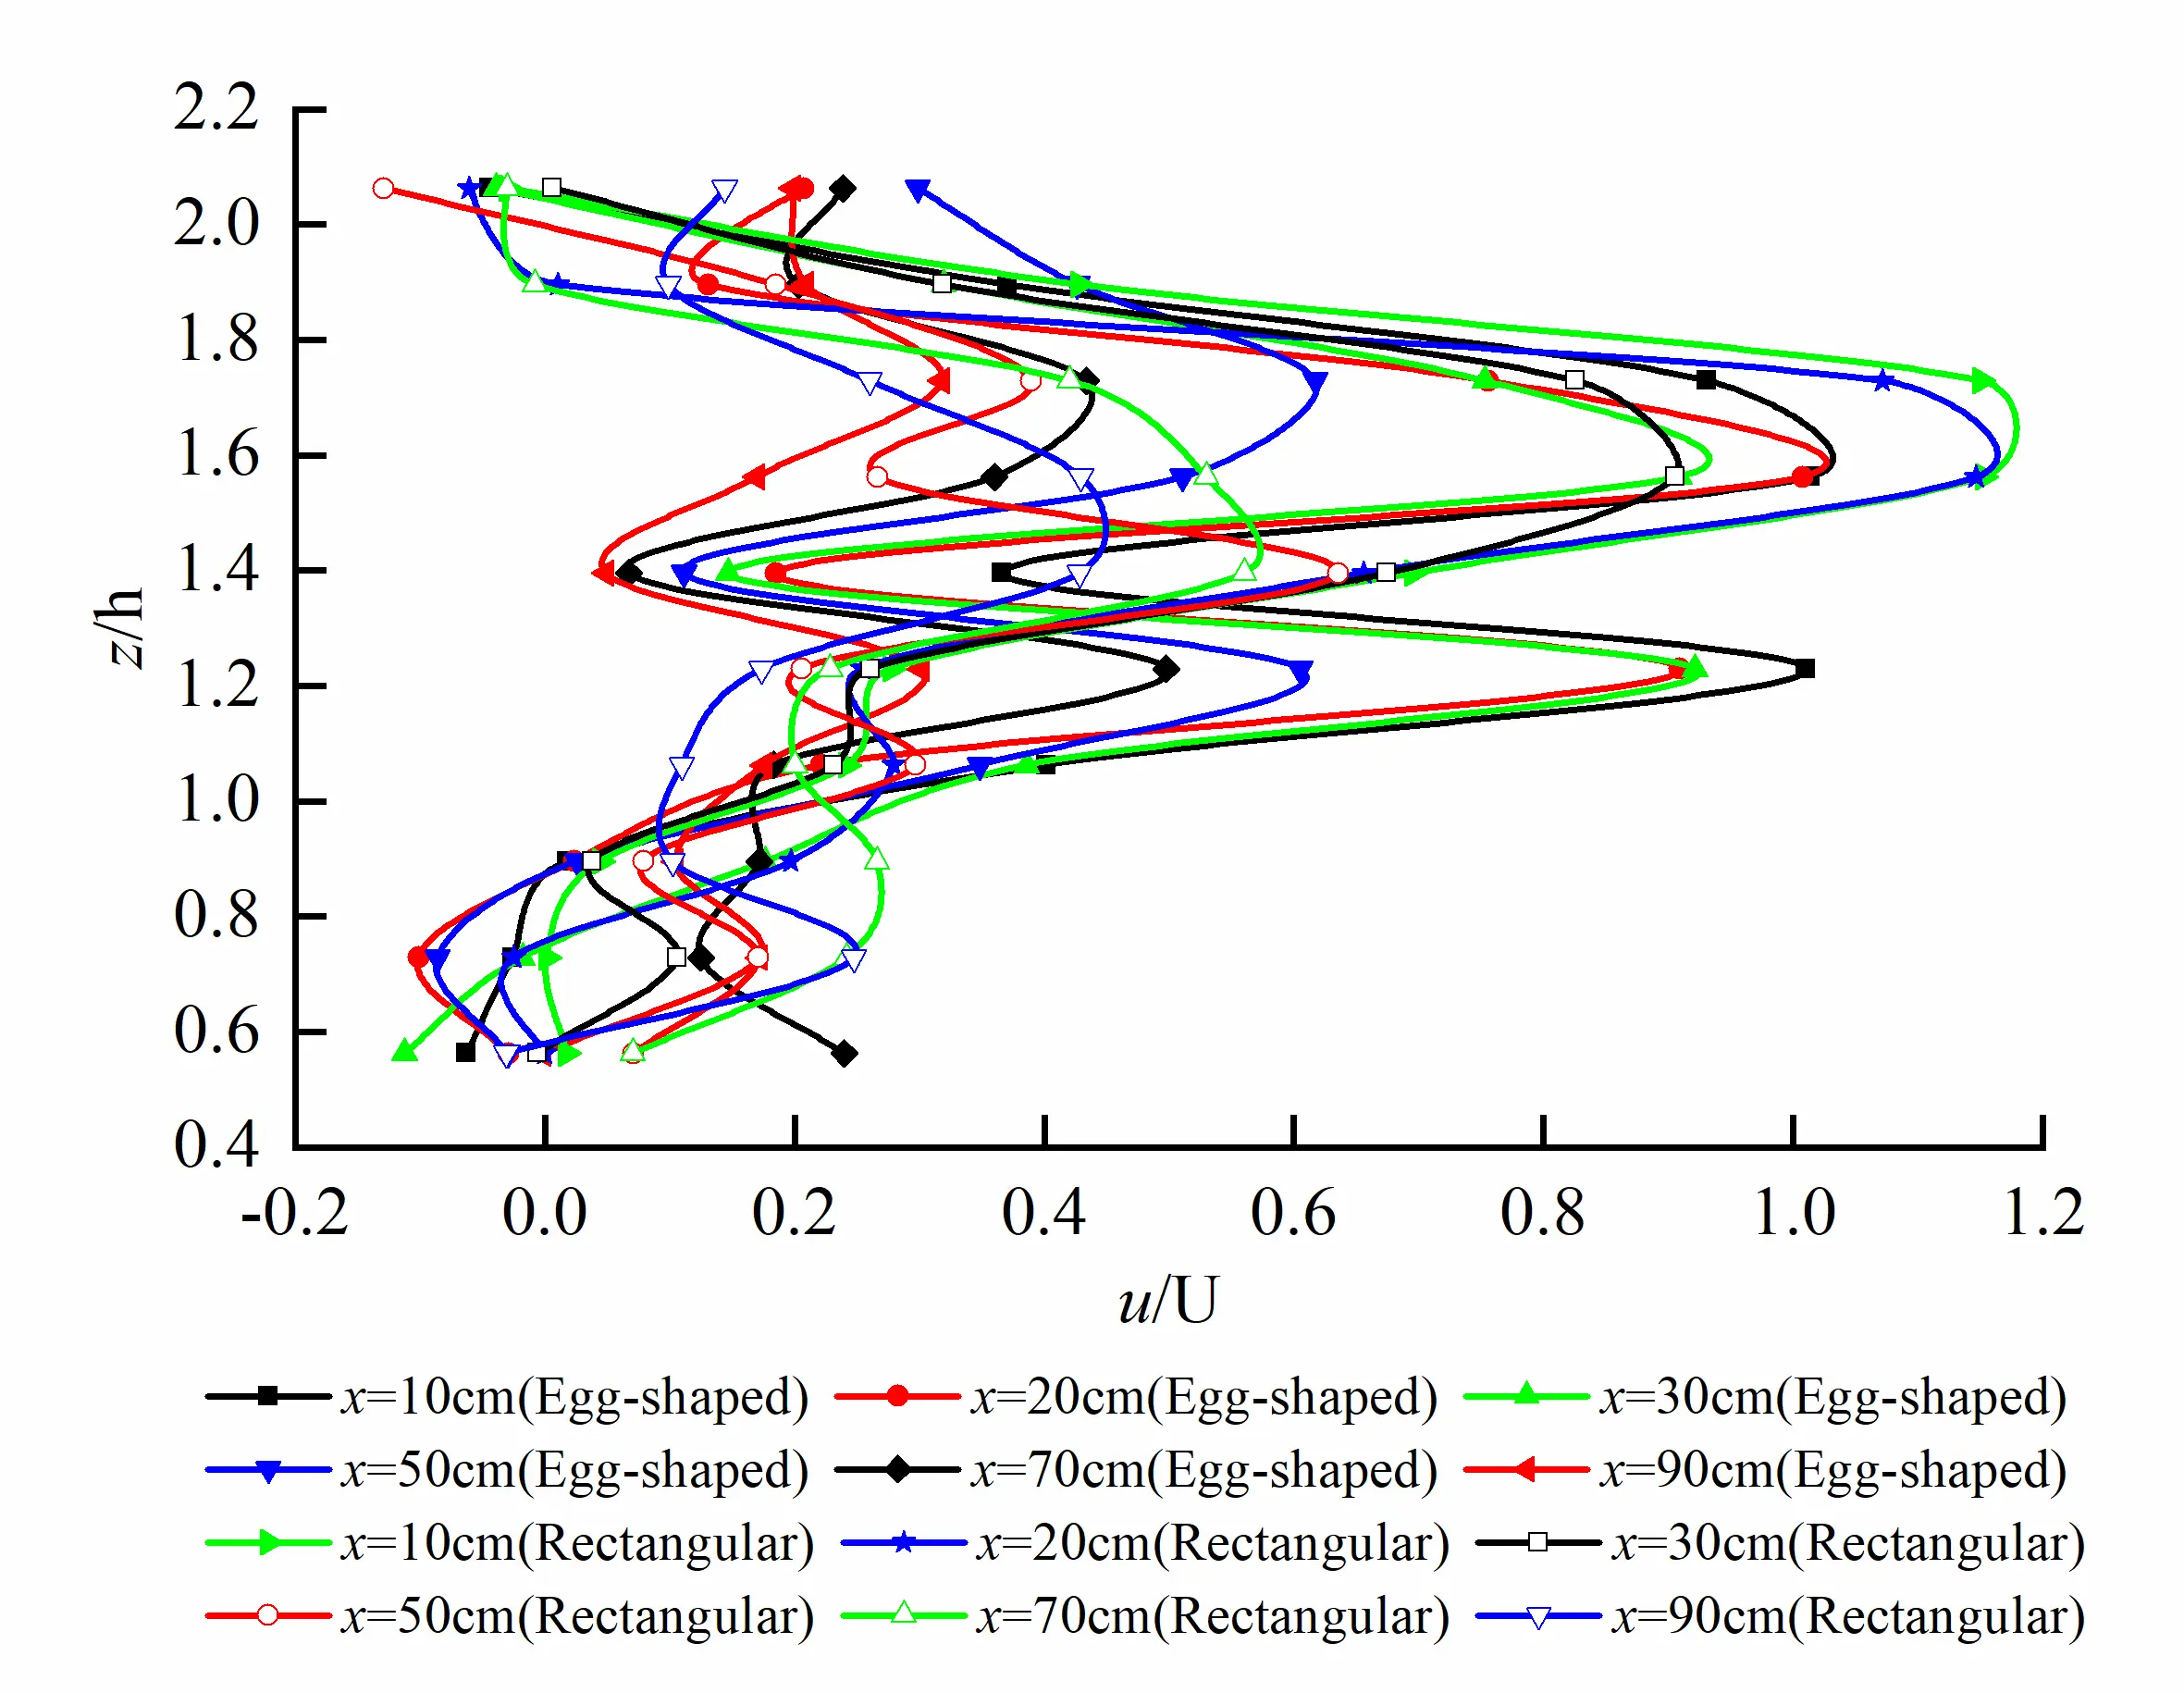
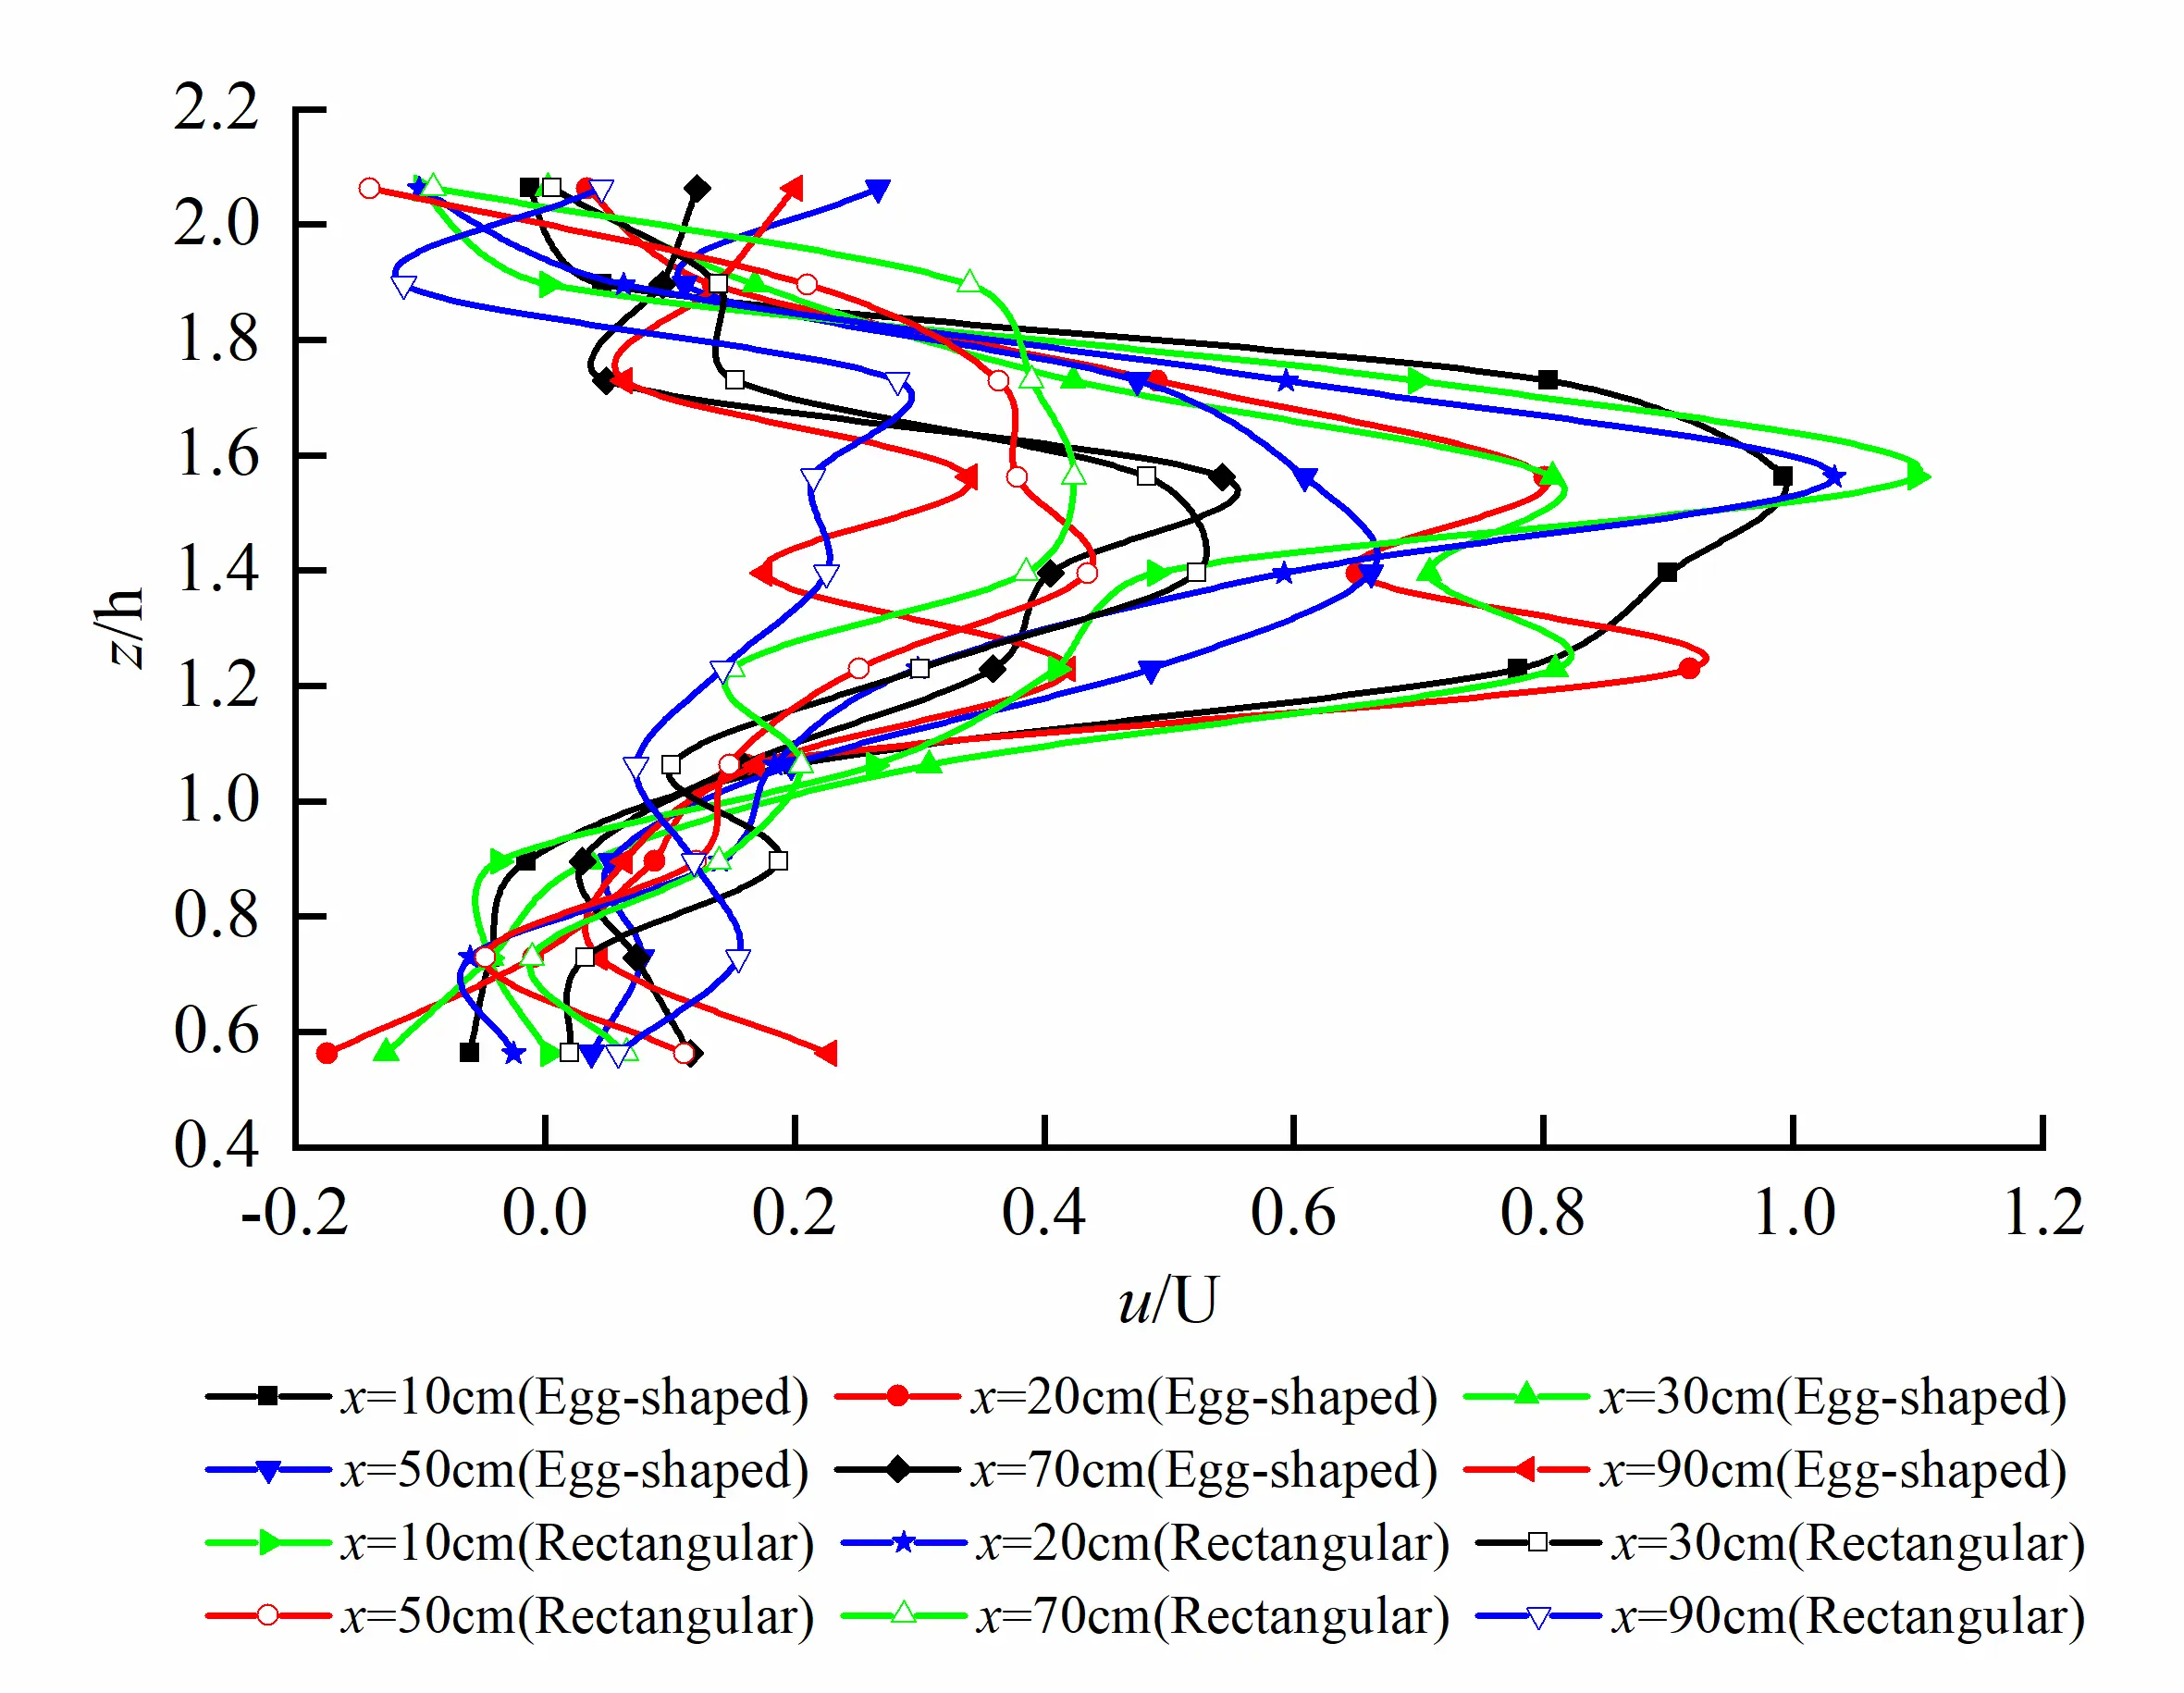
Vertical non-dimensional distribution of longitudinal time-averaged velocity u on the longitudinal profile at the long axis of egg-shaped orifice is shown in Figure 8. It can be seen that two peaks of longitudinal velocity u occur along the vertical distribution, exhibiting saddle-shaped distribution, the peak values located at the short axis and focal point in the semi-ellipse, and the saddle-shaped trough value at l/2 of the orifice. As we know, for the circular jet, in the zone of established flow, the velocity profile exhibits a Gaussian distribution. For the egg-shaped jet, the velocity profile is saddle-shaped, which means that two virtual origins exist in the egg-shaped orifice. However, there is only one peak in the corresponding velocity distribution for the rectangular orifice as shown in Figure 9a. Vertical distribution of longitudinal velocity on the longitudinal profile at b/4 of the short axis is similar to the case at the long axis; the difference is that the curve becomes more steepening as shown in Figure 9b.
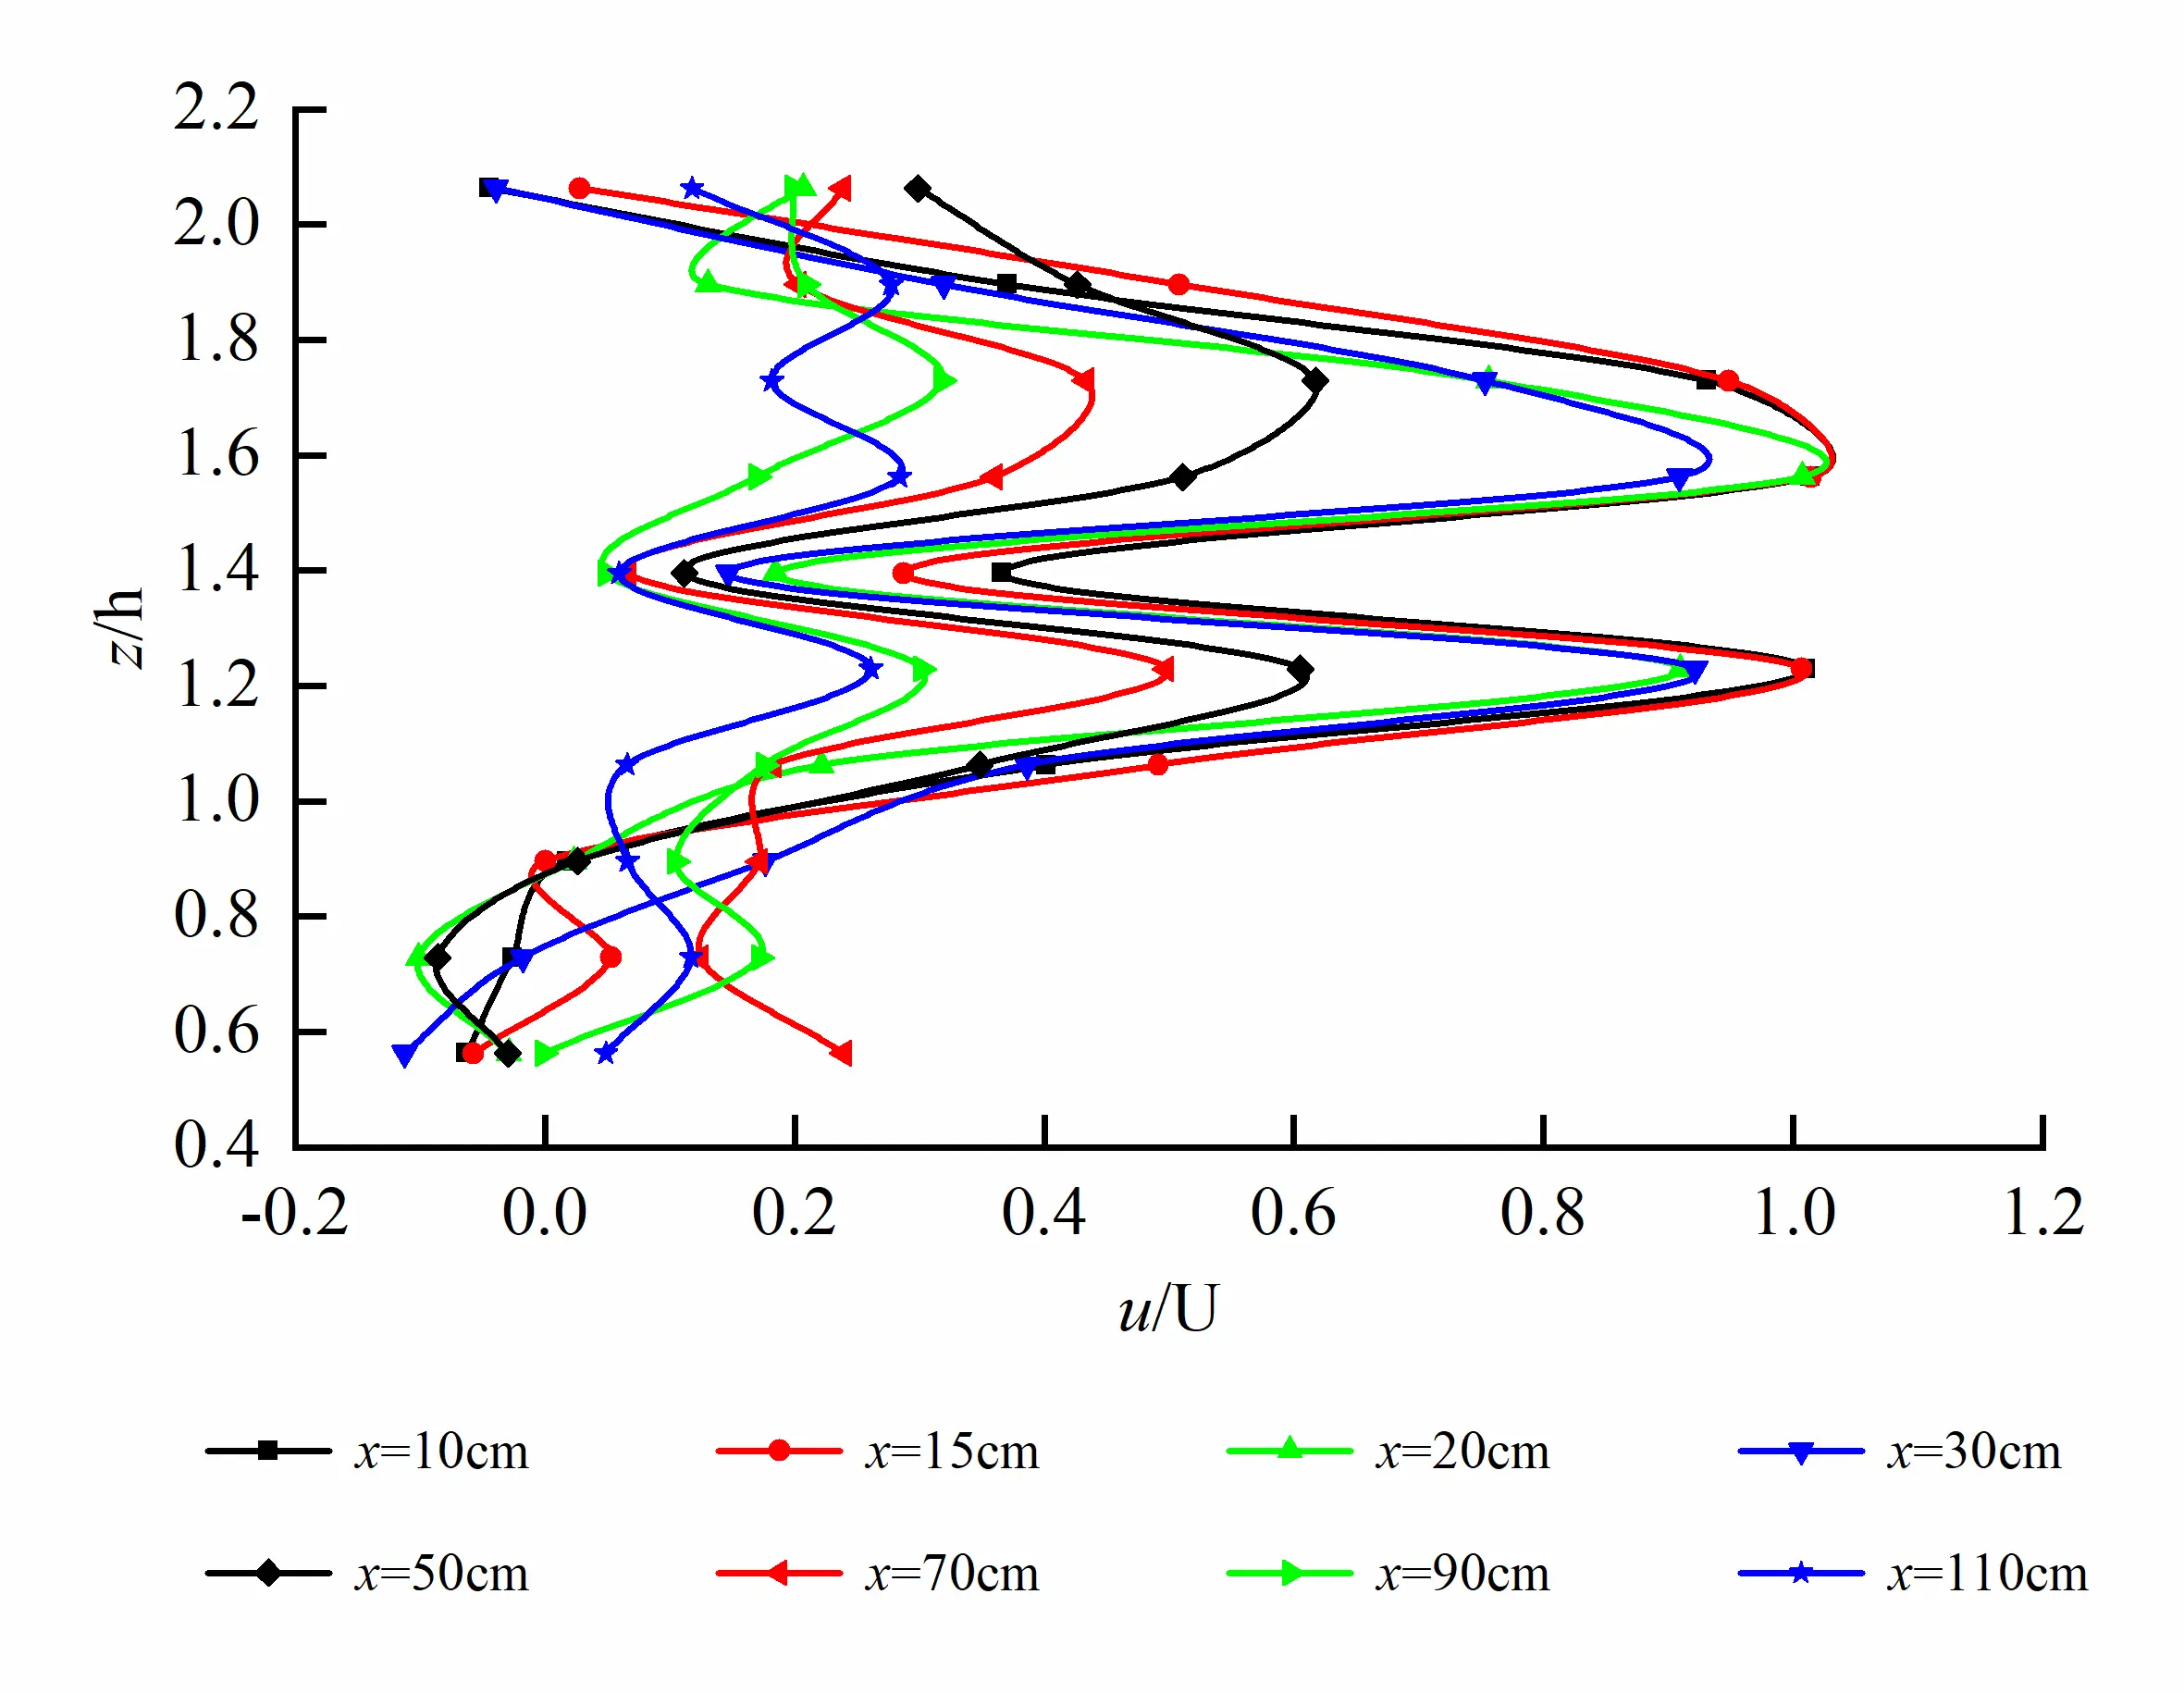
Figure 8. Vertical distribution of longitudinal velocity on longitudinal profile at the long axis of egg-shaped orifice (Exhibiting two peaks).
 |
|
(a) |
 |
|
(b) |
Figure 9. Vertical distribution of longitudinal velocity on different longitudinal profiles for egg-shaped and rectangular orifices (The egg-shaped orifice exhibits two peaks, while the rectangular orifice one peak). (a) Vertical distribution of longitudinal velocity on longitudinal profile at the long axis of the orifice; (b) Vertical distribution of longitudinal velocity on longitudinal profile at b/4 of the orifice.
Figure 10 shows the transverse distribution of transverse velocity v on cross-section at x/e = 15 for egg-shaped and rectangular orifices, in which e is the aspect ratio of the orifices, that is
|
```latexe=\frac{d}{l}``` |
(7) |
where d denotes the length of the short axis, and l length of the long axis.
It follows from Figure 10 that the transverse distribution of transverse velocity for an egg-shaped orifice exhibits upward convex in the lower semi-ellipse, and downward concave in the upper semi-circle. However, for the same aspect ratio of a rectangular orifice, the transverse velocity has less fluctuation along the transverse direction and small values. At the short axis, transverse velocities for both egg-shaped and rectangular orifices are almost the same.
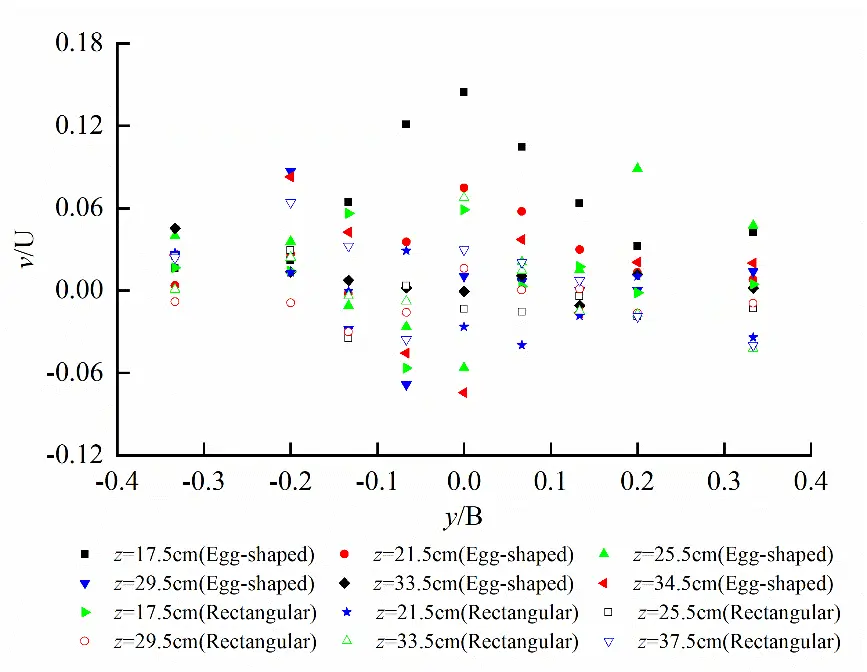
Figure 10. Transverse distribution of transverse velocity on cross section at x/e = 15 for egg-shaped and rectangular orifices (Exhibiting upward convex in the lower semi-ellipse, and downward concave in the upper semi-circle for egg-shaped orifice, and less fluctuation for rectangular one).
Transverse distribution of vertical velocity w on the cross-section at x/e = 15 for both egg-shaped and rectangular orifices is shown in Figure 11. It can be seen that variation in vertical velocity distribution for egg-shaped orifice at z = 29.5 cm and 41.5 cm is the same as rectangular orifice, that is, downward vertical velocity at long axis and upward vertical velocity in two sides of the orifices occur, and vertical vortices in two sides of the orifices.
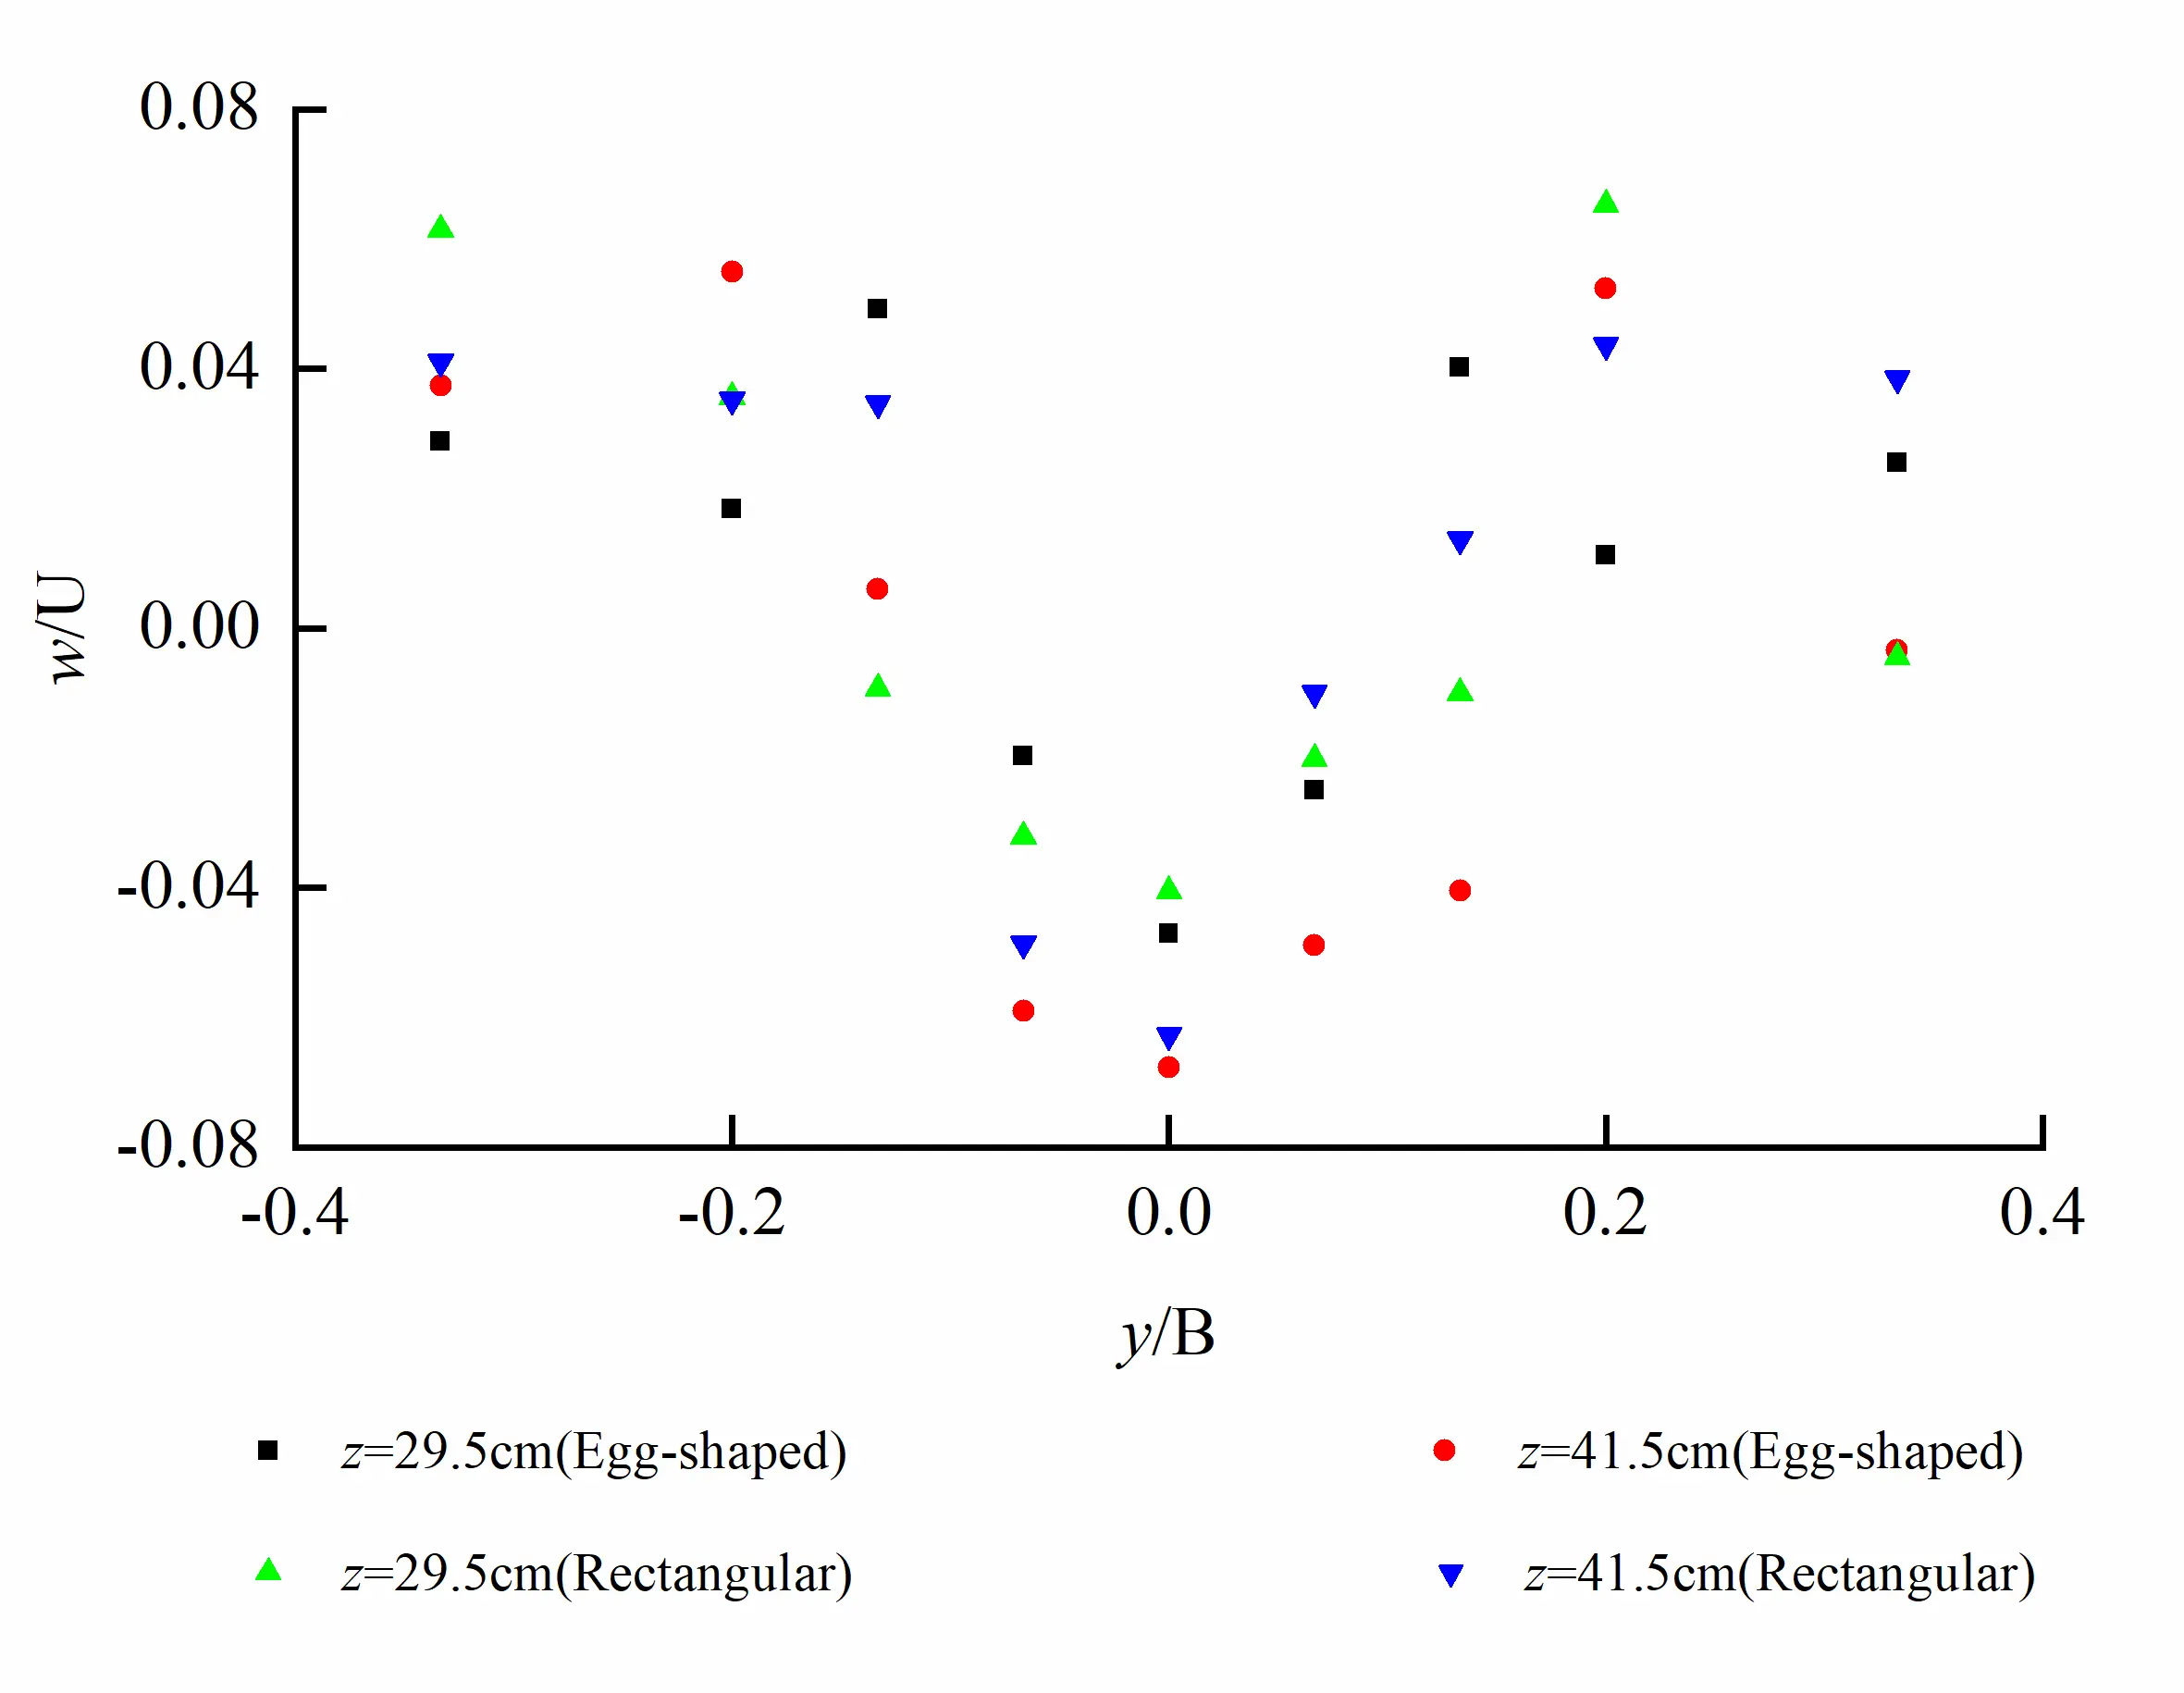
Figure 11. Transverse distribution of vertical velocity on cross-section at x/e = 15 for egg-shaped and rectangular orifices (Downward at the long axis and upward on two sides of the orifices).
3.4. Turbulence Intensity
Turbulence intensity reflects the turbulence level of the flow. For the egg-shaped orifice, considering its transverse symmetry, longitudinal and vertical turbulence intensities were mainly analyzed, and can be expressed as follows
| ```latexT_x = \frac{\sqrt{\overline{u^{\prime2}}}}{U}, \; T_z = \frac{\sqrt{\overline{W^{\prime2}}}}{U}``` |
(8) |
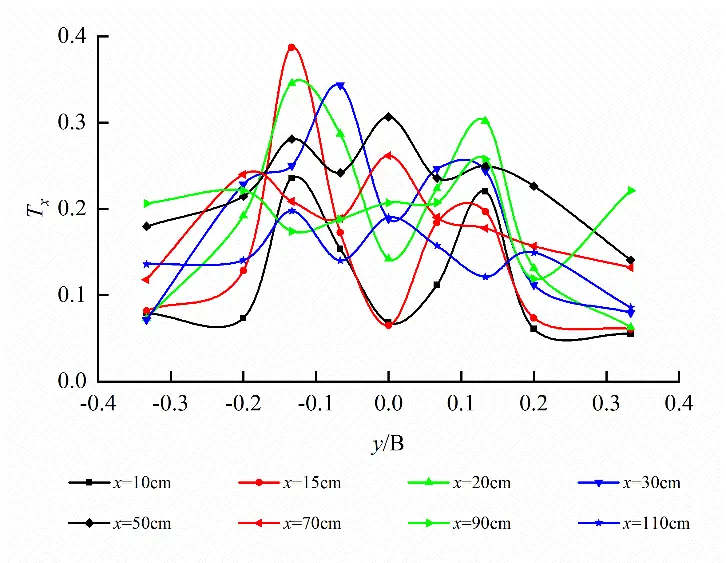
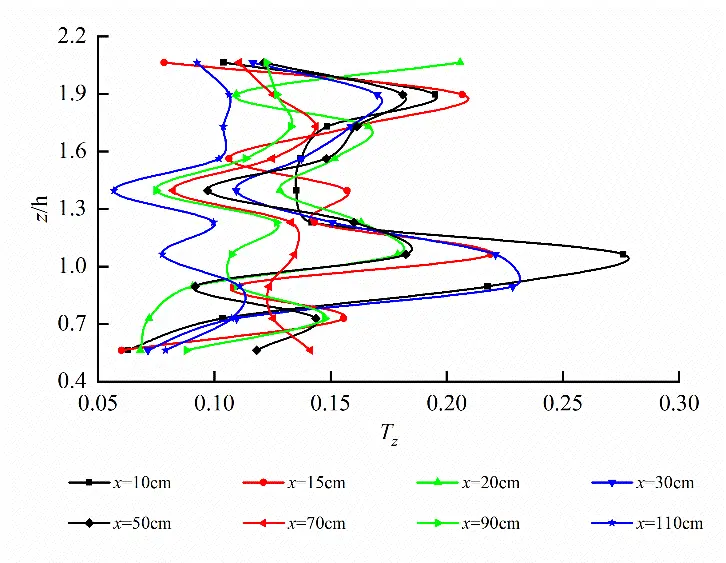
where U, $${u}^{\prime}$$, $${w}^{\prime}$$ denote the mean velocity at the orifice, the longitudinal fluctuating velocity and the vertical fluctuating velocity, respectively. Horizontal plane (z = 32.5 cm) at short axis and longitudinal profile (y = 0.0 cm) at long axis of the egg-shaped orifice were chosen to analyze turbulence intensity as shown in Figure 12. We can see from the figure that intense turbulence occurs at the left and right edges of the egg-shaped orifice on the horizontal plane and reaches the maximum value. The larger turbulence intensity is either in the upper part or the lower part of the longitudinal profile. Totally, turbulence intensity in the orifice region is larger than that in the non-orifice region.
 |
|
(a) |
 |
|
(b) |
Figure 12. Turbulence intensity of egg-shaped orifice (Larger turbulence intensity occurring in the orifice region). (a) Tx distribution on the horizontal plane at short axis; (b) Tz distribution on the longitudinal profile at the long axis.
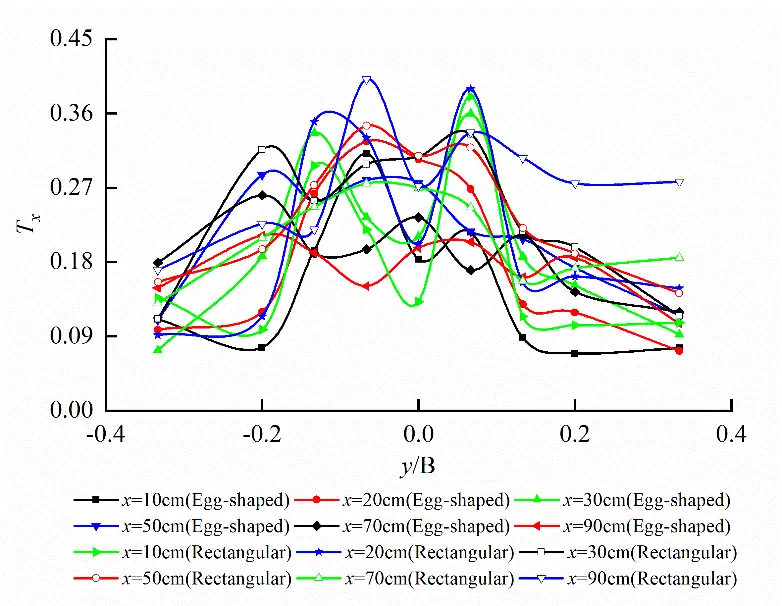
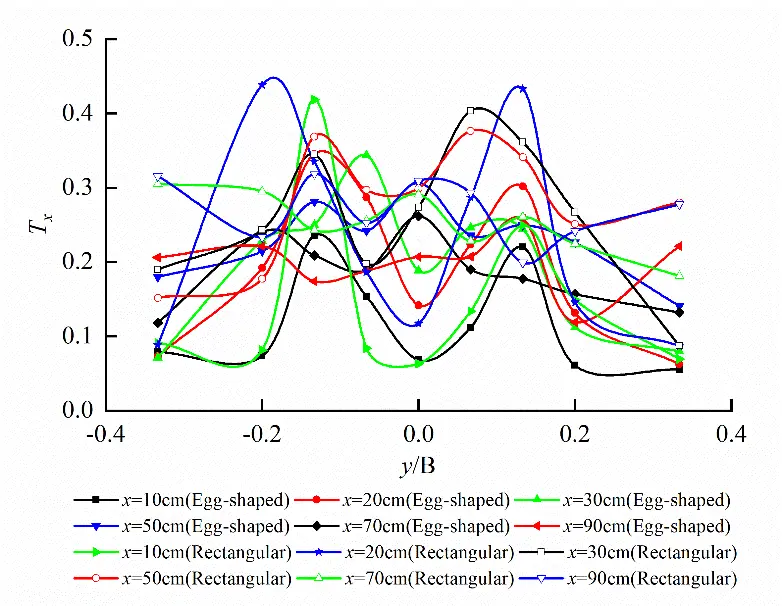
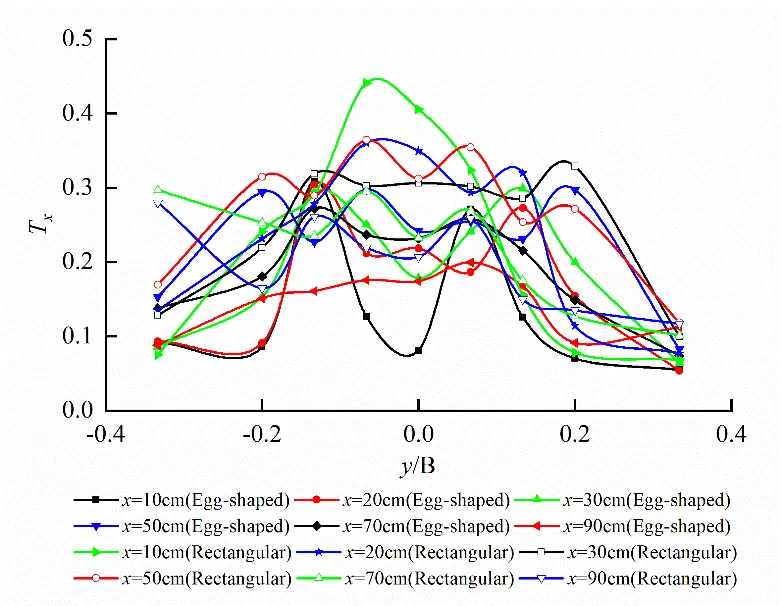
Turbulence intensity Tx distribution on the different horizontal planes for egg-shaped and rectangular orifices under the same water level is shown in Figure 13. It follows from Figure 13 that the variations in turbulence intensity on the horizontal planes at the upper semi-circle R/2 and short axis for egg-shaped orifice is similar to the rectangular orifice, exhibiting the larger turbulence intensity at bilateral edges of the orifices. However, the larger turbulence intensity also occurs in the center of the orifice for the rectangular orifice on the same horizontal plane at the corresponding focal point of the lower semi-ellipse, and is the maximum value.
On the horizontal plane at upper semi-circle R/2, the peak values of Tx for egg-shaped and rectangular orifices are 35.97% and 40.12%, respectively. That is, the turbulence intensity of the egg-shaped orifice is lower 10.35% than that of the rectangular orifice; on the horizontal plane at the short axis of the orifice, the peak values of Tx for egg-shaped and rectangular orifices are 38.74% and 43.83%, respectively. Egg-shaped turbulence intensity is lower 11.63% than that of rectangular one; on the horizontal plane at the focal point of the lower semi-ellipse, the peak values of Tx for egg-shaped and rectangular orifices are 30.83% and 44.06%, respectively. Egg-shaped turbulence intensity is lower by 30.03% than that of the rectangular one.
 |
|
(a) |
 |
|
(b) |
 |
|
(c) |
Figure 13. Tx distribution on different horizontal planes for egg-shaped and rectangular orifices (Larger turbulence intensity occurring at the edges and the central of the orifices). (a) Tx distribution on the horizontal plane at upper semi-circle R/2; (b) Tx distribution on the horizontal plane at the short axis of the orifice; (c) Tx distribution on the horizontal plane at the focal point of the lower semi-ellipse.
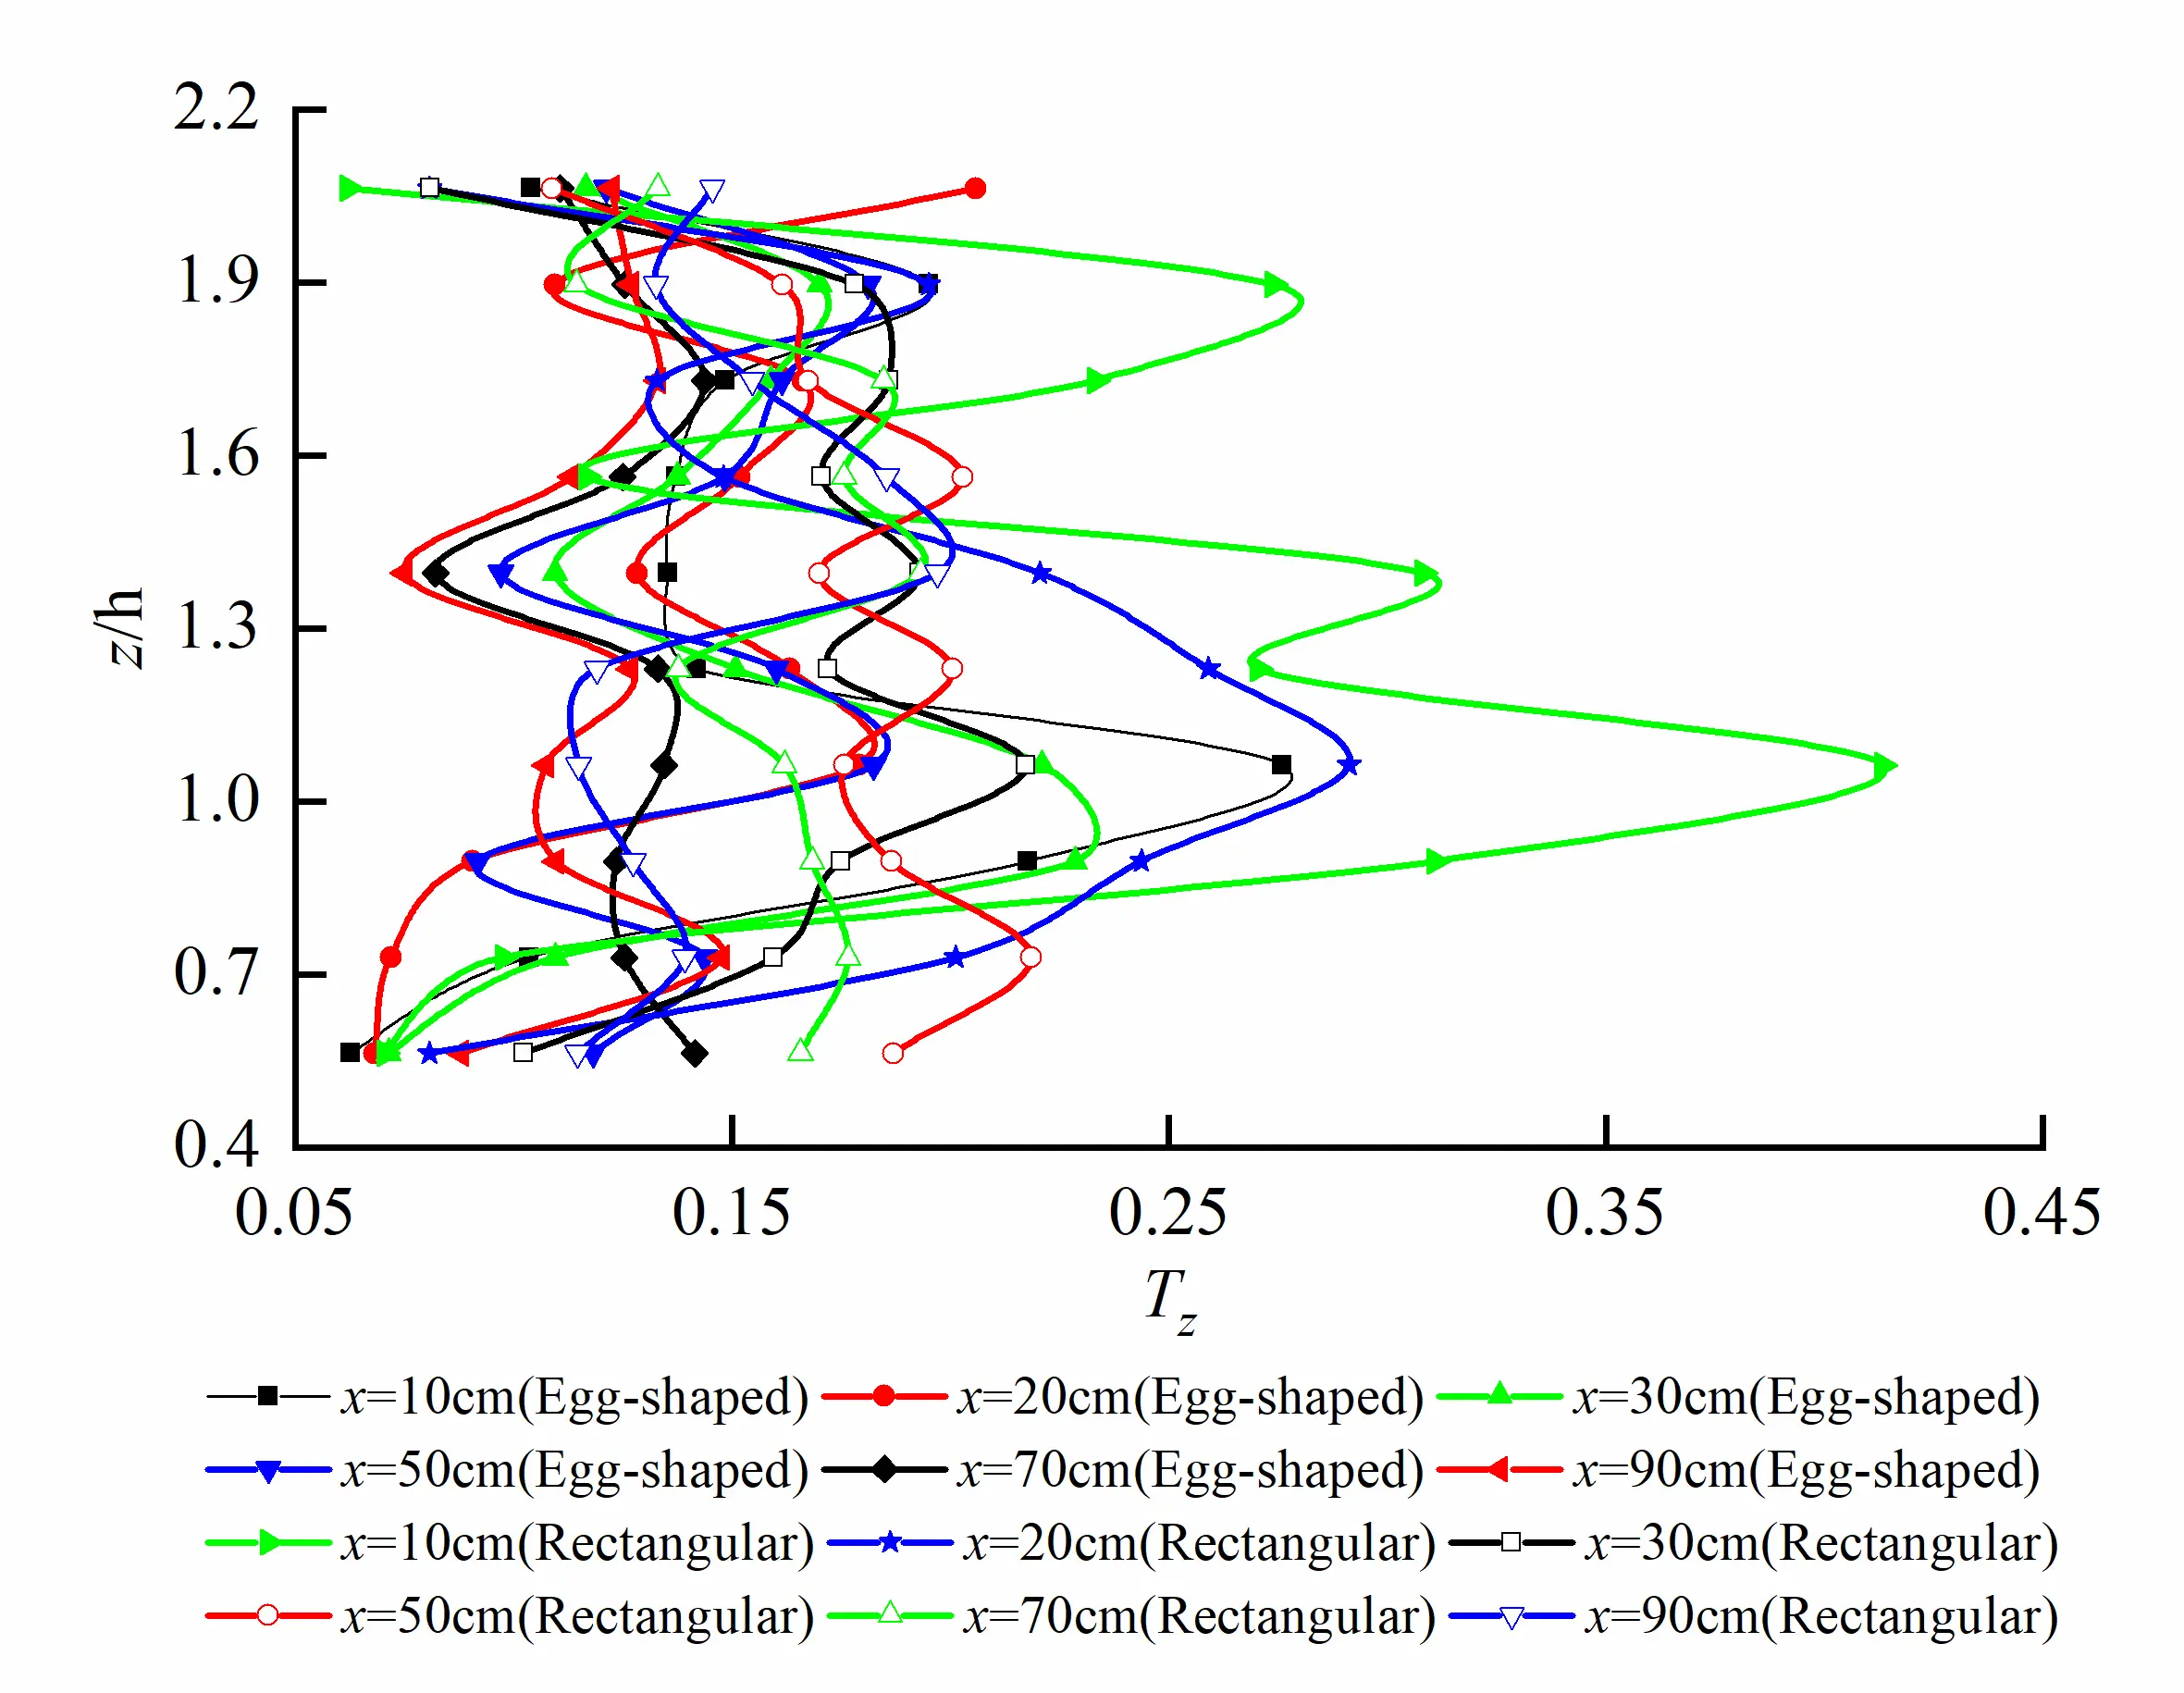
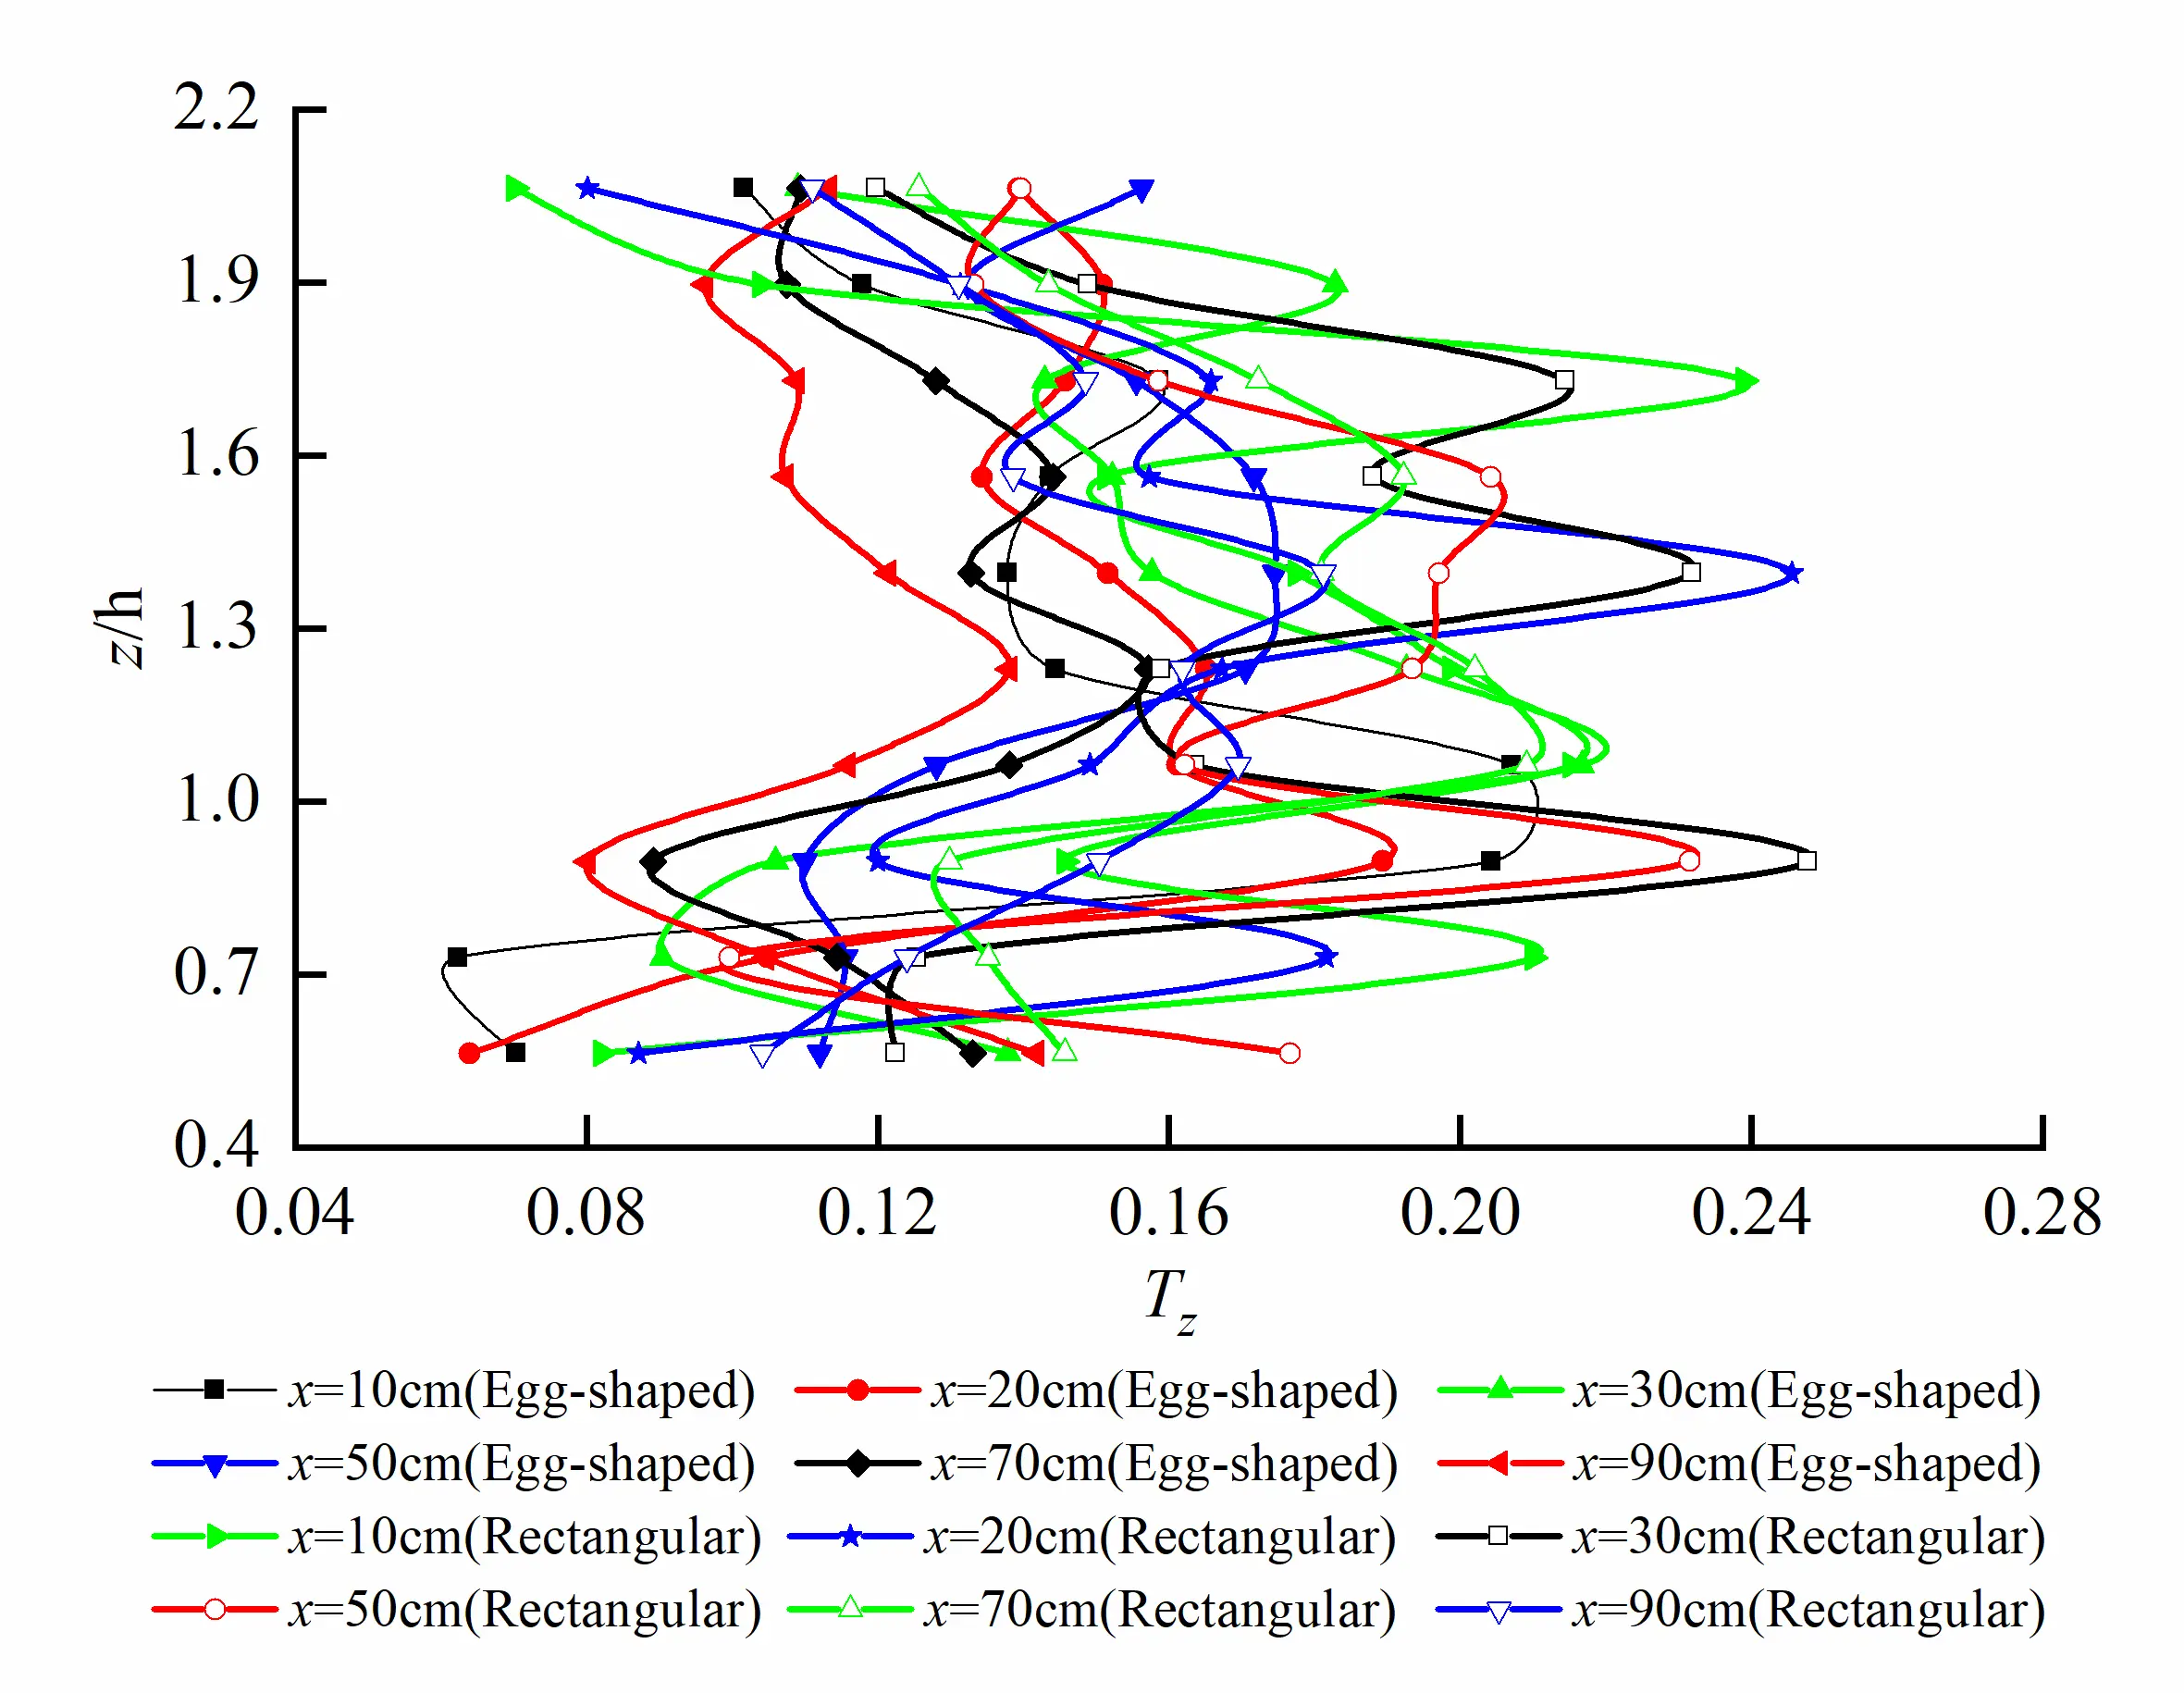
Turbulence intensity Tz distribution on the different longitudinal profiles for egg-shaped and rectangular orifices under the same water level is shown in Figure 14. As can be seen that a certain variation trend in turbulence intensity on the longitudinal profile of egg-shaped orifice exists, exhibiting occurrence of considerable two peaks and saddle-shaped distribution, and the peaks located at the interface between orifice and non-orifice regions and the troughs at l/2. However, for a rectangular orifice, the fluctuation of turbulence intensity is larger, and the multiple peaks occur and reaches the maximum value at l/2. On the longitudinal profile at the long axis of the orifice, the peak values of Tz for egg-shaped and rectangular orifices are 27.60% and 41.33%, respectively. Turbulence intensity of the egg-shaped orifice is lower by 33.23% than that of the rectangular orifice; on the longitudinal profile at b/4 of the orifice, the peak values of Tz for egg-shaped and rectangular orifices are 21.67% and 26.51%, respectively. Egg-shaped turbulence intensity is lower, 18.26% than that of the rectangular one.
 |
|
(a) |
 |
|
(b) |
Figure 14. Tz distribution on different longitudinal profiles for egg-shaped and rectangular orifices (Saddle-shaped distribution for egg-shaped orifice, and multiple peaks for rectangular one). (a) Tz distribution on the longitudinal profile at long axis of orifice; (b) Tz distribution on the longitudinal profile at b/4 of the orifice.
3.5. Reynolds Stress
Reynolds stresses on xoy plane, xoz plane, and yoz plane can be respectively written as
| ```latex\eta \left(u,v\right)=-\frac{\overline{{u}^{\prime}{v}^{\prime}}}{{U}^{2}}``` |
(9) |
| ```latex\eta \left(u,w\right)=-\frac{\overline{{u}^{\prime}{w}^{\prime}}}{{U}^{2}}``` |
(10) |
| ```latex\eta \left(v,w\right)=-\frac{\overline{{v}^{\prime}{w}^{\prime}}}{{U}^{2}}``` |
(11) |
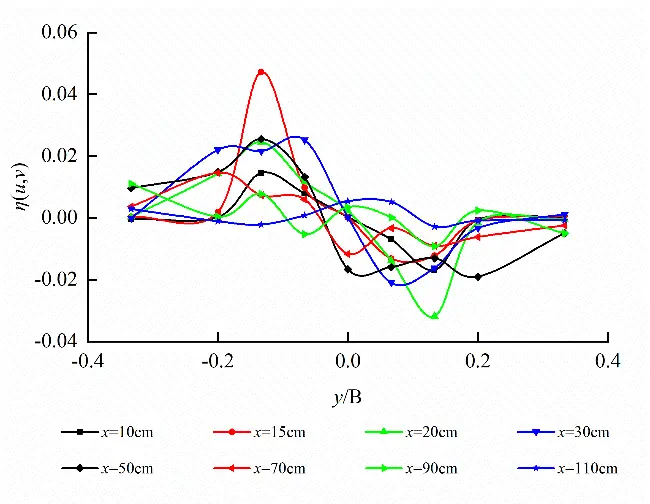
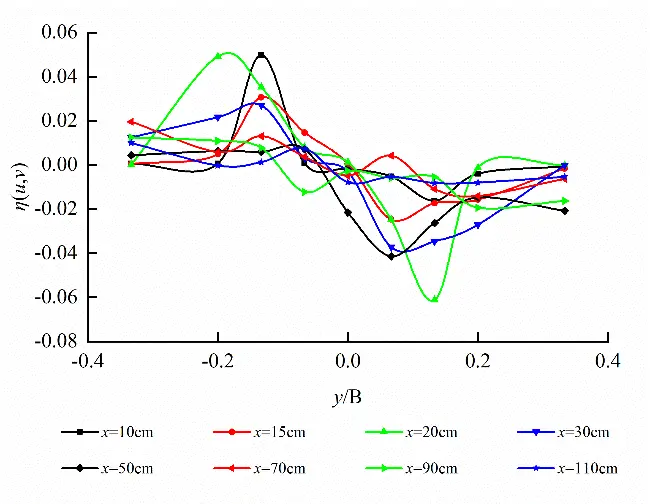
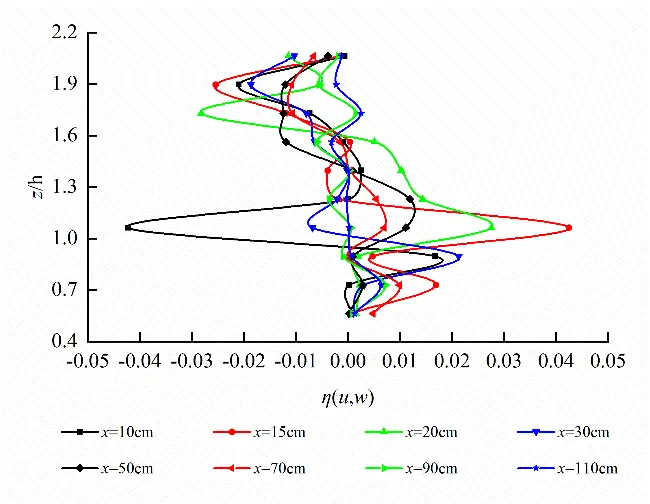
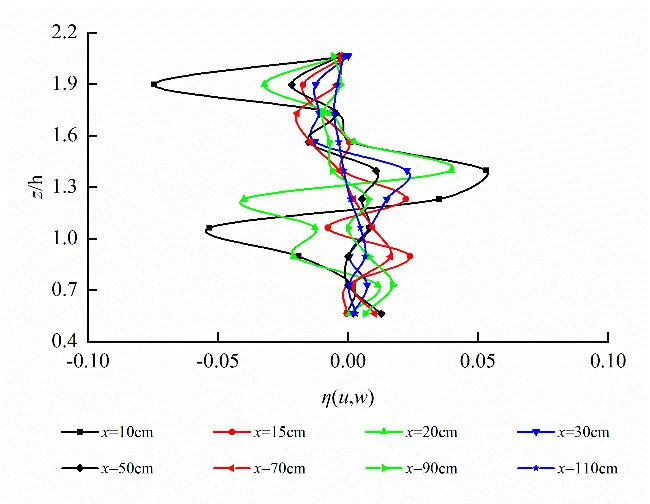
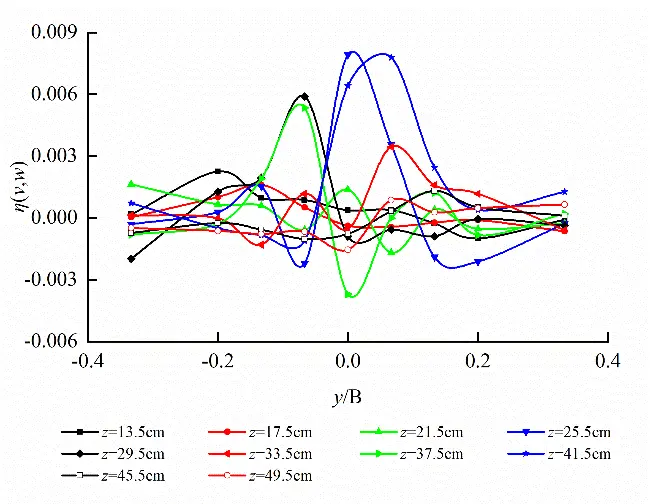
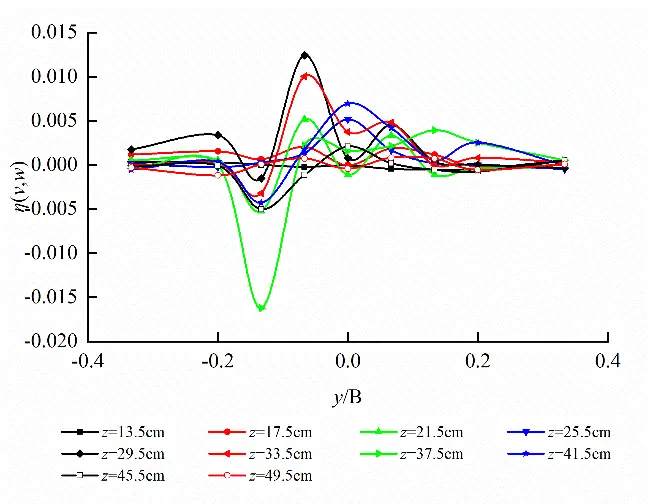
Horizontal plane (z = 32.5 cm) at short axis and longitudinal profile (y = 0 cm) at long axis of egg-shaped orifice as well as cross-section (x = 10 cm) in the front of pool are taken to analyze Reynolds stress distribution on the different characteristic planes as shown in Figure 15. It follows from Figure 15 that Reynolds stress in egg-shaped orifice region is greater than that in the non-orifice region, Reynolds stress on the horizontal plane reaches peak value at left and right edges of orifice, Reynolds stress on the longitudinal profile develops along vertical direction and reaches peak value at the focal point of lower semi-ellipse, the larger Reynolds stress also occurs close to the bottom of pool, and the broader variation amplitude in Reynolds stress in the orifice region on the cross-section exists. Under the condition of the same water level in the pool, the distribution of Reynolds stress in the rectangular orifice is roughly the same as that in the egg-shaped orifice. On the horizontal plane, the maximum values are attained at the left and right edges of the orifices, and the trends of Reynolds stress curves are similar. On the longitudinal profile and the cross-section, the Reynolds stress fluctuates intensely. On the whole, Reynolds stress within the egg-shaped and rectangular orifice regions is greater than that in the non-orifice region.
Also, on the horizontal plane (z = 32.5 cm) at short axis, the peak values of Reynolds stress η(u,v) for egg-shaped and rectangular orifices are 0.04719 and 0.04978, respectively. Reynolds stress of egg-shaped orifice is lower 5.203% than that of rectangular orifice; on the longitudinal profile (y = 0 cm) at long axis, the peak values of Reynolds stress η(u,w) for egg-shaped and rectangular orifices are 0.04251 and 0.07456, respectively. Reynolds stress of egg-shaped orifice is lower 42.986% than that of rectangular orifice; on the cross-section (x = 10 cm) in the front of the pool, the peak values of Reynolds stress η(v,w) for egg-shaped and rectangular orifices are 0.00792 and 0.01242, respectively. Reynolds stress of the egg-shaped orifice is lower 36.232% than that of the rectangular orifice.
 |
 |
|
(a) |
(b) |
 |
 |
|
(c) |
(d) |
 |
 |
|
(e) |
(f) |
Figure 15. Reynolds stress distribution on different characteristic planes of egg-shaped and rectangular orifices (Larger Reynolds stress occurring in orifice regions). (a) η(u,v) distribution on the horizontal planeof egg-shaped orifice; (b) η(u,v) on the horizontal plane of rectangular orifice; (c) η(u,w) distribution on the longitudinal profileof egg-shaped orifice; (d) η(u,w) on the longitudinal profileof rectangular orifice; (e) η(v,w) distribution on the cross-section of egg-shaped orifice; (f) η(v,w) on the cross-section of rectangular orifice.
3.6. Auto-Correlation Coefficient of Velocity Fluctuation
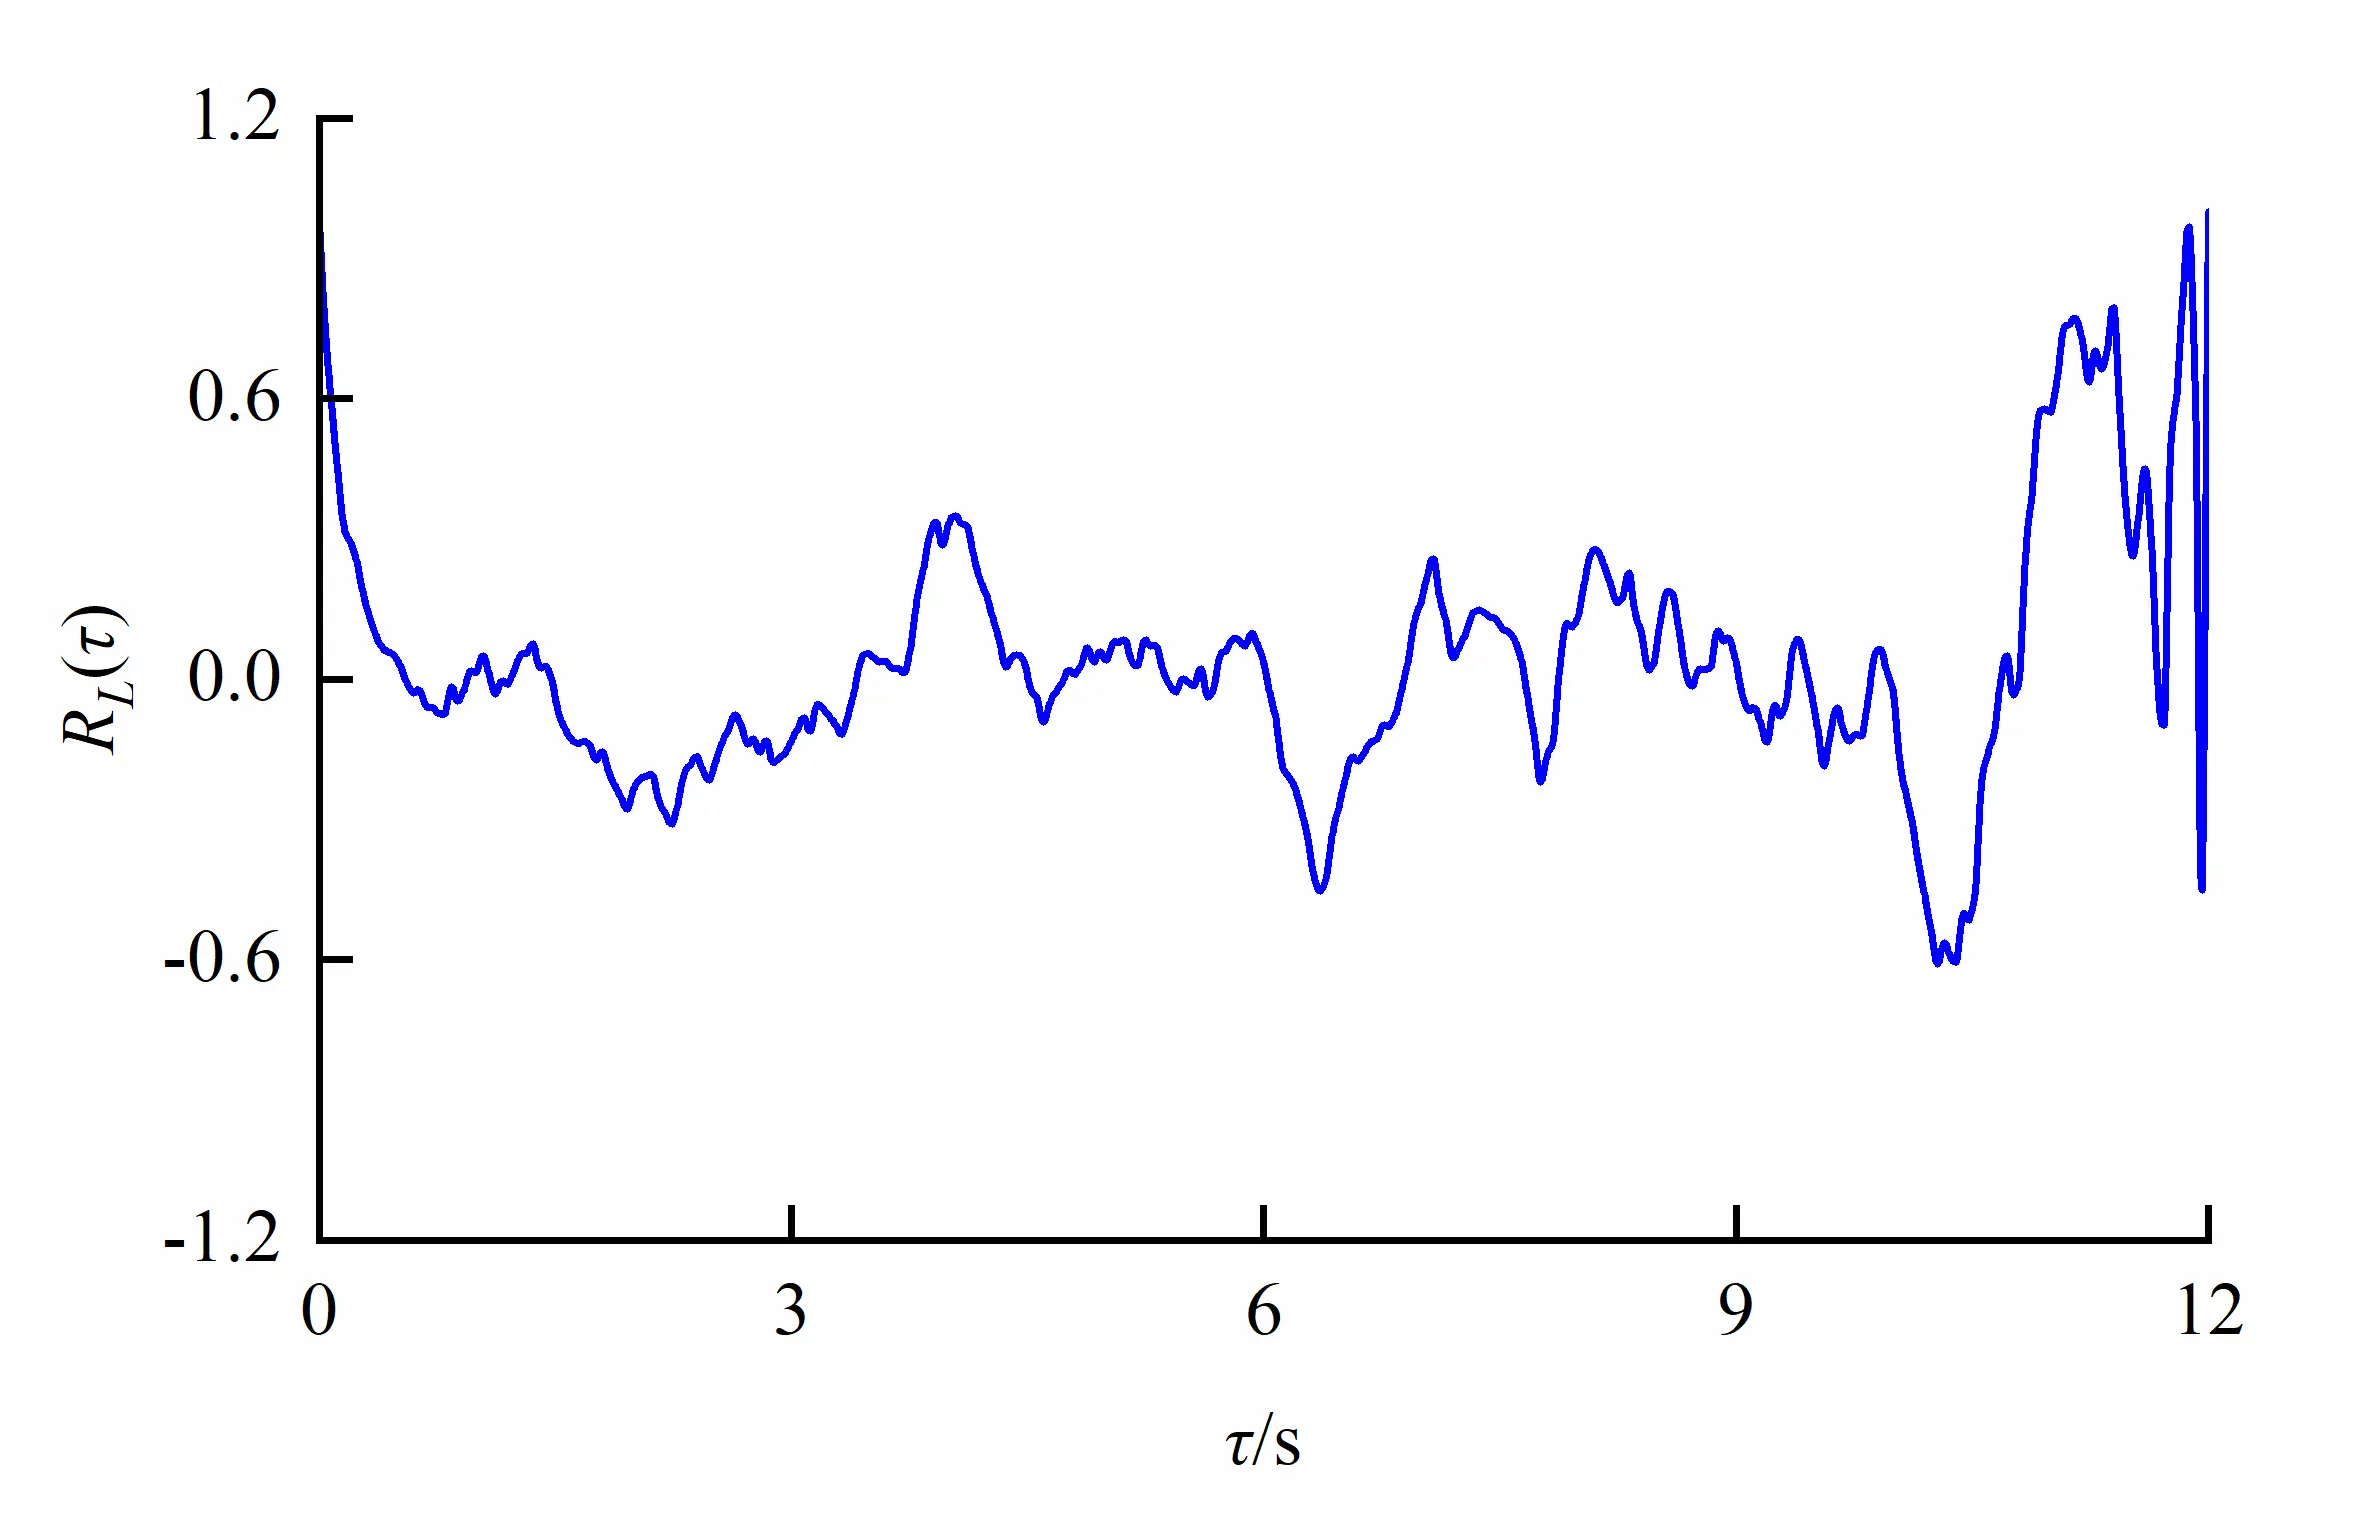
The correlation coefficient between two fluctuating components with a time interval τ at a certain specific point in the flow field is referred to as the auto-correlation coefficient RL(τ), the auto-correlation coefficient of longitudinal fluctuating velocity at different times can be written as
| ```latexR_L(\tau)=\frac{\overline{{u_\iota}^{\prime}(t){u_\iota}^{\prime}(t+\tau)}}{\sqrt{\overline{{u_\iota}^{\prime2}(t)}}\sqrt{\overline{{u_\iota}^{\prime2}(t+\tau)}}}``` |
(12) |
where u′ denotes the i-direction component of velocity fluctuation.
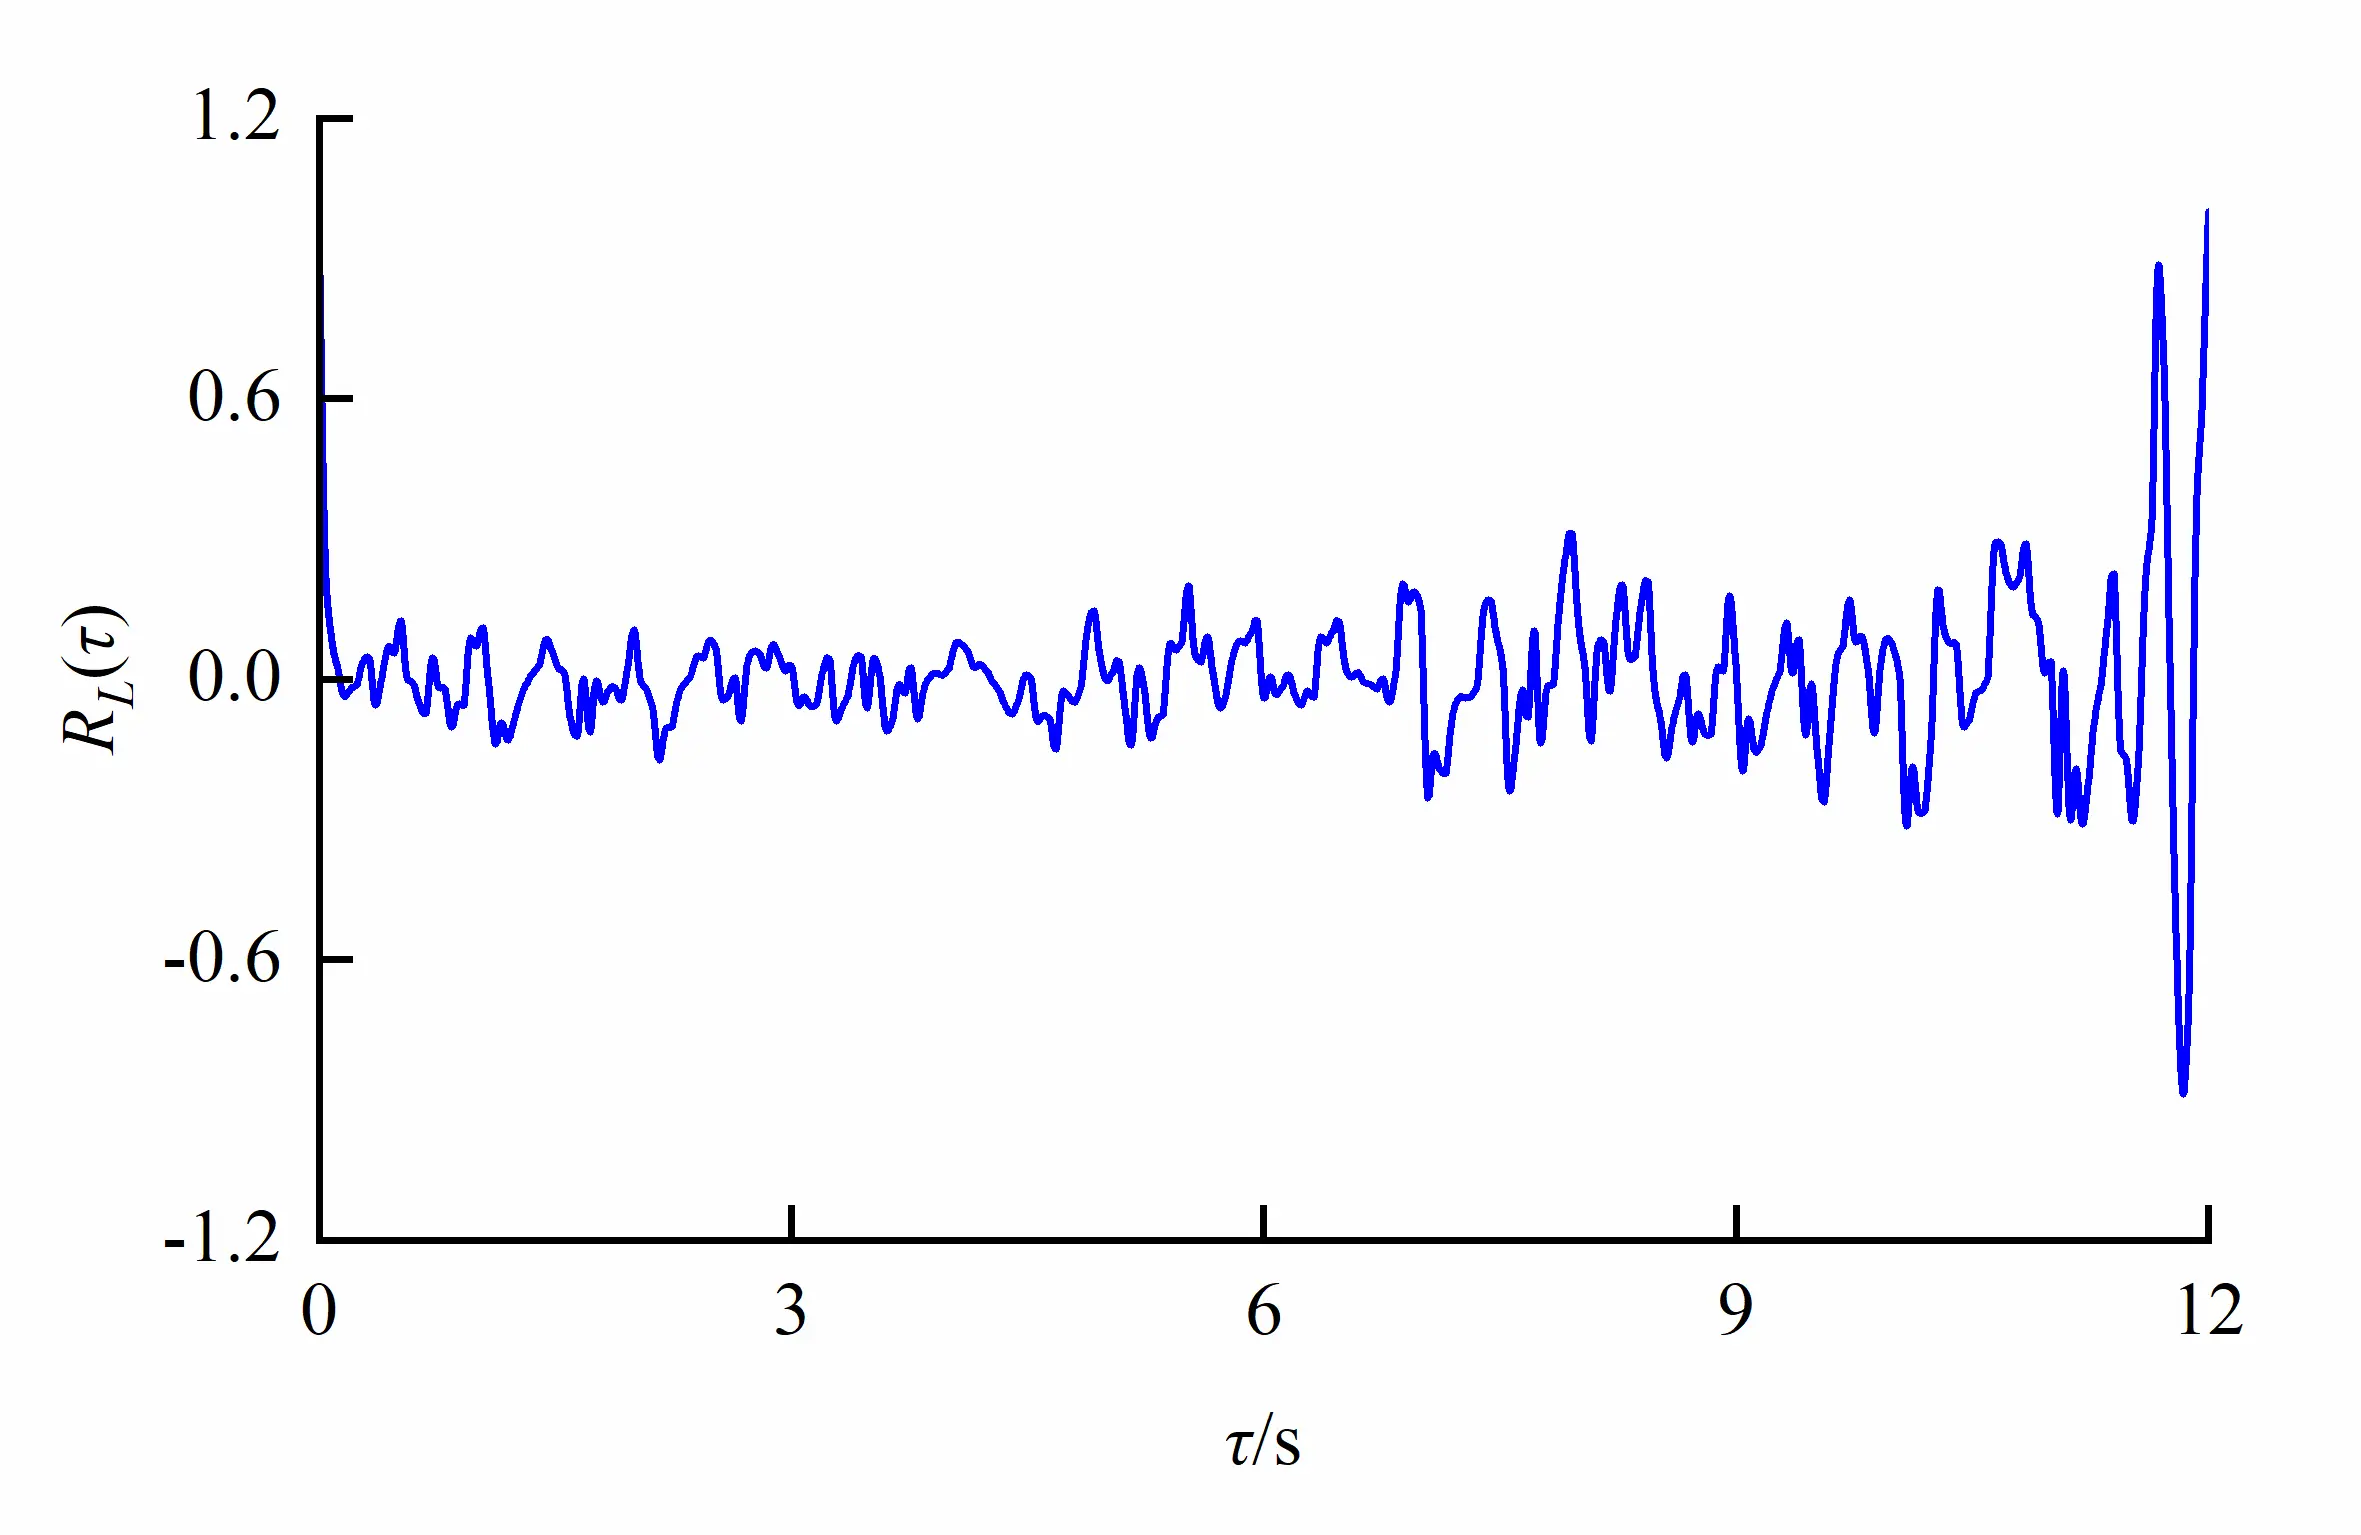
In the main stream region, two characteristic points (x, y, z) = (10.0 cm, 0.0 cm, 32.5 cm) in orifice region and (x, y, z) = (10.0 cm, 12.0 cm, 32.5 cm) in non-orifice region on the horizontal plane at short axis of egg-shaped orifice were taken to analyze the auto-correlation of longitudinal velocity fluctuation as shown in Figure 16. It follows that the auto-correlation cycle of velocity fluctuation in the egg-shaped orifice region is shorter. The cycle in the non-orifice region is longer and the amplitude is also larger, so the correlation is better because the velocity in the orifice region is faster and the turbulence is intense, resulting in the shorter cycle and the lower amplitude of the velocity fluctuation auto-correlation.
 |
|
(a) |
 |
|
(b) |
Figure 16. Auto-correlation coefficient of velocity fluctuation in different regions of egg-shaped orifice (Shorter cycle and lower amplitude). (a) Orifice region; (b) Non-orifice region.
3.7. Turbulence Scales
3.7.1. Microscale
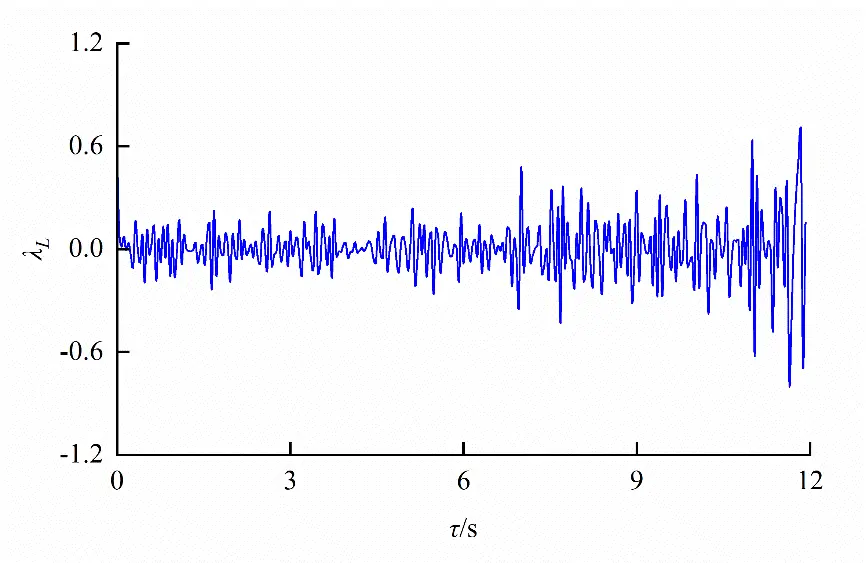
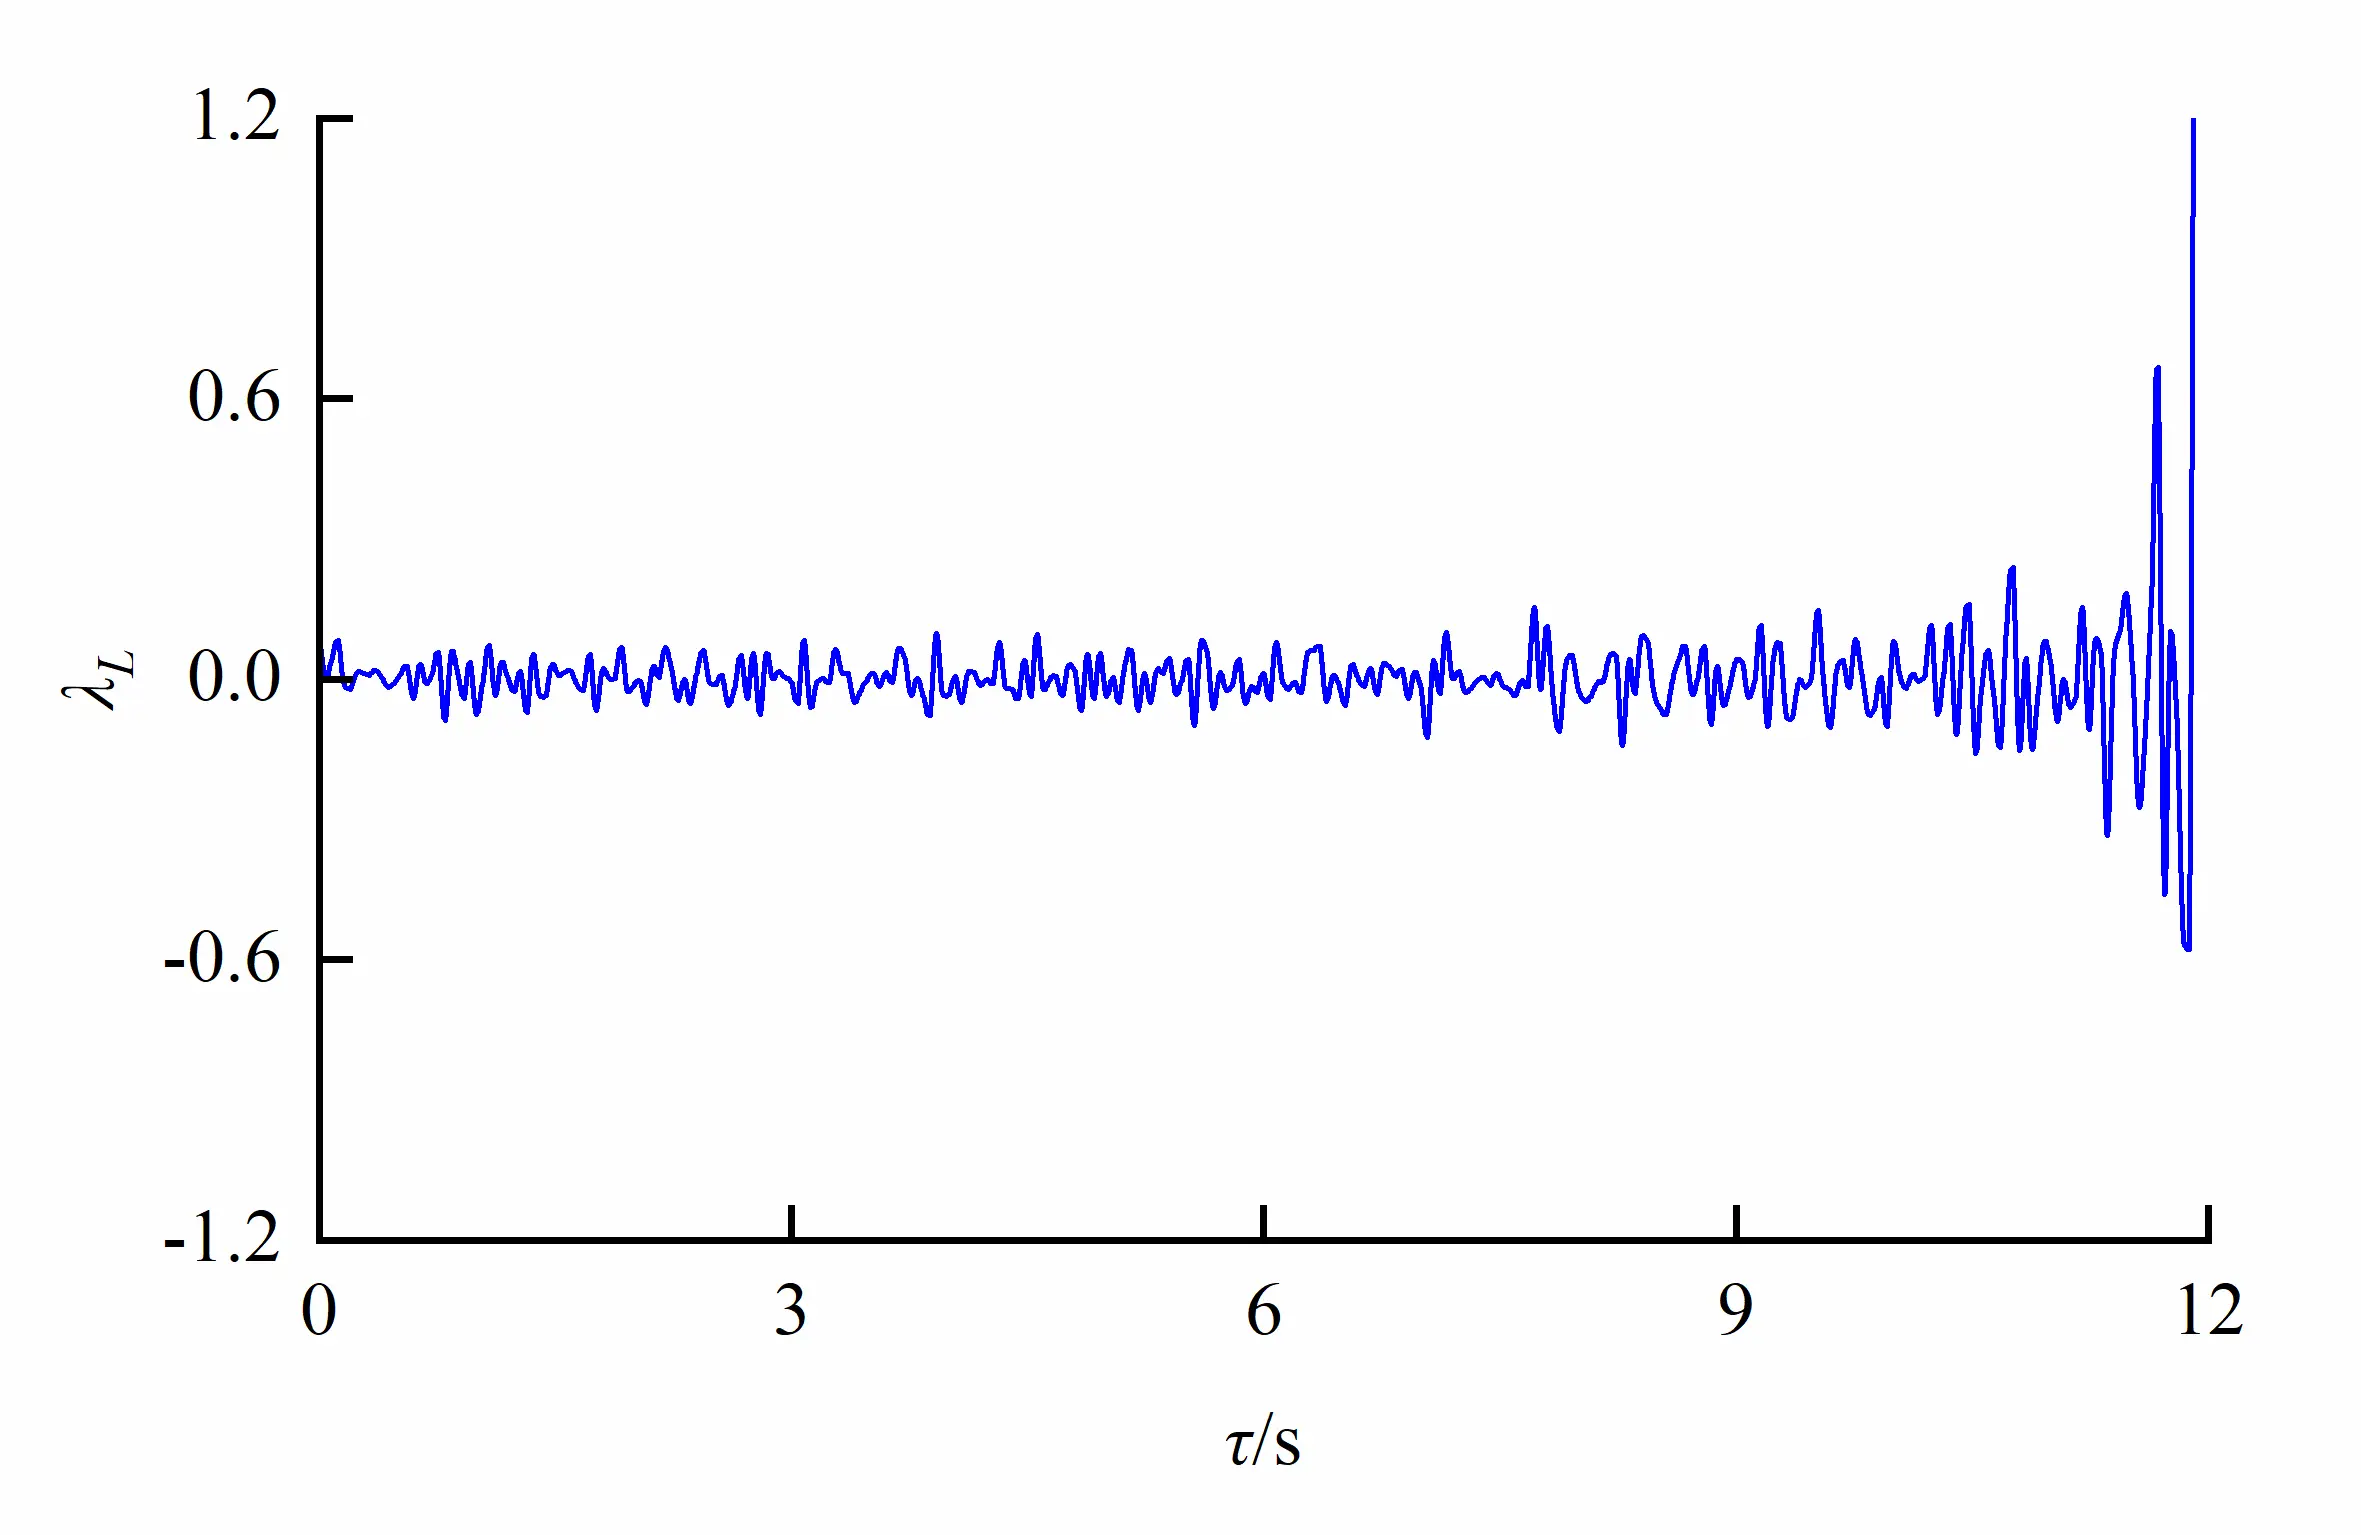
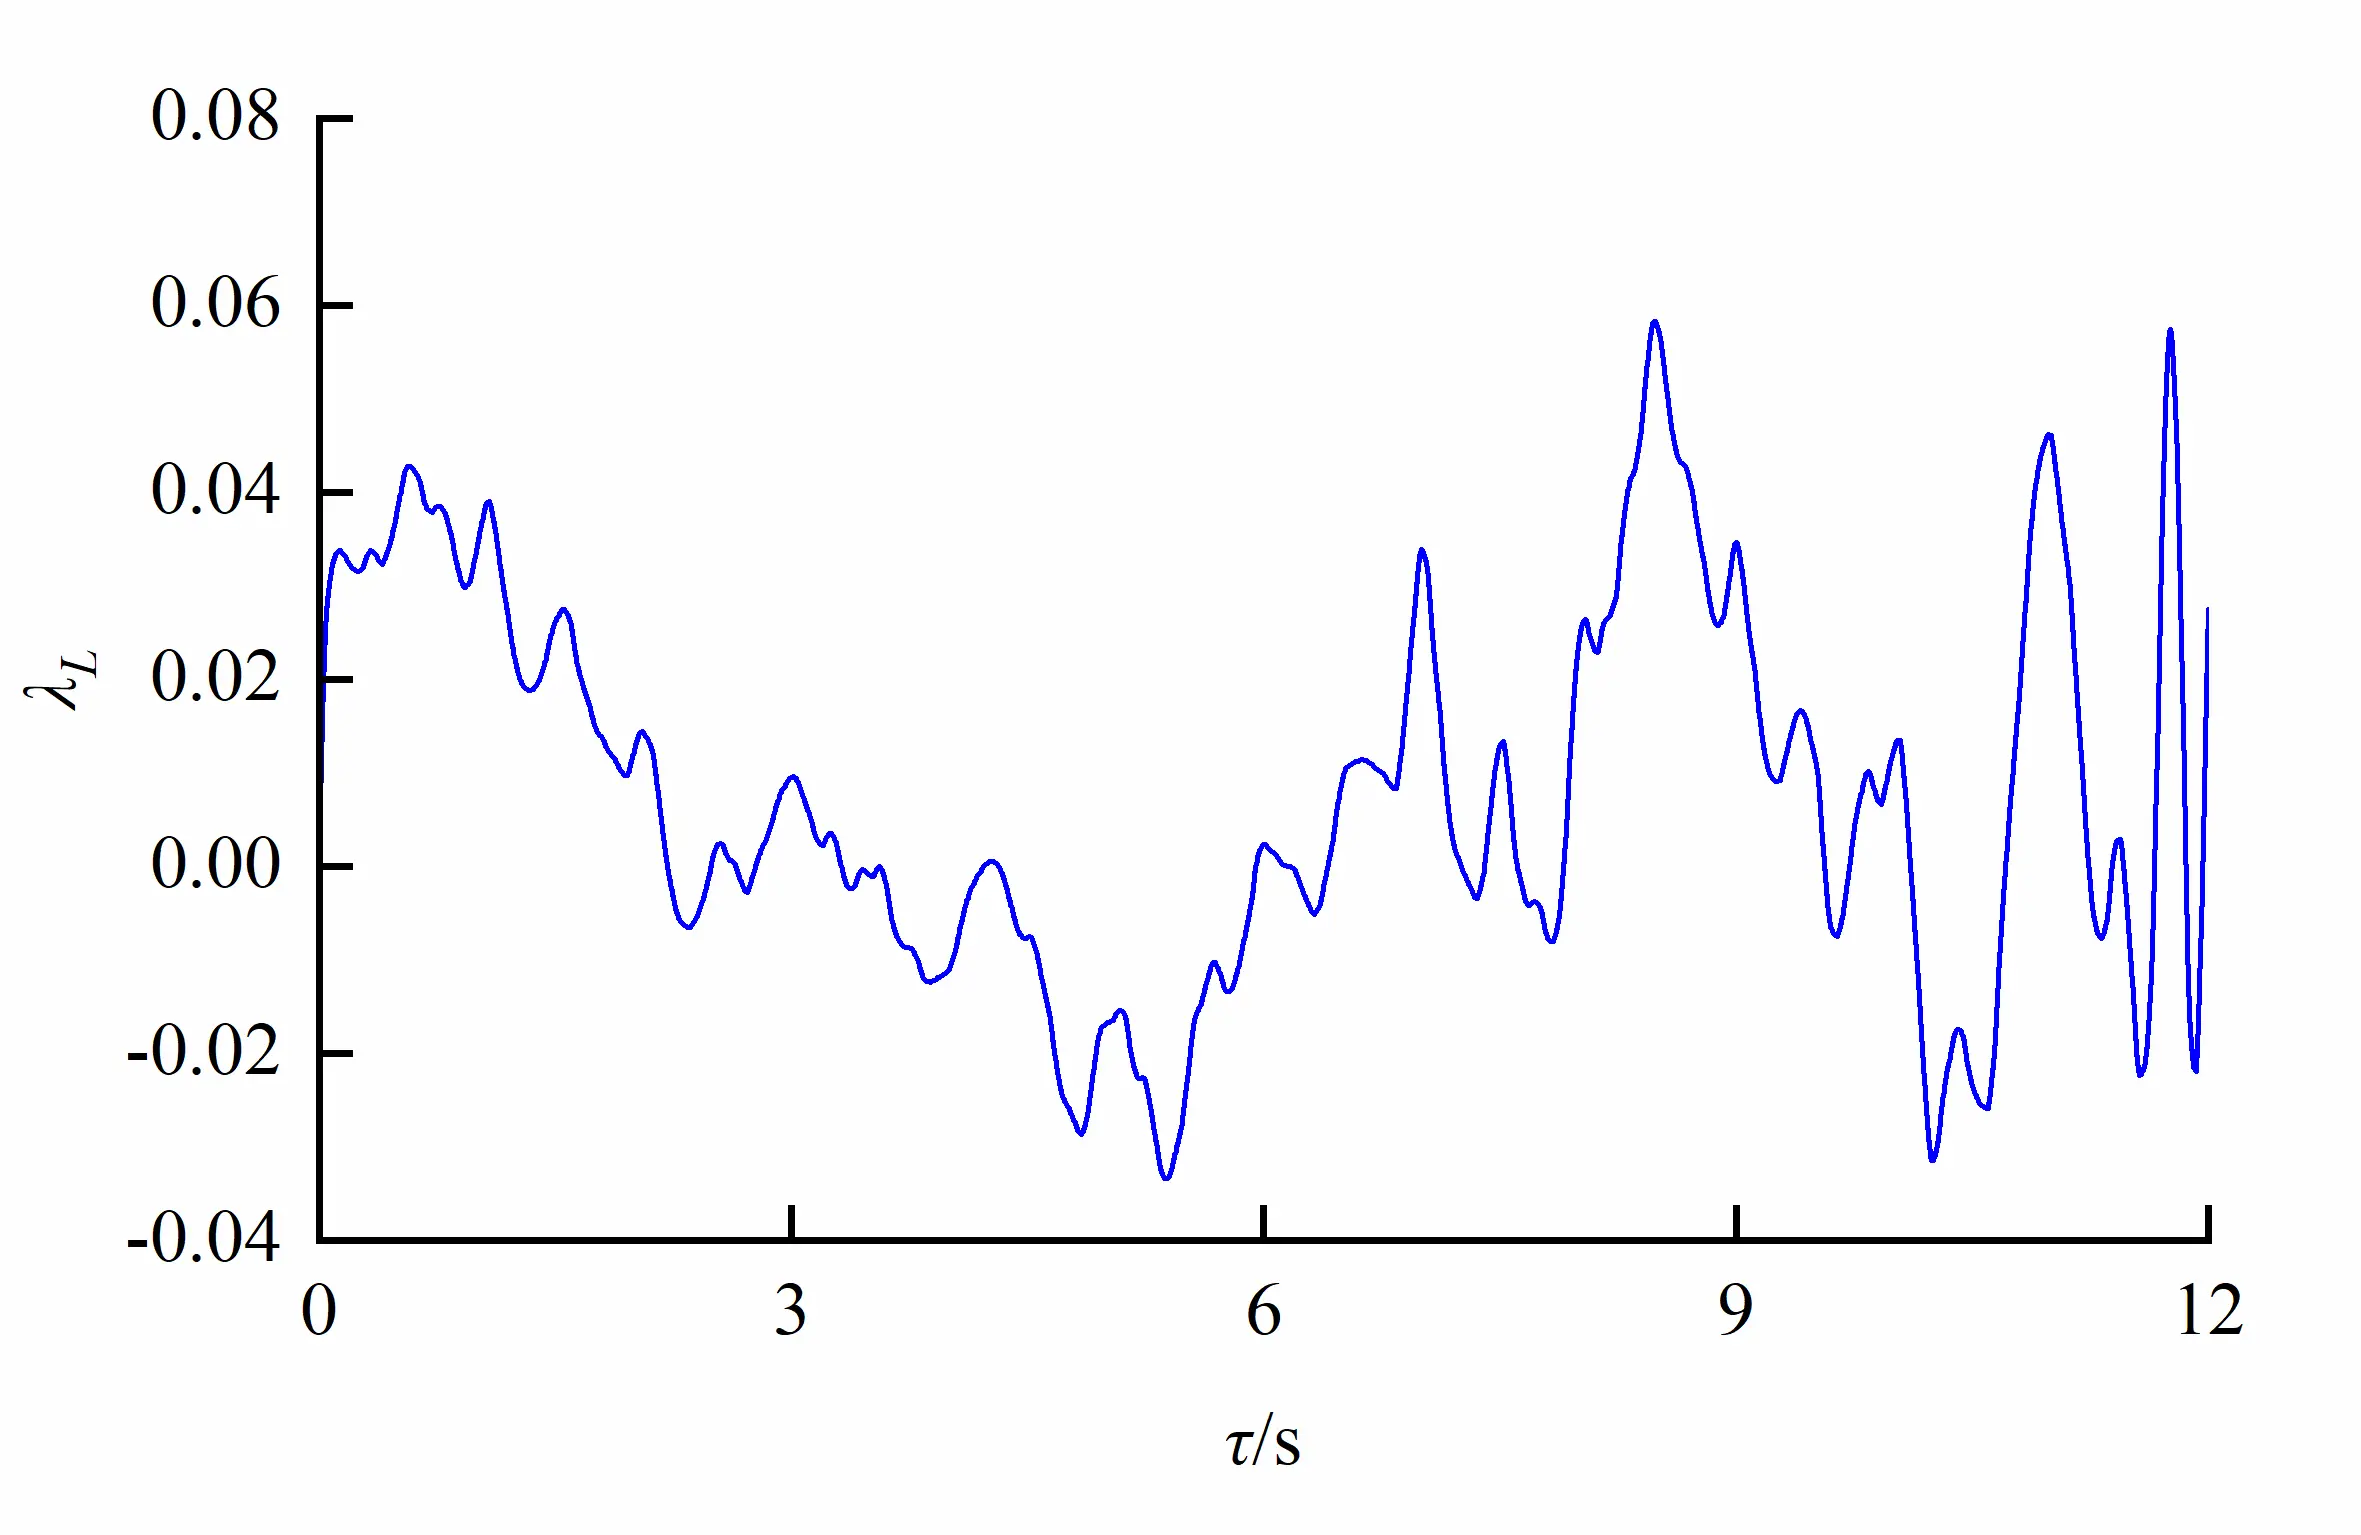
Taking a second-order derivative of auto-correlation coefficient with regard to time, we can have the corresponding micro time scale λL, which is a measure of micro eddy to cause velocity fluctuation and is associated with dissipative eddies. It can be expressed as
|
```latex{\lambda }_{L}=\frac{1}{{{\tau }_{L}}^{2}}=-\frac{1}{2}{\left[\frac{{\partial }^{2}{R}_{L}}{{\partial t}^{2}}\right]}_{t=0}``` |
(13) |
where τL denotes the Lagrangian time interval. The characteristic points (x, y, z) = (10.0 cm, 0.0 cm, 32.5 cm) in orifice region and (x, y, z) = (10.0 cm, 12.0 cm, 32.5 cm) in non-orifice region were taken to analyze the microscales as shown in Figure 17. It follows that the size of eddy in the egg-shaped orifice region is larger than that in the non-orifice, and eddies in the non-orifice region vary little with time in the case of the larger flow rate. Fish could benefit from larger microscale eddies within the orifice region, and could also benefit from the vortex energy in the form of a ski-jump among the vortices, and could reduce the muscle activity. Also, fish could utilize vortex zones to minimize its energy expenditure.
 |
|
(a) |
 |
|
(b) |
Figure 17. Turbulencemicroscalein different regions due to an egg-shaped orifice (Larger eddy within the orifice region). (a) Orifice region; (b) Non-orifice region.
3.7.2. Integral Scale
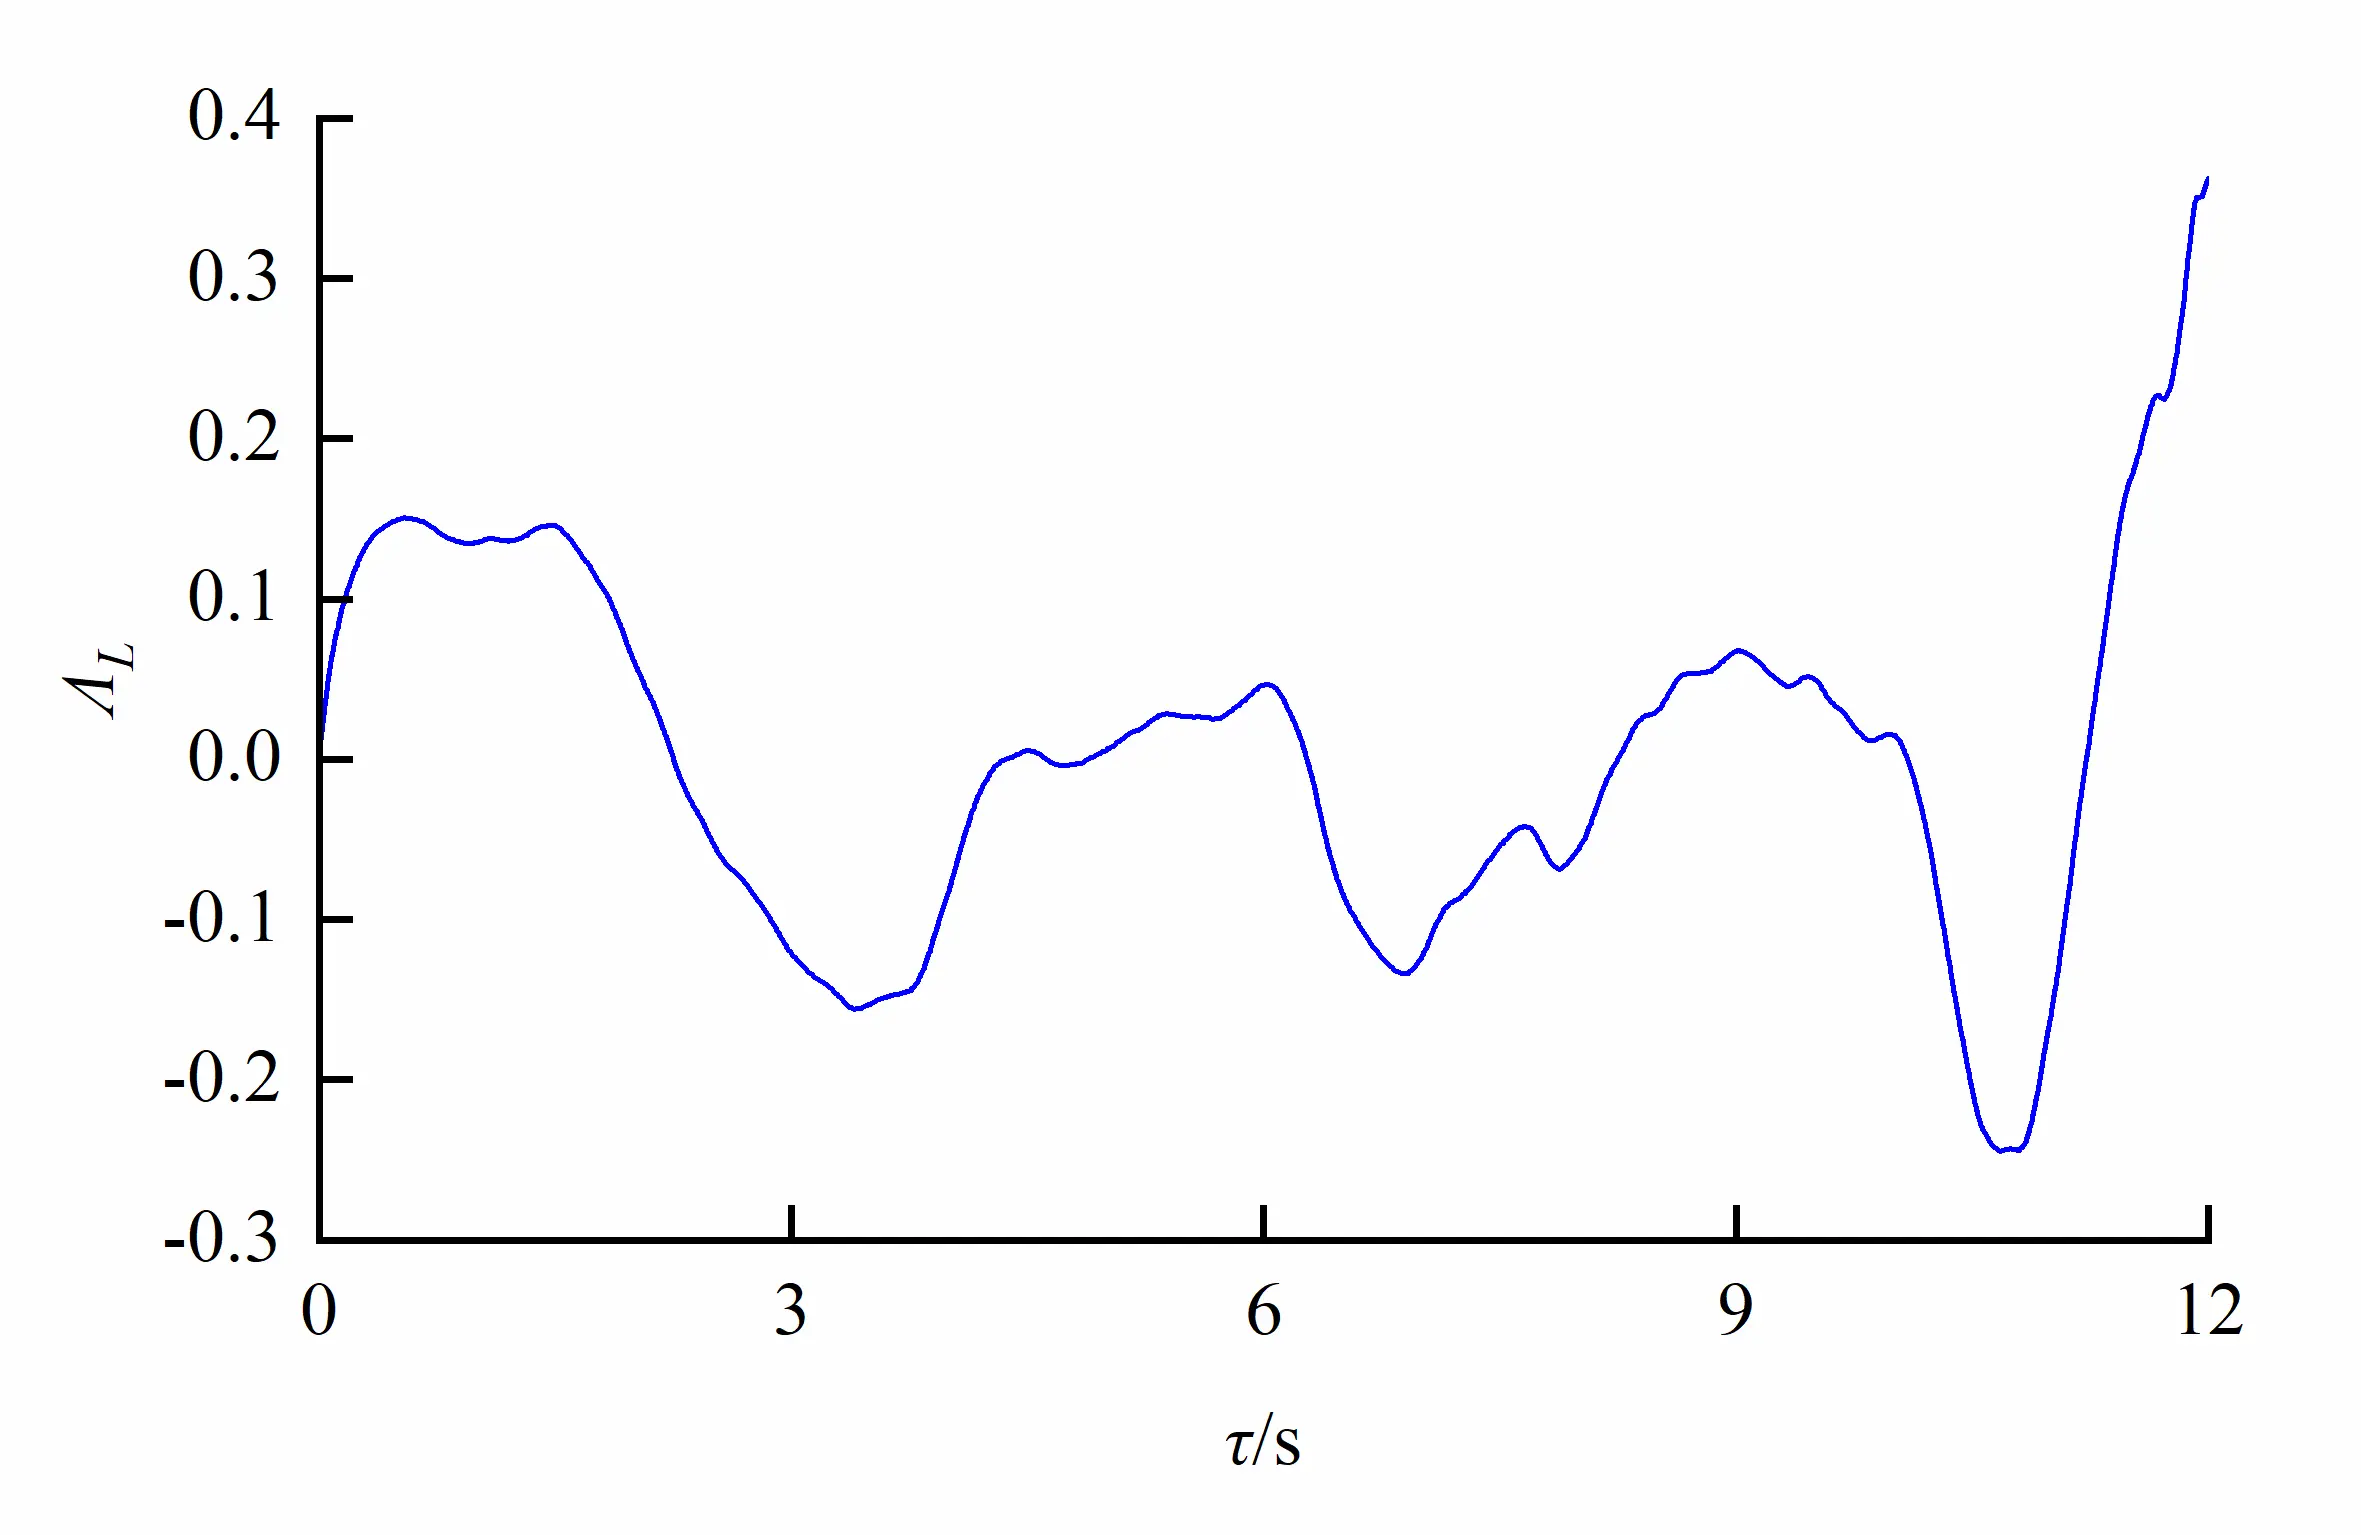
Integrating the auto-correlation coefficient with regard to time, we can obtain the corresponding integral time scale ΛL, which measures the average size of coherent eddies in a turbulent flow field, and it approximates the size of the energy-containing eddies that fish may exploit or avoid, it can be written as
|
```latex{\mathrm{\Lambda }}_{L}={\int }_{0}^{\tau }{R}_{L}\left(t\right)dt``` |
(14) |
The same characteristic points (x, y, z) = (10.0 cm, 0.0 cm, 32.5 cm) in orifice region and (x, y, z) = (10.0 cm, 12.0 cm, 32.5 cm) in non-orifice region were taken to analyze the integral scale as shown in Figure 18. We can see from the figure that mean scale of eddy in the non-orifice region is larger than that in the orifice region, and the cycle is obvious, eddy grows better in the flow field. The curve in the orifice region fluctuates intensely, and the cycle is smaller. Totally, eddies in the orifice region vary apparently in mean scale; the cycle is smaller, and eddies develop in the non-orifice region.
 |
|
(a) |
 |
|
(b) |
Figure 18. Integral scale of turbulence in different regions due to an egg-shaped orifice (Eddies within orifice region vary in integral scale). (a) Orifice region; (b) Non-orifice region.
3.8. Frenquency-Spectrum Characteristics of Velocity Fluctuation
The frequency spectrum of velocity fluctuation reflects the distribution of fluctuating energy in the frequency domain. It can be expressed as
|
```latexG\left(f\right)=\frac{2}{T}\left|{F}_{n}\left(f,T\right)\right|``` |
(15) |
where G(f) denotes the power spectrum , denotes sample size, taking 1024, sampling time step, Nyquist frequency; the Fourier transformation of the instantaneous velocity series, and series number.
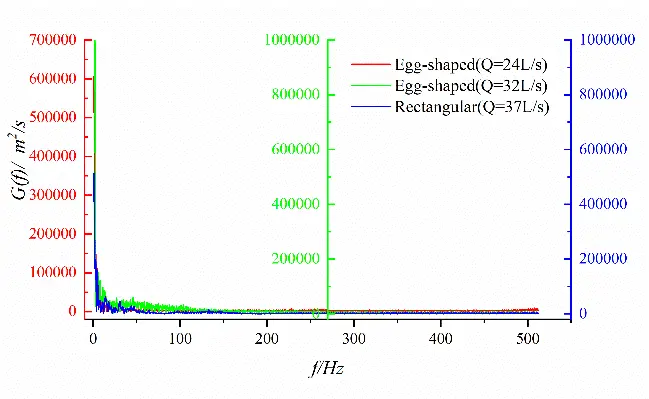
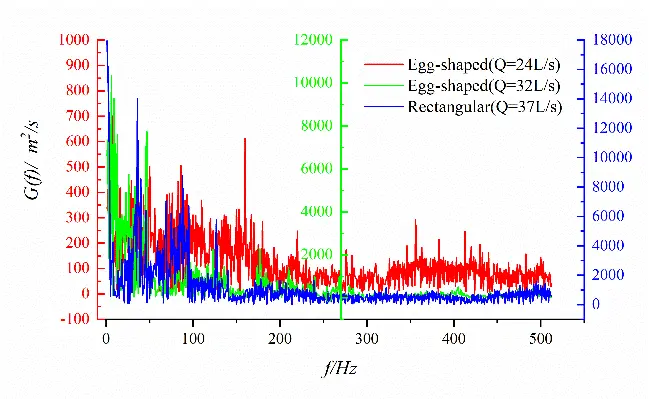
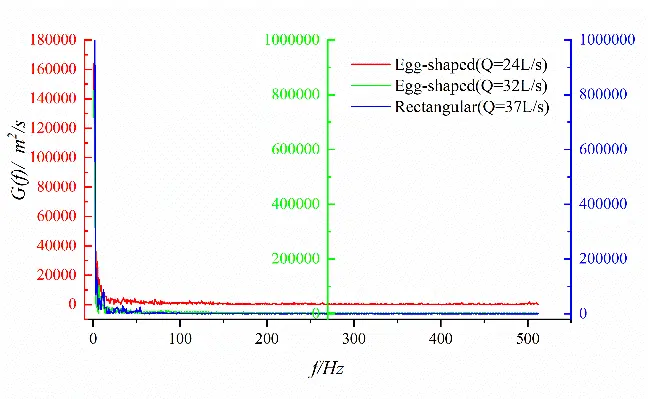
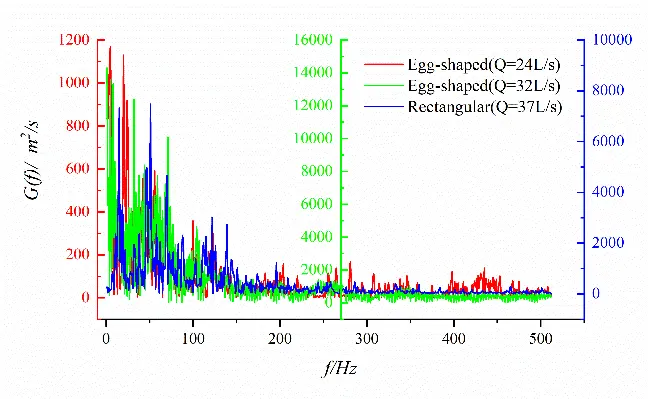
The power spectra of longitudinal and transverse velocity fluctuations at a specific measurement point (x, y, z) = (90.0 cm, 0.0 cm, 37.5 cm) in the shear layer downstream of the orifice are analyzed. As shown in Figure 19, both the longitudinal and transverse velocity spectra exhibit dominant frequencies in the low-frequency domain (f < 50 Hz). The fluctuating energy gradually decreases with a decrease in the amplitude of the power spectrum. In contrast, the transverse velocity spectrum exhibits multiple distinct peaks.
 |
 |
|
(a) |
(b) |
Figure 19. Spectral characteristics of velocity fluctuation at specific points (x/L = 0.50) for egg-shaped and rectangular orifices. (a) Longitudinal velocity fluctuation; (b) Transverse velocity fluctuation.
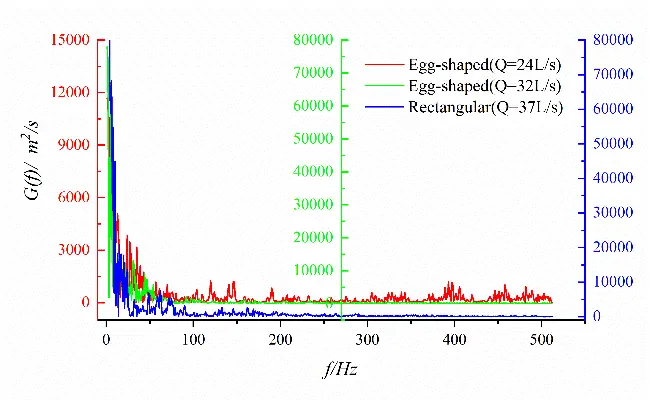
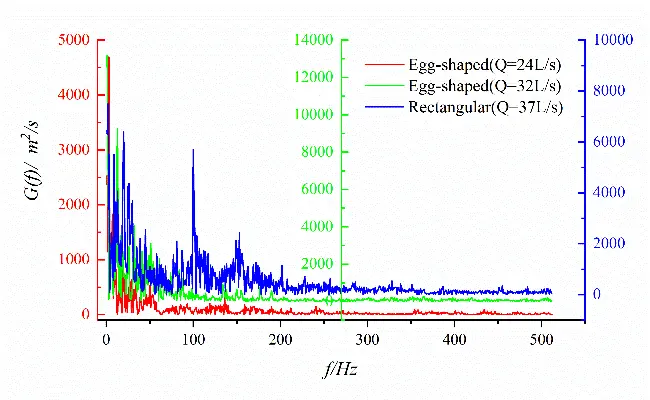
Figure 20 shows the spectral characteristics of velocity fluctuation at different measurement points on the horizontal plane of the short axis of the egg-shaped orifice. It can be seen that the power spectra of transverse velocity fluctuations at different locations exhibit multiple identifiable peaks than that of longitudinal velocity fluctuations, and multiple Strouhal numbers exist in the flow field, however, without a single predominant value. Vortex shedding of different sizes mutually couple in the flow field, indicating a more complex phenomenon than the regular Karman vortex Street. It follows that the egg-shaped orifice exhibits fewer discernible spectral peaks compared to the rectangular orifice, which means its vortex shedding may be of stronger coherence and periodicity.
 |
 |
|
(a) |
(b) |
 |
 |
|
(c) |
(d) |
 |
 |
|
(e) |
(f) |
Figure 20. Spectral characteristics of velocity fluctuations at different points for egg-shaped and rectangular orifices. (a) Longitudinal velocity fluctuation (x/L = 0.28); (b) Transverse velocity fluctuation (x/L = 0.28); (c) Longitudinal velocity fluctuation (x/L = 0.39); (d) Transverse velocity fluctuation (x/L = 0.39); (e) Longitudinal velocity fluctuation (x/L = 0.50); (f) Transverse velocity fluctuation (x/L = 0.50).
4. Conclusions
Through the experimental study on the turbulent characteristics of an egg-shaped orifice fishway and a comparison with a rectangular orifice, and based on the statistical theory of turbulence, we can draw some conclusions as follows:
- (1)
-
After issuing from the egg-shaped orifice, the three-dimensional turbulent jet was formed. Under the same test conditions, the maximum longitudinal velocity for the egg-shaped orifice decays faster than that for the rectangular orifice along the flow direction.
- (2)
-
The longitudinal velocity on the horizontal plane of the egg-shaped orifice was approximately Gaussian distribution, but different from the two-dimensional plane jet, which was apparently characterized by three-dimensionality. The longitudinal velocity on the longitudinal profile exhibited saddle-shaped distribution. The transverse velocity exhibited a downward concave in the upper semi-circle of the egg-shaped orifice and an upward convex in the lower semi-ellipse, while variation in the transverse velocity was smaller for the rectangular orifice. The same variation trend in vertical velocity for the egg-shaped and rectangular orifices existed, and the vertical vortices occurred on the two sides of the orifices.
- (3)
-
Turbulence intensity on the horizontal plane reached the extreme values on the two sides of the egg-shaped orifice, while for the rectangular orifice, besides the two sides of the orifice, the largest turbulence intensity also occurred at the long axis of the orifice. Turbulence intensity on the longitudinal profile of the egg-shaped orifice exhibited a saddle-shaped distribution.
- (4)
-
Reynolds stress in the egg-shaped orifice region was larger than that in the non-orifice region, reaching peak values at the edges of the orifice on the horizontal plane and at the focal point of the lower semi-ellipse, and vertically spread on the longitudinal profile. The larger Reynolds stress also occurred on the pool bottom, and the larger changing amplitude of Reynolds stress existed in the orifice region on the cross-section. The variation in Reynolds stress in the rectangular orifice is roughly the same as that in the egg-shaped orifice.
- (5)
-
The amplitude of the fluctuating velocity autocorrelation coefficient in the orifice region was smaller than that in the non-orifice one, and the cycle was shorter. The scale of the eddy in the orifice region was larger than that in the non-orifice one, and it decreased with an increase in flow rate. The mean scale of eddy in the orifice region greatly varied with the increase in flow rate, and the cycle was shorter. And eddy spread in the non-orifice region.
- (6)
-
Both the longitudinal and transverse velocity spectra exhibit dominant frequencies in the low-frequency domain (f < 50 Hz). Fluctuating energy gradually decreases as the amplitude of the power spectrum decreases. The power spectra of transverse velocity fluctuations at different locations exhibit multiple identifiable peaks than that of longitudinal velocity fluctuations. Vortex shedding is of stronger coherence and periodicity.
This study is preliminary, focusing on turbulence characteristics of an egg-shaped orifice fishway. In the future, the authors will combine the current observed turbulence characteristics with fish behavior through fish tests, and make a comparison of fish preference between egg-shaped and rectangular orifices. The authors will apply these experimental results to the practical fishway or improve fishway design.
Acknowledgments
We would like to express our sincere grateful to C. Liu for his assistance during the experimentation.
Author Contributions
Conceptualization, Z.D.; Methodology, L.C.; Software, L.C. and Z.H.; Validation, Z.G., Z.H. and Z.D.; Formal Analysis, L.C.; Investigation, L.C.; Resources, Z.D. and Z.G.; Data Curation, Z.D.; Writing—Original Draft Preparation, L.C.; Writing—Review & Editing, L.C. and Z.G.; Visualization, L.C. and Z.H.; Supervision, Z.D. and Z.G.
Ethics Statement
Not applicable.
Informed Consent Statement
Not applicable.
Data Availability Statement
The data that support the findings of this study are available from the corresponding author upon reasonable request.
Funding
This study was financially supported by the National Natural Science Foundation of China (NSFC) [grant number 51779225].
Declaration of Competing Interest
The authors declare that they have no known competing financial interests or personal relationships that could have appeared to influence the work reported in this paper.
References
-
Wang Q, Han Y, Li P, Zhang W, Wang Y, Xi Y. Ecohydraulic modelling to evaluate cascade dam construction impact and support fish habitat restoration. Ecol. Eng. 2023, 192, 106974. doi:10.1016/j.ecoleng.2023.106974. [Google Scholar]
-
Mao X. Review of fishway research in China. Ecol. Eng. 2018, 115, 91–95. doi:10.1016/j.ecoleng.2018.01.010. [Google Scholar]
-
Sály P, Sallai M, Sallai Z. Effectiveness of fishways on the Pinka Stream and the Rába River, Central Europe: An evaluation with species from the order Cypriniformes. River Res. Appl. 2024, 40, 1183–1194. doi:10.1002/rra.4285. [Google Scholar]
-
Quaresma AL, Romao F, Pinheiro AN. A comparative assessment of Reynolds averaged Navier-Stokes and large-eddy simulation models: Choosing the Best for Pool-Type Fishway Flow Simulations. Water 2025, 17, 686. doi:10.3390/w17050686. [Google Scholar]
-
Seidl G, Schneider J. Comparative biotic monitoring of a modified Denil fishway and a pool and weir fishway on a small tributary in the upper trout region. Water 2023, 15, 2322. doi:10.3390/w15132322. [Google Scholar]
-
Dodd JR, Cowx IG, Bolland JD. Efficiency of a nature-like bypass channel for restoring longitudinal connectivity for a river-resident population of brown trout. J. Environ. Manag. 2017, 204, 318–326. doi:10.1016/j.jenvman.2017.09.004. [Google Scholar]
-
Dong Z, Yu J, Huang Z. An Experimental Study of Turbulent Structures in Combined Fishway of Overflow Weir and Vertical Slot. Adv. Water Sci. 2021, 32, 279–285. doi:10.14042/j.cnki.32.1309.2021.02.013. (In Chinese) [Google Scholar]
-
Dong Z, Tong J, Huang Z. Turbulence characteristics in a weir-orifice-slot combined fishway with an identical layout. J. Turbul. 2022, 23, 327–351. doi:10.1080/14685248.2022.2071431. [Google Scholar]
-
Zhang D, Xu Y, Deng J, Shi X, Liu Y. Relationships among the fish passage efficiency, fish swimming behavior and hydraulic properties in a vertical slot fishway. Fisher. Manag. Ecol. 2024, 31, e12681. doi:10.1111/fme.12681. [Google Scholar]
-
Laia M, Quadroni S, Brignone S. Assessment of the effectiveness and efficiency of two fishways with vertical slot openings in an Alpine river. Ecol. Eng. 2025, 212, 107535. doi:10.1016/j.ecoleng.2025.107535. [Google Scholar]
-
Katopodis C, Cai L, Johnson D. Sturgeon survival: The role of swimming performance and fish passage research. Fisher. Res. 2019, 212, 162–171. doi:10.1016/j.fishres.2018.12.027. [Google Scholar]
-
Li G, Sun S, Liu H, Zheng T. Schizothoraxprenanti swimming behavior in response to different flow patterns in vertical slot fishways with different slot positions. Sci. Tot. Environ. 2021, 754, 142142. doi:10.1016/j.scitotenv.2020.142142. [Google Scholar]
-
Zheng T, Tu C, Zhang Z, Sun S, Dai H, Li G, et al. Vertical slot fishway design for fluctuating water-level reservoir. J. Hydraul. Res. 2024, 63, 117–125. doi:10.1080/00221686.2024.2436917. [Google Scholar]
-
Shen C, Chen Y, Shi X, Wang M, He S. Turbulent structural analysis of the combined fishway with vertical seam and bottom hole. River Res. Appl. 2024, 40, 425–435. doi:10.1002/rra.4244. [Google Scholar]
-
Wang X, Li Y, He F, Xuan G, Wang B. A study of hydrodynamic characteristics in resting pools of vertical slot fishway. Hydro-Sci. Eng. 2020, 179, 40–50. doi:10.13243/j.cnki.slxb.2009.11.013. (In Chinese) [Google Scholar]
-
Puertas J, Pena L, Teijeiro T. Experimental approach to the hydraulics of vertical slot fishways. J. Hydraul. Eng. 2004, 130, 10–23. doi:10.1061/(ASCE)0733-9429(2004)130:1(10). [Google Scholar]
-
Dong X, Xu M, Feng Y. An Experimental Study of 2D Flow Characteristics in a Vertical Slot Fishway. In Proceedings of the 33rd IAHR Congress, Vancouver, BC, Canada, 9–14 August 2009; pp. 2034–2043. [Google Scholar]
-
Cao Q, Yang W, Chen H. Experimental study on hydraulic characteristics of vertical slot fish pass. J. Hohai Univ. 2010, 38, 698–703. doi:10.3876/j.issn.1000-1980.2010.06.019. [Google Scholar]
-
Tan J, Gao J, Dai H, Yang Z, Shi X. Effects of turbulence and velocity on the movement behavior of bighead carp in an experimental vertical slot fishway. Ecol. Eng. 2019, 127, 363–374. doi:10.1016/j.ecoleng.2018.12.002. [Google Scholar]
-
Cea L, Pena L, Puertas J, Vazquez-Cendon ME, Pena E. Application of several depth-averaged turbulence models to simulate flow in vertical slot fishways. J. Hydraul. Eng. 2007, 133, 160–172. doi:10.1061/(ASCE)0733-9429(2007)133:2(160). [Google Scholar]
-
Xu T, Sun S. Numerical simulation of the flow structures in vertical slot fishway. J. Hydraul. Eng. 2009, 40, 108–111. doi:10.13243/j.cnki.slxb.2009.11.013. (In Chinese) [Google Scholar]
-
Chorda J, Maubourguet MM, Roux H, Larimer M, Tarrade L, David L. Two-dimensional free surface flow numerical model for vertical slot fishways. J. Hydraul. Res. 2010, 48, 141–151. doi:10.1080/00221681003703956. [Google Scholar]
-
Guo W, Lai Q, Wang L, Peng W, Li H, Xu X. Numerical simulation of hydraulic characteristics in vertical slot. Water Resour. Pow. 2013, 31, 77–80. doi:10.20040/j.cnki.1000-7709.2013.05.022. (In Chinese) [Google Scholar]
-
Bombac M, Novak G, Rodic P. Numerical and physical model study of a vertical slot fishway. J. Hydrol. Hydromech. 2014, 62, 150–159. doi:10.2478/johh-2014-0013. [Google Scholar]
-
Bian Y, Sun S, Zhang G, Zheng T, Lv Q. Numerical simulation of flow in the 90° turn of a vertical slot fish pass. J. Hydroecol. 2015, 36, 53–59. doi:10.15928/j.1674-3075.2015.01.008. (In Chinese) [Google Scholar]
-
Xia W, Gao Z, Shi X. Three-dimensional numerical simulation of hydraulic characteristics in vertical slot fish pass. Water Resour. Pow. 2017, 35, 86–89. doi:10.20040/j.cnki.1000-7709.2017.12.023. (In Chinese) [Google Scholar]
-
Li M, Cai D, Wu P, Li L. Hydraulic characteristics study of flow in 90° turning section for vertical slot fishway. Guangxi Water Resour. Hydropow. Eng. 2022, 26, 1–5. doi:10.16014/j.cnki.1003-1510.2022.01.001. (In Chinese) [Google Scholar]
-
Sun S, Li G, Zheng T. Theory and Method of Hydraulic Design in Vertical Slot Fishway; China Sci. Press: Beijing, China, 2025. (In Chinese) [Google Scholar]
-
Guo Z, Sun X, Dong Z. An experimental study of turbulent structures in a flat-crested weir-type fishway. Appl. Sci. 2019, 9, 4040. doi:10.3390/app9194040. [Google Scholar]
-
Lang J, Fedele JJ, Hoyal DCJD. Three-dimensional submerged wall jets and their transition to density flows: Morphodynamics and implications for the depositional record. Sedimentology 2021, 68, 1297–1327. doi:10.1111/sed.12860. [Google Scholar]
-
Chen K, Wei W, Deng J. Morphology Evolution of Three-Dimensional Scours Under Submerged Jets. Front. Earth Sci. 2022, 10, 917447. doi:10.3389/feart.2022.917447. [Google Scholar]
-
Dong Z, Mao B, Jiang L, Chen X. An experimental study of turbulent structures and fish test in a rectangular orifice fishway of tidal sluice. Ocean Eng. 2019, 37, 149–160. doi:10.16483/j.issn.1005-9865.2019.06.016. (In Chinese) [Google Scholar]
-
Dong Z, Zhang X, Feng Y, Lin L, Chen K. Fishway with an Egg-Shaped Fish Orifice. China Patent ZL200910099372.3, 5 January 2011. (In Chinese) [Google Scholar]
-
Li G, Kolomenskiy D, Liu H, Thiria B, Godoy-Diana R. Hydrodynamical fingerprint of a neighbour in a fish lateral line. Front. Robot. AI 2022, 9, 825889. doi:10.3389/frobt.2022.825889. [Google Scholar]
-
Liao JC, Beal DN, Lauder GV, Triantafyllou MS. Fish exploiting vortices decrease muscle activity. Science 2003, 32, 1566–1569. doi:10.1126/science.1088295. [Google Scholar]
-
Harvey ST, Muhawenimana V, Müller S, Wilson CAME, Denissenko P. An inertial mechanism behind dynamic station holding by fish swinging in a vortex street. Sci. Rep. 2022, 12, 12660. doi:10.1038/s41598-022-16181-8. [Google Scholar]
-
Gao P, Huang Q, Pan G, Song D, Cao Y. Research on swimming performance of fish in different species. Phys. Fluids 2023, 35, 061909. doi:10.1063/5.0154914. [Google Scholar]
-
Yang G, Li WJ, Du HB, Wan Y, Xiao Y, Zhang P, et al. Numerical simulation on the interaction of median fins for enhancing vortex dynamics and propulsion performance in fish self-propelled swimming. Phys. Fluids 2024, 36, 101913. doi:10.1063/5.0237237. [Google Scholar]
-
Mi S, Avital EJ, Williams JJR, Chatjigeorgiou IK. A fluid-structure interaction (FSI) solver for evaluating the impact of circular fish swimming patterns on offshore aquaculture. Comput. Electron. Agric. 2025, 237, 110625. doi:10.1016/j.compag.2025.110625. [Google Scholar]
-
Gao P, Song B, Huang Q, Tian X, Pan G, Chu Y, et al. Hydrodynamic performance of two manta rays swimming in staggered groups with different vertical spacing. Ocean Eng. 2024, 313, 119415. doi:10.1016/j.oceaneng.2024.119415. [Google Scholar]
-
Pan Y, Zhang W, Kelly J, Dong H. Unraveling hydrodynamic interactions in fish schools: A three-dimensional computational study of in-line and side-by-side configurations. Phys. Fluids 2024, 36, 081909. doi:10.1063/5.0201965. [Google Scholar]
-
Silva AT, Baerum KM, Hedger RD, Baktoft H, Fjeldstad HP, Gjelland KO, et al. The effects of hydrodynamics on the three-dimensional downstream migratory movement of Atlantic salmon. Sci. Total Environ. 2020, 705, 135773. doi:10.1016/j.scitotenv.2019.135773. [Google Scholar]
-
Padgett TE, Thomas RE, Borman DJ, Mould DC. Individual-based model of juvenile eel movement parametrized with computational fluid dynamics-derived flow fields informs improved fish pass design. R. Soc. Open Sci. 2020, 7, 191505. doi:10.1098/rsos.191505. [Google Scholar]