Admixture of Amerindian, African and European Genes: Cuba, Mexico and Colombia as Study Cases

Admixture of Amerindian, African and European Genes: Cuba, Mexico and Colombia as Study Cases
Antonio Arnaiz-Villena
*
 Ignacio Juarez Martin-Delgado
Christian Vaquero-Yuste
Jose Manuel Martin-Villa
Tomas Lledo
Ignacio Juarez Martin-Delgado
Christian Vaquero-Yuste
Jose Manuel Martin-Villa
Tomas Lledo
Received: 26 August 2025 Revised: 15 September 2025 Accepted: 13 October 2025 Published: 29 October 2025

© 2025 The authors. This is an open access article under the Creative Commons Attribution 4.0 International License (https://creativecommons.org/licenses/by/4.0/).
1. Introduction on Studies Ethnicities
1.1. HLA Analysis of the First Free African Community in the Americas: The Case of San Basilio de Palenque, Colombia
Colombia has a complex ethnic composition where the Amerindian population is probably underestimated, due to mixing or isolation in remote regions [1]; nevertheless, latent Amerindian genetic markers have also been identified in other populations within the same geographical area (such as Cuba) [2], which shows that phenotypic characters can be quickly lost in the Amerindians within a mixture of Caucasoid and/or African genetics. The population currently studied is an isolated one of African origin, living in the town of San Basilio de Palenque, near Cartagena (called Cartagena de Indias in Spain), which is the most important Atlantic seaport in Colombia (Figure 1). The Spanish brought African slaves to South America mainly through the port of Cartagena de Indias at a time when Amerindians were dying rapidly due to forced labor and diseases recently brought by the Spanish (smallpox, measles, influenza, among others). This situation led the Amerindian population to be reduced from approximately 80 million to 8 million individuals within a century of Columbus’s arrival in the Americas in 1492 AD, spanning from Alaska to Patagonia [3].
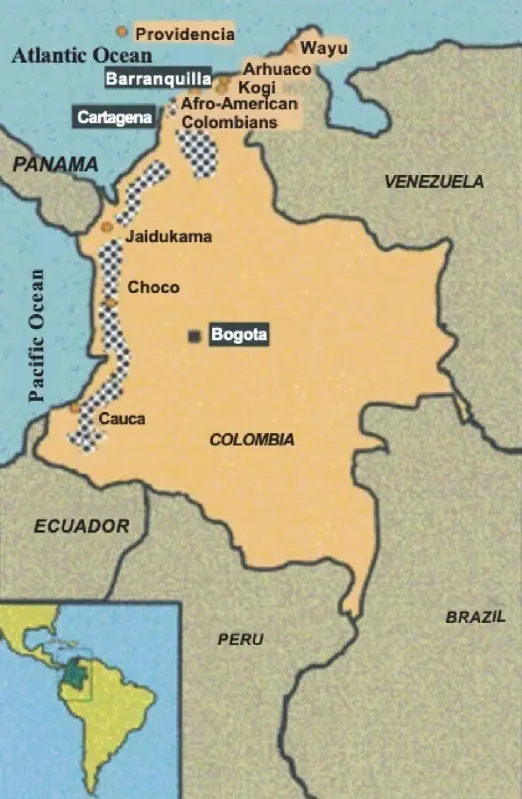
Figure 1. Geographical representation of the Colombian Afro-American population studied (San Basilio de Palenque, Department of Bolivar, near Cartagena de Indias).
Enslaved Africans transported to Cartagena frequently escaped and sought refuge in the nearby María Mountains, where they established self-fortified settlements. One of these, founded in the 17th century, became known as San Basilio de Palenque. These self-reliant Africans helped other slaves who were being taken en masse by Spanish ships to the port of Cartagena to flee. “Palenque” is a generic designation used in Mexico and the Caribbean/Atlantic coastal regions to refer to settlements established by African slaves who escaped from Spanish colonizers. The African community of San Basilio de Palenque increased rapidly with newly arrived Africans fleeing and the struggle with the Spanish became more intense due to the increase of the slave trade. The Spanish Crown was forced to issue a Royal Decree in 1691 in Madrid (Spain) that guaranteed the freedom of the Africans in San Basilio de Palenque. This freedom was achieved in 1713 after many struggles and intense upheavals, the year in which this town became the first free African community in the Americas [4]. Haiti became a free Republic some 100 years later.
1.2. Cuba Island
At the beginning of the Holocene, Cuba was closer to the Florida Keys and the Bahamas Islands [5] because the sea level was lower between those places (Figure 2). However, although a migration of people from the north of the Mississippian culture would have been possible, no archaeological data corroborated this [6]. In fact, the first archaeological sites in Cuba date back to 4000 years before Christ, and remains found have been proven to have been brought by people from the Yucatan Peninsula, Mesoamericans. However, no route of arrival is excluded, including that of Florida. These people who arrived in Cuba were hunter-gatherers [6]. Simultaneously, non-agricultural populations from both North and South America also migrated into the Caribbean, including Cuba [6]. These two population types coexisted on the island of Cuba for an extended period until approximately 500 B.C., when new groups, particularly the Arawaks from Venezuela, arrived carrying ceramic and agricultural technologies that subsequently disseminated throughout the Caribbean [6]. By the time of Columbus’s arrival in 1492 A.D., numerous complex chiefdoms, or cacicazgos, were established in Cuba and other islands [6].
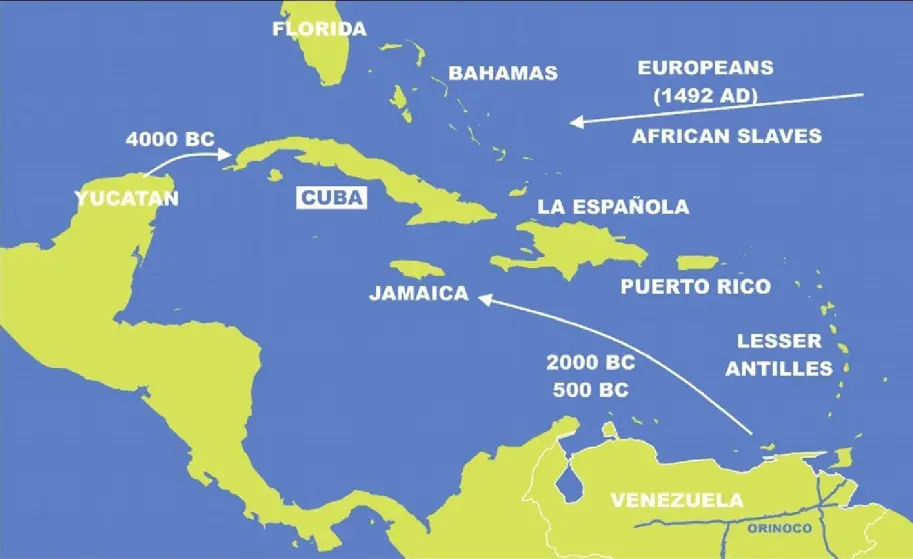
Figure 2. Map of the island of Cuba and the surrounding Caribbean. Prehistoric and historic migrations and their timing are indicated.
At the onset of the Spanish invasion, Cuba was inhabited by two distinct Amerindian groups. According to Bartolomé de las Casas, the pre-agricultural Ciboney, who lived in the westernmost part of the island, and the agricultural Tainos [5]. The latter were speakers of the Arawak language of South America. Other anthropophagous warrior Amerindians lived in the small islands of the Antilles and were considered a threat by the other Amerindians of the Caribbean [5]. Soon, Cuban Amerindians were disappearing due to conditions of slavery, war (against the Spaniards) and diseases of Spanish origin (mainly smallpox, measles and influenza).
1.3. HLA Gene Studies in Amerindian Teenek and Mayan Populations
It has been postulated that the first native Amerindians migrated from Asia via the Bering Land Bridge between approximately 30,000 and 12,000 years ago. This hypothesis is supported by cultural, morphological, and genetic affinities observed between American and Asian populations. Siberia [7] and Mongolia [8] were proposed as the most likely places of origin of population migrations from Asia.
Greenberg first postulated the Three Wave Theory to explain the settlement of the Americas with three ancestral populations [9]. The peopling of the Americas is often described in terms of three major waves: Amerindians, encompassing most North and South American indigenous populations (~12,000 years ago); Na-Dene groups, including Athabascans, Navajos, and Apaches (~8000 years ago); and Eskimo-Aleut populations (~6000 years ago). Genetic analyses of these groups, including studies of the Y chromosome, other nuclear DNA markers, and mitochondrial DNA [10,11,12], provide support for the Three-Wave Model. However, additional mitochondrial DNA studies have suggested [13,14] proposed that only one wave from Mongolia/northern China gave rise to the earliest Native American ancestors [8,15].
It is now recognized that the much debated settlement of America is much more complex and ancient: it is not a unidirectional gene flow from Asia to America through the Bering Strait, but is due to an exchange of people between America, Asia and the Pacific islands [16,17,18]. In addition, Africans [19] and Europeans [20,21] may also have contributed to the settlement of the Americas via the Atlantic Ocean.
The Mexican Teenek or Huastec people live in the state of San Luis Potosi in northeastern Mexico and settled there approximately 600 years BC [22]. They speak the Teenek-Huasteco language, which is classified within the Totonacan branch of the Mayan language family [22]. Due to their geographic location near the Atlantic Ocean, this group was one of the first to maintain contact with the Spaniards in 1519 (Figure 3). They were captured and enslaved, being transported to the Antilles, primarily to Hispaniola (present-day Dominican Republic and Haiti) and Cuba, between 1523 and 1532 [22]. Following the 16th century, most Teenek territories experienced significant decline and have since remained relatively isolated for cultural reasons. The Spanish, led by Hernán Cortés in Mexico and Francisco Pizarro in Peru, along with Portuguese, British, and other European colonizers during the 16th century, drastically reduced the populations of the indigenous peoples of North and South America—including Amerindians, Na-Dene, and Eskimo groups—from approximately 80 million to 8 million within a century, primarily as a result of infectious diseases (such as smallpox, measles, and influenza), enslavement, and armed conflict [3,16].
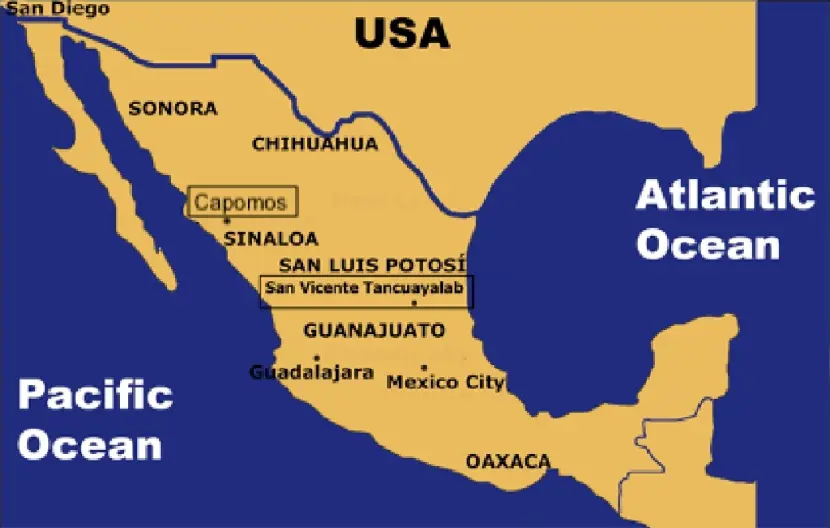
Figure 3. Map of Mexico showing where Teenek (San Vicente Tancuayalab, Huasteca region, San Luis de Potosí state) and Mayo (Capomos city, Sinaloa state) samples were collected. (Cities are represented with lowercase letters and States are represented with capital letters).
It is now accepted that the much debated settlement of America is not a unidirectional gene flow from Asia to America through the Bering Strait, but is due to an exchange of people between America, Asia and the Pacific islands [16,17,18]. In addition, Africans [19] and Europeans [20,21] may also have contributed to the settlement of America. In the present work, we studied the HLA genetic profile of the Mayo Amerindians of the northwestern coast of Mexico (state of Sinaloa) [23,24]. They speak their own language, Mayo, a branch of the Nahua/Aztec linguistic group. They call themselves Yoremes and probably come from a population settlement in the Colorado River Basin further north. The genetic relationship of the Mexica/Aztecs to the Mayos is uncertain, as the Mexica imposed their language on many other genetically unrelated ethnic groups [25]. The arrival of the Spaniards, led by Hernán Cortés, to the Mexican Empire in 1519, led to its destruction due to warfare and disease brought by the invaders [26].
2. Detailed Methodology Used for HLA Genetic Studies
2.1. Sample Selection
After signing an informed consent form, peripheral blood was collected from selected individuals of each Amerindian ethnicity studied. The blood was collected using a vacuum tube system and preserved with EDTA as an anticoagulant.
The selected individuals had to meet two main characteristics: their ancestors of at least two generations had to have been born in the place where the samples were collected, and all of them had to speak the characteristic language of the place.
This study analyzed 42 unrelated healthy individuals from San Basilio de Palenque (3500 inhabitants in 2010; 10°06′ N, 75°11′ W; Figure 1). All participants and their four grandparents were lifelong residents of this village and provided written informed consent to participate in the study. They speak a unique language, unparalleled anywhere else in the world: Bantu (Kongo or Kikongo, also known as Spanish Creole in Colombia) [1].
Seventy-eight unrelated healthy volunteer donors were studied in Cuba. They were chosen from the database of the BETERA laboratories (Centro Banco de Sangre Marianao, Havana, Cuba); regardless of race, sex or any other difference between individuals, individuals classified as Caucasoid (67%), Mixed (21%) or black (11%) [2] were chosen.
Also, sixty unrelated Amerindians of the Mayo ethnicity volunteered to donate blood after signing the consent form; they lived in the town of Capomos, Municipio del Fuerte, in the state of Sinaloa (northwestern Mexico). At least two generations prior to the selected individuals lived in the same area, spoke the typical Mayo Nahua language and had a markedly Amerindian physiognomy.
A total of fifty-five healthy, unrelated individuals from the Teenek ethnic group were genotyped for their HLA class I and class II alleles. All participants resided in the village of San Vicente Tancuayalab, located in the Huasteca region of San Luis Potosí, Mexico. Although consanguineous pedigrees are prevalent in this community, only unrelated individuals were selected for the study.)
2.2. HLA Typing and DNA Sequencing
High-resolution typing of HLA class I (A and B) and HLA class II (DRB1) alleles was conducted using the PCR-SSOP-Luminex technique [27]. This methodology involves three main steps: (a) PCR amplification using specific primer pairs supplied by the manufacturer (Luminex Corporation, Austin, TX, USA). All primers are 50% biotinylated and designed to target exons 2 and 3 for HLA class I genes, or exon 2 for HLA class II genes; (b) hybridization, in which the biotin-labeled PCR products are denatured at 97 °C and subsequently hybridized to complementary DNA probes bound to beads; and (c) HLA allele assignment, wherein the hybridized complexes are analyzed using the Luminex platform. This system detects the fluorescence intensity of each oligoprobe bound to the biotin-labeled PCR product, and the associated software assigns HLA alleles for each sample based on the hybridization pattern [27]. Automated sequencing of HLA-A, -B, and -DRB1 genes (ABI PRISM 3700/ABI PRISM 3730, Applied Biosystems, Foster City, CA, USA) was performed only when PCR-SSOP typing produced ambiguous results [28].
2.3. Statistical Analysis
Statistical analyses were conducted using Arlequin v2.0 software, kindly provided by Excoffier and Slatkin [29]. This program was used to calculate allele frequencies for HLA-A, -B, -DRB1, and -DQB1 and assess Hardy–Weinberg equilibrium and linkage disequilibrium among the detected alleles. The significance level (p) for comparisons was determined as described by Imanishi et al. [19].
Phylogenetic relationships were inferred through dendrograms constructed using the Neighbor-Joining method [30], based on genetic distances (DA) between populations [31], implemented in DISPAN software (version 2.3a) and visualized with GNKDST and TREEVIEW [32,33]. Additionally, three-dimensional correspondence analysis, with a two-dimensional representation, was performed using VISTA v5.05 [34]. Correspondence analysis is a geometric technique that provides a global view of the relationships among populations according to HLA (or other) allele frequencies. This approach relies on the variance of DA genetic distances between populations, analogous to classical principal component analysis, and allows for statistical visualization of population structure.
3. A Summarized Example of Results
3.1. Dendrogram and Correspondence Analysis in Inhabitants of San Basilio de Palenque
Two types of analyses were conducted to compare HLA frequencies of the Colombian African-American population with those of other global populations: (1) using pooled DRB1 and DQB1 data, and (2) using DRB1 data alone. A combined analysis of HLA class I or simultaneous class I and II allele frequencies was not feasible, primarily due to the lack of available class I data in different related groups such as blacks from Cauca, Providencia and Chocó (Colombia) [35] and others such as African Americans from New York City [36]. The DRB1 and DRB1-DQB1 study was performed to compare our Colombian African American HLA population frequencies with those of many world populations. Figure 4 represents an HLA-DRB1 neighbor-joining tree and shows how our Colombian African American population was clustered together with other Negroid populations and was also close to Mediterranean populations, as seen in the correspondence analysis (Figure 5).
The closest populations to our Colombian Afro-American group are the North American blacks, followed by West African populations such as the Senegalese and the Bubis of Bioko Island (Gulf of Guinea). Mediterranean populations follow West African populations in terms of genetic distance (black Africans and Mediterraneans share a fairly similar HLA profile) [37]. Amerindians showed distant genetic distances compared to our San Basilio de Palenque group.
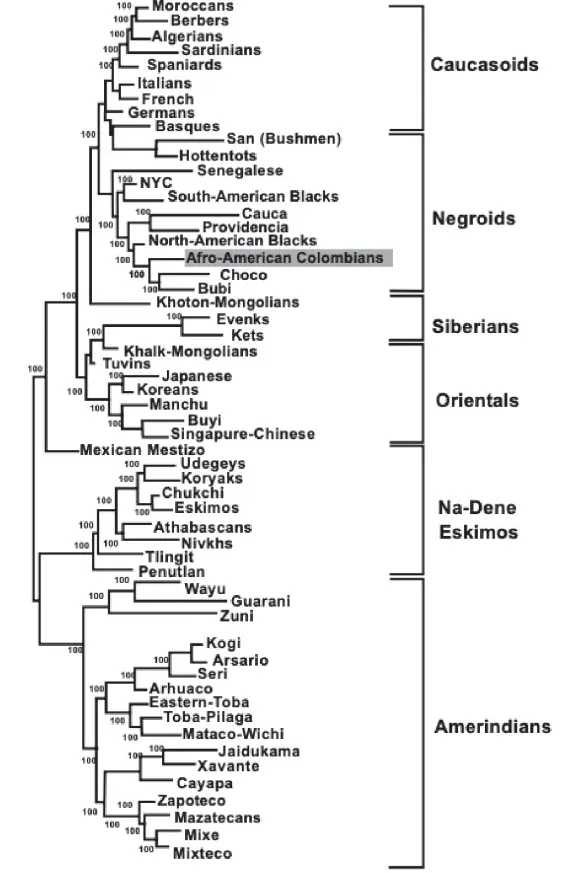
Figure 4. Neighbour Joining dendrogram showing the relationship between African-American Colombians (shaded) and other African-American, African, Caucasoid, Oriental and Amerindian groups. Genetic distances between populations (DA) were calculated using high-resolution HLA-DRB1 frequencies. Data for other populations were taken from the literature [2,16,17,19]; (For NaDene populations definition, which is based on languages and other populations details, see ref. [9] and http://www.allelefrequencies.net/pop6001a_gsb.asp; https://en.wikipedia.org/wiki/Na-Dene_languages, accesed on 29 August 2025).
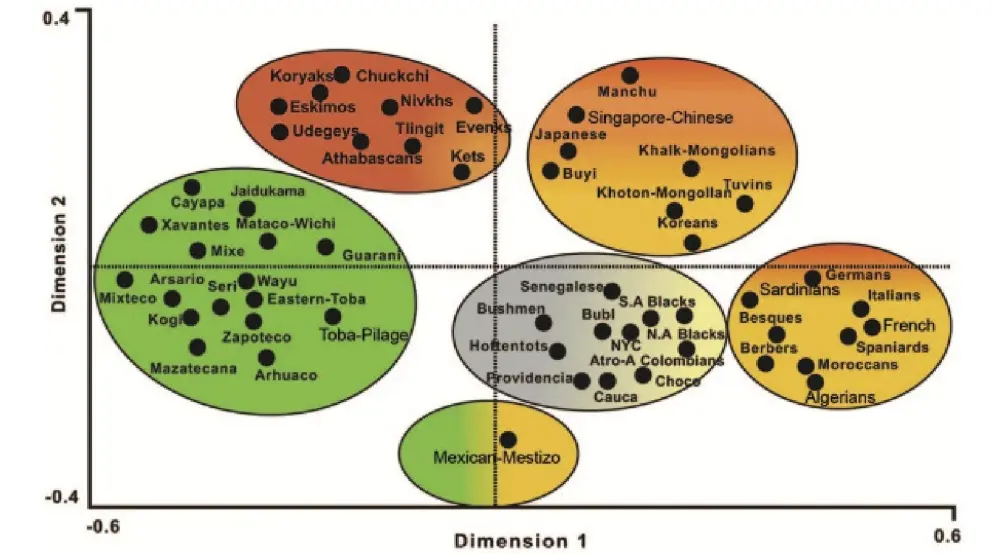
Figure 5. Correspondence analysis showing an overview of the relationship between Negroid (brown), Amerindian (green), Siberian, Na-Dene and Eskimo (red), Asian (orange) and European/North African (yellow) populations [2,16,17,19]. (For NaDene populations definition, which is based on languages and other populations’ details, see ref. [9] and http://www.allelefrequencies.net/pop6001a_gsb.asp; https://en.wikipedia.org/wiki/Na-Dene_languages).
3.2. Dendrogram and Correspondence Analysis in Cubans
A study was done with HLA-DRB1 alleles to compare the Cuban population’s HLA frequencies with those of Polynesians, Melanesians, and Micronesians without DQB1 analysis. Figure 6 presents a neighbor-joining tree based on HLA-DRB1 allele frequencies, illustrating that the Cuban population clusters with Mediterranean populations while remaining distinct from Amerindian and East Asian populations. This pattern is similarly observed in the correspondence analysis based on HLA-DRB1 and DQB1 allele frequencies (Figure 7).
Genetic distance analyses indicate that the Cuban population clusters closely with Mediterranean and European populations (Figure 7). In particular, the smallest genetic distances are observed with French, Berber, and Spanish populations, followed by Russians, Algerians, and Spanish Basques. In contrast, Amerindian and East Asian populations exhibit considerably greater genetic distances from Cubans.
About 12% of the Cuban population of Havana was found to carry Amerindian genes [16].
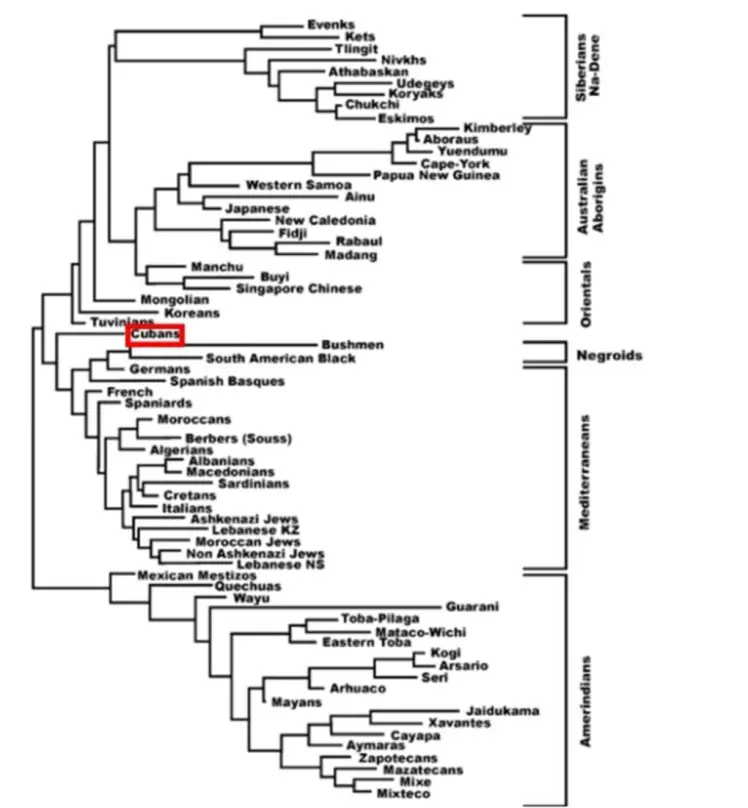
Figure 6. Neighbour Joining Dendrogram showing the relationship between the Cuban population (highlighted with red box) and other Amerindian, Na-denes, Eskimo, Asian, Negroid, Polynesian and European populations. Genetic distances between populations (DA) were calculated using HLA-DRB1 genotyping [2,16,17,19]. (For NaDene populations definition, which is based on languages and other populations’ details, see ref. [9] and http://www.allelefrequencies.net/pop6001a_gsb.asp; https://en.wikipedia.org/wiki/Na-Dene_languages).
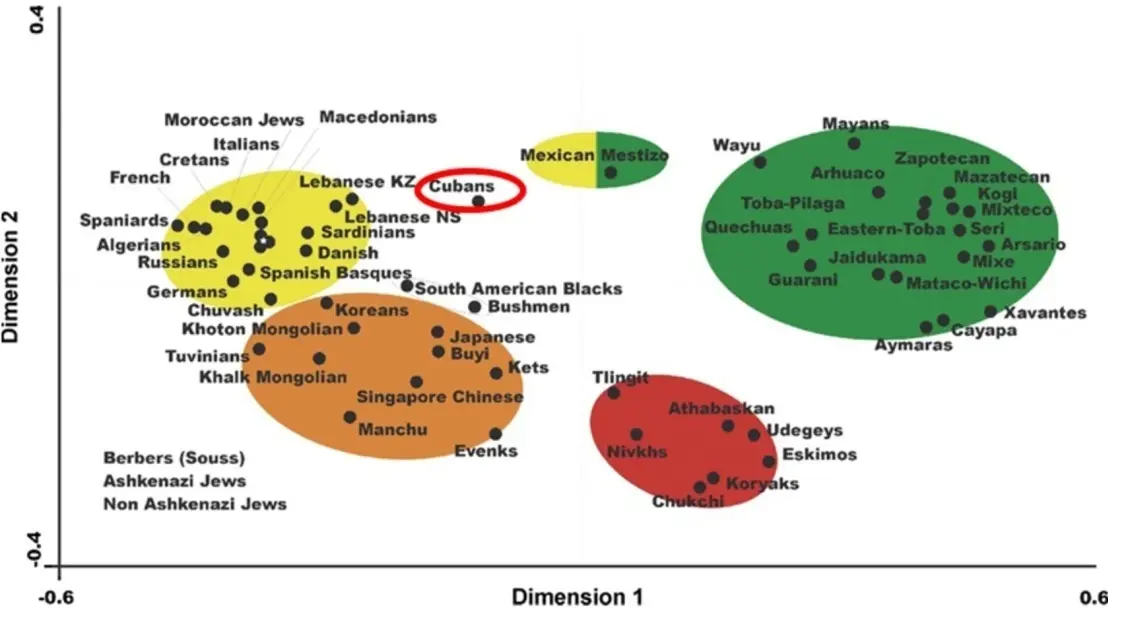
Figure 7. Correspondence analysis provides a comprehensive overview of the relationships among Cuban (highlighted with red circle), Amerindian, Na-Dene, Eskimo, Asian, African, and European populations, based on HLA-DRB1 and DQB1 allele frequencies across multiple dimensions (two-dimensional representation). The colors represent an approximate grouping of populations [2,16,17,19]. (For NaDene populations definition, which is based on languages and other populations’ details, see ref. [9] and http://www.allelefrequencies.net/pop6001a_gsb.asp; https://en.wikipedia.org/wiki/Na-Dene_languages, accesed on 25 August 2025).
3.3. Mayos and Teenek
Genetic distance analyses indicate that the Mayo population is closely related to other groups in Mesoamerica and South America. Specifically, the Kogi (11.20 × 10, Colombia), Teenek (11.38 × 10, Mexico), Maya (13.17 × 10, Guatemala), Arsarios (18.13 × 10, Colombia), Mazatec (20.44 × 10, Mexico), and Mixteco (23.20 × 10, Mexico) exhibit the smallest genetic distances, followed by the Eastern Toba, Arawak, Seri, Nahua, and other Amerindian populations. A marked clustering is observed among all Amerindians, separated from other groups of the world (including the Na-Dene and Eskimo) (Figure 4, Figure 5, Figure 6 and Figure 7). Both Teenek/Huastecos and Mayos/Yoremes cluster with Amerindians, showing neither geographic nor genetic proximity (results not shown) [23,38,39].
4. Conclusions from Our Studies in These Particular Models
4.1. The Genetics of San Basilio de Palenque
It has been documented that populations originating from the Gulf of Guinea underwent significant expansion into central, eastern, and southern Africa around 400 A.D. [40,41]. Many Bantu-speaking tribes subsequently dominated the sub-Saharan region, displacing or assimilating numerous other groups. For example, Pygmy populations were confined to the forests of central Africa, while the San (Bushmen) were restricted to the southwestern margins of the continent, particularly in present-day Namibia, alongside the Hottentots, a group of mixed San and Bantu ancestry [41]. We can find several alleles and haplotypes specific to some African populations (Nubians, Bubis, Zulus) [19,42,43] in both South American and North American blacks. Some classic West African alleles, such as A*30 and B*42, are present in Bubis [43], Zulus [44], Colombian blacks (from the Pacific coast) [45] and Senegalese [46] but absent in the San Basilio de Palenque population; this could be because the alleles have been lost due to genetic drift or during the possible formation of new HLA class I-II alleles/haplotypes in America [47]. Senegalese and Bubis from Bioko Island cluster together with African Americans from the north and south [34]. Figure 4 and Figure 5 show that the San Basilio de Palenque group is also close to the North American blacks, but also that they are markedly separated from the Amerindian populations, demonstrating that there has been no gene flow between the two groups.
Although people from Africa settled in America working and living alongside Amerindians for almost five centuries, gene flow from Amerindians to black populations is almost non-existent according to our data; there is a low frequency of classic Amerindian HLA alleles in African American peoples [35,36,48,49]. In this study, three typical Amerindian alleles, DRB1*04:03, DRB1*04:11 and DRB1*16:02 were present at very low frequencies in African Americans, which is consistent with previous studies finding very low genetic admixture between Amerindians and African Americans in Colombia [50].
4.2. The Admixture of Aboriginal and Foreign Genes in Cuba
Analysis of alleles and haplotypes indicates that the majority of the contemporary Cuban population carries predominantly Caucasoid alleles, consistent with the island’s historical record. Following 1492, the Spaniards established the encomienda system [51], granting Spanish landowners control over groups of Amerindians forced into labor. Harsh working conditions, warfare, and diseases introduced by Europeans rapidly decimated the Amerindian population in Cuba. Nevertheless, traces of their original genetic heritage persist, including HLA-DRB1 alleles such as 04:03, 04:04, 04:07, 04:11, 08:02, and 16:02, with DRB104:10* appearing at very low frequency and also observed in Mesoamerican and other Pacific populations. In response to the dramatic decline of the Amerindian population and under pressure from figures such as Father Bartolomé de las Casas, the Spanish monarchy enacted protective laws for Amerindians as early as 1542 [51]; however, these regulations were largely unenforced and not carried out in Cuba. Furthermore, European settlers continually brought Amerindians and African slaves to the island after 1492. These demographic dynamics likely contributed to the preservation of genetic markers from enslaved populations, as reflected in the study of contemporary Cuban HLA genes.
About 12% of the Cuban population (which apparently show only African and European phenotypes, and not Amerindian) of Havana was found to carry Amerindian genes. [16]
4.3. Teenek, Mayos and the Settlement of the Americas
Mitochondrial DNA analyses suggest that all Amerindian mitochondrial lineages were isolated in Asia prior to their migration into the Americas, occurring at least 7000–15,000 years ago. These studies further propose that the isolation region was likely Beringia [52]. In addition, an entry of people (and therefore genes) from Asia through the Pacific coast of America [53] has been proposed based on all the archaeological, anthropological and genetic data that have been studied.
A trans-Pacific route for the settlement of the Americas from Asia or Polynesia has also been proposed, supported by the presence of HTLV-1 virus strains with identical sequences in Japan and along the northern coast of South America [54], and by the observation that certain HLA alleles may have been introduced via this same route [1,55]. In the Teenek population, six distinct HLA-A alleles and eight HLA-B alleles were identified, most frequently being HLA-A02, HLA-A68, HLA-B35, and HLA-B39. Twelve HLA-DRB1 alleles were detected, of which HLA-DRB104:07 exhibited the highest frequency. The most common HLA-DQB1 alleles were DQB103:02 and DQB103:01. Allele families with frequencies above 10% included four HLA-A alleles (HLA-A02, HLA-A68, HLA-A24, and HLA-A31), four HLA-B alleles (HLA-B35, HLA-B39, HLA-B40, and HLA-B52), three HLA-DRB1 alleles (HLA-DRB104:07, HLA-DRB114:06, and HLA-DRB104:11), and two HLA-DQB1 alleles (HLA-DQB103:02 and HLA-DQB103:01). The high frequencies of these alleles have been previously reported in other Amerindian populations, including Mexicans [38,39,56].
HLA class I and class II alleles in Mayos had already been found in other Amerindian population [23,28,39]. In particular, HLA-DRB1*04:07 and -DRB1*14:06. In addition, the most frequent extended HLA-A-B-DRB1-DQB1 haplotypes have been found in high frequencies in other Amerindians [17]. The presence of the HLA-B*48 allele in this population is surprising. It has not been found in other Mexican Amerindians, but is present in South American Andean populations such as Aymara, Quechua and Lamas [23,38,39,57], and also in Amerindians and Canadian/Alaskan Asian Americans. All Amerindians examined who carry HLA-B*48 are found near the Pacific coast of North and South America, suggesting the existence of a direct genetic exchange of Pacific Islanders/Asians with early inhabitants of the Americas, which has been confirmed in subsequent studies [18,23,38,39,57,58,59,60]. In addition, the second most frequent HLA-A allele was HLA-A*24, most likely HLA-A*24: 02, which is specifically widespread in high frequency in indigenous Amerindian, Pacific Islander and Pacific Asian peoples, including Aleuts, Yupik of Alaska, Japan, Taiwan, Australia, New Zealand, Papua New Guinea, South China and other Pacific Islands [38,39,58,59]. This input of genes from the Pacific Islands must now be considered as unidirectional or bidirectional when studying the early inhabitants of the Americas and the settlement of the continent. In addition, new evidence delays the time of settlement of the Americas because human presence has been detected earlier than postulated in Monteverde (Chile), Pedra Furada (Brazil) and recently in California, where a 130,000-year-old human archaeological site has been found [61].
In other words, the settlement of America could have been very complex and multifocal (across the North, South, East and West of the continent) in different periods and times, similar to and sometimes contemporary with the settlement of Europe and Asia.
Statement of the Use of Generative Al and Al-Assisted Technologies in the Writing Process
T. L rephrased in a good English language fom of the phrases. This was read by all authors that agree in this language correction which was performed by Perplexity AI.
Acknowledgments
We want to thank the University Complutense of Madrid for its continuous support.
Author Contributions
Conceptualization, writing of the paper, figure design, A.A.-V., J.M.M.-V. and T.L.; bibliography and references, T.L. and C.V.-Y.; review of the manuscript, I.J.M.-D., T.L. and J.M.M.-V.; All authors have read and agreed to the published version of the manuscript.
Ethics Statement
Not applicable.
Informed Consent Statement
Not applicable.
Data Availability Statement
Not applicable.
Funding
Universidad Complutense de Madrid grant number PR3/23-30834.
Declaration of Competing Interest
The authors declare no extant financial or other interests.
References
- Arnaiz Villena A, Reguera R, Parga Lozano C, Abd El Fatah S, Monleon L, Barbolla L, et al. HLA genes in Afro American Colombians (San Basilio de Palenque): The first free Africans in America. Open Immunol. J. 2009, 2, 59–66. doi:10.1016/j.humimm.2018.05.010. [Google Scholar]
-
Alegre R, Moscoso J, Martinez Laso J, Martin-Villa M, Suarez J, Moreno A, et al. HLA genes in Cubans and the detection of Amerindian alleles. Mol. Immunol. 2007, 44, 2426–2435. doi:10.1016/j.molimm.2006.10.017. [Google Scholar]
-
Dobbins F. Disease transfer contact. Annu. Rev. Anthropol. 1993, 22, 273–291. [Google Scholar]
-
Arrázola R. Palenque: Primer Pueblo Libre de América. Historia de Las Sublevaciones de Losesclavos de Cartagena; EdicionesHernández: Cartagena de Indias, Colombia, 1970. [Google Scholar]
-
Moure RD, De La Calle MR. Art and Archaelogic of Pre Columbian Cuba; Universidad de Pittsburgh: Pittsburgh, PA, USA, 1996. [Google Scholar]
-
Wilson SM. The Indigenous People of the Caribbean; University Press of Florida: Gainesville, FL, USA, 1997. [Google Scholar]
-
Crawford MH. The Origins of Native Americans: Evidence from Anthropological Genetics; Cambridge University Press: Cambridge, MA, USA, 1998. [Google Scholar]
-
Kolman CJ, Sambuughin N, Bermingham E. Mitochondrial DNA analysis of Mongolian populations and implications for the origin of New World founders. Genetics 1996, 142, 1321–1334. doi:10.1093/genetics/142.4.1321. [Google Scholar]
-
Greenberg JH, Turner CG, Zegura SL. The settlement of the Americas: A comparison of the linguistic, dental and genetic evidence. Curr. Anthropol. 1986, 27, 477–498. [Google Scholar]
-
Wallace DC, Torroni A. American Indian prehistory as written in the mitochondrial DNA: A review. Hum. Biol. 1992, 64, 403–416. [Google Scholar]
-
Cavalli-Sforza LL, Menozzi P, Piazza A. The History and Geography of Human Genes; Princeton University Press: Princeton, NJ, USA, 1994. doi:10.2307/2058750. [Google Scholar]
-
Parham P, Ohta T. Population biology of antigen presentation by MHC class I molecules. Science 1996, 272, 67–74. doi:10.1126/science.272.5258.67. [Google Scholar]
-
Horai S, Kondo R, Nakagawa Hattori Y, Hayashi S, Sonoda S. Peopling of the Americas, founded by four major lineages of mitochondrial DNA. Mol. Biol. Evol. 1993, 10, 23–47. doi:10.1093/oxfordjournals.molbev.a039987. [Google Scholar]
-
Torroni A, Sukernik RI, Schurr TG, Starikorskaya YB, Cabell MF, Crawford MH, et al. mtDNA variation of aboriginal Siberians reveals distinct genetic affinities with Native Americans. Am. J. Hum. Genet. 1993, 53, 591–608. [Google Scholar]
-
Merriwether DA, Hall WW, Vahlne A, Ferrell RE. mtDNA variation indicates Mongolia may have been the source for the founding population for the New World. Am. J. Hum. Genet. 1996, 59, 204–212. [Google Scholar]
-
Arnaiz-Villena A, Vargas Alarcon G, Granados J, Gomez-Casado E, Longas J, Gonzáles-Hevilla M, et al. HLA genes in Mexican Mazatecans, the peopling of the Americas and the uniqueness of Amerindians. Tissue Antigens 2000, 56, 405–416. doi:10.1034/j.1399-0039.2000.560503.x. [Google Scholar]
-
Arnaiz Villena A, Areces C, Enríquez de Salamanca M, Abd El Fatah Khalil S, Marco J, Muñiz E, et al. Pacific Islanders and Amerindian relatedness according to HLA autosomal genes. Int. J. Mod. Anthrop. 2014, 7, 44–67. doi:10.4314/ijma.v1i7.2. [Google Scholar]
-
Arnaiz Villena A, Palacio Gruber J, Juarez I, Lopez Nares A, Nieto J, Campos C, et al. HLA in Uros Peru Titikaka lake: Tiwanaku, Easter and Pacific Islanders. Hum. Immunol. 2019, 80, 91–92. doi:10.1016/j.humimm.2018.10.012. [Google Scholar]
-
Imanishi T, Akaza T, Kimura A, Tokunaga K, Gojobori T. Estimation of Allele and Haplotype Frequencies for HLA and Complement Loci; Tsuji K, Aizawa M, Sasazuki T, Eds.; Oxford University Press: Oxford, UK, 1992; Volume 1, pp. 76–79. [Google Scholar]
-
Stanford DJ, Bradley BA. Across Atlantic Ice: The Origins of America’s Clovis Culture; University of California Press: California, CA, USA, 2012. [Google Scholar]
-
Arnaiz Villena A, Alonso Rubio J, Ruiz del Valle V. Tiwanaku (Titikaka Lake, Bolivia) and Alberite Dolmen (Southern Spain) ritual «ears». Int. J. Mod. Anthrop. 2013, 6, 61–76. doi:10.4314/ijma.v1i6.3. [Google Scholar]
-
Ávila A, Barthas B, Cervantes A. Los Huastecos de San Luis Potosí, Etnografíacontemporánea de los Pueblos Indígenas de México. Región Oriental; Instituto Nacional Indigenista Secretaria de Desarrollo Social: Mexico City, Mexico, 1995; pp. 9–55. [Google Scholar]
-
Arnaiz Villena A, Moscoso J, Granados J, Serrano Vela JI, De la Peña A, Reguera R, et al. HLA genes in Mayos population from Northeast Mexico. Curr. Genom. 2007, 8, 466–475. doi:10.2174/138920207783591735. [Google Scholar]
-
Gomez-Casado E, Martinez-Laso J, Moscoso J, Zamora J, Martin-Villa M, Perez-Blas M, et al. Origin of Mayans according to HLA genes and the uniqueness of Amerindians. Tissue Antigens 2003, 61, 425–436. [Google Scholar]
-
Scheffler L. Los Indígenas Mexicanos; Panorama: Mexico City, Mexico, 1992. [Google Scholar]
-
Lopez Lujan L. Los Mexicas, últimosseñores de Mesoamérica. In Gran Enciclopedia de España y América; Espasa Calpe/Argantonio: Madrid, Spain, 1983. [Google Scholar]
-
Itoh Y, Mizuki N, Shimada T, Azuma F, Itakura M, Kashiwase K, et al. High throughput DNA typing of HLA A, B, C, and DRB1 loci by a PCR SSOP Luminex method in the Japanese population. Immunogenetics 2005, 57, 717–729. doi:10.1007/s00251-005-0048-3. [Google Scholar]
-
Arnaiz-Villena A, Timon M, Corell A, Perez-Aciego P, Martin-Villa JM, Regueiro JR. Primary immunodeficiency caused by mutations in the gene encoding the CD3-γ subunit of the T-lymphocyte receptor. N. Engl. J. Med. 1992, 327, 529–533. [Google Scholar]
-
Schneider S, Roessli D, Excoffier L. ARLEQUIN: A Software for Population Genetics Database Analysis, version 2.0; Laboratorios de Genética y Biometría, Departamento de Antropología, Universidad de Génova: Genoa, Italy, 2000. [Google Scholar]
-
Saitou N, Nei M. The neighbor-joining method: A new method for reconstructing phylogenetic trees. Mol. Biol. Evol. 1987, 4, 406–425. doi:10.1093/oxfordjournals.molbev.a040454. [Google Scholar]
-
Nei M. Genetic distances between populations. Am. Nat. 1972, 106, 283. [Google Scholar]
-
Nei M. Analysis of gene diversity in subdivided populations. Proc. Natl. Acad. Sci. USA 1973, 70, 3321–3323. [Google Scholar]
-
Nei M, Tajima F, Tateno Y. Accuracy of estimated phylogenetic trees from molecular data. II. Gene frequency data. J. Mol. Evol. 1983, 19, 153–170. [Google Scholar]
-
Young FW, Bann CM. A visual statistics system. In Statistical Computing Environments for Social Researches; Stine RA, Fox J, Eds.; Sage Publications: London, UK, 1996; pp. 207–236. [Google Scholar]
-
Trachtenberg EA, Keyeux G, Bernal J, Noble JA, Erlich H. Results of expedicion humana II. Analysis of HLA class II alleles in three African American populations from Colombia using the PCR/SSOP: Identification of a novel DQB1*02 (*0203) allele. Tissue Antigens 1996, 48, 192–198. [Google Scholar]
-
Motomi M, Beatty PG, Graves M, Boucher KM, Milford EL. HLA gene and haplotype frequencies in the North American population. The National Marrow Donor Program Registry. Transplantation 1997, 64, 1017–1027. [Google Scholar]
-
Hors J, El Chenawi F, Djouhla S. HLA in North African population. 12th International Histocompatibility Workshop NAFR report. In Genetic Diversity of HLA. Functional and Medical Implications; Charron D, Ed.; EDK: Paris, France, 1997; pp. 328–333. [Google Scholar]
-
Arnaiz Villena A, Juarez I, Crespo Yuste E, Lopez Nares A, Callado A, Vargas Alarcon G, et al. Study of HLA genes in Mexico Mayo/Yoremes Amerindians: Further support of gene exchange with Pacific Islanders. Hum. Immunol. 2020, 81, 195–196. doi:10.1016/j.humimm.2020.02.012. [Google Scholar]
-
Arnaiz Villena A, Juarez I, Suarez Trujillo F, Crespo Yuste E, Lopez Nares A, Callado A, et al. HLA genes in Amerindians from Mexico San Vicente TancuayalabTeenek/Huastecos. Hum. Immunol. 2020, 81, 193–194. doi:10.1016/j.humimm.2020.03.002. [Google Scholar]
-
Mcevedy C, Jones R. Atlas of World Population History; Penguin Books Ltd.: London, UK, 1978. [Google Scholar]
-
Mcevedy C. The Penguin Atlas of African History; Penguin Books Ltd.: London, UK, 1980. [Google Scholar]
-
Clayton J, Lonjou C. Allele and haplotype frequencies for HLA loci in various ethnic groups. In Genetic Diversity of HLA. Functional and Medical Implications; Charron D, Ed.; EDK: Paris, France, 1997; pp. 665–820. [Google Scholar]
-
De Pablo R, Garcia Pacheco JM, Vilches C, Moreno ME, Sanz L, Rementeria MC, et al. HLA class I and class II allele distribution in the Bubi population from the island of Bioko (Equatorial Guinea). Tissue Antigens 1997, 50, 593–601. [Google Scholar]
-
Hammond MG, Du Toit ED, Sachs JA, Kaplan C, Mbayo K. HLA in Southern African Populations; Tsuji K, Aizawa M, Sasazuki T, Eds.; Oxford University Press: London, UK, 1992; Volume 1, pp. 636–638. [Google Scholar]
-
Blank M, Blank A, King S, Yashiki S, Kuwayama M, Fujiyama C, et al. Distribution of HLA and haplotypes of Colombian and Jamaican black populations. Tissue Antigens 1995, 45, 111–116. [Google Scholar]
-
Dieye A, Diaw ML, Roigier C, Trape JF, Sarthou JL. HLA A, B, C, DR, DQ typing in a population group of Senegal: Distribution of HLA antigens and HLA DRB1*13 and DRB1*11 subtyping by PCR using sequence specific primers (PCR SSP). Tissue Antigens 1996, 47, 194–199. doi:10.1111/j.1399-0039.1996.tb02540.x. [Google Scholar]
-
Degos L, Dausset J. Human migrations and linkage disequilibrium of HLA system. Immunogenetics 1974, 1, 195–210. [Google Scholar]
-
Just JJ, King MC, Thomson G, Klitz W. African American HLA class II allele and haplotype diversity. Tissue Antigens 1997, 49, 547–555. doi:10.1111/j.1399-0039.1997.tb02801.x. [Google Scholar]
-
Caraballo LR, Marrugo CJ, Erlich H, Pastorizo EM. HLA alleles in the population of Cartagena (Colombia). Tissue Antigens 1992, 39, 128–133. doi:10.1111/j.1399-0039.1992.tb01922.x. [Google Scholar]
-
Yunis JJ, Ossa H, Salazar M, Delgado MB, Deulofeut R, De la Hoz A, et al. Major histocompatibility com plex class II alleles and haplotypes and blood groups four Amerindian tribes of northern Colombia. Hum. Immunol. 1994, 41, 248–258. doi:10.1016/0198-8859(94)90043-4. [Google Scholar]
-
Salzano FM, Bartolini MC. The Evolution and Genetics of Latin American Populations; Cambridge University Press: Cambridge, MA, USA, 2002. doi:10.1093/jhered/93.5.387. [Google Scholar]
-
Mulligan CJ, Kitchen A, Miyamoto MM. Updated three stage model for the peopling of the Americas. PLoS ONE 2008, 3, e3199. doi:10.1371/journal.pone.0003199. [Google Scholar]
-
Goebel T, Waters MR, O’rourke DH. The late Pleistocene dispersal of modern humans in the Americas. Science 2008, 319, 1497–1502. doi:10.1126/science.1153569. [Google Scholar]
-
Leon SFE, Ariza de Leon A, Leon SME, Ariza C. Peopling the Americas. Science 1996, 273, 723–725. [Google Scholar]
-
Cerna M, Falco M, Friedman H, Raimondi E, Maccagno A, Fernandez Viña M, et al. Differences in HLA class II alleles of isolated South American Indian populations from Brazil and Argentina. Hum. Immunol. 1993, 37, 213–220. [Google Scholar]
-
Vargas Alarcon G, Granados J, Perez Hernandez N, Rodriguez Perez J, Canto Cetina C, Coral R, et al. HLA class II genes in Mexican Amerindian Mayas: Related ness with Guatemalan Mayans and other populations. Immunol. Investig. 2010, 40, 101–111. doi:10.3109/08820139.2010.517588. [Google Scholar]
-
Vargas Alarcon G, Hernandez Pacheco G, Moscoso J, Perez Hernandez N, Enrique Murguia L, Moreno A, et al. HLA genes in Mexican Teeneks: HLA genetic relationship with other worldwide populations. Mol. Inmunol. 2005, 43, 790–799. doi:10.1016/j.molimm.2005.07.017. [Google Scholar]
-
Arnaiz Villena A, Palacio Gruber J, Muñiz E, Campos C, Alonso Rubio J, Gomez Casado E, et al. HLA genes in Chimila Amerindians (Colombia), the Peopling of America and Medical implications. Int. J. Modern Anthropol. 2016, 9, 91–121. doi:10.4314/IJMA.V1I9.6. [Google Scholar]
-
Arnaiz Villena A, Muñiz E, Palacio Gruber J, Campos C, Alonso Rubio J, Gomez Casado E, et al. Ancestry of Amerindians and its Impact in Anthropology, Transplantation, HLA Pharmacogenomics and Epidemiology by HLA Study in Wiwa Colombian Population. Open Med. J. 2016, 3, 269–285. doi:10.2174/1874220301603010269. [Google Scholar]
-
Rey D, Parga Lozano C, Moscoso J, Areces C, Enriquez de Salamanca M, Fernandez Honrado M, et al. HLA genetic profile of Mapuche (Araucanian) Amerindians from Chile. Molec. Biol. Rep. 2013, 40, 4257–4267. doi:10.1007/s11033-013-2509-3. [Google Scholar]
-
Holen SR, Deméré TA, Fisher DC, Fullagan R, Paces RB, Jefferson GT, et al. A 130,000 year old archaeological site in southern California, USA. Nature 2017, 544, 479–483. doi:10.1038/nature22065. [Google Scholar]