N-TiO2 Photonic and Quantum Photocatalytic Efficiency Determined by Monte Carlo Simulation

N-TiO2 Photonic and Quantum Photocatalytic Efficiency Determined by Monte Carlo Simulation
Received: 16 August 2025 Revised: 17 September 2025 Accepted: 16 October 2025 Published: 24 October 2025

© 2025 The authors. This is an open access article under the Creative Commons Attribution 4.0 International License (https://creativecommons.org/licenses/by/4.0/).
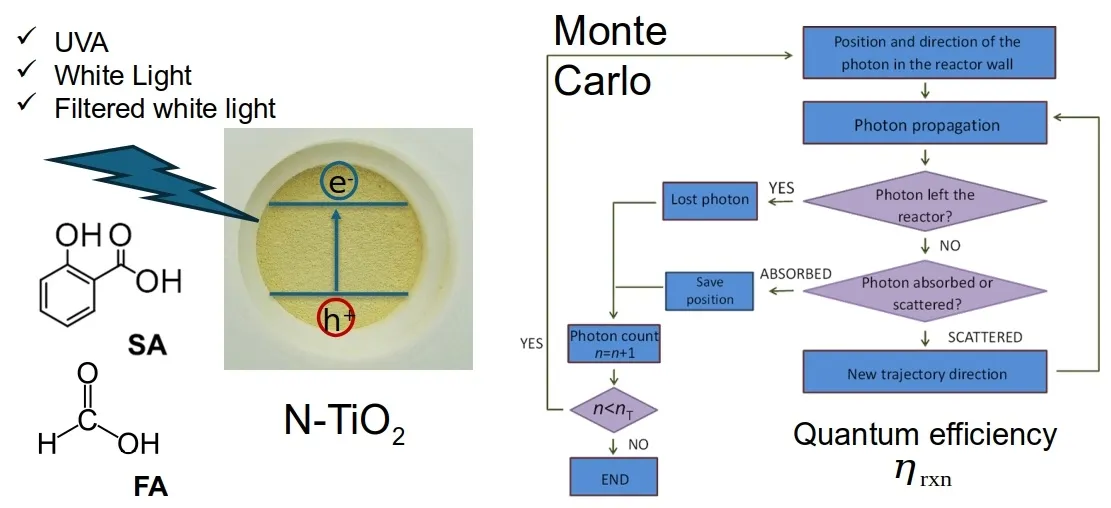
Graphical Abstract
1. Introduction
Semiconductor-based photocatalysis presents an alternative for the direct use of solar energy in a variety of applications such as H2 production via water splitting [1], environmental remediation [2], CO2 reduction [3,4], organic synthesis [5], and numerous related fields [6,7]. While current research focuses on the development of different types of semiconductors, as perovskites [8], MXenes [9], metal oxide frameworks -MOFs- [10], covalent oxide frameworks -COFs- [11], layered ternary metal chalcogenide [3,12], among others, titanium dioxide, especially in its nanoparticle form, is widely used in photocatalysis due to its high efficiency and chemical stability. However, its toxicity is not negligible and depends heavily on form, exposure route, and environmental conditions. The main drawback that limits the widespread application of TiO2-photocatalysis is the low yield of solar light utilization [4]. To enhance the yield, modifications are made to TiO2 to improve solar light absorption, while maintaining its key properties. In this regard, the modification of TiO2 by nitrogen incorporation (N-TiO2) is one of the preferred strategies by researchers and technologists. Recently, several literature reviews have highlighted the potential applications of N-TiO2 in various fields and the proposed mechanisms explaining its response to visible light [13,14]. Different sources of nitrogen and synthesis methods are used to prepare N-TiO2, leading to various types of materials: interstitial or substitutional N doped TiO2, g-C3N4—TiO2 junction, among others (see reference [15]). However, many topics remain poorly understood, particularly regarding its quantum efficiency. Pioneering work by Irie and collaborators [16] has shown that the quantum efficiency of these materials for isopropanol degradation in the gas phase under visible light is lower compared to UVA light. Despite the significant research volume about N-TiO2 photocatalysis, comparing the photocatalysts’ performance is challenging, as discussed by M. A. Hoque [17]. Determining the quantum efficiency (as defined in the present work) is not usual in other studies and is crucial for a performance comparison independent of the experimental conditions.
Quantum efficiency is a fundamental property of the photocatalytic process and is theoretically independent of reactor geometry [17,18]. The mass balance (to quantify reactant conversion) and the radiation balance (to quantify the photon absorption) within the reactor must be calculated. In the context of photocatalytic reactions, the quantum efficiency is defined as the number of target molecules converted (produced or degraded) over the number of photons absorbed. In the case of photocatalytic reactors based on TiO2 slurries systems, the local volumetric rate of photon absorption (LVRPA) must be calculated, which involves knowing the fractions of light scattered, transmitted, and absorbed by the catalyst in an infinitesimal volume. It is well established that photocatalytic reactions begin with an initiation step that is inherently spatially dependent, due to the intrinsically non-uniform radiation field within the reactor volume. In TiO2 slurry photocatalytic reactors, this spatial non-uniformity is often significant, especially when comparing regions near the radiation inlet window to those closer to the opposite wall. Consequently, the local volumetric rate of photon absorption (LVRPA) cannot be measured directly, as doing so would require precise knowledge of the radiation absorbed at every point within the reactor, i.e., within each differential volume element [19,20]. Several strategies exist for performing this modeling, one of which is using the Monte Carlo (MC) method (see, for example, references [21,22]). Briefly, this method consists of tracking the trajectory of a statistically significant number of photons inside the reactor until they are either absorbed or scattered out, and the spatial location of the absorbed photons is recorded. The direction, length of the trajectory, and fate of the photons are determined by random numbers. This method is a flexible way to obtain highly accurate results without introducing major simplifications to the studied system. On the other hand, the MC method is computationally intensive and may take a relatively long time to converge. This concern is practically solved nowadays, even with personal computers, using parallelization techniques.
The objective of this study is to enhance the understanding of the impact of nitrogen modification on the quantum efficiency of TiO2. Both TiO2 and N-TiO2 were synthesized via the sol-gel method, utilizing urea as a nitrogen source, to produce two materials with comparable structural and chemical properties. TiO2 P-25, a widely studied and benchmarked photocatalyst, was also employed as the reference material. The LVRPA was modeled using a Monte Carlo simulation approach. Due to their distinct physicochemical properties and adsorption behaviours, formic acid and salicylic acid were selected as target compounds. Formic acid exhibits minimal adsorption on TiO2 and decomposes into CO2 without generating stable byproducts. In contrast, salicylic acid adsorbs onto TiO2 and produces stable byproducts under oxidative photocatalytic conditions. Three radiation sources -UVA, white and blue lights- were employed to assess quantum efficiency under various experimental conditions.
2. Materials and Methods
2.1. Photocatalysts Synthesis and Characterization
The synthesis was adapted from Bracco [23]. Briefly, equal volumes of 0.40 M titanium isopropoxide (Aldrich, distributed by Merck, Buenos Aires, Argentina) and 0.8 M urea (analytical grade, Anedra, Buenos Aires, Argentina) in ethanol were thoroughly mixed for 15 min. One volume of 0.40 M deionized water (17.2 MΩ·cm) in absolute ethanol (analytical grade, Anedra, Buenos Aires, Argentina) was added dropwise to the mixture under stirring. After 60 min of stirring, the slurry was dried at 60 °C for 18 h until a powder was obtained. The product was calcined under air following a strict protocol. First, the temperature was increased linearly at 10 °C·min−1 to 250 °C and kept constant for 180 min, followed by a linear increase at 10 °C·min−1 to 500 °C and finally kept constant for 1 min. Once the sample cooled down, it was grounded in a mortar and washed with water to remove soluble impurities. Finally, the suspension was dried at 60 °C during 18 h and sieved through a stainless-steel #400 mesh. TiO2 was synthesized following the same procedure, but without urea.
The crystalline structure of the powders was determined by X-ray diffraction, using a X ray diffractometer Empyrean (Malvern-Panalytical Ltd., Almelo, The Netherland) using the Cu Kα wavelength. A quantitative phase analysis using Rietveld refinement was performed with the software MAUD (version 2.9995). The particle morphology was determined by scanning electron microscopy (SEM) (Carl Zeiss SEM, FEG-SEM model Supra 40, Zeiss, Oberkochen, Germany). A few drops of a diluted aqueous dispersion of the powders (ca. 1 mg/mL) were placed on an aluminum sample holder and dried under a flow of N2. The samples were analyzed using a 5 kV electron beam. Powder surface areas were determined by N2 adsorption (BET method) using a Micromeritics ASAP 2020 V4, Norcross, GA, USA. The diffuse reflectance Rλd and the diffuse transmittance Tλd of photocatalyst suspensions were obtained following the procedure described by Satuf [24], using an Optronic OL 740-70 integrating sphere attached to an Optronic OL Series 750 spectrophotometer, (Optronic Laboratories, Inc., Orlando, FL, USA). The absorbance (ABSλ) of water suspensions of the photocatalysts was determined with the same spectrophotometer between 300 nm and 550 nm in 1 nm steps. For this optical characterization, the photocatalysts were suspended in deionized water and sonicated for 30 min to ensure good dispersion. The measurements were performed for five photocatalyst loads: 0.1 g·L−1, 0.2 g·L−1, 0.5 g·L−1, 0.8 g·L−1, and 1.0 g·L−1.
2.2. Photocatalytic Experiments
Photocatalytic experiments were conducted in an in-house constructed batch reactor. A 115 mL cylinder made with borosilicate glass was placed over a magnetic stirrer and surrounded by four light sources symmetrically located at 8 cm from the cylinder axis. The UVA sources were 8 W black light tubes GE F8T5/BLB (General Electric, USA, emission centered at 372 nm), the white light sources were 8 W GE F8T5/DL (day light), and 5 W blue LEDs strips (wavelength 462 nm; LEDYi LY60-S2835 12V-12W/m, Shenzhen, Guangdong, China) were employed as the blue light sources (the emission spectra of the light sources were obtained with a SM240 CCD spectrometer (Spectral Products, CO, USA), calibrated with a 532 nm laser and are presented in Figure S1). When it was necessary, the white light was filtered through a 0.5 mm thick acrylic cylindrical filter to block wavelengths shorter than 400 nm (Figure S2 shows the transmission spectra). The photon flux emitted by the light sources was determined according to the procedure given in the literature for the ferrioxalate actinometer [25]. All experiments performed in the photoreactor were made at least by duplicate.
The test solutions were 100 mL 1.0 × 10⁻⁴ M salicylic acid (Merck, Buenos Aires, Argentina, analytical grade) or 100 mL 2.5 × 10⁻⁴ M formic acid (Aldrich, analytical grade, distributed by Merck, Buenos Aires, Argentina). A 1.0 g∙L−1 load of photocatalyst was dispersed in the solution with the help of ultrasound (1 min). The suspension was magnetically stirred in the dark for 30 min to reach adsorption-desorption equilibrium before irradiation, as was experimentally determined (Figure S6). During illumination, 2.5 mL samples were taken from the reservoir, filtered through a 0.45-μm cellulose ester membrane, and collected in glass vials. Total organic carbon (TOC) was measured at the beginning and at the end of each experiment (TOC-L with ASI-L sampler, Shimadzu, Kioto, Japan). The evolution of salicylic acid during illumination was followed by measuring absorption at 296 nm, while the evolution of formic acid by measuring TOC.
2.3. Photon Absorption, Photonic and Quantum Efficiencies
Photonic efficiency provides information about how efficiently the incident light is used in the degradation process under the tested experimental conditions. It can be calculated from experimental information based on Equation (1)
|
|
(1) |
where (in mol∙cm−3·s−1) is the initial degradation rate, Fe is the photonic flux (in Einstein∙cm−2·s−1, where 1 Einstein = 1 mol of photons), and the brackets denote the average over the reactor volume and over the area of the reactor lateral wall , respectively.
Although photonic efficiency is a useful quantity in comparing the performance of a set of photocatalysts, because it also depends on the reactor configuration, it is difficult to compare results from different experimental setups. A quantity that only depends on the photocatalyst properties is the quantum efficiency, ηrxn, defined by Equation (2):
|
|
(2) |
Quantum efficiency cannot be determined only experimentally because there is no direct means of measuring how many photons are absorbed by the photocatalyst particles. The alternative is to simulate the radiation field inside the reactor to obtain the photon absorption efficiency ηabs, defined by Equation (3)
|
|
(3) |
From Equation (1) and Equation (3), it results:
|
```latex{\eta }_{rxn}=\frac{{\eta }_{p}}{{\eta }_{abs}}``` |
(4) |
In what follows, it is described how to obtain ηabs by means of a computer simulation.
2.4. Monte Carlo Simulation
To determine the photon absorption efficiency, it is necessary to evaluate the radiation field inside the reaction medium. In the case of slurry reactors (as the one used in this work), there is simultaneous absorption and scattering of light on the photocatalyst particles. The absorption and scattering phenomena are represented by the volumetric absorption coefficient κλ and the volumetric scattering coefficient σλ, respectively (both measured in cm−1). The scattering phenomenon leads to a change in the direction of the incident radiation. This change is modeled through the phase function , assuming elastic scattering, i.e., conserving the wavelength. The phase function pλ informs which of all the possible beam directions $$ \underline{\Omega^{\prime}} $$ are incorporated into (scattered to) the direction of interest $$ \underline{\Omega} $$. A regular choice for the phase function is the Henyey-Greenstein [26] due to its simplicity (it has only one free parameter called the asymmetry coefficient $$ g_{\lambda}$$) and the ability to represent a wide range of scattering patterns.
The values of the optical coefficients $$ {\kappa }_{\lambda } $$, $$ {\sigma }_{\lambda } $$, $$ {g}_{\lambda } $$ and the photon absorption efficiency cannot be directly measured. A combination of experiments and MC modeling can obtain these parameters.
In the MC method, each photon trajectory is followed from the radiation source, through the reaction volume, until it is extinguished (either because a catalyst particle absorbs it or because it leaves the reaction volume). Each trajectory is divided into discrete segments, whose lengths are calculated from the probability of a photon interacting with a TiO2 particle. The type of interaction (absorbance or scattering) is also chosen randomly from the probability of occurrence of each event. These probabilities depend on the values of $$ {\kappa }_{\lambda } $$ and $$ {\sigma }_{\lambda } $$ (the absorption and scattering coefficients) and their sum $$ {\beta }_{\lambda } $$ (known as the extinction coefficient). If a photon is scattered, the new direction is chosen randomly, with a probability derived from the phase function. The calculations of the probabilities were done following the procedure on references [20,27] with modifications regarding the specifications of the experimental setup employed here. The full details about the implementation are presented in the Supplementary Material.
First, in order to obtain the values of the optical coefficients (, , ), spectrophotometric measurements of catalysts suspensions have to be carried out (see Section 2.1). These measurements are simulated using the mentioned MC simulation applied to the geometry of the spectrophotometer cuvette. This simulation yielded calculated values for the and , which are functions of the free parameters (or , the other one is obtained from ) and . The extinction coefficient was easily calculated from the experimental absorbance as , where L is the length of the spectrophotometer cuvette. In this way, the optimal values for (or ) and are obtained by minimizing the difference between the simulated , and their experimental counterparts. This process was repeated for wavelengths in the 300–450 nm range and for catalyst concentrations from 0.2 g·L−1 to 1.0 g·L−1. Subsequently, it was possible to calculate the specific values (i.e., by unit of concentration) of the optical coefficients (, , and ) from linear regressions of the corresponding datasets and the average asymmetry coefficient of the phase function . With these optimal coefficients, the MC algorithm was applied for the simulation of the photocatalytic experiments, in order to obtain ηabs and, using the experimental results of ηp, calculate ηrxn (see Equation (4) in Section 2.3).
In the MC approach, the reactor was simulated in a three-dimensional space. Given the acceptable uniformity of the incident radiation field, the incident photons were assumed to be uniformly distributed over the lateral wall of the vessel, and their initial trajectories were taken to be perpendicular to this wall. Under these considerations, the main characteristics of the radiation field and the chosen coordinate system are displayed in Figure 1.
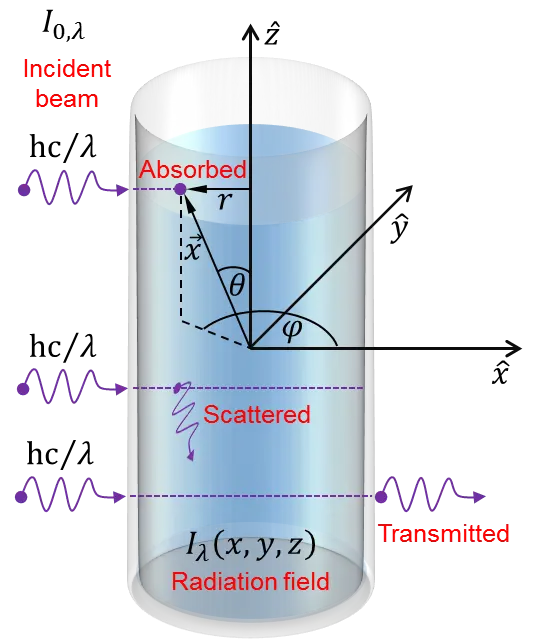
Figure 1. Representation of the reactor vessel and the coordinate system used for the radiation simulations. Here, $$ {I}_{\text{0},\lambda }^{} $$ is the source spectral radiance, and $$ {I}_{\lambda }^{}\left(\stackrel{\to }{x}\right) $$ is the radiation field inside the reactor, hc/λ is the incident photon energy, $$ \stackrel{\to }{x}=\left(x,y,z\right) $$ is the position inside the reactor, θ is the polar angle, φ is the azimuthal angle, and r is the distance from the central axis of the reactor. The diagram shows three possible outcomes for the incident photons: absorption, scattering, and transmission. Photons can also be reflected off the vessel walls.
3. Results and Discussion
3.1. Structural and Morphological Characterization
The N-TiO2 powders showed a characteristic yellow coloration, while TiO2 and P-25 were completely white. Figure 2 shows SEM images and XRD patterns of the different powders synthesized in the laboratory, and Figure S3 shows SEM images and XRD patterns of P-25. Both the N-TiO2 and TiO2 powders consisted of roughly spherical particles, approximately 10–30 nm in diameter, forming spherical aggregates with a diameter of 750 nm and 1500 nm, on average, respectively (estimated using the software ImageJ, version 1.53m). On the other hand, the P-25 powder presented slightly aggregated spheroidal particles of a diameter of approximately 10–20 nm. The crystal structure of the white powder was anatase, as indicated by its diffraction pattern with characteristics 2θ values and [hkl] planes at: 25.28° [101], 37.80° [004], 48.05° [200], 53.91° [105], 55.06° [211], 63.07° [204], 69.23° [116], 70.89° [220] and 75.38° [215] (JCPD Card No.21-1272), with traces of rutile. The XRD pattern of the yellow powder presented diffraction signals corresponding to anatase and rutile, indicated by the diffraction peak at 2θ 27.44° [110] (JCPD card No 65-0191). Rietveld analysis indicates that N-TiO2 the contains ca. 4% rutile and 96% anatase, while P-25 approximately 85% anatase and 15% rutile. The surface areas of the powders determined by the BET method were 48.9, 35.6 and 27.7 m2·g−1 for P-25, N-TiO2 and TiO2, respectively.
3.2. Optical Coefficients
Figure 3 includes results for the specific optical coefficients (βλ*, σλ*, and κλ*) and for the coefficient of asymmetry averaged over catalyst concentrations (〈gλ〉) as a function of the wavelength for N-TiO2 and TiO2. For P-25, the optical coefficients reported in [20] were employed in the Monte Carlo (MC) modeling. An example of the procedure used for obtaining the specific optical coefficients is depicted in Figure S5 of the Supplementary Material (experimental values of βλ and simulation results of κλ as a function of the catalyst concentration Cm, for three different wavelengths).
It should be noted that in the case of TiO2, the specific absorption coefficient is greater than that of scattering only at wavelengths shorter than 310 nm, and it becomes zero around 390 nm. In the case of N-TiO2, these wavelengths are approximately 320 nm and 400 nm, respectively. This would indicate that TiO2 absorbs longer wavelengths than N-TiO2. This trend is consistent with the presence of rutile and color in N-TiO2. Regarding the average asymmetry coefficient 〈gλ〉, it is always positive, indicating that scattering occurs mainly in the forward direction. It is also worth noting that the optical coefficients of N-TiO2 are about twice as high than those of TiO2. This can be explained by the difference in the size of the aggregates (see Ref. [28] and references therein), which is consistent with the SEM and BET results presented in this work (although not measured directly in suspension).
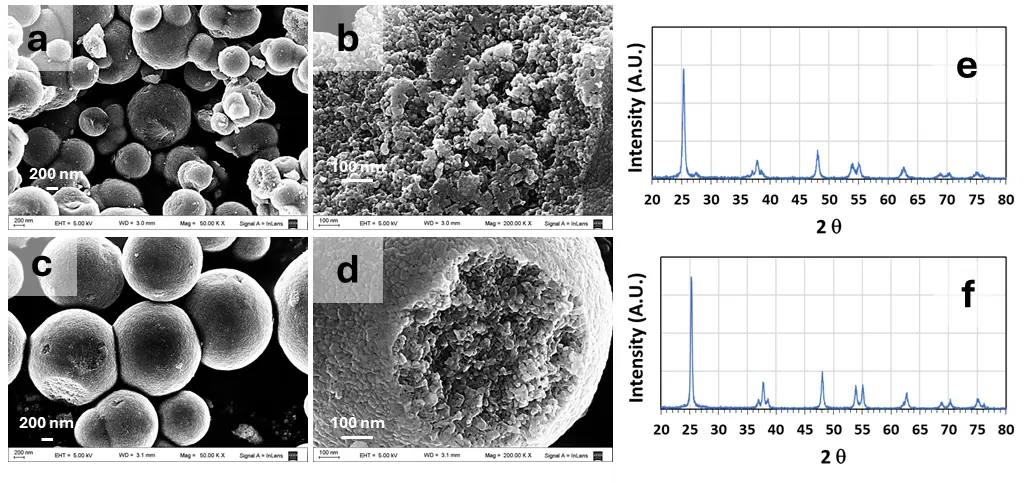
Figure 2. SEM images and XRD patterns of different samples synthesized in the laboratory. (a,b) N-TiO2 SEM; (c,d) TiO2 SEM; EHT: 5.0 kV, WD: 3.0 mm (a,b), WD: 3.1 mm (c,d) Magnification: (a,c): 50,000×; (c,d): 200,000×; (e) TiO2 XRD diffractogram N-TiO2; (f) TiO2 XRD diffractogram. Letters A and R indicate the signal corresponding to anatase [101] and rutile [110], respectively. [hkl] planes are indicated in brackets.
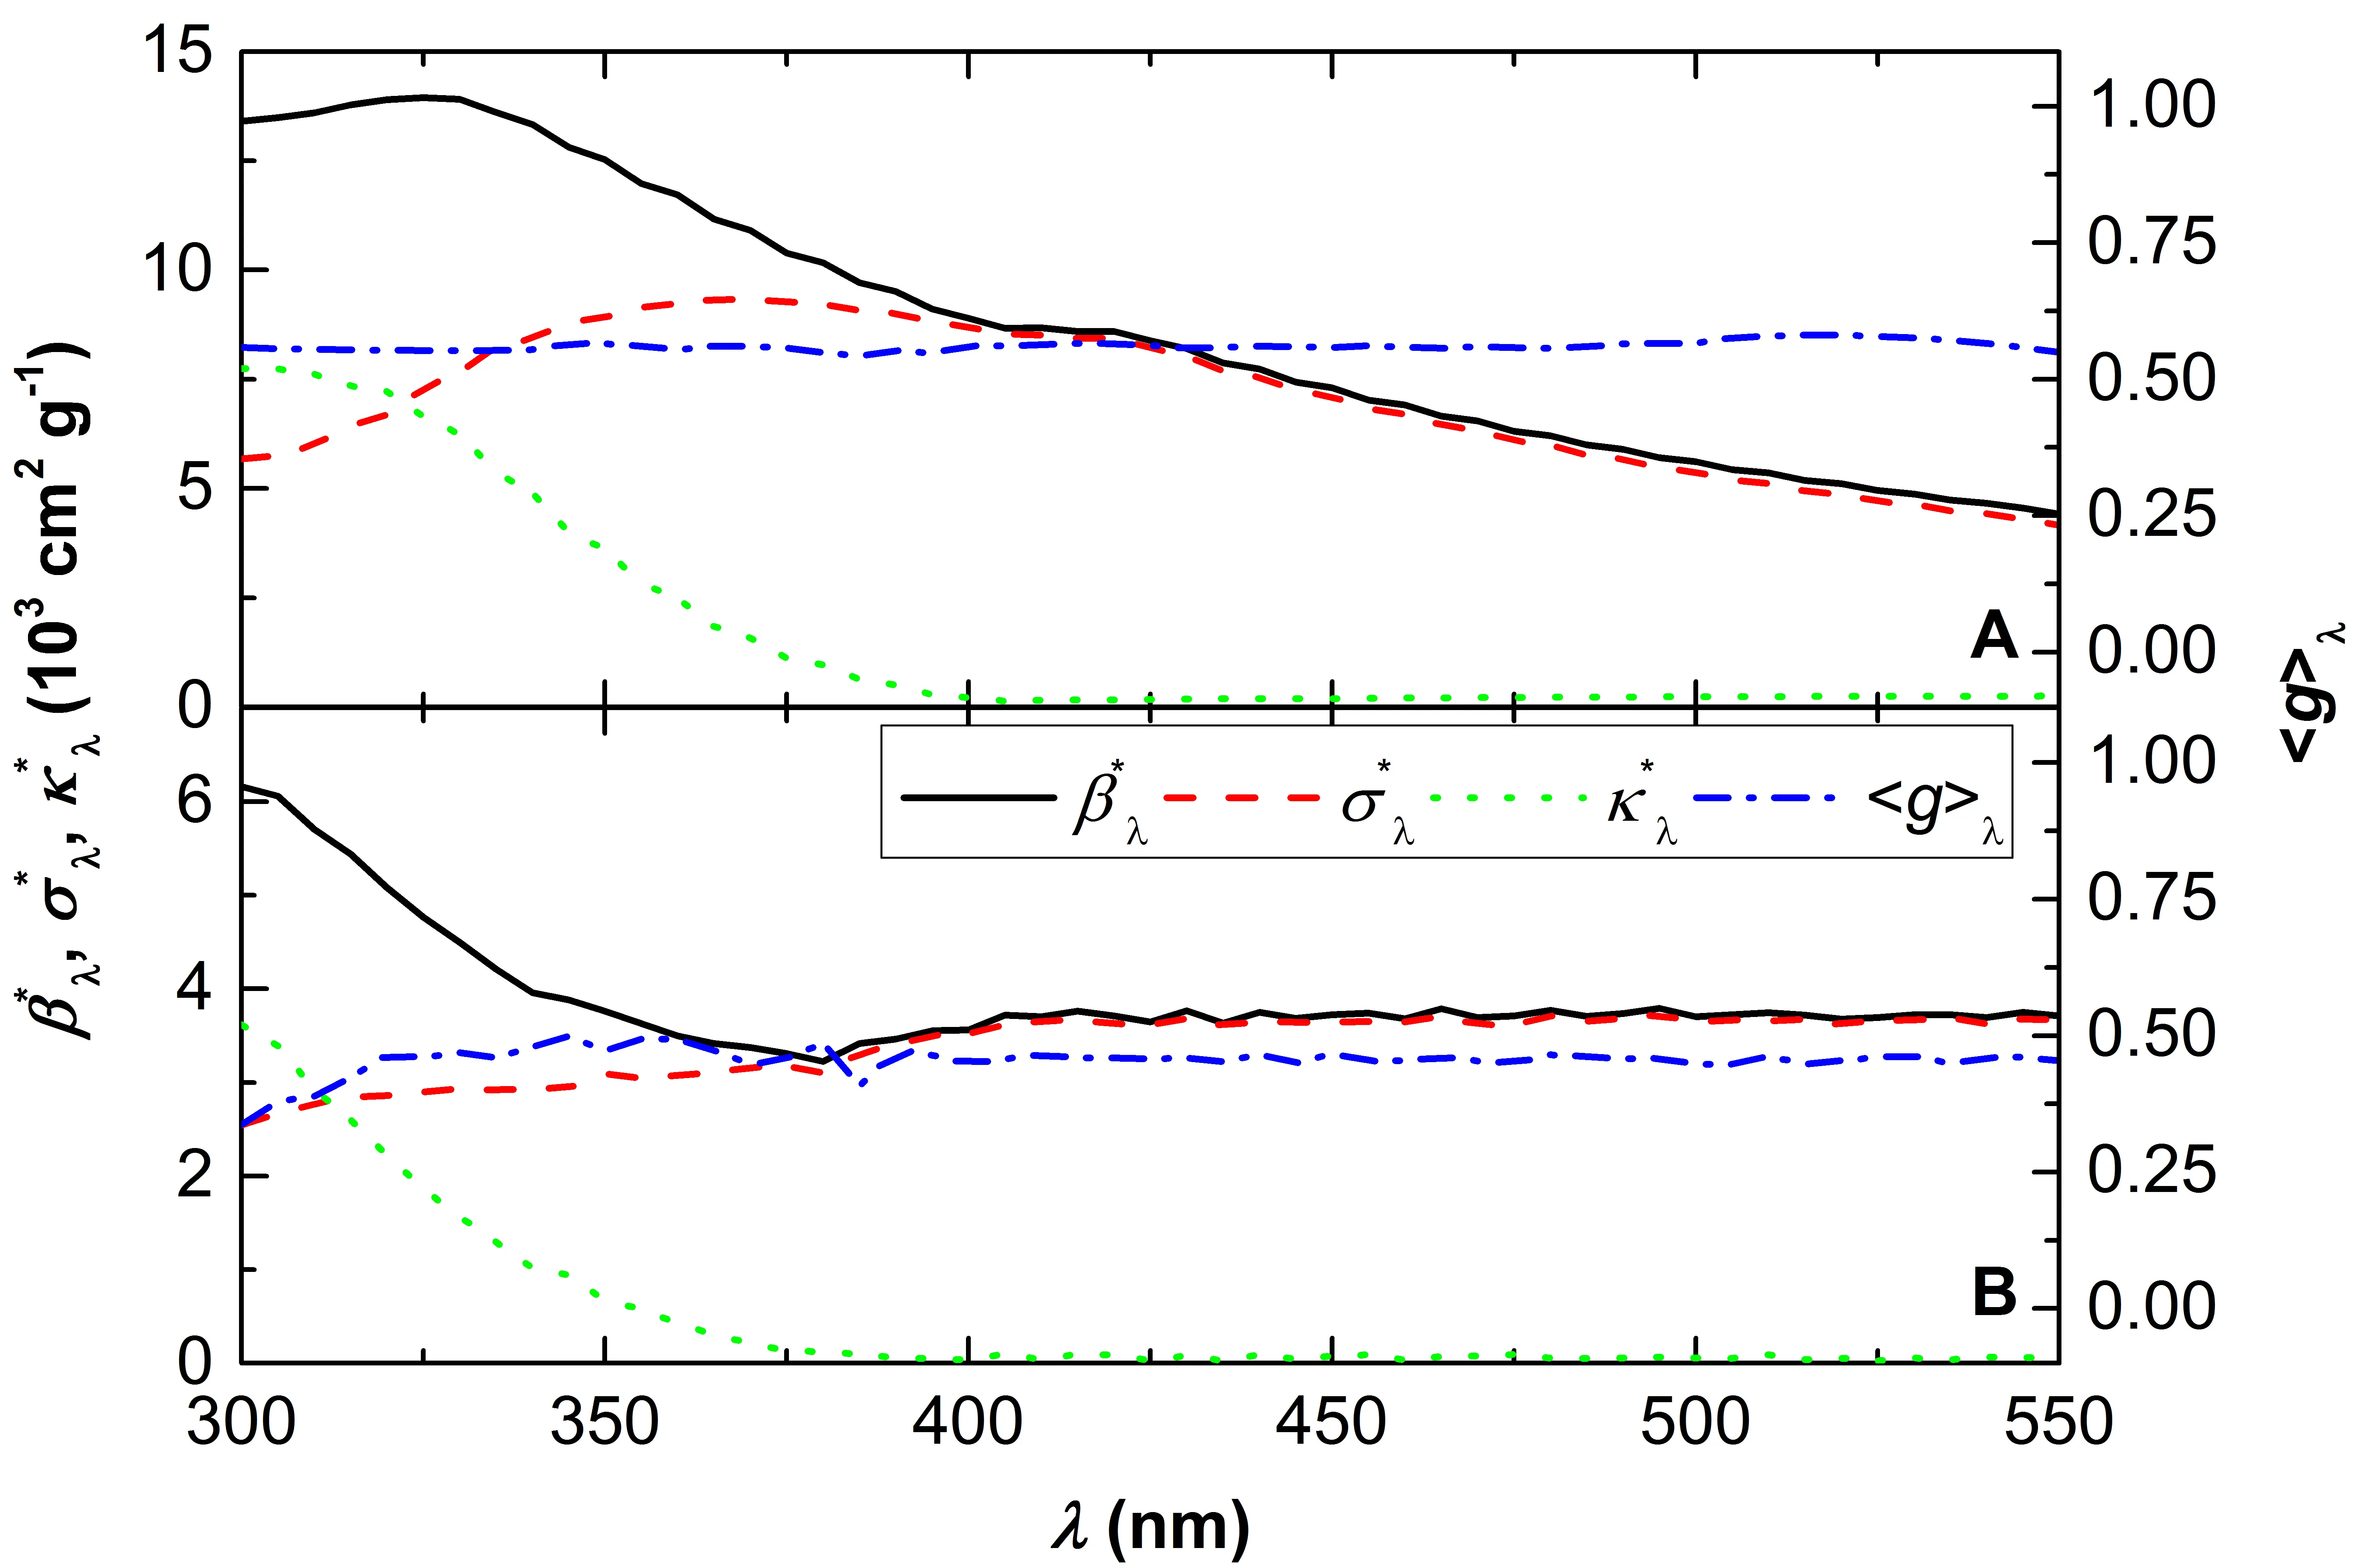
Figure 3. Specific optical coefficients (βλ*, σλ*, and κλ*), and the coefficient of asymmetry averaged over catalyst concentrations (〈gλ〉) as a function of the wavelength for N-TiO2 (A), and TiO2 (B).
3.3. Photocatalytic Degradation of Formic or Salicylic Acid
Figure 4 shows the degradation curves of formic acid under the effect of different radiation sources, in terms of the evolution of TOC in solution. Photolysis of formic acid in the absence of a photocatalyst was negligible under different illumination conditions, as shown in Figure S7A. N-TiO2 and P-25 showed the highest photocatalytic activity under UVA radiation. In the case of white light (WL), a slight degradation was observed for N-TiO2 and P-25. Blue light (BL) and filtered white light (FWL) were unable to activate the photocatalysts for formic acid degradation. These results indicate that the presence of UVA light is necessary to achieve formic acid degradation.

Figure 4. Degradation curves for formic acid under different radiation sources: WL: white light; FWL: filtered white light; UVA: UVA light; BL: blue light.
Figure 5 displays degradation curves of salicylic acid under the effect of different radiation sources. As in the previous case, photolysis of salicylic acid in the absence of a photocatalyst was negligible under different illumination conditions (see Figure S7B). The highest photocatalytic activity was observed for P-25 and N-TiO2 under UVA illumination, followed by BL and WL. In the case of TiO2, slight photocatalytic activity was observed only for UVA illumination. The difference with respect to formic acid is noteworthy. Salicylic acid is degraded under BL, WL and FWL. This behavior may be a consequence of the chemisorption of salicylic on the surface of the photocatalysts. It was previously reported that a charge transfer surface complex formed at the surface of the photocatalysts absorbed light in the visible range (close to 420 nm) [29,30,31]. The photo-induced electrons can be directly transferred from the highest occupied molecular orbital (HOMO) of salicylic to the TiO2 conduction band. The electron is then transferred to O2, partially oxidising salicylic acid to radical cations and reducing O2 to different reactive oxygen species. This phenomenon may be responsible for the different behavior shown by salicylic with regards to formic acid. It is worth mentioning that recent studies have demonstrated that catechol coordinates with titanium atoms at TiO2 P-25 surface, enabling visible light absorption through ligand-to-metal charge transfer (LMCT) transitions. Similar to the case of salicylic acid, this mechanism allows electrons to be injected from the HOMO of catechol into the conduction band of TiO2 upon excitation with light of wavelengths ≥320 nm [32].
Oxidation of salicylic acid led to the formation of different byproducts. The spectra of the solutions taken at different treatment times showed the presence of byproducts that change the absorption pattern (see Figure S6, Figure S7 and Figure S8). A thorough analysis of byproducts generated by photocatalysis under different illumination sources was presented elsewhere [23].
Initial reaction rates ν0 were obtained from the experimental data of formic or salicylic concentration as a function of time (Figure 4 and Figure 5) using a pseudo-order zero kinetics model. This approach gave the best fits of the data, and it was previously used for a wide range of formic [33,34] and salicylic acid concentrations [29]. Figure S9 and Table S1 (see Supplementary Material) show the fits and sum of squared residuals (SSR) of the concentration vs. time curves for the different photocatalysts.
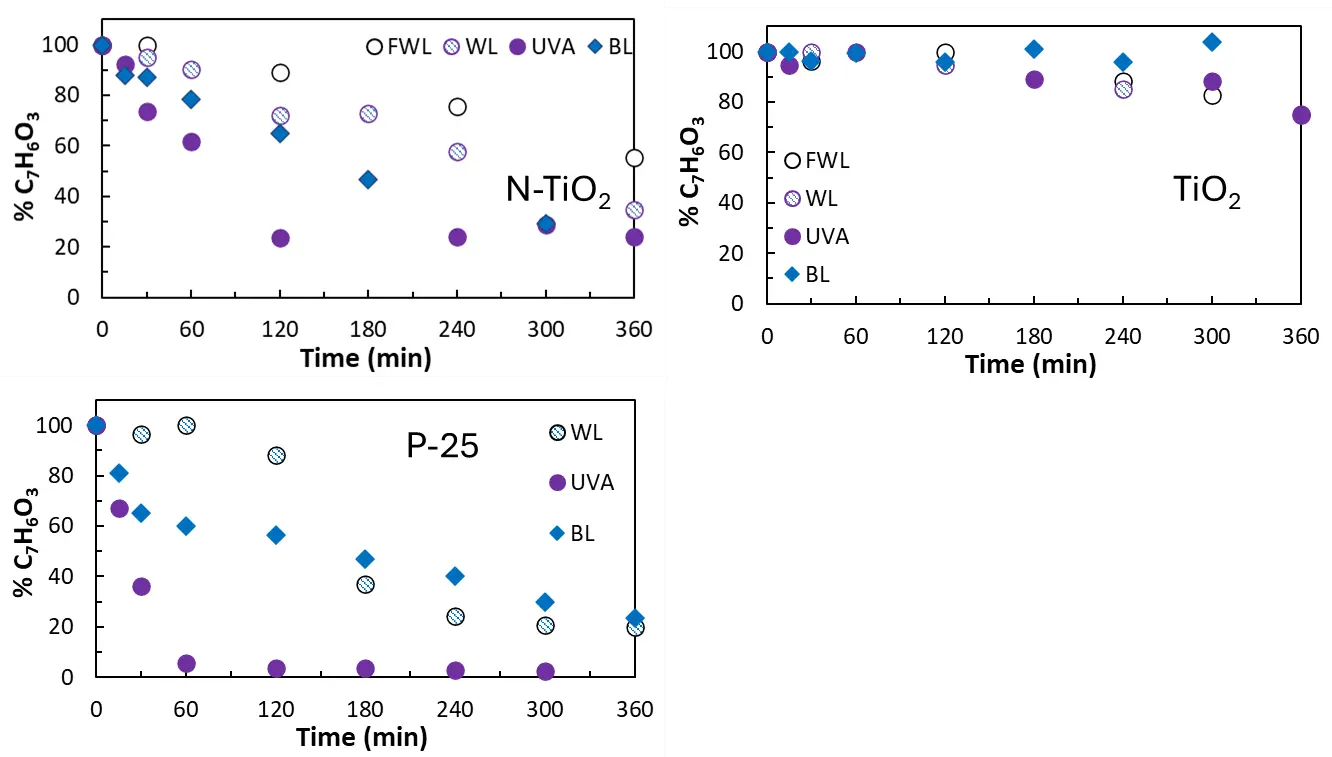
Figure 5. Degradation curves for salicylic acid under different radiation sources: WL: white light; FWL: filtered white light; UVA: UVA light; BL: blue light.
3.4. Photonic and Quantum Efficiencies
The photonic efficiencies ηp, were calculated as the ratio of the degradation rates ν0 (see Table S1), to the incident photon flux, Fe (Figure S1), determined by actinometry with potassium ferrioxalate in the reactor (Equation (1)). The quantum efficiencies ηrxn for the three photocatalysts were calculated from Equation (4) using the photonic efficiency ηp values obtained from the photocatalysis experiments and the photon absorption efficiency ηabs values obtained from the Monte Carlo simulations. Table 1 shows the values of ν0 and the different efficiencies for the cases where photocatalytic degradation was observed during the studied period. Table 1 suggests that, despite the modifications applied to the photocatalysts, the quantum efficiency remains on the same order of magnitude and comparable to previously reported values. This phenomenon is primarily attributed to the high recombination rate of photogenerated electron–hole pairs, although other factors also contribute to limiting the quantum efficiency (see, for example, references [20,35,36]).
Table 1. Initial reaction rate, photonic, absorption, and quantum efficiencies of the photocatalysts under different illumination sources.
Quantum efficiencies for the degradation of formic acid follow the order P-25 > N-TiO2 > TiO2 under both UVA and WL. The photon absorption efficiency of UVA was higher for TiO2 and N-TiO2 than for P-25, while the photonic efficiency was higher for P-25, leading to a higher value of the quantum efficiency. These results indicate that photons are better utilized by P-25 than by the other photocatalysts. It was reported that the structure of P-25 with an intimate connection between anatase and rutile improve charge separation, giving a higher quantum yield than other photocatalysts [37,38]. When FWL was used, no degradation was observed in any case. This result suggests that in the case of WL, the slight degradation observed may be consequence of the presence of a fraction of UVA (see Figure S1 in the Supplementary Material). When BL was used as an illumination source, no degradation of formic acid was observed during the studied time. This result indicates that electrons exited by BL and FWL leave holes with redox potential not enough to oxidize formic acid or to generate HO· radicals. Several authors indicated that doping with urea generates g-C3N4-TiO2 junctions with a valence band potential close to = +1.6 V (NHE) [15], which is not enough to oxidize H2O to HO· (Eº(HO·/H2O) = +2.32 V, NHE, [39]. Although the reduction potential of the couple CO2/HCOOH is −0.61 V (NHE) [40], the driving force may not be enough to lead to the mineralization of formic acid, which is barely adsorbed on TiO2 surface at the working pH. In the case of P-25, although the presence of mixed anatase/rutile phases improves charge separation even under visible light, the intervention of surface traps lowers the redox potential.
Quantum efficiency for the degradation of salicylic acid follows the order P-25 > N-TiO2 > TiO2 under UVA and WL illumination, and N-TiO2 ≥ P-25 under BL. Unlike the formic acid case, the quantum efficiency was measurable under FWL and BL illumination. As discussed before, these results indicate that there would be a component of visible light absorption by the TiO2-salicylic acid surface complex, which leads to degradation but not to mineralization. This effect is increased with N-TiO2, which, being yellow, also absorbs visible light. It is noteworthy that the BL photon absorption efficiency is 75% for N-TiO2 while it is 43% for P-25. Although the redox potential of salicylic acid is in the range 1.2–1.3 V (NHE) [41], it is close to the conduction band potential of g-C3N4—TiO2 junction, the strong absorption of BL photons may help in the generation of holes and the oxidation of adsorbed salicylic acid.
4. Conclusions
The incorporation of nitrogen into TiO2 maintains a photon absorption efficiency above 80% under UVA irradiation, decreasing to 71% and 75% under white light (WL) and blue light (BL) irradiation, respectively. These values are significantly higher than those observed for TiO2 P-25, which exhibit 60%, 43%, and 49% absorption efficiencies under UVA, BL, and WL, respectively. The quantum efficiency for the photocatalytic degradation of both model contaminants was markedly higher under UVA illumination compared to BL or WL. Specifically, for N-TiO2, the quantum efficiency for formic acid degradation under UVA was 218% higher than under WL; for P-25, this difference was 182%, while for undoped TiO2, no degradation was observed under WL. No formic acid degradation occurred under BL with any of the tested materials. In the case of salicylic acid degradation, the quantum efficiency of N-TiO2 under UVA was 163% higher than under WL and 600% higher than under BL. For undoped TiO2, the efficiency under UVA was 150% greater than under WL, and for P-25, the increase was 93% over WL and 2500% over BL. These results suggest that the nitrogen doping strategy employed in this study results in a photocatalyst that is unable to generate high-oxidation-potential holes under BL or WL illumination. This behavior is likely associated with hole generation mediated by surface trap states or g-C3N4–TiO2-type heterojunctions, which possess a redox potential of ca. 1.6 V, lower than that of the TiO2 valence band (ca. 2.7 V). Notably, the degradation of salicylic acid under BL and WL was more pronounced than that of formic acid, indicating that surface complex formation plays a key role in the degradation mechanism via electron transfer processes that enhance the effective use of visible light. Moreover, nitrogen doping was found to improve the quantum efficiency of TiO2 under UVA illumination. This effect is associated with the presence of a small rutile fraction in the material and an increase in specific surface area. P-25 exhibited the highest quantum efficiency under both UVA and WL in all cases, attributed to its superior photonic efficiency, although under BL its performance was comparable to that of N-TiO2. These findings indicates that efficient utilization of UVA photons is more critical than a mere increase in photon absorption.
Supplementary Materials
The following supporting information can be found at: https://www.sciepublish.com/article/pii/727, Figure S1: Emission spectra of the different lamps; Calculations and theory: Implementation of Monte Carlo simulations to calculate photon absorption efficiency; Figure S2: Transmittance spectrum of methacrylate cylindrical filter; Figure S3: SEM images an XRD pattern of TiO2 P-25; Figure S4: Flowchart of the Monte Carlo algorithm used for the simulation of the reactor, where n is the number of photons extinguished and nT is the total number of photons at the beginning of the simulation; Figure S5: Coefficients of extinction (a) and absorption (b) as a function of concentration for three different wavelengths, for the N-TiO2 photocatalyst. Also included are linear regressions for each dataset with their respective values for the coefficient of determination R2; Figure S6: temporal evolution of salicylic and formic acid during adsorption; Figure S7: Effect of UVA, WL and BL irradiation on aqueous solutions of formic or salicylic acid; Figure S8: Absorption spectra of salicylic acid after different photocatalytic treatment times. Photocatalyst: N-TiO2. Light source: UVA, white light (WL), filtered white light (FWL), and blue light (BL); Figure S9: Absorption spectra of salicylic acid after different photocatalytic treatment times. Photocatalyst: TiO2. Light source: UVA, white light (WL), filtered white light (FWL), and blue light (BL); Figure S10: Absorption spectra of salicylic acid after different photocatalytic treatment times. Photocatalyst: TiO2. Light source: UVA, white light (WL), filtered white light (FWL), and blue light (BL); Figure S11: Contaminant degradation as a function of time using the N-TiO2 photocatalyst for formic acid and white light (a), formic acid and UVA radiation (b), salicylic acid and white light (c), salicylic acid and UVA radiation (d). Data fits are included in the figures, using the pseudo-order zero (Ord 0), pseudo-order 1 (Ord 1), and Langmuir-Hinshelwood (L-H) models; Table S1: Sum of squared residuals (SSR) of the fits of the concentration vs. time curves for the different photocatalysts. The considered models were the pseudo-order zero (Ord 0), pseudo-order 1 (Ord 1), and Langmuir-Hinshelwood (L-H) (for some example plots, see Figure S11). The fitted values of the initial rate of reaction $$ {v}_{0} $$ for the Ord 0 model are also included.
Acknowledgments
The authors gratefully acknowledge the support given by Universidad Nacional de San Martín, Universidad Nacional del Litoral and Consejo Nacional de Investigaciones Científicas y Técnicas (CONICET). OMA, PFFC and RJC are members of CONICET.
Author Contributions
Conceptualization, O.M.A., R.J.C. and P.F.F.C.; Methodology, E.B.B. and P.F.F.C.; Software, P.F.F.C.; Validation, O.M.A., R.J.C. and E.B.B.; Formal Analysis, E.B.B. and P.F.F.C.; Investigation, E.B.B., P.F.F.C. and R.J.C.; Resources, R.J.C.; Data Curation, O.M.A.; Writing—Original Draft Preparation, R.J.C. and P.F.F.C.; Writing—Review & Editing, R.J.C. and O.M.A.; Project Administration, R.J.C.; Funding Acquisition, R.J.C. and P.F.F.C.
Ethics Statement
Not applicable.
Informed Consent Statement
Not applicable.
Data Availability Statement
Data will be available under requirement.
Funding
This research was funded by Agencia Nacional de PromociónCientífica y Tecnológica, PICT 2019-3263, PICT 2014-750 and PICT 2014-2386 (Argentina).
Declaration of Competing Interest
The authors declare that they have no known competing financial interests or personal relationships that could have appeared to influence the work reported in this paper.
References
- Liao CH, Huang CW, Wu JC. Hydrogen production from semiconductor-based photocatalysis via water splitting. Catalysts 2012, 2, 490–516. [Google Scholar]
- Garg S, Chandra A. (Eds.) Photocatalysis for Environmental Remediation and Energy Production: Recent Advances and Applications; Springer: Cham, Switzerland, 2023. doi:10.1007/978-3-031-27707-8. [Google Scholar]
- Zhou R, Guzman MI. CO2 reduction under periodic illumination of ZnS. J. Phys. Chem. C 2014, 118, 11649–11656. [Google Scholar]
- Aguirre ME, Zhou R, Eugene AJ, Guzman MI, Grela MA. Cu2O/TiO2 heterostructures for CO2 reduction through a direct Z-scheme: Protecting Cu2O from photocorrosion. Appl. Catal. B Environ. 2017, 217, 485–493. [Google Scholar]
- Alam U. Role of Heterogeneous Semiconductor Photocatalysts in Green Organic Synthesis. In Photocatalysis for Environmental Remediation and Energy Production; Garg S, Chandra A, Eds.; Green Chemistry and Sustainable Technology; Springer: Cham, Switzerland, 2023. doi:10.1007/978-3-031-27707-8_11. [Google Scholar]
- Guzman MI. Feature Papers in Photochemistry. Photochem 2024, 12, 511–517. doi:10.3390/photochem4040032. [Google Scholar]
- Guo W, Guo T, Zhang Y, Yin L, Dai Y. Progress on simultaneous photocatalytic degradation of pollutants and production of clean energy: A review. Chemosphere 2023, 339, 139486. doi:10.1016/j.chemosphere.2023.139486. [Google Scholar]
- Parwaiz S, Khan MM. Perovskites and perovskite-based heterostructures for photocatalytic energy and environmental applications. J. Environ. Chem. Eng. 2024, 12, 113175. doi:10.1016/j.jece.2024.113175. [Google Scholar]
- Feng X, Yu Z, Sun Y, Long R, Shan M, Li X, et al. Review MXenes as a new type of nanomaterial for environmental applications in the photocatalytic degradation of water pollutants. Ceram. Int. 2021, 47, 7321–7343. [Google Scholar]
- Chen C, Fei L, Wang B, Xu J, Li B, Shen L, et al. MOF-based photocatalytic membrane for water purification: A review. Small 2024, 20, 2305066. doi:10.1002/smll.202305066. [Google Scholar]
- Liu S, Wang M, He Y, Cheng Q, Qian T, Yan C. Covalent organic frameworks towards photocatalytic applications: Design principles, achievements, and opportunities. Coord. Chem. Rev. 2023, 475, 214882. doi:10.1016/j.ccr.2022.214882. [Google Scholar]
- Wang J, Sun S, Zhou R, Li Y, He Z, Ding H, et al. A review: Synthesis, modification and photocatalytic applications of ZnIn2S4. J. Mater. Sci. Technol. 2021, 78, 1–19. doi:10.1016/j.jmst.2020.09.045. [Google Scholar]
- Du S, Lian J, Zhang F. Visible Light-Responsive N-Doped TiO2 Photocatalysis: Synthesis, Characterizations, and Applications. Trans. Tianjin Univ. 2022, 28, 33–52. doi:10.1007/s12209-021-00303-w. [Google Scholar]
- Natarajan TS, Mozhiarasi V, Tayade RJ. Nitrogen Doped Titanium Dioxide (N-TiO2): Synopsis of Synthesis Methodologies 2022, Doping Mechanisms, Property Evaluation and Visible Light Photocatalytic Applications. Photochem 2021, 1, 371–410. doi:10.3390/photochem1030024. [Google Scholar]
- Rengifo-Herrera JA, Osorio-Vargas P, Pulgarin C. A critical review on N-modified TiO2 limits to treat chemical and biological contaminants in water. Evidence that enhanced visible light absorption does not lead to higher degradation rates under whole solar light. J. Hazard. Mater. 2022, 425, 127979. doi:10.1016/j.jhazmat.2021.127979. [Google Scholar]
- Irie H, Watanabe Y, Hashimoto K. Nitrogen-concentration dependence on photocatalytic activity of TiO2−x Nx powders. J. Phys. Chem. B 2003, 107, 5483–5486. [Google Scholar]
- Hoque MA, Guzman MI. Photocatalytic activity: Experimental features to report in heterogeneous photocatalysis. Materials 2018, 11, 1990. [Google Scholar]
- Braslavsky SE, Braun AM, Cassano AE, Emeline AV, Litter MI, Palmisano L, et al. Glossary of terms used in photocatalysis and radiation catalysis (IUPAC Recommendations 2011). Pure Appl. Chem. 2011, 83, 931–1014. [Google Scholar]
- Alfano OM, Cassano AE, Brandi RJ, Satuf ML. A methodology for modeling slurry photocatalytic reactors for degradation of an organic pollutant in water. In Photocatalysis and Water Purification: From Fundamentals to Recent Applications; Wiley-VCH: Weinheim, Germany, 2013; pp. 335–359. doi:10.1002/9783527645404.ch13. [Google Scholar]
- Manassero A, Satuf ML, Alfano OM. Evaluation of UV and visible light activity of TiO2 catalysts for water remediation. Chem. Eng. J. 2013, 225, 378–386. doi:10.1016/j.cej.2013.03.097. [Google Scholar]
- Manassero A, Satuf ML, Alfano OM. Kinetic modeling of the photocatalytic degradation of clofibric acid in a slurry reactor. Environ. Sci. Pollut. Res. 2015, 22, 926–937. doi:10.1007/s11356-014-2682-5. [Google Scholar]
- el Mehdi Zekri M, Colbeau-Justin C. A mathematical model to describe the photocatalytic reality: What is the probability that a photon does its job? Chem. Eng. J. 2013, 225, 547–557. doi:10.1016/j.cej.2013.03.129. [Google Scholar]
- Bracco E, Butler M, Carnelli P, Candal R. TiO2 and N-TiO2-photocatalytic degradation of salicylic acid in water: Characterization of transformation products by mass spectrometry. Environ. Sci. Pollut. Res. 2020, 27, 28469–28479. [Google Scholar]
- Satuf ML, Brandi RJ, Cassano AE, Alfano OM. Experimental method to evaluate the optical properties of aqueous titanium dioxide suspensions. Ind. Eng. Chem. Res. 2005, 44, 6643–6649. [Google Scholar]
- Murov SL, Carmichael I, Hug GL. Handbook of Photochemistry; CRC Press: Boca Raton, FL, USA, 1993. [Google Scholar]
- Howell JR, Pinar Mengüc M, Daun K, Siegel R. Thermal Radiation Heat Transfer; CRC Press: Boca Raton, FL, USA, 1993. [Google Scholar]
- Tolosana-Moranchel Á, Manassero A, Satuf ML, Alfano OM, Casas JA, Bahamonde A. Influence of TiO2-rGO optical properties on the photocatalytic activity and efficiency to photodegrade an emerging pollutant. Appl. Catal. B Environ. 2019, 246, 1–11. [Google Scholar]
- Yurdakal S, Loddo V, Bayarri Ferrer B, Palmisano G, Augugliaro V, Giménez Farreras J, et al. Optical properties of TiO2 suspensions: Influence of pH and powder concentration on mean particle size. Ind. Eng. Chem. Res. 2007, 46, 7620–7626. [Google Scholar]
- Regazzoni AE, Mandelbaum P, Matsuyoshi M, Schiller S, Bilmes SA, Blesa MA. Adsorption and photooxidation of salicylic acid on titanium dioxide: A surface complexation description. Langmuir 1998, 14, 868–874. doi:10.1021/la970665n. [Google Scholar]
- Wang N, Zhu L, Huang Y, She Y, Yu Y, Tang H. Drastically enhanced visible-light photocatalytic degradation of colorless aromatic pollutants over TiO2 via a charge-transfer-complex path: A correlation between chemical structure and degradation rate of the pollutants. J. Catal. 2009, 266, 199–206. doi:10.1016/j.jcat.2009. 06.006. [Google Scholar]
- Park J, Moon GH, Shin KO, Kim J. Oxalate-TiO2 complex-mediated oxidation of pharmaceutical pollutants through ligand-to metal charge transfer under visible light. Chem. Eng. J. 2018, 343, 689–698. doi:10.1016/j.cej.2018.01.078. [Google Scholar]
- Hoque MA, Barrios Cossio J, Guzman MI. Photocatalysis of Adsorbed Catechol on Degussa P25 TiO2 at the Air–Solid Interface. J. Phys. Chem. C 2024, 128, 17470–17482. [Google Scholar]
- Bideau M, Claudel B, Otterbein M. Photocatalysis of formic acid oxidation by oxygen in an aqueous medium. J. Photochem. 1980, 14, 291–302. [Google Scholar]
- Dijkstra MFJ, Michorius A, Buwalda H, Panneman HJ, Winkelman JGM, Beenackers AACM. Comparison of the efficiency of immobilized and suspended systems in photocatalytic degradation. Catal. Today 2001, 66, 487–494. [Google Scholar]
- Wang CY, Rabani J, Bahnemann DW, Dohrmann JK. Photonic efficiency and quantum yield of formaldehyde formation from methanol in the presence of various TiO2 photocatalysts. J. Photochem. Photobiol. A Chem. 2002, 148, 169–176. [Google Scholar]
- Davydov L, Smirniotis PG. Quantification of the primary processes in aqueous heterogeneous photocatalysis using single-stage oxidation reactions. J. Catal. 2000, 191, 105–115. [Google Scholar]
- Kumar SG, Devi LG. Review on modified TiO2 photocatalysis under UV/visible light: Selected results and related mechanisms on interfacial charge carrier transfer dynamics. J. Phys. Chem. A 2011, 115, 13211–13241. [Google Scholar]
- Hurum DC, Agrios AG, Gray KA, Rajh T, Thurnauer MC. Explaining the enhanced photocatalytic activity of Degussa P25 mixed-phase TiO2 using EPR. J. Phys. Chem. B 2003, 107, 4545–4549. [Google Scholar]
- Wood PM. The potential diagram for oxygen at pH 7. Biochem. J. 1988, 253, 287. [Google Scholar]
- Shehzad N, Tahir M, Johari K, Murugesan T, Hussain M. A critical review on TiO2 based photocatalytic CO2 reduction system: Strategies to improve efficiency. J. CO2 Util. 2018, 26, 98–122. [Google Scholar]
- Colucci J, Montalvo V, Hernandez R, Poullet C. Electrochemical oxidation potential of photocatalyst reducing agents. Electrochim. Acta 1999, 44, 2507–2514. [Google Scholar]