Bioenergy Technology and Carbon Intensity in U.S. and China: Threshold Roles of Capital Accumulation, Education and Inequality

Bioenergy Technology and Carbon Intensity in U.S. and China: Threshold Roles of Capital Accumulation, Education and Inequality
Xiangchen Lin
1
Yuanpeng Cao
2
Haichao Yu
3
Chenhui Lu
4
Shangze Dai
5,*

Received: 26 May 2025 Revised: 09 September 2025 Accepted: 30 September 2025 Published: 17 October 2025

© 2025 The authors. This is an open access article under the Creative Commons Attribution 4.0 International License (https://creativecommons.org/licenses/by/4.0/).
1. Introduction
In 2015, the United Nations Climate Change Conference adopted the Paris Agreement, establishing a global framework for climate action after 2020. This agreement set explicit targets to limit the rise in global average temperature to below 2 °C above pre-industrial levels, with an aspirational goal of 1.5 °C. Most signatory countries submitted Nationally Determined Contributions (NDCs) to meet these objectives, specifying their own mitigation strategies. To achieve temperature control targets and address climate change, a significant reduction in carbon emissions from fossil fuels is urgently needed [1]. In response, many countries have pursued measures such as enhancing energy efficiency, expanding renewable energy deployment, and advancing Carbon Capture and Storage (CCS) technologies [2].
Despite the positive efforts and progress made by various countries in combating climate change, a substantial gap in meeting the Paris Agreement’s temperature control targets. The Emissions Gap Report 2019 shows that, even if all current unconditional commitments are met, global average temperature could still rise by 3.2 °C by 2030. To achieve the 1.5 °C temperature control target at the lowest cost, global greenhouse gas emissions must peak immediately and then decrease by about 7.6% per year from 2020 to 2030. However, in practice, carbon emissions slightly increased from 2020 to 20221. Consequently, multiple approaches are being explored and implemented in both production and everyday life to curb carbon emissions [3]. One promising approach is the development and deployment of bioenergy technology [4].
Biomass refers to all renewable organic matter from animals and plants, except fossil fuels. Essentially, these substances come from organisms formed through photosynthesis. Therefore, they are directly or indirectly derived from photosynthesis in green plants and can be converted into conventional solid, liquid, and gaseous fuels [5]. For example, China’s “Renewable Energy Medium and Long-term Development Plan” notes about 500 million tons of standard coal derived from the country’s biomass resources for energy use. As afforestation areas expand and socio-economic development progresses, this potential could rise to 1 billion tons of standard coal. Against the backdrop of depleting traditional energy sources, biomass has emerged as an ideal alternative [6].
Ideally, bioenergy is carbon neutral. This is because the carbon atoms in organisms originate nature,with most stored as carbohydrates derived from atmospheric carbon dioxide through photosynthesis [7]. When biomass is combusted, the carbon released is reabsorbed into the atmosphere, and the overall balance of atmospheric carbon should, in principle, remain unchanged. In reality, however, this idealized cycle rarely holds. Booth [8] argues that the assumption of biomass combustion being “low carbon” is valid only under two conditions: first, the biomass used for energy must be left over from other processes, and second, the cumulative net emissions, namely the additional CO2 released, must be sufficiently low or negligible to deliver meaningful climate benefits.
Existing research on this issue primarily examines micro-level mechanisms and conditions under which bioenergy contributes to sustainable development. Hanssen et al. [9] found that the extent of negative emissions depends heavily on factors such as the location of biomass cultivation, treatment of original vegetation, the type of final energy carrier, and the evaluation period. Hu et al. [10] emphasized that pollution issues caused by BECCS cannot be ignored. Therefore, future research needs to focus on accurate land-use models and advanced biofuel extraction technologies on a global scale. Masum et al. [11] found that the use of bioenergy helps mitigate carbon emissions, and carbon taxes can make bioenergy feedstocks in Georgia, USA, competitive with coal in reducing carbon emissions from the power sector. Similarly, Rather et al. [12] argued that replacing fossil fuels with biofuels can significantly reduce the harmful impacts caused by various fossil fuels. Identifying crop planting areas, appropriate bioenergy varieties, and proper management practices will help improve environmental and biochemical sustainability. While these studies highlight the potential of bioenergy from various perspectives, further empirical research is required to assess its broader macroeconomic and social impacts, particularly its influence on carbon emissions [13].
Given the complexity of applying these technologies in practice, two central questions arise: What impact does the development of bioenergy technologies have on carbon emissions at the macro level? How do these impacts vary with different regional attributes? To address these questions, we conducted an empirical analysis using panel data from all first-level administrative units of the two countries with the highest carbon emissions and representative developed and developing countries, the United States and China, from 2010 to 2021. We chose carbon intensity as the dependent variable and the number of patents related to “bioenergy” as the independent variable. Methodologically, we used panel threshold regression to examine the coefficients for the full sample and employed a random forest model to predict these coefficients, aiming to demonstrate the heterogeneity of these coefficients across different regions.
In selecting threshold variables, we focus on education level, income inequality (Gini coefficient), and per capita capital stock. This choice is grounded in both theory and empirical evidence. Human capital, proxied by education, plays a decisive role in enhancing the absorptive capacity and diffusion of green technologies, thereby amplifying their environmental benefits [14]. Income inequality has also been identified as an important conditioning factor: moderate inequality may foster innovation incentives, but excessive inequality weakens collective action and the effectiveness of environmental technologies [15]. Capital accumulation, in turn, provides the material foundation for adopting new technologies and reflects the structural upgrading capacity of an economy [16]. By focusing on these three threshold variables, we capture core dimensions of human capital, social distribution, and economic endowment that the literature highlights as key moderators of the bioenergy and carbon nexus.
Our findings indicate that the impact of bioenergy technology on carbon intensity exhibits clear threshold effects, shaped by capital accumulation, educational attainment, and income inequality. In the United States, the effect of bioenergy technology on carbon intensity is initially positive but turns negative as per capita capital stock rises. Higher average years of education strengthen its inhibitory effect, whereas increases in the Gini coefficient shift the effect from negative to insignificant. In contrast, China shows a different configuration: increasing capital stock diminishes the inhibitory impact of bioenergy technology, while education consistently strengthens it. Unlike in the U.S., income inequality exerts no significant influence. Across both countries, these threshold dynamics also vary notably across regions.
The structure of the paper is as follows: Section 2 presents the data, samples, and models used; Section 3 displays the results of the threshold regression; Section 4 showcases the regional heterogeneity results based on the random forest model; Section 5 concludes with the paper’s findings and discussions.
2. Methodology
2.1. Threshold Regression
The threshold effect refers to a significant change in the impact of one variable when another variable reaches or exceeds a specific critical value (threshold). This change typically manifests as a sudden shift in the relationship between the dependent and independent variables. For example, the effect may turn from positive to negative, change from significant to insignificant, or follow other forms of non-linear transformation. In this paper, the influence of bioenergy technology on carbon emissions demonstrates such threshold effects, depending on the variation of certain conditioning variables.
To test for this phenomenon, we employ the panel threshold model [17]. This model endogenously determines the threshold value based on sample characteristics and then evaluates its statistical significance and validity. Doing so avoids the bias introduced by subjective grouping or the use of interaction terms. The model is therefore well-suited to detect structural breaks and heterogeneity in how the independent variables affect the dependent variable across different thresholds. The formal model specification is as follows:
```latex{\text{Y}}_{\text{it}}\text{=}\sum _{\text{j=1}}^{\text{n}}{\text{γ}}_{\text{j+1}}\text{*I}\left({\text{T}}_{\text{it}}\text{∈}\left[{\text{inf}}_{\text{j}}\text{,}{\text{sup}}_{\text{j}}\right)\right)\text{*}{\text{X}}_{\text{it}}\text{ }\text{+}\text{ }\text{γ*}{\text{control}}_{\text{it}}\text{ }\text{+}\text{ }\text{i}\text{ }\text{+}\text{ }\text{t}\text{ }\text{+}\text{ }{\epsilon }_{it}``` |
(1) |
In the model, β represents the coefficients to be estimated; I is the indicator function, which takes the value of 1 if the condition within the parentheses is true, and 0 otherwise; T is the threshold variable; inf and sup denote the interval of the threshold variable, i.e., the critical values of the thresholds; and n represents the number of thresholds. The panel threshold model can identify non-linear relationships between variables. Unlike traditional linear models, it allows the relationship between the dependent and independent variables to change with variations in a threshold variable, thereby more accurately reflecting complex economic and social phenomena [3].
2.2. Random Forest
The Random Forest model is an ensemble learning method based on decision trees that improves prediction performance and stability by combining multiple decision trees. The fundamental principles of this model include:
1. Ensemble Learning: The Random Forest model constructs multiple independent decision trees and averages their predictions (for regression problems) or uses majority voting (for classification problems) to improve the overall accuracy and robustness of the model. 2. Introduction of Randomness: Each decision tree is built by sampling the data with replacement (i.e., bootstrap sampling) and, at each node split, randomly selecting a subset of features to determine the best split. This approach increases model diversity and reduces overfitting [18].
Therefore, we apply the Random Forest model with bioenergy technology as the main predictor to forecast carbon intensity. The key advantage of this model is its capacity to handle non-linear relationships and capture interactions among variables in complex systems. In our analysis, we examine not only the overall predictive results for the full sample but also the outcomes for different regions. Special attention is given to how predictions change when threshold variables take different values. This approach allows us to uncover the heterogeneity of threshold effects across regions. In particular, it helps clarify how variations in threshold variables influence the predictive effectiveness of bioenergy technology on carbon intensity in different geographical and economic contexts.
In this study, it is important to emphasize the complementary roles of the panel threshold model and the random forest model. The panel threshold model, grounded in econometric theory, enables a formal test of nonlinearities and threshold effects under clearly defined assumptions [19]. Its key strength lies in producing interpretable parameters and providing statistical inference on how the marginal effect of bioenergy patents changes once economic or social variables cross critical values. In contrast, the random forest model is a nonparametric and data-driven approach that requires fewer structural assumptions. It is particularly effective at capturing complex interactions and non-linear relationships that may not be well represented in econometric frameworks [18]. While the panel threshold model identifies significant thresholds in variables such as education, capital stock, and inequality, the random forest model offers predictive validation and highlights regional heterogeneity in these threshold effects. The convergence of results across these two methods enhances the robustness of our findings, as both approaches reveal consistent patterns despite their different methodological foundations.
2.3. Samples
We need to consider representativeness, importance, and availability for sample selection. Based on these considerations, we ultimately chose the panel data of the first-level administrative divisions of China and the United States, the countries with the highest carbon emissions. These two countries not only play a significant role in global carbon emissions but also have representativeness and broad influence in terms of technological advancement, policy implementation, and economic development. China, as the world’s largest carbon emitter, has a rich application scenario and policy background for bioenergy technology, while the United States, as the world’s second-largest carbon emitter, has significant experience and data in technological innovation and economic restructuring [20]. Therefore, the data from the first-level administrative divisions of these two countries provide a valuable foundation for comparison and analysis, enabling a deeper exploration of the effectiveness and regional differences of carbon emission control technologies and policies. We chose the period from 2010 to 2021 for the sample’s time span. The reason is that some data were missing for the United States before 2010, and some data after 2021 have not yet been published.
2.4. Variables
2.4.1. Explained Variable: Carbon Intensity
Carbon Intensity (CAINT) refers to the amount of carbon dioxide emissions produced per unit of economic output, commonly used to measure the carbon emission efficiency of economic activities. Specifically, carbon intensity is often expressed as the amount of carbon dioxide emitted per unit of Gross Domestic Product (GDP) or per unit of product. It is an important indicator for assessing the level of carbon emissions during economic growth in a country or region [21].
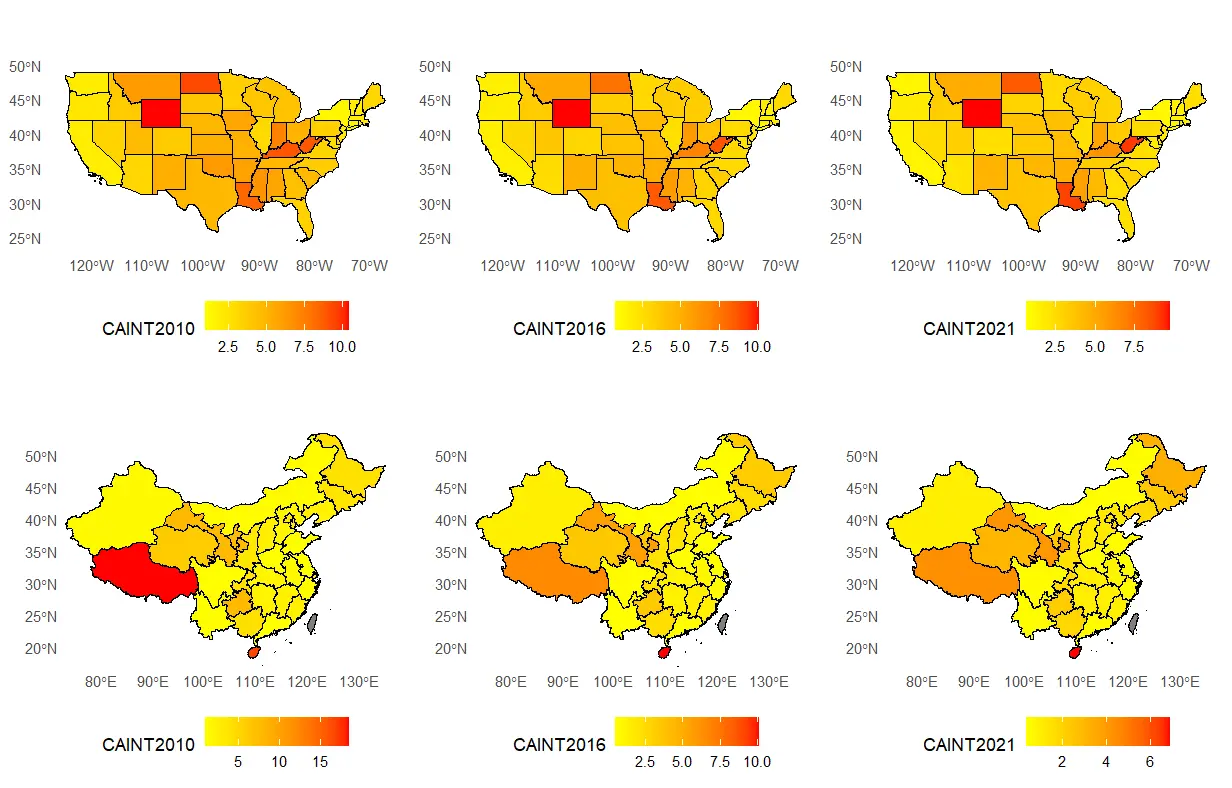
Figure 1 shows the spatiotemporal distribution of CAINT in China and the U.S. In the United States, over the period, the total carbon intensity and its spatial distribution have not undergone significant changes. Regions with higher levels of economic development, such as California, New York, and Washington, have consistently maintained lower carbon intensity. These areas have effectively managed carbon emissions due to their advanced technology and stringent environmental regulations. However, carbon intensity remains high in regions with a strong reliance on traditional industries and energy. For example, with their coal and oil-dominated economies, West Virginia and Louisiana exhibit notably high carbon intensity. Additionally, Wyoming and North Dakota, which rely heavily on energy and mining industries, also have high carbon intensity due to their economic activities closely tied to high carbon emission sectors.
While, the situation is different for China. Over time, China has demonstrated a significant overall decrease in carbon intensity. This trend reflects the positive results of various environmental policies and technological advancements implemented over the past decade. Regionally, the southwestern areas have seen a reduction in carbon intensity, likely due to adjustments in the regional economic structure and the promotion of clean energy. However, in central and northeastern China, carbon intensity has increased, possibly due to the strong presence of heavy industry and ongoing reliance on traditional energy sources. Notably, Tibet and Hainan have emerged as the regions with the highest carbon intensity in China. Tibet’s high carbon intensity may be related to its high-altitude climate, which increases heating needs during winter and significantly boosts carbon emissions. In contrast, Hainan’s consistently high temperatures create a long-standing demand for cooling, which also significantly raises carbon intensity. These regional differences highlight the diverse challenges and solutions faced by different areas in China regarding climate change and carbon emission reduction.
2.4.2. Explanatory Variable: Bioenergy Technology
Bioenergy Technology (BIOTE) refers to the technologies used to produce energy from biomass resources such as plant materials, animal waste, agricultural residues, and municipal solid waste. These technologies include, but are not limited to, biofuel production (e.g., ethanol, biodiesel), biomass power generation, biogas production, and other methods of converting biomass into heat, electricity, or mechanical energy. The main types of bioenergy technologies include biofuel production, biomass power generation, biogas production, and advanced biofuels [22].
Specifically, we use the number of patents with the theme “bioenergy” as a quantification method for Bioenergy Technology. This is because the number of patents is an important indicator of technological innovation and progress. Patent applications and grants represent new technological inventions or improvements and directly reflect the level of innovation and technological development in the field of bioenergy [23]. Therefore, by counting the number of patents related to “bioenergy”, we can quantify technological advancements in this area. Additionally, patent data is publicly available and can be retrieved and analyzed through patent databases (such as Google Patents, USPTO, EPO, etc.). This makes the use of patent counts as a quantification method highly accessible and objective, avoiding biases associated with subjective evaluations. However, we acknowledge that this approach also has important limitations. Patent counts can capture innovation activity in the bioenergy field, but they may not fully reflect the actual level of technology adoption, implementation, or effectiveness in a given region. It is worth noting that in China, patents are divided into invention, utility model, and design categories, while they are divided into utility, design, and plant patents by the United States. To ensure comparability across the two countries, we exclusively focus on invention patents in China and their equivalent utility patents in the United States, as both categories represent higher levels of technological sophistication and innovation. Other patent categories were excluded to avoid measurement bias.
Figure 2 shows the time trends of the total number of patents and the number of patents related to bioenergy technology in the United States and China. Firstly, regarding the total number of patents, the number in the United States has remained relatively stable over the entire period. This stability may reflect the mature system and continuous investment in technological innovation in the U.S., with its innovation output maintaining a high but relatively stable level. In contrast, China has experienced a significant upward trend in the total number of patents. Over the past few decades, China has vigorously promoted technological innovation through policy support, R&D investment, and intellectual property protection, leading to a rapid increase in the number of patent filings. This trend indicates that China is gradually transitioning from being the “world’s factory” to becoming a major player in global technological innovation [24].
However, when focusing specifically on bioenergy technology-related patents, the situation differs. The number of bioenergy technology-related patents in the United States shows a declining trend. This could be due to a shift in the focus of innovation from traditional green energy technologies to other cutting-edge fields such as artificial intelligence, digital economy, and advanced manufacturing [25]. The relative saturation of bioenergy technologies may also lead companies and research institutions to redirect resources toward other more promising technological areas.
In contrast, China’s bioenergy technology-related patents exhibit a trend of increasing initially and then decreasing. In the early stages, there was a growing focus and investment in bioenergy technologies in China, reflecting the government’s and enterprises’ emphasis on a green economy. However, over time, particularly with the rapid development of artificial intelligence and the digital economy, the growth rate of bioenergy technology-related patents began to slow down and even decline. This shift may be attributed to the changing direction of technological advancement from green energy to the digital economy, indicating a shift in China’s focus on technological innovation. Additionally, changes in market demand and policy direction may have prompted research institutions and companies to adjust their R&D priorities.

2.4.3. Threshold Variables
Average Years of Education: This variable represents the average number of years of education received by adults over a specific period. It is a key indicator of the education level and human capital accumulation in a country or region. A higher average year of education typically signifies a more skilled and knowledgeable workforce, which can foster technological innovation and economic growth [26]. This, in turn, can affect the effectiveness of bioenergy technology adoption and utilization.
Gini Coefficient: The Gini coefficient measures the degree of income or wealth inequality within a population. A higher Gini coefficient indicates greater income disparity and higher levels of social inequality. Such inequality may influence policy formulation and implementation, as well as the efficiency of resource allocation and utilization. Consequently, it can impact the effectiveness of bioenergy technology promotion and use [15].
Per Capita Capital Stock: Per capita capital stock refers to the total capital available per economic unit (such as per person or per household) at a specific point in time. For our study, we use 2010 as the base year and estimate the capital stock using the perpetual inventory method. This method estimates capital stock by considering capital accumulation and depreciation. It assumes that annual capital investments increase the total capital stock, adjusted for depreciation. For China and the United States, we selected 10% and 3% depreciation rates, respectively, based on their average economic growth rates. Higher per capita capital stock generally indicates greater capital accumulation within an economy, which can enhance production efficiency and economic growth [3]. Additionally, it may influence the effectiveness of technology adoption.
2.4.4. Control Variables
Choosing control variables can be challenging due to the lack of consistent data available for both countries. Ultimately, we selected the following control variables based on three dimensions: industrial structure, living standards, and innovation capacity:
(1) Proportion of Secondary Industry: This reflects the share of industrial activities within the economy. Controlling this variable helps assess the impact of industrialization on carbon emissions. (2) Proportion of Tertiary Industry: This represents the share of the service sector within the economy, helping to understand the role of services in influencing carbon emissions. (3) Average Income (Logged): The natural logarithm of average income indicates living standards and controls for the effects of income levels on carbon emissions. (4) Labor Force Participation Rate: This measures the level of activity in the labor market and potentially impacts economic activity and carbon emissions. (5) Unemployment Rate: This reflects economic health and resource utilization efficiency, which can also influence carbon emissions. (6) Total Patents Granted in the Year: This measures innovation capacity and controls the effect of technological advancements on carbon emissions.
These control variables are chosen to address key factors affecting carbon emissions and to provide a more precise assessment of the specific impact of bioenergy technology on carbon intensity.
2.4.5. Variable Description and Descriptive Statistics
Table 1 provides a detailed description of the variables and their data sources. Table 2 presents the descriptive statistical results. Specifically, measures such as mean, median, standard deviation, minimum, and maximum values suggest that the data is well-behaved and conforms to anticipated norms.
Table 1. Variables explanation.
Variable Type |
Variable Name |
Symbol |
Explanation |
US Data Source |
CN Data Source |
|---|---|---|---|---|---|
Explained Variable |
Carbon Intensity |
CAINT |
Carbon emissions relative to the regional Gross Domestic Product (GDP) for the given year |
U.S. Energy Information Administration, U.S. Census Data |
Fan et al. [27] |
Explanatory Variable |
Bioenergy Technology |
BIOTE |
The number of patents granted in the current year with the theme of “bioenergy” |
WIPO |
CNKI Dataset |
Threshold Variables |
Average Years of Education |
Education |
Estimated based on the Proportion of Individuals with the Following Education Levels: Illiterate (0 years), Primary School (6 years), Junior Secondary School (9 years), Senior Secondary School (12 years), Bachelor’s Degree (16 years), and Postgraduate Degree (19 years or more). |
U.S. Census Data |
China Statistical Year Book (2011–2022) |
Gini Coefficient |
Gini |
To measure income inequality |
|||
Per Capita Capital Stock |
Capital |
Capital |
|||
Control Variables |
Proportion of Secondary Industry |
Second |
Value Added by the Secondary Industry/Total Regional Output |
||
Proportion of Tertiary Industry |
Third |
lue Added by the Tertiary Industry/Total Regional Output |
|||
Unemployment Rate |
Unemployment |
Unemployed Population/(Employed Population + Unemployed Population) |
|||
Labor Force Participation Rate |
Participation |
(Employed Population + Unemployed Population)/Total Population |
|||
Logarithm of Average Income |
Ln_Income |
Logarithm of Disposable Income |
|||
Logarithm of the Number of Granted Patents |
Ln_Patent |
Logarithm of the Number of Granted Patents |
CNKI Dataset |
Table 2. Descriptive statistics.
Vars |
Country |
Mean |
sd |
Min |
Max |
Skew |
Kurtosis |
|---|---|---|---|---|---|---|---|
CAINT |
US |
3.792 |
2.103 |
0.604 |
11.027 |
1.162 |
1.086 |
BIOTE |
0.110 |
0.335 |
0.000 |
2.197 |
3.328 |
11.421 |
|
Second |
0.167 |
0.038 |
0.039 |
0.254 |
−0.505 |
0.938 |
|
Third |
0.807 |
0.042 |
0.728 |
0.960 |
0.956 |
1.505 |
|
Unemployment |
6.347 |
1.939 |
2.450 |
11.800 |
0.316 |
−0.455 |
|
Participation |
0.469 |
0.033 |
0.399 |
0.547 |
0.031 |
−0.949 |
|
Ln_Income |
10.310 |
0.184 |
9.902 |
11.063 |
0.592 |
0.389 |
|
Ln_Patent |
6.865 |
1.475 |
3.296 |
10.740 |
−0.044 |
−0.580 |
|
Capital |
2.077 |
0.223 |
1.320 |
3.029 |
0.697 |
2.103 |
|
Education |
12.648 |
0.217 |
12.157 |
13.620 |
0.711 |
1.841 |
|
Gini |
0.461 |
0.021 |
0.410 |
0.535 |
0.480 |
0.930 |
|
CAINT |
China |
2.544 |
2.823 |
0.345 |
21.719 |
3.256 |
13.631 |
BIOTE |
3.071 |
1.317 |
0.000 |
5.802 |
−0.444 |
−0.214 |
|
Second |
0.410 |
0.082 |
0.160 |
0.620 |
−0.786 |
0.873 |
|
Third |
0.490 |
0.091 |
0.323 |
0.838 |
1.457 |
3.496 |
|
Unemployment |
3.278 |
0.658 |
1.200 |
4.600 |
−0.654 |
0.411 |
|
Participation |
0.545 |
0.051 |
0.401 |
0.760 |
1.050 |
2.934 |
|
Ln_Income |
9.931 |
0.526 |
8.716 |
11.281 |
0.087 |
−0.160 |
|
Ln_Patent |
7.995 |
1.696 |
2.079 |
11.653 |
−0.475 |
0.173 |
|
Capital |
3.335 |
1.759 |
0.594 |
10.078 |
1.088 |
0.967 |
|
Education |
9.044 |
1.164 |
4.222 |
12.782 |
−0.353 |
3.601 |
|
Gini |
0.429 |
0.047 |
0.344 |
0.522 |
−0.025 |
−1.247 |
3. Threshold Regression Result
3.1. Model Selection
Before conducting the threshold model regression, we must determine the threshold number. Table 3 presents the test results for different numbers of thresholds. Our method is to choose the model with the lowest p-value (highest significance) [28]. We find that a two-threshold model should be selected. In fact, the two-threshold model generally has higher explanatory power because it can effectively capture the changing trends between different regions or states in the data. At the same time, compared to a three-threshold model, the two-threshold model does not overly segment the data, thus avoiding the instability of results due to excessive model complexity when data is limited or sample sizes are small. This balance makes the two-threshold model flexible in explaining non-linear relationships between variables and robust and accurate in its results.
Table 3. Threshold effect test.
Country |
Variable |
Model |
F |
p |
1% Critical Value |
5% Critical Value |
10% Critical Value |
|---|---|---|---|---|---|---|---|
U.S. |
Capital |
Single |
12.925 |
0.160 |
34.529 |
24.033 |
18.550 |
Double |
3.545 |
0.097 |
8.409 |
5.027 |
3.737 |
||
Triple |
0.000 |
0.137 |
0.000 |
0.000 |
0.000 |
||
Education |
Single |
13.872 |
0.010 |
12.730 |
7.344 |
5.621 |
|
Double |
10.199 |
0.000 |
1.663 |
−2.054 |
−3.640 |
||
Triple |
−0.000 |
0.743 |
0.000 |
0.000 |
0.000 |
||
Gini |
Single |
14.101 |
0.100 |
18.946 |
16.112 |
14.040 |
|
Double |
15.239 |
0.000 |
10.676 |
4.929 |
0.956 |
||
Triple |
0.000 |
0.400 |
0.000 |
0.000 |
0.000 |
||
China |
Capital |
Single |
12.616 |
0.043 |
18.688 |
11.678 |
8.455 |
Double |
13.244 |
0.007 |
12.290 |
7.965 |
5.884 |
||
Triple |
−0.000 |
0.917 |
0.000 |
0.000 |
0.000 |
||
Education |
Single |
10.084 |
0.060 |
16.607 |
11.125 |
7.760 |
|
Double |
14.728 |
0.017 |
16.570 |
10.543 |
7.738 |
||
Triple |
0.000 |
0.380 |
0.000 |
0.000 |
0.000 |
||
Gini |
Single |
1.674 |
0.203 |
7.774 |
3.444 |
2.611 |
|
Double |
6.585 |
0.000 |
3.977 |
2.684 |
1.088 |
||
Triple |
1.740 |
0.307 |
7.601 |
5.145 |
3.941 |
3.2. Results
The results are shown in Table 4. Firstly, for the United States, as the per capita capital stock increases, the impact of bioenergy technology on carbon intensity initially shows a positive trend but eventually becomes negative. This indicates that bioenergy technology may increase carbon intensity in the early stages of capital accumulation due to the increased resources. However, as capital accumulates further, the application of technology becomes more efficient, and bioenergy technology ultimately exerts a suppressive effect on carbon intensity. This suggests that capital accumulation not only provides the necessary foundation for the application of bioenergy technology but also enhances its effectiveness in improving carbon intensity.
Secondly, with an increase in the years of education, the impact of bioenergy technology on carbon intensity shifts from being non-significant to becoming significantly negative. This means that higher education levels can better enhance the effectiveness of bioenergy technology in reducing carbon intensity. Notably, when the average years of education exceed the second threshold, this suppressive effect weakens, which may be related to the waste of resources or inefficient use of human capital due to excessive education.
Thirdly, an increase in the Gini coefficient initially results in a higher impact of bioenergy technology on carbon intensity, but eventually becomes non-significant. This suggests that moderate income inequality may stimulate societal innovation, thereby more effectively utilizing bioenergy technology to reduce carbon intensity. However, as income inequality further intensifies, its incentivizing effect on technology application may be diminished, reducing the significance of the suppressive effect [29].
For China, as per capita capital stock gradually increases, the impact of bioenergy technology on carbon intensity shows a decreasing trend and eventually becomes insignificant. This phenomenon may reflect China’s continued reliance on labor-intensive industries during economic development, which may benefit from the introduction of bioenergy technology in the initial stages. However, as capital accumulates and the economic structure transforms, the marginal effect of this technology gradually diminishes. Additionally, this may indicate that China’s capital investment efficiency has not yet reached an optimal state, leading to insufficient conversion of capital accumulation into effective suppression of carbon intensity by technology.
Meanwhile, with the increase in education levels, the suppressive effect of bioenergy technology on carbon intensity significantly strengthens in China. This phenomenon suggests that the average years of education in China are relatively low, indicating substantial room for improvement in education levels [30]. By further enhancing the education levels of the population, the potential of bioenergy technology in reducing carbon intensity can be better realized, achieving more effective environmental improvement and sustainable development goals.
Finally, we observe that changes in the Gini coefficient have not significantly affected the suppressive effect of bioenergy technology on carbon intensity in China. This may reflect the ongoing adjustment and optimization of China’s economic structure, where the complexity behind income inequality may result in less pronounced effects on technology application compared to other countries [31]. Due to significant regional disparities in income distribution and economic structure in China, changes in the Gini coefficient have not produced a noticeable threshold effect on the carbon reduction effects of bioenergy technology. This further illustrates the need for China to comprehensively consider economic, social, and technological factors in balancing economic growth with environmental protection.
Although our empirical model identifies threshold effects of bioenergy-related patents on carbon intensity, it is important to acknowledge the underlying mechanism through which this relationship may operate. In principle, patents capture innovation efforts, but their impact on carbon outcomes materializes only when such innovations are translated into actual deployment of bioenergy technologies, such as increased biomass fuel consumption. Introducing biomass fuel usage as an intermediary or control variable would be desirable to validate this channel. We extensively collected consistent data on biomass fuel consumption for both China and the United States at the subnational level; however, no unified or comparable dataset covering our full study period could be identified. Given this limitation, we instead provide a conceptual discussion of the mechanism: bioenergy patents may reduce carbon intensity by facilitating technological improvements in biomass conversion efficiency, lowering production costs, and enabling broader substitution of fossil fuels with bio-based energy. While our current analysis cannot empirically disentangle this pathway, future research linking patent activity with deployment indicators such as biomass fuel use would provide a stronger test of the mechanism.
Table 4. Threshold regression result2.
U.S. |
China |
|||||
|---|---|---|---|---|---|---|
|
(1) Capital |
(2) Education |
(3) Gini |
(4) Capital |
(5) Education |
(6) Gini |
|
Y < Th1 |
0.290 * (1.85) |
0.100 (0.77) |
−0.281 ** (−2.38) |
−0.743 *** (−3.92) |
0.110 (0.89) |
−0.638 *** (−3.81) |
Th1 ≤ Y < Th2 |
−0.028 (−0.29) |
−1.097 *** (−3.82) |
−1.631 *** (−3.44) |
−0.325 ** (−2.29) |
−0.061 (−0.52) |
−0.832 *** (−4.64) |
Th2 ≤ Y |
−1.139 ** (−2.48) |
−0.469 * (−1.80) |
0.100 (0.76) |
−0.187 (−1.24) |
−0.359 ** (−2.33) |
−0.704 *** (−4.24) |
Second |
−40.88 *** (−20.95) |
−33.21 *** (−14.50) |
−24.63 *** (−10.64) |
−14.24 *** (−6.87) |
−0.365 (−0.13) |
−7.485 ** (−2.25) |
Third |
−44.28 *** (−20.71) |
−40.97 *** (−14.01) |
−21.06 *** (−7.55) |
8.327 *** (3.46) |
15.97 *** (5.33) |
11.05 *** (3.00) |
Unemployment |
−0.038 * (−1.66) |
0.102 *** (3.24) |
0.094 *** (3.74) |
0.162 (1.10) |
−0.103 (−0.92) |
−0.634 *** (−3.64) |
Participation |
−13.98 *** (−8.16) |
−14.02 *** (−6.46) |
−15.75 *** (−8.59) |
−12.22 *** (−6.25) |
−7.322 *** (−4.37) |
−8.193 *** (−3.64) |
Ln_Income |
−0.550 (−1.37) |
1.255 ** (2.48) |
0.616 (1.42) |
−3.058 *** (−7.82) |
−3.966 *** (−9.72) |
−2.415 *** (−4.98) |
Ln_Patent |
−0.485 *** (−14.43) |
−0.571 *** (−15.01) |
−0.526 *** (−10.00) |
−0.723 *** (−4.69) |
−0.240 (−1.46) |
−0.558 *** (−3.07) |
TWFE |
Y |
Y |
Y |
Y |
Y |
Y |
Constant |
62.15 *** (18.08) |
39.19 *** (9.18) |
28.97 *** (7.67) |
47.53 *** (12.77) |
40.38 *** (10.94) |
37.31 *** (7.75) |
R |
0.764 |
0.715 |
0.637 |
0.536 |
0.511 |
0.592 |
Observations |
612 |
612 |
612 |
372 |
372 |
372 |
Th1 |
1.986 |
12.651 |
0.456 |
1.351 |
8.124 |
0.411 |
Th2 |
2.431 |
12.85 |
0.459 |
3.880 |
9 |
0.422 |
One, two, and three stars (*, **, ***) denote significance at the 10%, 5%, and 1% levels, respectively. t-statistics are reported in parentheses.
4. Predication with Random Forest and Regional Heterogeneity
In this chapter, we used a random forest model to predict carbon intensity based on bioenergy technology and demonstrated the varying predictions resulting from different threshold variables. We also illustrated the regional heterogeneity of these threshold effects. The results are shown in Figure 3, where the first two rows present the results and confidence intervals for the U.S. sample, and the last two rows present those for the China sample. It can be observed that, despite minor differences due to the model variations (with the threshold effect model being linear and the random forest model incorporating non-linear factors), the results from both models are generally consistent.
For the United States, the threshold effect of capital accumulation is mainly concentrated in the Western and Southeastern regions. This may be related to the more stable industrial structures in the Northeastern and Central regions, especially in the Central region, which is known as the “Rust Belt” with a relatively fixed industrial structure and less variation. In contrast, the Southeastern region, with its favorable climate conditions, has attracted a large population influx, driving dynamic adjustments in its industrial structure [32]. This provides a richer environment for capital accumulation, making the threshold effect more pronounced in this region. The Western region, being the core area for technology and innovation in the U.S., experiences more profound impacts from capital accumulation, which are also more prominent in the threshold effects. Regarding education, it can be observed that the threshold effects of education levels are relatively consistent across regions in the U.S. This indicates the widespread and universal impact of education on bioenergy technology, which is able to regulate carbon intensity nationwide. However, it is worth noting that education inequality is more pronounced in the Western region, which may affect the maximum utility of bioenergy technology in that area.
The threshold effects exhibit different characteristics in various regions for the Gini coefficient. In the Western and Midwestern regions, the impact of the Gini coefficient on carbon intensity initially decreases and then becomes non-significant, suggesting that moderate inequality may support economic development in these regions. However, as inequality further intensifies, its effect on economic vitality diminishes. In the Southeastern region, the Gini coefficient’s impact on the effect of bioenergy technology on carbon intensity increases initially. Then it decreases, possibly due to the region’s mild climate and weaker competitive spirit. Only when inequality intensifies does the incentive effect become more significant, promoting economic vitality and effective application of bioenergy technology.
For China, the threshold effect of capital accumulation exhibits relatively consistent characteristics across regions. This indicates that, despite differences in economic development levels, China’s regions generally possess a comparative advantage in labor-intensive industries. This advantage makes the impact of capital accumulation on bioenergy technology relatively uniform nationwide. This phenomenon may reflect that China has not yet fully transitioned from labor-intensive industries during its economic transformation, and capital accumulation remains a major driver of economic growth across regions [16].
In terms of education, there are significant regional differences in educational levels in China, with the Western regions having lower average years of education compared to the higher levels in the Eastern coastal regions. However, with the increase in education levels, the suppressive effect of bioenergy technology on carbon intensity shows a similar enhancement trend across all regions. This may suggest that despite disparities in education levels between regions, improvements in education can effectively promote the application of bioenergy technology and carbon reduction nationwide [33]. This also implies that there is substantial room for further improvement in educational attainment across different regions, and broadening educational access could enhance the environmental benefits of bioenergy technology.

Regarding the Gini coefficient, despite regional differences in income distribution and social inequality in China, the suppressive effect of bioenergy technology on carbon intensity remains relatively stable throughout changes in the Gini coefficient. This aligns with the regression results of the threshold effects, indicating that variations in income inequality have not significantly impacted the carbon reduction effects of bioenergy technology. This may reflect that China’s economic structure and social development models are still in the process of adjustment and adaptation, and changes in the Gini coefficient have not yet resulted in significant regional differences in technological effects.
5. Conclusions
As a critical issue facing human society, how to effectively control greenhouse gas emissions while promoting economic development is not only crucial for current social stability but also directly impacts the sustainability of future development. Global climate change has become an urgent challenge, and countries are seeking new paths to balance economic growth and environmental protection. In this context, bioenergy technology development has become an important area of exploration. As a renewable energy source, bioenergy can reduce dependence on fossil fuels and has significant emission reduction potential, thus attracting considerable attention.
Based on panel data from primary administrative regions in China and the United States, this study conducts an in-depth analysis of the threshold effects of bioenergy technology on carbon intensity from a macro perspective. By applying panel threshold models and random forest models, we reveal the complexity and diversity of the impact of bioenergy technology on carbon intensity under different economic and social conditions in various regions. Our research not only focuses on the direct effects of bioenergy technology but also examines how factors such as capital accumulation, education level, and income inequality modulate the impact of bioenergy technology on carbon intensity through threshold effects. Based on the analysis of these models, we can draw the following conclusions:
In the United States, the study finds that as per capita capital stock increases, the impact of bioenergy technology on carbon intensity first becomes positive and then turns negative. This indicates that initial capital accumulation may lead to an increase in carbon intensity. Still, as capital accumulates to a certain extent, the emission reduction effects of bioenergy technology begin to emerge. Additionally, as the years of education increase, the impact of bioenergy technology on carbon intensity transitions from non-significant to a significant negative effect, demonstrating that higher education levels play an important role in enhancing the environmental benefits of bioenergy technology. The increase in the Gini coefficient shows a pattern of first increasing and then becoming non-significant regarding the impact of bioenergy technology’s effect on carbon intensity. This may reflect that initial income inequality stimulates economic vitality, but as inequality worsens, its positive impact diminishes.
However, the impact of bioenergy technology on carbon intensity gradually weakens and eventually becomes non-significant as per capita capital stock increases for China. This might be because China’s capital accumulation has not yet reached the critical point for effectively utilizing bioenergy technology. Similarly, as the education level increases, the suppressive effect of bioenergy technology on carbon intensity significantly enhances, indicating that education plays a key role in improving the effectiveness of technology application and reducing carbon emissions. In contrast, changes in the Gini coefficient do not significantly affect the suppressive effect of bioenergy technology on carbon intensity, possibly because the threshold effect of income inequality on technology application has not yet become evident in China.
Moreover, we found significant regional differences in threshold effects in the United States, while the effects are relatively uniform for the Chinese sample. These differences may be related to variations in regional economic structures, policy environments, and social development models between the two countries. Although existing research has not directly studied the macro-level impact of bioenergy technology on carbon intensity, the results of this study align with several existing studies. First, green innovation is a core driver of energy conservation and emission reduction, effectively reducing environmental pollution through technological advancement and industrial upgrading [34,35]. Second, social factors such as education level and income inequality significantly affect the environmental effects of green innovation and determine its widespread application and promotion [14,36]. Third, there are significant differences in green development paths between developing and developed countries. The former faces challenges such as inadequate infrastructure and funds as well as changes in economic structure, while the latter focuses more on technological innovation and policy guidance [37]. These differences must be thoroughly considered in global cooperation to achieve sustainable development goals.
In light of these findings, to better promote the application of bioenergy technology and achieve carbon reduction, the United States should develop differentiated policies based on regional economic and social conditions, particularly increasing investment in capital accumulation and education to facilitate the effective application of bioenergy technology. Meanwhile, China should continue to enhance education levels and optimize capital investment efficiency to fully realize the potential of bioenergy technology in emission reduction. The government should focus on and address regional inequalities to ensure that the promotion and application of bioenergy technology can minimize carbon intensity to the greatest extent.
As shown before this study contributes in three ways. First, it provides comparative evidence from the United States and China, showing that bioenergy technology’s impact on carbon intensity varies with development and policy context. Second, it demonstrates that capital, education, and inequality condition mitigation effectiveness—while threshold analysis enriches theory on the bioenergy–carbon nexus and guides targeted policy. Amid geopolitical volatility and tightening barriers to cross-border technology diffusion [38], bioenergy technology is likewise constrained; our results indicate that adjusting the threshold levers—capital accumulation, education, and inequality—can mitigate the adverse carbon-intensity consequences of slower bioenergy technology progress.
Indeed, this study is subject to certain limitations. In particular, the analysis relies on patent-based indicators as proxies for bioenergy technology, which primarily capture innovation potential rather than actual adoption or usage intensity. As a result, the causal interpretation regarding the transmission channel from technological development to carbon intensity reduction remains constrained. Future research could address this gap by incorporating empirical data on bioenergy deployment and utilization, such as production, consumption, or investment indicators, to validate and enrich the mechanisms identified in this paper. Further, it should be noted that carbon intensity is a macroeconomic indicator that reflects the overall economy, which is broader than the bioenergy technology sector and may not fully align with its dynamics. Accordingly, while this study identifies threshold effects of bioenergy technology on carbon intensity, it cannot isolate the primary drivers of carbon intensity changes. Such a limitation highlights the need for future research to integrate sector-level implementation data with macro-level indicators to capture better the mechanisms through which bioenergy technology contributes to carbon mitigation.
Appendix A
Diagnostic Tests
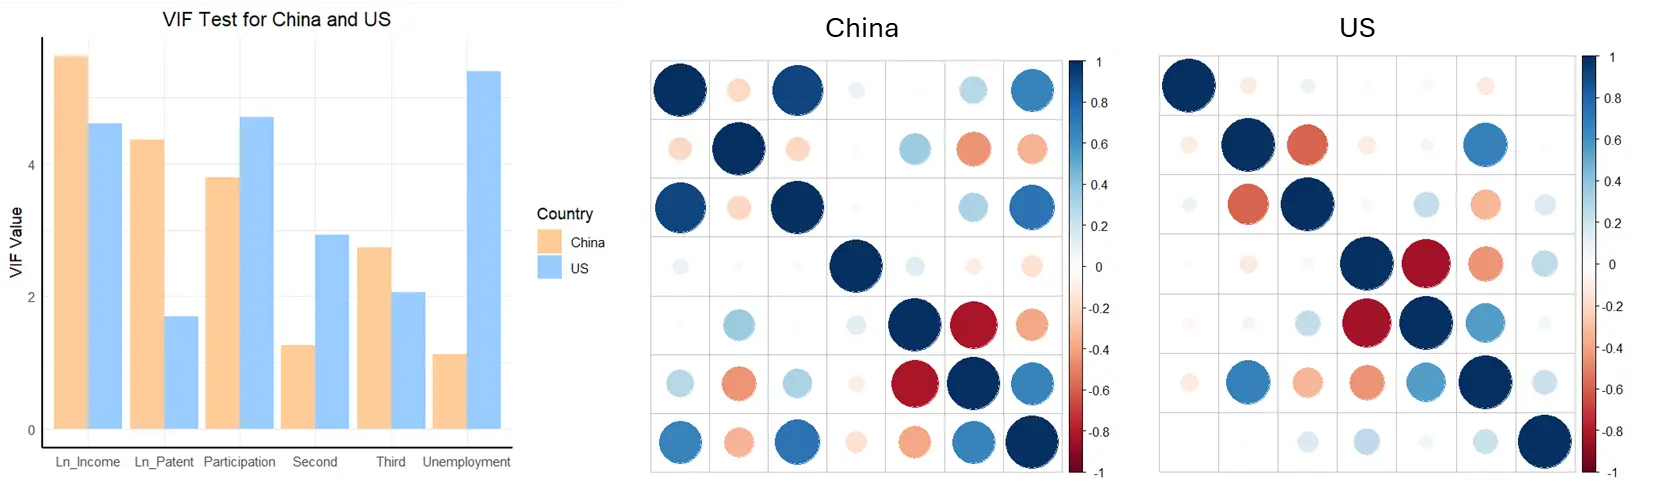
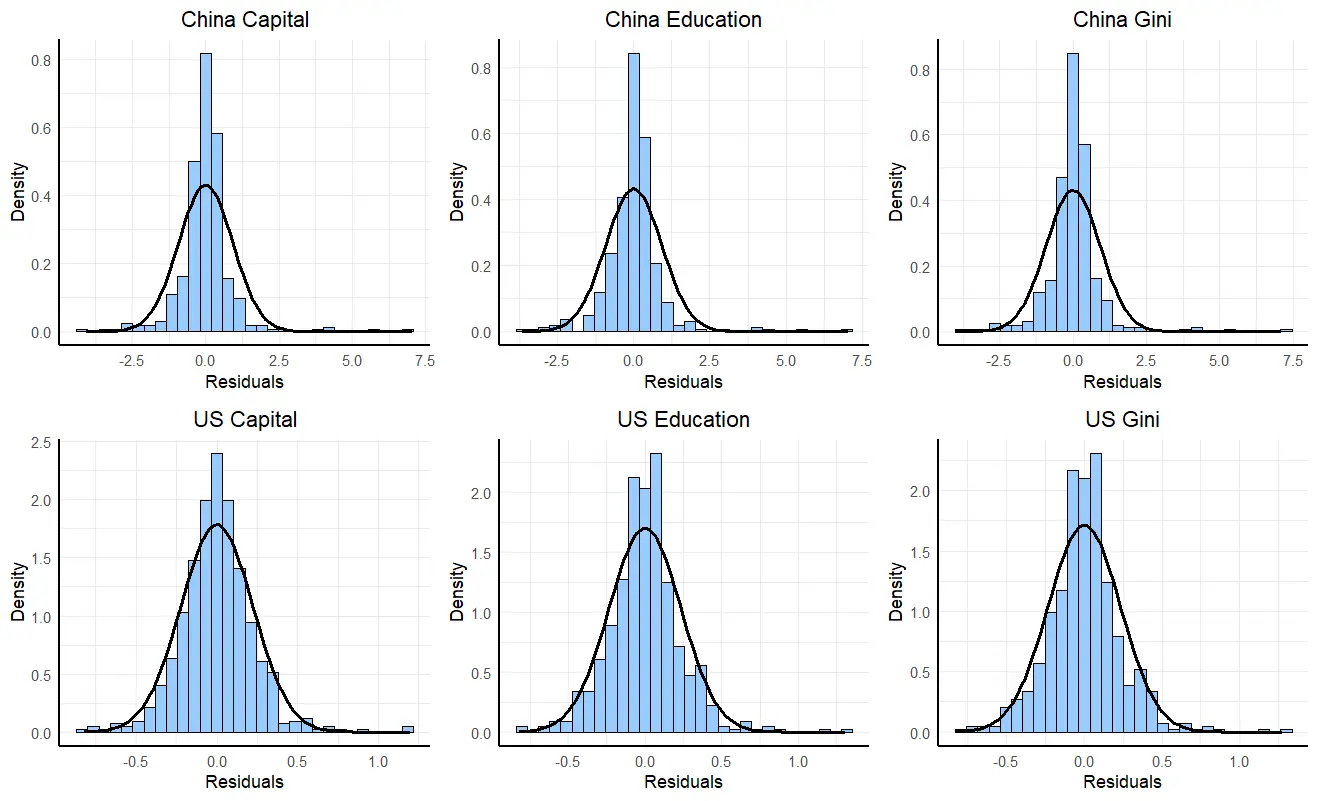
We conducted several diagnostic tests to ensure the robustness and validity of our models. First, we performed multicollinearity checks for the covariates to identify potential issues of high inter-correlation among explanatory variables, which could distort the estimation of coefficients. The results of the multicollinearity tests are presented in Figure A1, the larger the circle, the stronger the correlation. Next, we carried out heteroskedasticity tests based on the Breusch-Pagan (B-P) method to check for non-constant variance in the residuals across different levels of the independent variables. The p-values for all B-P tests were greater than 0.1, suggesting that heteroskedasticity is not a concern in our models. Additionally, we conducted normality tests on the residuals of the models reported in Table 4 to confirm that the residuals are normally distributed, which is a key assumption for many statistical inference techniques. Figure A2 shows the distribution of residuals. These diagnostics are essential to ensure that our model estimations are unbiased, efficient, and consistent, thereby enhancing the reliability of our empirical findings.
Although both the China and U.S. datasets passed the diagnostic tests, we observed that the variables in the China dataset are more prone to multicollinearity issues compared to those in the U.S. dataset. Moreover, the residuals from the models using the China dataset showed a greater deviation from normality, as indicated by the distribution plots in Figure A2. The reason is China’s economy is characterized by more pronounced fluctuations and rapid changes compared to the U.S., which has largely reached a state of economic stability. The volatility in China’s economic environment, driven by ongoing reforms, rapid industrialization, and policy shifts, can lead to more correlated economic indicators as well as a lower standard error.
Statement of the Use of Generative Al and Al-Assisted Technologies in the Writing Process
During the preparation of this manuscript, the authors used ChatGPT (OpenAI, San Francisco, CA) solely to improve the readability and language clarity of the text. After using this tool, the authors carefully reviewed and edited the content as needed and take full responsibility for the integrity and accuracy of the published article.
Acknowledgments
In memory of Roger Raufer, Energy, Resources, and Environment at the Johns Hopkins University–Nanjing Center.
Author Contributions
Methodology, S.D.; Software, S.D.; Formal Analysis, S.D.; Resources, H.Y.; Data Curation, X.L.; Writing—Original Draft Preparation, X.L. and S.D.; Writing—Review & Editing, Y.C. and C.L.
Ethics Statement
Not applicable.
Informed Consent Statement
Not applicable.
Data Availability Statement
The data that support the findings of this study are available from the corresponding author upon reasonable request.
Funding
This research received no external funding.
Declaration of Competing Interest
The authors declare that they have no known competing financial interests or personal relationships that could have appeared to influence the work reported in this paper.
Footnotes
https://ourworldindata.org/co2-emissions (accessed on 27 October 2024)
Appendix A shows the diagnostic tests corresponding to this regression.
References
- Dai S, Dai Y, Hu J, Yu H. Energy-saving technological change, regional economy growth and endowment structure: Empirical evidence from Chinese cities. Technol. Anal. Strateg. Manag. 2024, 1–14. doi:10.1080/09537325.2024.2383603. [Google Scholar]
- Lane J, Greig C, Garnett A. Uncertain storage prospects create a conundrum for carbon capture and storage ambitions. Nat. Clim. Change 2021, 11, 925–936. [Google Scholar]
- Dai S, Yu H, Aiya F, Yang B. Green bonds and sustainable development: Theoretical model and empirical evidence from Europe. Int. J. Sustain. Dev. World Ecol. 2024, 31, 668–683. [Google Scholar]
- Wang Z, Peng X, Xia A, Shah AA, Huang Y, Zhu X, et al. The role of machine learning to boost the bioenergy and biofuels conversion. Bioresour. Technol. 2022, 343, 126099. [Google Scholar]
- Elhacham E, Ben-Uri L, Grozovski J, Bar-On YM, Milo R. Global human-made mass exceeds all living biomass. Nature 2020, 588, 442–444. [Google Scholar]
- Yang Q, Zhou H, Bartocci P, Fantozzi F, Mašek O, Agblevor FA, et al. Prospective contributions of biomass pyrolysis to China’s 2050 carbon reduction and renewable energy goals. Nat. Commun. 2021, 12, 1698. [Google Scholar]
- Duarah P, Haldar D, Patel AK, Dong CD, Singhania RR, Purkait MK. A review on global perspectives of sustainable development in bioenergy generation. Bioresour. Technol. 2022, 348, 126791. [Google Scholar]
- Booth MS. Not carbon neutral: Assessing the net emissions impact of residues burned for bioenergy. Environ. Res. Lett. 2018, 13, 035001. [Google Scholar]
- Hanssen SV, Daioglou V, Steinmann ZJN, Doelman JC, Van Vuuren DP, Huijbregts MAJ. The climate change mitigation potential of bioenergy with carbon capture and storage. Nat. Clim. Chang. 2020, 10, 1023–1029. [Google Scholar]
- Hu B, Zhang Y, Li Y, Teng Y, Yue W. Can bioenergy carbon capture and storage aggravate global water crisis? Sci. Total Environ. 2020, 714, 136856. [Google Scholar]
- Masum MFH, Dwivedi P, Anderson WF. Estimating unit production cost, carbon intensity, and carbon abatement cost of electricity generation from bioenergy feedstocks in Georgia, United States. Renew. Sustain. Energy Rev. 2020, 117, 109514. [Google Scholar]
- Rather RA, Wani AW, Mumtaz S, Padder SA, Khan AH, Almohana AI, et al. Bioenergy: A foundation to environmental sustainability in a changing global climate scenario. J. King Saud Univ. Sci. 2022, 34, 101734. [Google Scholar]
- Venton D. Can bioenergy with carbon capture and storage make an impact? Proc. Natl. Acad. Sci. USA 2016, 113, 13260–13262. [Google Scholar]
- Luo Y, Wang Q, Long X, Yan Z, Salman M, Wu C. Green innovation and SO2 emissions: Dynamic threshold effect of human capital. Bus. Strategy Environ. 2023, 32, 499–515. [Google Scholar]
- Wang Q, Li L, Li R. Uncovering the impact of income inequality and population aging on carbon emission efficiency: An empirical analysis of 139 countries. Sci. Total Environ. 2023, 857, 159508. [Google Scholar]
- Comin D, Lashkari D, Mestieri M. Structural change with long-run income and price effects. Econometrica 2021, 89, 311–374. [Google Scholar]
- Dai, S. Understanding Automation’s Impact on Ecological Footprint: Theory and Empirical Evidence from Europe. Environ. Resour. Econ. 2025, 88, 503–532. [Google Scholar]
- Fan F, Yang B, Cao Y, Dai S. The spatial effects of innovation agglomeration on air quality in China: From the perspective of industrial development. Int. J. Sustain. Dev. World Ecol. 2025, 32, 31–48. [Google Scholar]
- Hansen BE. Threshold effects in non-dynamic panels: Estimation, testing, and inference. J. Econom. 1999, 93, 345–368. [Google Scholar]
- Aslam MS, Huang B, Cui L. Review of construction and demolition waste management in China and USA. J. Environ. Manag. 2020, 264, 110445. [Google Scholar]
- Barak D, Kocoglu M, Jahanger A, Tan M. Testing the EKC hypothesis for ecological and carbon intensity of well-being: The role of forest extent. Sci. Total Environ. 2024, 945, 173794. [Google Scholar]
- Abdel-Basset M, Gamal A, Chakrabortty RK, Ryan M. Development of a hybrid multi-criteria decision-making approach for sustainability evaluation of bioenergy production technologies: A case study. J. Clean. Prod. 2021, 290, 125805. [Google Scholar]
- Yao L, Li J, Li J. Urban innovation and intercity patent collaboration: A network analysis of China’s national innovation system. Technol. Forecast. Soc. Chang. 2020, 160, 120185. [Google Scholar]
- Gazni A. The growing number of patent citations to scientific papers: Changes in the world, nations, and fields. Technol. Soc. 2020, 62, 101276. [Google Scholar]
- Johnson J. Artificial Intelligence and the Future of Warfare: The USA, China, and Strategic Stability; Manchester University Press: Manchester, UK, 2021. [Google Scholar]
- Ahmed Z, Nathaniel SP, Shahbaz M. The criticality of information and communication technology and human capital in environmental sustainability: Evidence from Latin American and Caribbean countries. J. Clean. Prod. 2021, 286, 125529. [Google Scholar]
- Fan F, Dai S, Yang B, Ke H. Urban density, directed technological change, and carbon intensity: An empirical study based on Chinese cities. Technol. Soc. 2023, 72, 102151. [Google Scholar]
- Ran Q, Zhang J, Hao Y. Does environmental decentralization exacerbate China’s carbon emissions? Evidence based on dynamic threshold effect analysis. Sci. Total Environ. 2020, 721, 137656. [Google Scholar]
- Cappelen AW, Falch R, Tungodden B. Fair and unfair income inequality. Handbook of Labor, Human Resources and Population Economics, 2020; pp. 1–25. [Google Scholar]
- Chen Y, Fan Z, Gu X, Zhou LA. Arrival of young talent: The send-down movement and rural education in China. Am. Econ. Rev. 2020, 110, 3393–3430. [Google Scholar]
- Zhang Z. Handbook of Chinese Economics; Springer Nature: Singapore, 2023. [Google Scholar]
- Alder SD, Lagakos D, Ohanian L. Labor Market Conflict and the Decline of the Rust Belt. J. Political Econ. 2023, 131, 2780–2824. [Google Scholar]
- Wu L, Yan K, Zhang Y. Higher education expansion and inequality in educational opportunities in China. High. Educ. 2020, 80, 549–570. [Google Scholar]
- Ngo HH, Bui XT, Nghiem LD, Guo W. Green technologies for sustainable water. Bioresour. Technol. 2020. doi:10.1061/9780784414422.fm. [Google Scholar]
- Ke H, Dai S, Yu H. Effect of green innovation efficiency on ecological footprint in 283 Chinese Cities from 2008 to 2018. Environ. Dev. Sustain. 2022, 24, 2841–2860. [Google Scholar]
- Ke H, Dai S, Fan F. Does innovation efficiency inhibit the ecological footprint? An empirical study of China’s provincial regions. Technol. Anal. Strateg. Manag. 2022, 34, 1369–1383. [Google Scholar]
- Ghosh S, Balsalobre-Lorente D, Doğan B, Paiano A, Talbi B. Modelling an empirical framework of the implications of tourism and economic complexity on environmental sustainability in G7 economies. J. Clean. Prod. 2022, 376, 134281. [Google Scholar]
- Dai S, Ji J, Yu H. Technology Import and Biased Technological Progress in Transforming Economies: Evidence from China. Rev. Dev. Econ. 2025, 1–21. doi:10.1111/rode.70051. [Google Scholar]