1. Introduction
The proportion of global clean energy has been steadily increasing, such as hydropower [
1]. However, the construction of hydropower stations has disrupted the natural connectivity of rivers, leading to increasingly severe ecological issues [
2]. Among these, the obstruction of fish migration is one of the most prominent problems. Migration barriers directly impact the reproduction, foraging, and overwintering needs of migratory fish, disrupting their life cycles and potentially causing the extinction of certain species. Various fish passage facilities have been developed and applied to facilitate the upstream migration of migratory fish. These facilities mainly include fish locks, fish lifts, fish transport vessels, and fishways [
3]. Fish locks and fish lifts offer advantages in terms of compact design but face challenges such as difficulty in attracting fish and high operational costs [
4]. In contrast, fishways are widely used due to their relatively low operational costs, extensive design expertise, and the ability to allow fish to pass actively, effectively restoring the natural upstream migration scenarios for fish [
5]. Traditional fishways mainly include vertical slit fishway [
6], submerged orifice type of fishway [
7], rock-weir fishways[
8], combined fishway [
9] and Daniels-type fishway [
10]. Fish passages are defined as “ecological corridors” that facilitate the movement of migratory fish across water-obstructing structures [
11]. The fundamental principle underlying their design is the utilization of specialized structural configurations that are engineered to dissipate the kinetic energy of the water flow, thereby reducing its velocity. This, in turn, mitigates the challenges faced by fish during upstream swimming, thus enabling them to migrate with minimal energy expenditure [
12].
With the in-depth study of fishways, scholars have been constantly proposing new fishway structures. Among them, the island type fishway has attracted the attention of scholars in recent years. The structure of the island type fishway is designed based on the valve structure of Tesla. The structure of the Tesla valve has the characteristic of allowing the forward fluid to pass smoothly while showing a strong obstructive effect on the reverse fluid [
13]. In 2016, researchers from Delft University of Technology proposed the application of large-scale Tesla valves as fishways and conducted a series of experiments to verify it [
14]. They established an open experimental model using the original Tesla valve structure. During the experiment, they found that when reverse water flow passed through this structure, a “pool-stream-pool” structure would appear. Such a structure will likely allow migratory fish to swim upstream in continuous small steps. This result indicates that under certain conditions, the Tesla valve can exhibit a flow pattern that is relatively friendly to fish migration. However, due to the limitations of the experimental conditions, this study lacks crucial data to assess the potential of further applying Tesla valves to fishways. Subsequently, Hoek [
15] summarized the work of the former and pointed out that when conducting research on the river restoration problem, introducing the Tesla valve structure would be conducive to establishing FMR (fish migration river). In subsequent research, we [
16] compared the structures of two different types of closed Tesla valves by means of numerical simulation and selected the T45-R type Tesla valve structure for further study under specific working conditions. In this work, the internal flow field structure, turbulent kinetic energy, and other flow parameters of the model were studied using Tesla valves as fish-passing pipelines, and the swimming ability indicators of different fish-passing objects were compared. The potential of applying the Tesla valve structure to fish-passing channels was verified from a new perspective. We initially set up an island-type fishway test bench and combined numerical simulation methods to study the flow characteristics within the fishway [
17]. In further research, we began to focus on the influence of the specific structure of the island-type fishway on flow. Recently, we have studied arc structures [
18]. This structure is the main component for energy dissipation of water flow, and its primary function is to impede water flow.
However, merely studying the arc structure is not enough. The combination with the island structure is the key to highlighting the water flow characteristics within the island-type fishway. The design of the island structure divides the upstream flow into two streams and mixes the two streams, thereby resulting in an island type fishway with an energy dissipation structure. In addition to separating the main stream, the island structure also guides water flow into the arc structure. The installation position of the island structure will directly affect the flow of the upstream incoming flow after it enters the arc structure. Therefore, researching the influence of island structure on the internal flow of fishways has significant research value. The present study concentrates on the repercussions of the island configuration on the internal flow characteristics and fish passage, with the objective of contributing to the development of novel fish passages and the enhancement of the aquatic ecology of the river.
2. Materials and Methods
2.1. Island-Type Fishway
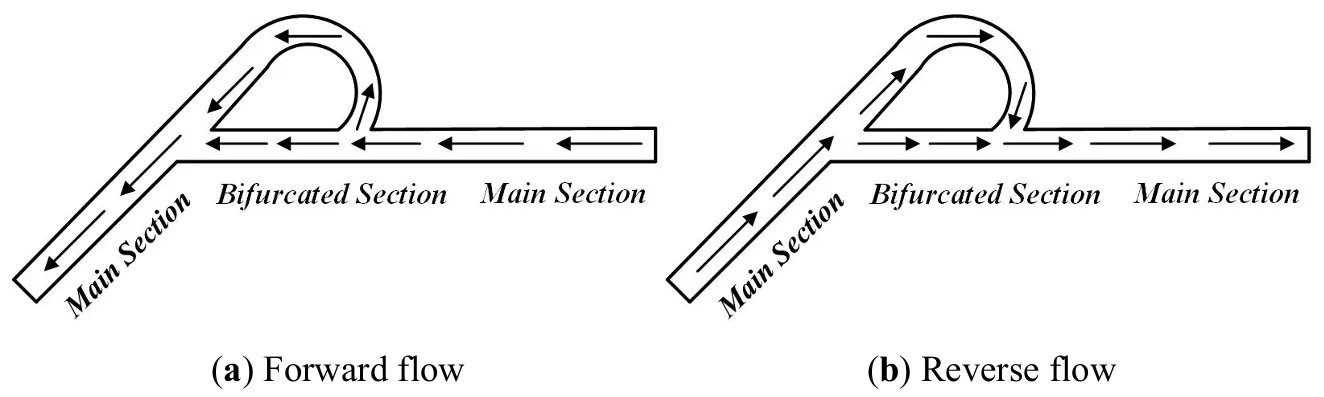
In 1920, Nikolai Tesla proposed a special check valve—the Tesla valve. The structure of the Tesla valve has the characteristic of allowing the fluid in the forward direction to pass smoothly while showing a strong obstructive effect on the fluid in the reverse direction, as shown in . The essence of Tesla valves in increasing reverse flow resistance is to use an asymmetric geometric structure to force the reverse fluid into a complex and highly curved path. This process triggers a strong inertial effect (vortex, turbulence), thereby causing huge energy dissipation and pressure loss. When multiple Tesla valve structures are connected in series, they can create significant resistance to reverse water flow, thereby significantly reducing the water flow velocity.
. The flow structure in a Tesla valve [
16].
Inspired by Tesla’s valve structure, we set up an island structure in the fishway to divide the upstream incoming flow into two streams. An arc structure was set downstream of the island structure, enabling the two separated fluid streams to flow in opposite directions and achieving energy dissipation after mixing. We call the fishway, which has this structure, an island-type fishway. shows the island and arc structures alternately arranged on the opposite side of the fishway. The radial distance between the arc structures is referred to as the pseudo-vertical gap, with a width b of 20 mm. Due to the limitations of the overall model scale, the basic island shape is determined as a rectangle of 2b × b (40 mm × 20 mm). The experimental platform consists of five pool chambers, each equipped with an arc structure of thickness 0.5b (10 mm) and diameter 2b (40 mm). The spacing between arc structures on the same side is 20b (400 mm), while the spacing between arc structures on opposite sides is 10b (200 mm).
. Schematic diagram of an island-type fishway.
The island-type fishway experimental device designed in this paper can be extended to practical applications based on the principle of gravitational similarity. In fishway research, achieving gravitational similarity ensures that flow conditions such as velocity and turbulence are realistic and do not hinder fish migration [
19]. By adhering to the principles of gravitational similarity, engineers can create models that accurately reflect the behavior of full-scale fishways, helping to optimize the design and ensure the safe and effective passage of fish.
2.2. Experimental Platform and Testing Methods
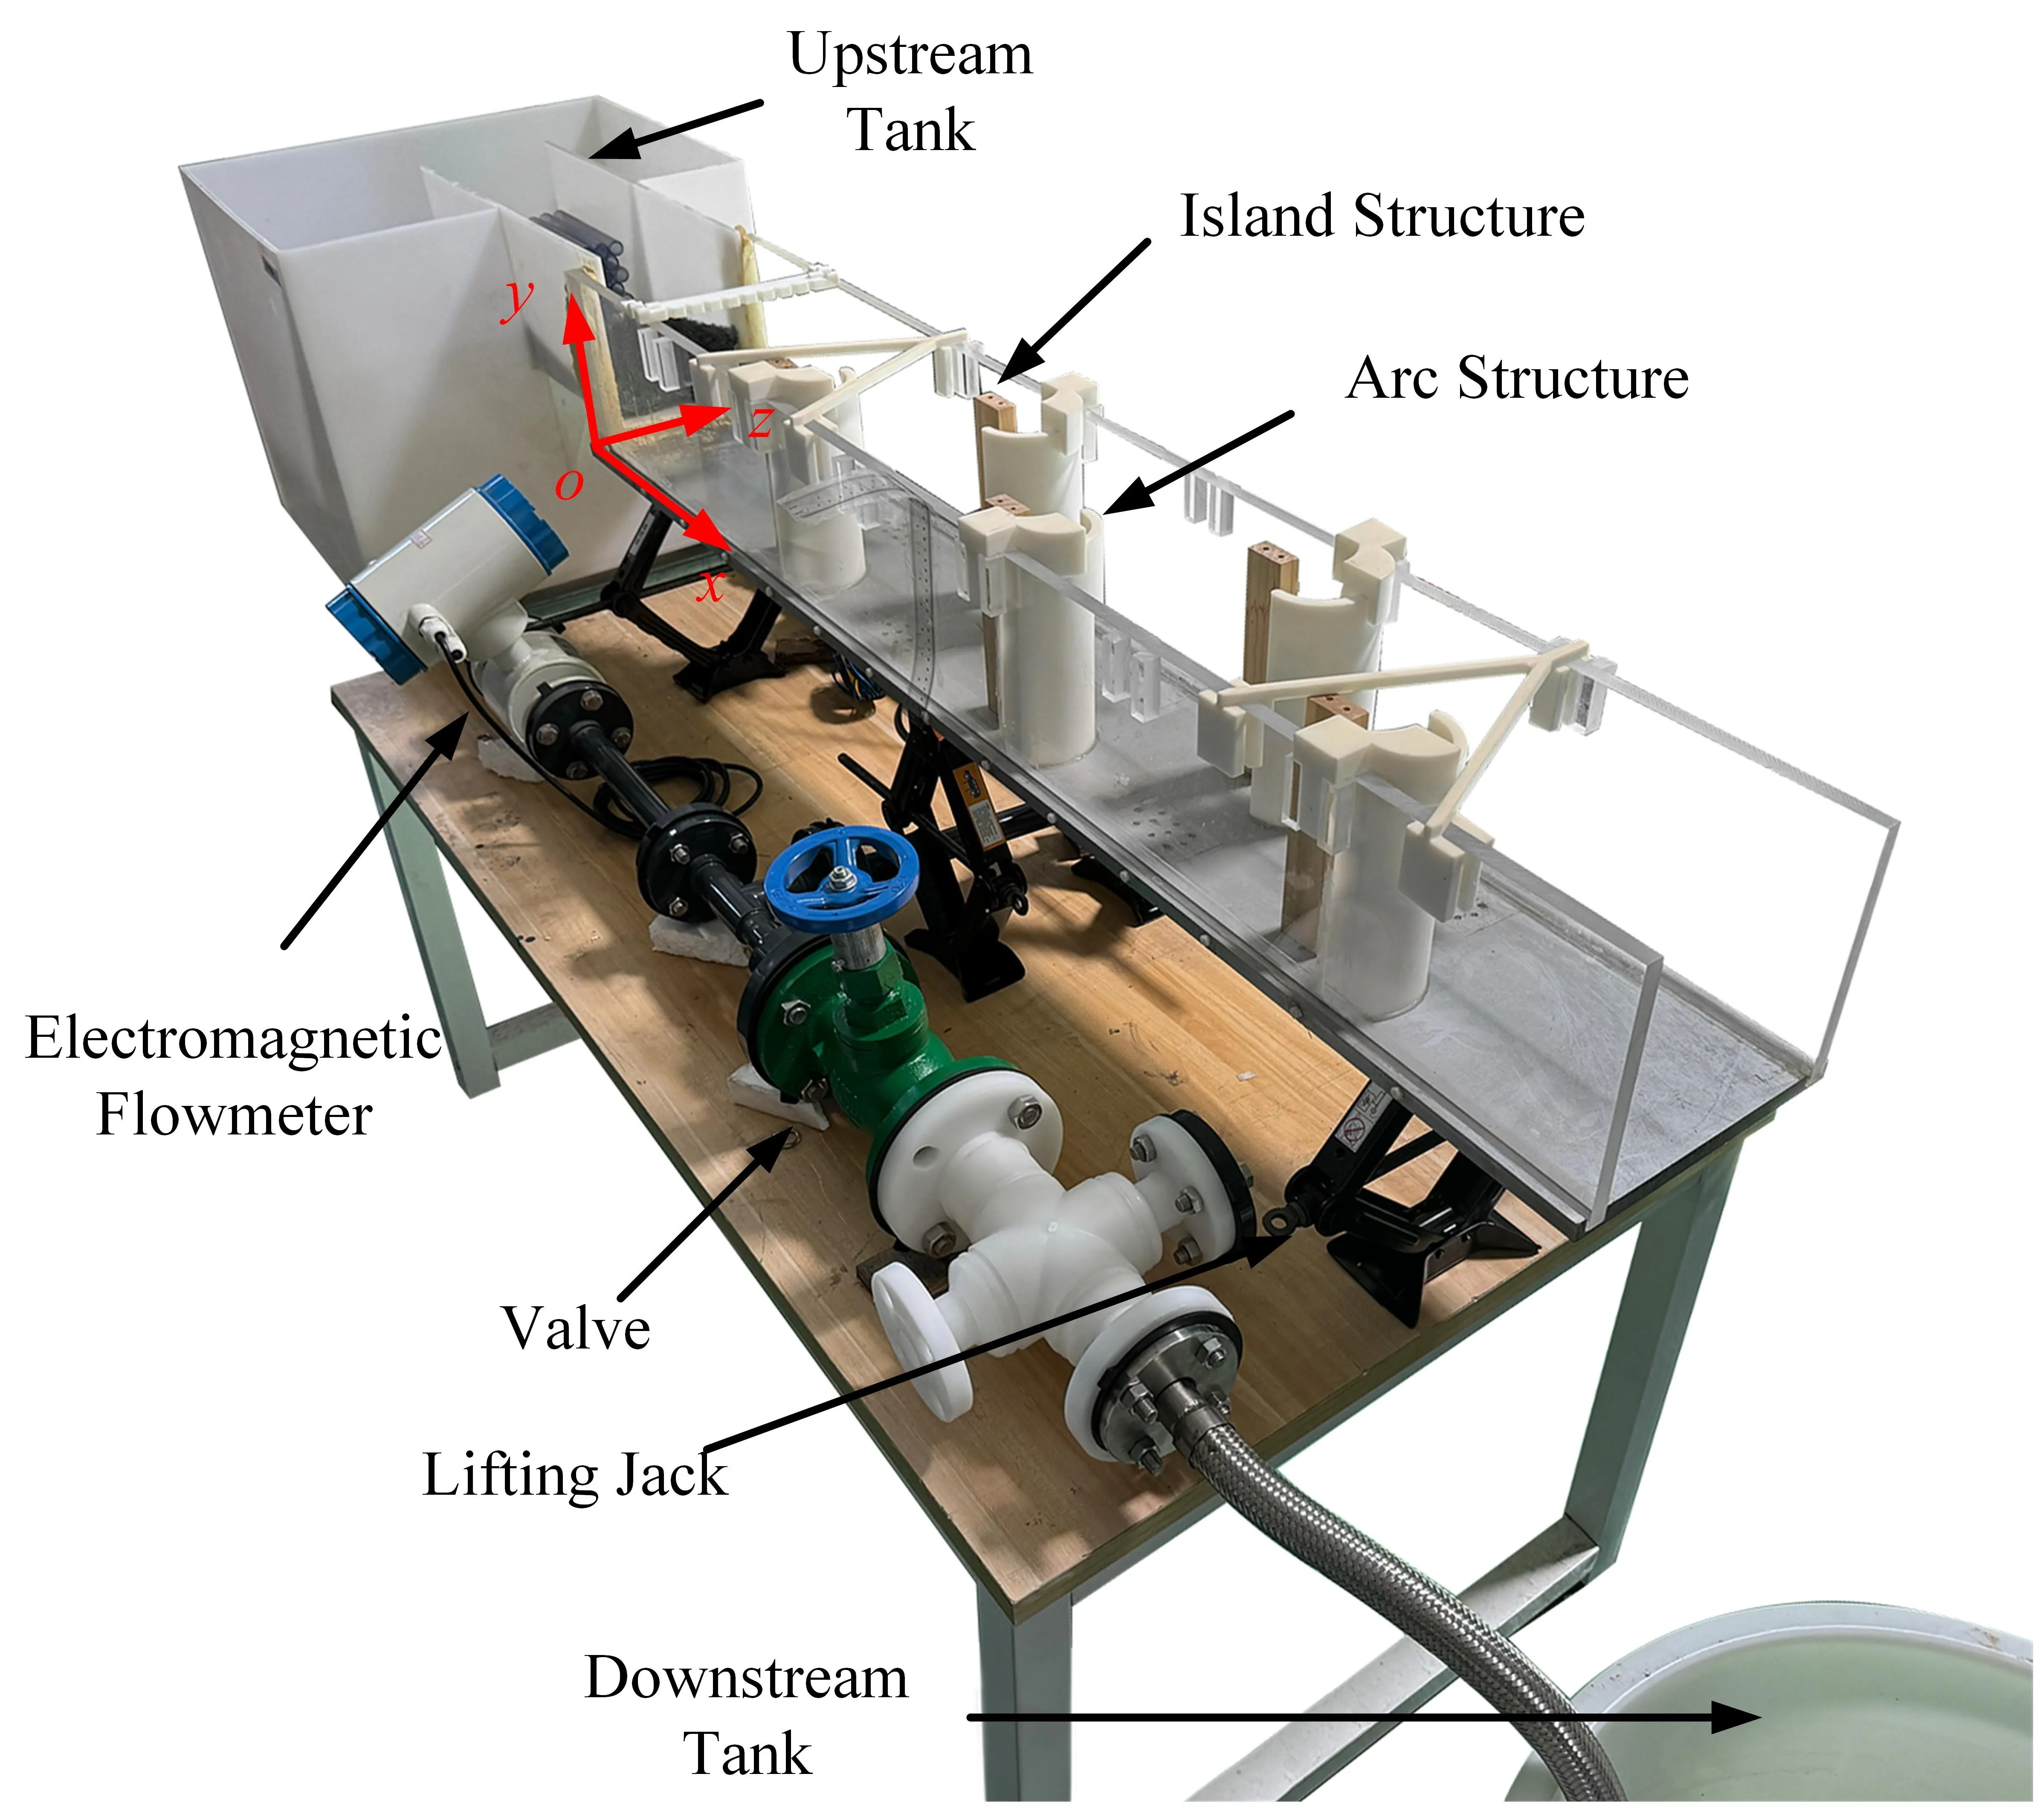
An island-type fishway experimental platform was designed, as shown in . The slope of the fishway apparatus can be adjusted by changing the height of the lifting jacks at different positions. The model's bottom is made of 15-mm-thick stainless steel, with water level measurement points located every 100 mm along the side of the base. The sidewalls are constructed from 15-mm-thick high-transparency acrylic glass, allowing for observation of the flow within the island-type fishway. The arc structure is made from nylon material, while the island structure is constructed from wood. The entire system is powered by a submersible pump, which transports water from the downstream tank to the upstream tank, and the water flows back to the downstream tank through the island-type fishway under gravity. Flow is controlled via a valve at the pump outlet, and the flow rate is measured using an electromagnetic flowmeter (with an accuracy of 0.5%).
. Experimental platform for the island-type fishway [
18].
A dedicated measurement board was installed above the pool chambers, which, in conjunction with an open-channel velocimeter (OUKA, LS300-A, measurement error ≤ 1.5%), allows for measuring flow velocities at different water layer positions. The sampling time for flow velocity is 10 s. To measure the changes in water levels on both sides of the island-type fishway, rulers with a minimum scale of 1 mm are attached to both outer walls. In this experiment, flow velocities were measured at two water layer heights above the bottom of the island-type fishway, specifically at $$h _{1} $$ = 12 mm and $$h _{2} $$ = 22 mm. The origin coordinate of the test model is the left apex Angle of the base plate. The
x-axis is parallel to the bottom and the horizontal slot line, the
y-axis is perpendicular to the bottom, and the
z-axis points outside the left plate.
The dimensions of the island-type fishway experimental platform are as follows: the fishway in the test pool is 1350 mm long, 200 mm wide, and 200 mm deep. The experimental slope was set at 2.27% by adjusting the height of the lifting jacks. The flow rate was controlled at 3.32 m
3/h (Re = 4370) by adjusting the valve opening. After the flow stabilized, water level fluctuations were recorded using a high-speed camera (Revealer X113M, HF Agile Device Company, Hefei, China) at a frame rate of 1000 frames per second. The flow velocities at various measurement points within each pool chamber were recorded with the measurement board and velocimeter. Flow velocities were measured at two water layer heights in each pool chamber for each operating condition.
2.3. Numerical Modeling Methods and Computational Approaches
To achieve a more precise understanding of the flow details, this study not only conducts experimental research on the flow within an island-type fishway but also employs computational fluid dynamics (CFD) methods to solve for the water flow [
20]. The software of ANSYS Fluent was used. The semi-implicit method for pressure-linked equations (SIMPLE) algorithm is utilized to solve the pressure–velocity coupling problem. The numerical simulation adopts the RNG k-ε turbulence model and the VOF method to capture the free surface of the water flow inside the fishway. The inlet water level height (38.6 mm) is configured according to the actual experimental settings, and the velocity is set using the flow rate used in the actual experiment (3.32 m
3/h). The top surface of the flow channel is an open boundary, acting as a pressure boundary that allows both inflow and outflow. The outlet of the flow channel is treated as the standard atmospheric pressure. Standard wall functions are used for the wall model to handle the near-wall behavior accurately. The iteration step size is set to 2000, with a maximum number of iterations capped at 20. Convergence is considered achieved when the error falls below a threshold of 10
−4.
To ensure grid independence, this study investigates four different mesh cell size schemes (as shown in
). It calculates the error
e between the numerical simulation and the experimental average water level at the wall, using the following method:
In the formula, $$h_{e}$$ represents the experimentally measured average water level at the wall, and $$h_{s}$$ stands for the numerically computed average water level at the wall.
To ensure a balance between computational efficiency and simulation accuracy, a grid independence study was conducted using four different meshing schemes (M1–M4). The grid in the central area of the island-type fishway (the main area) is encrypted. As the mesh was refined, the number of cells increased significantly from M1 to M4, while the relative computational error
e decreased from 7.01% to 5.95% and then stabilized. The M3 scheme exhibited a minimal error of 5.95%, with negligible improvement from further refinement. Therefore, the M3 mesh was selected as the optimal configuration, effectively balancing accuracy and computational cost. The calculated result of the average velocity in the actual experiment is 0.178 m/s, and the corresponding simulated value is 0.167 m/s, with an error of approximately 6.18%, which is within the allowable error range.
.
Grid division scheme.
| Case |
Cell Number |
e/(%) |
| M1 |
59,460 |
7.00 |
| M2 |
112,900 |
6.08 |
| M3 |
257,268 |
5.95 |
| M4 |
461,720 |
5.98 |
To further verify the feasibility of the numerical simulation, 12 sampling points were selected at the wall surface in the experiment, the water levels at the corresponding positions were measured, and they were compared with the results obtained by numerical calculation. The resolution of the photos taken in the experiment is 1080P. If the 1mm image captured in the experiment occupies approximately 5 pixels, then the minimum resolution of the water level can be calculated to be 0.2 mm.
shows the experimental results of the wall water level with the numerical simulation results.
. Comparison of experimental and numerical simulation results of the wall water level.
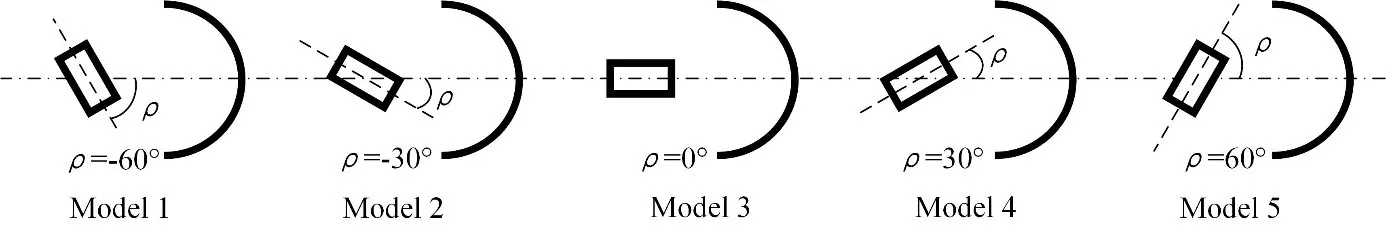
Based on the verification of the feasibility of numerical simulation, we adopted the same strategy to simulate the intra-island flow characteristics of five island-type fishways with different island angles. The island angle was varied by rotating it around the geometric center to values of −60°, −30°, 0°, 30°, and 60°, which are respectively named as Models 1 to 5, as shown in
.
. Island type fishways with different island angles.
3. Results
3.1. Flow Velocity Field Distribution
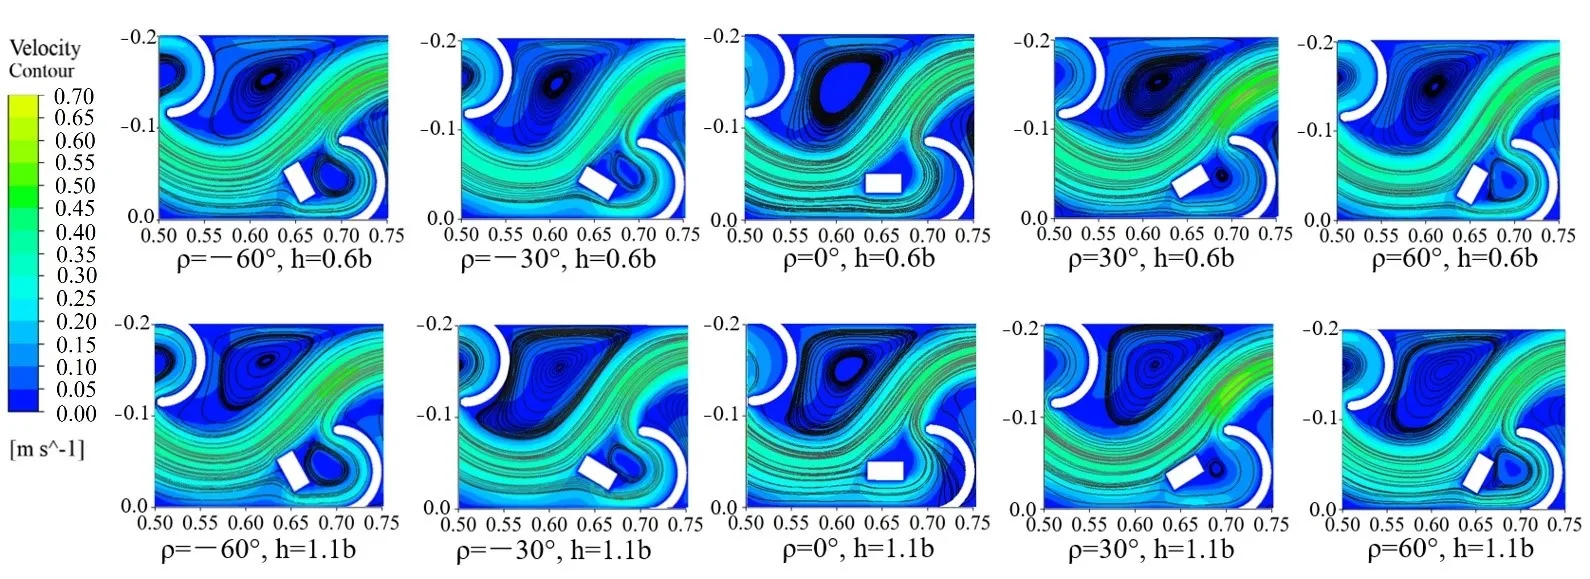
Upon examining the flow field in the pool chamber, it is evident that a recirculation zone forms behind the rectangular island, as shown in
. The size of this recirculation zone changes with adjustments to the island angle, and the overall variation follows a symmetric trend. At island angles of −60 ° and 60°, the recirculation intensity is higher, and the low-velocity area behind the island reaches its maximum. Simultaneously, the recirculating flow, divided by the rectangular island, approaches the wall of the arc side of the chamber. This suggests that the large island angles at these settings lead to a narrower passage for the main flow entering the recirculation zone, creating a squeezing effect that accelerates the water flow entering the recirculation loop.
Previous studies have indicated that migratory fish species, such as grass carp, exhibit an upstream swimming physiological response when stimulated by water flow velocities exceeding 0.2 m/s. As can be seen from the figure, the flow velocity within the island-type fishway meets the conditions required to stimulate fish migration. Notably, under the combined influence of the island and arc structures, the high-velocity flows in the fishway exhibit a continuous S-shaped distribution, providing a pathway for fish to ascend and migrate upstream. Furthermore, low-velocity flow zones exist adjacent to the main high-speed flow channels, fulfilling the need of fish for resting areas with lower flow velocities during sustained upstream migration.
. Numerical velocity field contour plots for chambers with different arc island angle variations.
presents the specific results of the maximum flow velocity Um at different water layers from the flow field contour plots described above. As the island angle changes, the maximum flow velocity
Um and average flow velocity
Ua at different water layers exhibit similar magnitudes, with their variations following a symmetrical trend, as indicated by the flow field contours. This paper defines the relative variation rate
R to better compare the differences brought about by different models.
where,
Valuemodel1 is the calculation result of Model 1 and
Valuemodelx is the calculation result of Model
x (
x = 2, 3, 4, 5).
Regarding the maximum flow velocity within the pool chamber, the island angle begins to change at −60°, with a sharp increase in maximum flow velocity observed when the angle is set to −30°. At 0° and 30° island angles, the maximum flow velocity decreases relative to the initial model. Subsequently, at an island angle of 60°, the flow velocity increases again. This effect arises because larger island angles increase the contact area between the island and the main flow, enhancing the island’s ability to divide the flow, which is more pronounced at higher angles. The trend in the maximum flow velocity is similar across different water layers.
For average flow velocity, the overall trend follows that of the maximum flow velocity, though there is a significant difference when the island angle is set to 30°. At this angle, the island has a notable inhibitory effect on maximum flow velocity, while the average flow velocity returns to a state similar to that observed at −60°. Compared to the 0° setting, it can even be seen that the island’s influence increases the average flow velocity. Overall, the results suggest that the maximum flow velocity and average flow velocity are the smallest for an island angle of 0°.
. The Maximum and Average Flow Velocity and Its Relative Variation Rate of the Pool Chamber in Different Water Layers Under Island Angle Variations.
illustrates the variation in the proportion of high and low flow velocity areas within the pool chamber under different island angle settings. Considering the influence of water flow velocity on the swimming behavior of fish, this paper divides the high and low flow velocity areas with 0.2 m/s as the boundary. That is, the area of the low-flow velocity area, the area where the water flow velocity is less than 0.2 m/s; The area of the high-velocity zone refers to the area where the water flow velocity is greater than 0.2 m/s. The figure shows that the proportions of high and low flow areas are similar across different island angle configurations, with the low flow area consistently occupying more than 60% of the total pool chamber area. Specifically, when the island angle is set to −30° and 0°, the configuration results in a relatively large low flow area within the pool chamber.
. The Area Proportion of High- and Low-Velocity Regions in the Pool Chamber Under Different Models with Island Angle Variations.
shows the variation in Turbulent kinetic energy (TKE) as the island angle changes. It is first observed that the high turbulent kinetic energy distribution in the h2 water layer occupies a larger area of the pool chamber, consistent with previous analysis indicating more intense turbulence near the surface layer. For the h1 water layer, the concentrated low turbulent kinetic energy area corresponds to the main recirculation zone. The flow visualization shows that the size of the main recirculation area changes with the island angle arrangement. The recirculation area is largest when the island angle is set to 0°.
It is evident that the overall level of turbulent kinetic energy in the pool chamber is relatively low. Under all island angle configurations, the maximum turbulent kinetic energy (TKE
m) is only 5.78 × 10
−3 m
2/s
2, while the average turbulent kinetic energy (TKE
a) does not exceed 2 × 10
−3 m
2/s
2.
. Turbulent Kinetic Energy Distribution Maps of the Pool Chamber Under Different Models with Island Angle Variations.
displays the variation rates (R) of the maximum turbulent kinetic energy (TKE
m) and average turbulent kinetic energy (TKE
a) in both water layers of the pool chamber. From the perspective of the maximum turbulent kinetic energy in the pool chamber, the maximum TKE value near the surface layer (h2) is significantly higher than at the bottom layer (h1). However, the evolution of maximum turbulent kinetic energy shows a marked difference from the velocity-related analysis mentioned earlier. The trend of maximum TKE changes with island angle settings notably differs between the two water layers. For the h1 layer, the maximum turbulent kinetic energy decreases initially and then increases as the island angle changes. When the island angle $$\rho$$ is set to 0°, the maximum TKE in this layer reaches its lowest value. When the island angle is set to 30°, the maximum TKE increases to a higher value.
c,d shows the average turbulent kinetic energy (TKE
a) and its associated variation rate (RTKE
a). It can be observed that the variation trend of average turbulent kinetic energy is similar across different water layers, with the average TKE in the higher water layer significantly higher than in the lower water layer. Specifically, as the island angle increases from −60°, the average turbulent kinetic energy also increases, except when the island angle is set to 0°.
. The Maximum and Average Turbulent Kinetic Energy and Its Relative Variation Rate in Different Water Layers of the Pool Chamber Under Island Angle Variations.
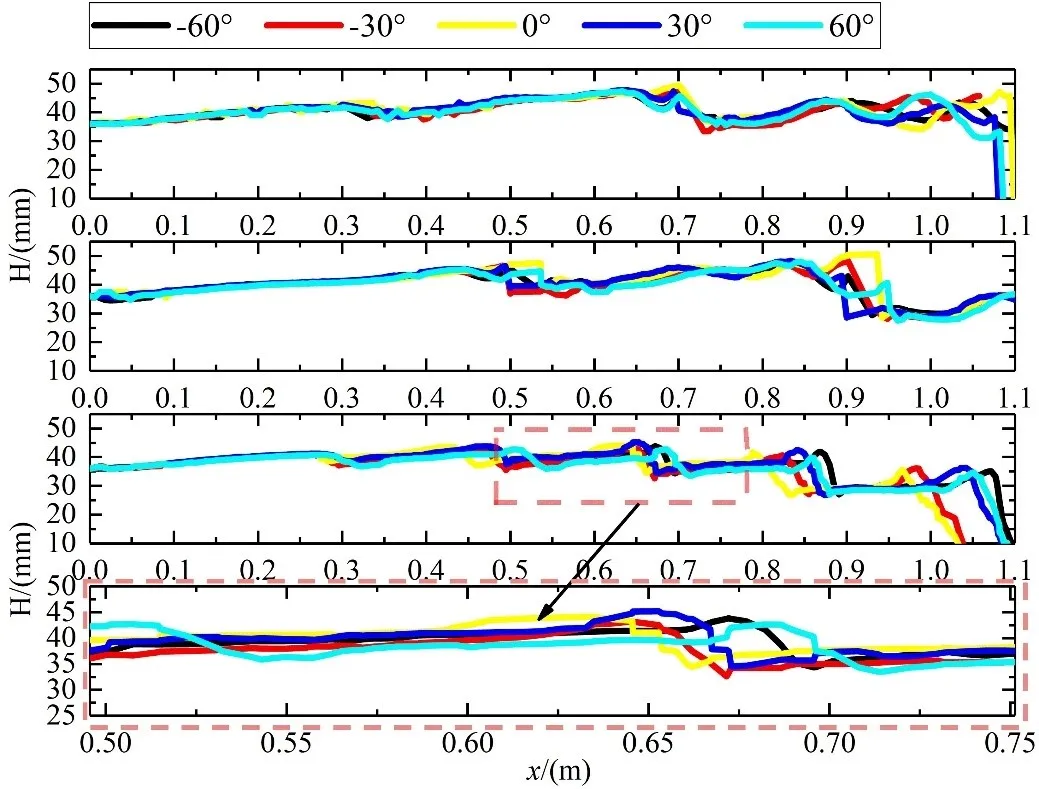
shows the variation in water levels along the island-type fishway under different island angle configurations. The figure presents the water level results along the left side, right side, and centerline of the fishway, with the fourth image providing a zoomed-in view of the centerline water level variation across the individual pool chambers. From the left and right water level profiles, it can be observed that the water level changes reflect the ideal design for the arc-shaped arrangement, with smoother and more gradual variations compared to the island distance experiments [
17]. Unlike the pronounced fluctuations seen in the island distance experiment, the water level changes in the island angle test are much smoother.
In the experiments and numerical calculations of this paper, the island-type fishways are all arranged at an incline, that is, the position of the bottom plate at the upstream is higher than that at the downstream. The water surfaces on the left and right sections are blocked by the arc structure and accumulate, showing a phenomenon of being flush with the upstream water surface. However, compared with the upstream, the downstream bottom plate is located further down, which leads to an increase in the liquid level difference between the water surface and the bottom plate, that is, the water level. This is the reason for the increase in water level on the left and right sections. Compared with the water levels on the left and right sides, the water level at the center line changes relatively gently. The water level downstream does not change significantly, but it shows fluctuations due to the water level difference on both sides.
. Water Level Variations Along the Left, Right, Central Paths and Local Magnification Under Island Angle Variations. <i>H</i> is the vertical distance from the liquid surface to the bottom plate. The five arcs are respectively located at <i>x</i> = 0.3 m, 0.5 m, 0.7 m, 0.9 m and 1.1 m.
a shows the average water levels along three paths (left, right, and centerline) in the pool chambers for different island angle settings. It is observed that the average water level along the left side is consistently the highest across all configurations, followed by the right side, and the centerline being the lowest. This result is consistent with the findings from the island distance experiments, where the water level along the side walls is higher, while the centerline has a relatively lower water level [
17].
In
b, the corresponding change rate results indicate that, starting from the initial island angle of 60°, the average water level along the different paths in the pool chamber follows a similar pattern: it first decreases, then increases, and then decreases again as the island angle changes. Despite the similar general trend of average water level changes across different sides, a significant difference is observed between the left and right sides when the island angle is set to −30°. At this point, a slight elevation of the water level is observed on the left side, while conversely, a sharp drop in water levels is seen on the right side and along the centerline. The direct cause of this phenomenon is the relatively higher number of arc structures arranged along the left side.
. Water Level Variation Data of the Pool Chamber Under Island Angle Variations.
4. Discussion
The swimming ability of fish is the basis for whether they can swim upstream through fishways. Generally, it refers to the ability of fish to overcome water flow resistance [
21]. The swimming speeds of fish can roughly be divided into three types [
22]. The first type is the optimal swimming speed, also known as the sustained swimming speed. At this speed, fish consume the least energy and can swim for a long time, with the sustained swimming time generally exceeding 200 minutes. The second is the critical speed, which is the maximum speed at which a fish can swim continuously over a period of time. The last type is explosive swimming speed, which lasts for a relatively short time, usually less than 20 seconds, and is used for instant sprints, escapes or catching prey. Therefore, the water flow velocity within the fishway significantly impacts whether fish can successfully swim upstream. From the velocity contour results, it can be observed that the introduced rectangular island structure is capable of dividing the main flow in the pool chamber at all tested angles, forming two distinct high-speed water streams. This characteristic was similar at both water layer heights. Flow velocity is the main hydraulic parameter affecting fish migration and is also an important basis for determining the design of fishways. In contrast, when the island angle is set to 0°, the low-velocity area behind the island is smaller, and the main flow entering the recirculation zone no longer flows along the wall. However, this also results in forming a low-velocity area on the inner side of the arc. Compared to the larger recirculation zone formed at higher island angles, the smaller island angle brings the benefit of a more diverse flow pattern within the pool chamber. These effects are theoretically favorable for fish migration, as they enhance the environment for fish passage. From the perspective of maximum flow velocity, the flow velocities in the pool chamber under different island angle variations meet the conditions necessary to stimulate fish migration. Additionally, the main flow and recirculation zones within the pool chamber are distinct, making it easier for fish to identify and navigate during their upstream migration. At a 0° angle, the island presents its most streamlined profile to the flow. Flow separation is minimized, resulting in a weaker recirculation zone, less energy dissipation, and consequently, the lowest maximum and average velocities. The anomaly at 30°, where average velocity increases while maximum velocity decreases, suggests a complex re-organization of the flow field. It is plausible that at this angle, the island efficiently guides and consolidates the flow without causing extreme acceleration or separation, leading to a more uniform velocity distribution and thus a higher average. Based on the flow velocity analysis discussed earlier, although larger island angles lead to an increased low flow area behind the island, this ultimately reduces the overall proportion of the low flow area in the pool chamber. In summary, the 0° island angle results in a richer flow pattern within the pool chamber compared to other configurations. The 0° angle also increases the low flow area within the pool chamber, making this arrangement the optimal choice for the design.
Turbulent kinetic energy (TKE) reflects the fluctuation range of water flow and is one of the key parameters affecting the upward movement of fish. Fish need to consume more energy to resist high turbulent kinetic energy. Meanwhile, the high turbulent kinetic energy of the water flow also means that the time for fish to pass smoothly may be prolonged, affecting fish passage efficiency. Based on the analysis above, these turbulent kinetic energy conditions within the pool chamber are favorable for the upstream migration of fish. When the island angle
ρ is set to 0°, the maximum TKE in this layer reaches its lowest value. When the island angle is set to 30°, the maximum TKE increases to a higher value. This is consistent with the fact that the main contact surface between the island and the incoming flow is almost aligned with the flow direction. In this scenario, the island’s obstructive effect on the flow is significantly reduced, indicating that this island angle is not an optimal configuration. In the h2 layer, the trend of maximum turbulent kinetic energy is more straightforward. As the island angle changes from −60° to 60°, the maximum TKE (RTKEm) variation rate gradually increases. However, even though the variation rate is increasing, the maximum TKE in this layer is still smaller than that for the initial −60° island angle setting, suggesting that the −60° configuration is not optimal. At the angle of 0°, the introduced rectangular island exhibits a suppression effect on average TKE, causing it to decrease to a lower value. The finding that the maximum TKE (TKEm) is remarkably low (<0.006 m²/s²) across all configurations is a pivotal strength of this design. This indicates that the primary energy dissipation occurs through the formation of coherent, large-scale recirculation structures rather than through intense, small-scale turbulence. This is a favorable hydraulic condition for many fish species, as extreme turbulence can be disorienting or energetically costly. The divergent trends in TKEm between the h1 and h2 layers underscore the three-dimensional complexity of the flow. The reduction in TKEm at the bottom layer (h1) at 0° angle aligns with the most streamlined flow and weakest recirculation. The subsequent increase at higher angles is driven by increased shear between the accelerating main flow and the growing recirculation zone. In contrast, the surface layer (h2) is more directly influenced by the impingement of the incoming jet and its interaction with the free surface, leading to a different response to angle changes. The fact that the average TKE (TKEa) trend is consistent across layers, but magnitude is higher near the surface, suggests that while the island angle uniformly modulates the overall energy level in the chamber, the free surface remains a dominant source of turbulence production. The exception at 0°, where TKEa drops, confirms that this configuration minimizes flow disturbance and energy dissipation throughout the entire water column. In all other island angle configurations, the average turbulent kinetic energy is higher than in the initial configuration, suggesting that the island angle of 0° may be the most optimal configuration.
The consistent and stable water surface profile under all island angle configurations, characterized by smoother gradients than previous island distance experiments, is a fundamental indicator of the hydraulic stability and efficiency of this design. The pronounced lateral water level difference—highest at the left wall, lowest at the centerline—is not an anomaly but a direct consequence of the arc-shaped wall design and the conservation of energy and momentum. This lateral superelevation can be attributed to a centrifugal force effect. As the main flow is guided along the concave (arc) side of the chamber (typically the left side in your setup), it experiences a centripetal acceleration towards the outer wall. To maintain equilibrium, a pressure gradient is established, pushing water against the outer (left) wall and creating a higher water surface there. Conversely, along the centerline and convex side, the water surface is lower. This phenomenon is analogous to superelevation in a river bend and confirms that the flow follows the intended curved path. The impact of the island angle on the average water level is mediated through its control of flow contraction and energy dissipation. The trend of water level first decreasing, then increasing, and decreasing again with changing angle reflects the changing flow resistance: At extreme angles (e.g., ±60°), the high flow obstruction increases head loss across the chamber, necessitating a slightly higher upstream head to maintain discharge, which can manifest as a higher average water level within the chamber. At the 0° angle, the most streamlined configuration, flow resistance is minimized. This reduces head loss and allows for a more efficient energy dissipation primarily through friction rather than turbulence, resulting in a lower overall average water level. The anomalous sharp drop on the right side at −30° is a powerful demonstration of the three-dimensionality of the flow. It suggests that at this specific angle, the interaction between the island and the arc wall creates a particularly efficient flow path along the right side, reducing resistance and consequently dropping the water level, while the left side, with its series of arcs, maintains more obstruction and a higher water level. As for the influence of island angles on water level, the island structure has a relatively small impact on it. In this research, island angles of 0° and 30° can be considered optimal choices for the water level. Therefore, taking into account the water flow velocity, turbulent kinetic energy and water level changes comprehensively, an island angle of 0° is the optimal choice.
5. Conclusions
Based on hydraulic model experiments and numerical simulations, the study explored how island structures influence internal flow dynamics within island-type fishways. The key findings are as follows:
- (1)
-
The main flow within the fishway chamber exhibits an “S”-shaped high-velocity path, accompanied by petal-shaped recirculation zones downstream. These steady high-speed areas facilitate fish movement upstream, while the recirculation zones offer resting zones for prolonged swimming. Particularly, angles of −60° and 60° expand the low-velocity zones behind the island, while a 0° island angle achieves a balanced flow pattern. This configuration offers optimal conditions for fish migration and informs future fishway design strategies.
- (2)
-
Turbulent kinetic energy (TKE), an indicator of flow instability, is also sensitive to island angle. A 0° angle yields the lowest peak and average TKE values, promoting a calmer and more stable hydrodynamic environment favorable for fish passage.
- (3)
-
Surface fluctuations, reflected in changes to the water level line, show a stepped profile due to internal arc structures. The overall water level trend across different paths typically decreases, rises, and falls again. Although changes in island angle have a limited influence on this variation, the 0° angle exhibits an advantage in maintaining smoother transitions along the water surface.
Although the physical model successfully replicated the multi-channel and diverse flow characteristics of the island-type fishway at a Froude number (Fr) of 0.225, and achieved the intended design objectives, this experimental approach entails inherent limitations when extrapolated to full-scale engineering applications. The primary constraint stems from the fundamental challenge of hydrodynamic scaling. While Froude similarity was maintained to ensure the correct representation of gravity-dominated forces, it was impossible to simultaneously satisfy the similarity criteria for other key dimensionless numbers governing viscous forces and turbulent diffusion. This disparity may introduce deviations in the model's flow field compared to the prototype. A notable consequence is the scale effect related to turbulence; the scaling of turbulent intensity is nonlinear, and the influence of viscous forces—which differ between model and prototype—often leads to measurements that deviate from true prototype values. Furthermore, significant differences exist in boundary conditions. The prototype structure would typically be constructed from materials like concrete or mortared stone with a specific roughness, which could evolve due to biological fouling (e.g., algal growth). In contrast, the model was fabricated from smooth acrylic (Plexiglas), whose hydraulic roughness and physical properties are markedly different. This simplification affects the simulation of shear stresses and local flow patterns near the boundaries. Finally, a subtle but potentially important effect was not captured: the fluid-structure interaction. In a prototype, concrete elements might undergo subtle deformations under hydrodynamic loading, minutely altering the flow field. The rigid acrylic model precludes any simulation of this two-way coupling, representing an additional simplification of the real-world engineering system.
Acknowledgments
The author is very grateful to the Institute of Fluid Equipment and Inspection Technology, China Jiliang University, for supporting this study.
Author Contributions
Conceptualization, M.X.; methodology and investigation, G.Z.; resources and data curation, B.F.; writing—original draft preparation, G.Z.; writing—review and editing, Y.C.; visualization, R.Y. All authors have read and agreed to the published version of the manuscript.
Ethics Statement
Not applicable.
Informed Consent Statement
Not applicable.
Data Availability Statement
Data are contained within the article.
Funding
This work was financially supported by the National Training Program of Innovation and Entrepreneurship for Undergraduates (Project No. 202410356044).
Declaration of Competing Interest
The authors declare that they have no competing financial interests or personal relationships that could have appeared to influence the work reported in this paper.
References
-
1.
Bakis R. The current status and future opportunities of hydroelectricity.
Energy Sources Part B 2007,
2, 259–266. doi:10.1080/15567240500402958.
[Google Scholar]
-
2.
Bermann C. Impasses and controversies of hydroelectricity.
Estud. Avançados 2007,
21, 139–153. doi:10.1590/S0103-40142007000100011.
[Google Scholar]
-
3.
Shen C, Yang R, Shi X, Wang M, He S. Vortex identification based on the Liutex method and its effect on fish passage upstream.
J. Hydrodyn. 2024,
36, 130–141. doi:10.1007/s42241-024-0010-1.
[Google Scholar]
-
4.
Roscoe DW, Hinch SG. Effectiveness monitoring of fish passage facilities: historical trends, geographic patterns and future directions.
Fish Fish. 2010,
11, 12–33. doi:10.1111/j.1467-2979.2009.00333.x.
[Google Scholar]
-
5.
Travade F, Larinier M. Fish locks and fish lifts.
Bull. Fr. Pêche Piscic. 2002,
364, 102–118. doi:10.1051/kmae/2002096.
[Google Scholar]
-
6.
Katopodis C, Kells J, Acharya M. Nature-like and conventional fishways: Alternative concepts?
Can. Water Resour. J. 2001,
26, 211–232. doi:10.4296/cwrj2602211.
[Google Scholar]
-
7.
Bravo‑Córdoba FJ, Francisco JSR, Jorge RL, Valbuena-Castro J, Makrakis S. Vertical slot versus submerged notch with bottom orifice: Looking for the best technical fishway type for Mediterranean barbels.
Ecol. Eng. 2018,
122, 120–125. doi:10.1016/j.ecoleng.2018.07.019.
[Google Scholar]
-
8.
Baki A.B.M, Azimi A.H. Hydraulics and design of fishways II: vertical-slot and rock-weir fishways.
J. Ecohydraul. 2024,
9, 158–170. doi:10.1080/24705357.2021.1981780.
[Google Scholar]
-
9.
Zhang D, Qu Y, Shi X, Liu Y, Jiang C. Design of a novel multislot and pool–weir combined fishway based on hydraulic properties analysis and fish‑passage experiments.
J. Hydraul. Eng. 2024,
150, 04024004. doi:10.1061/JHEND8.HYENG-13604.
[Google Scholar]
-
10.
Liao C, Liu J, Chen F. Research on hydraulic characteristics of Daniel fishway and vertical-slot fishway based on CFD method. In Proceedings of the Seventh International Conference on Advanced Electronic Materials, Computers, and Software Engineering (AEMCSE 2024), Hangzhou, China, 20–22 March 2024. doi:10.1117/12.3038078.
-
11.
Cooke SJ, Hinch SG. Improving the reliability of fishway attraction and passage efficiency estimates to inform fishway engineering, science, and practice.
Ecol. Eng. 2013,
58, 123–132. doi:10.1016/j.ecoleng.2013.06.005.
[Google Scholar]
-
12.
Mao X. Review of fishway research in China.
Ecol. Eng. 2018,
115, 91–95. doi:10.1016/j.ecoleng.2018.01.010.
[Google Scholar]
-
13.
Porwal PR, Thompson SM, Walters DK, Jamal T. Heat transfer and fluid flow characteristics in multistaged Tesla valves.
Numer. Heat Transf. Part A Appl. 2018,
73, 347–365. doi:10.1080/10407782.2018.1447199.
[Google Scholar]
-
14.
Keizer K. Determination Whether a Large Scale Tesla Valve Could be Applicable as a Fish Passage. Delft University of Technology 2016. Available online: https://resolver.tudelft.nl/uuid:c871a0b0-a0d5-4b6e-afab-bc29c9a9797b (accessed on 24 September 2025).
-
15.
Hoek S, Jin R, Van Der Schaar E, Shanitbayeva S, de Visser M, Wallace N. The Return of Fish Migration to the Dutch River Delta. Wageningen University 2021. Available online: https://www.delta21.nl/wp-content/uploads/2022/02/ACT-Vismigratierivier.pdf (accessed on 24 September 2025).
-
16.
Zeng G, Xu M, Mou J, Hua C, Fan C. Application of tesla valve’s obstruction characteristics to reverse fluid in fish migration.
Water 2022,
15, 40. doi:10.3390/w15010040.
[Google Scholar]
-
17.
Zeng G, Xu M, Dong M, Wang K, Ren Y. Research on the hydraulic characteristics of island type fishways by experimental and numerical methods.
Water 2023,
15, 2592. doi:10.3390/w15142592.
[Google Scholar]
-
18.
Dong M, Zeng G, Xu M, Mou J, Gu Y. Influence of valvular structures on the flow characteristics in an island-type fishway.
Water 2024,
16, 2336. doi:10.3390/w16162336.
[Google Scholar]
-
19.
Zhu L, Xu J, Tang N, Wang X, Chaturvedi S, Srivastava PK. Analysing turbulence patterns in nature‐like fishways: An experimental approach.
Aquatic Conserv. Marine Freshwater Ecosyst. 2024,
34, e70014. doi:10.1002/aqc.70014.
[Google Scholar]
-
20.
Cea L, Peña L, Puertas J, Vázquez-Cendón ME, Peña E. Application of several depth-averaged turbulence models to simulate flow in vertical slot fishways.
J. Hydraul. Eng. 2007,
133, 160–172. doi:10.1061/(ASCE)0733-9429(2007)133:2(160).
[Google Scholar]
-
21.
Tudorache C, Viaene P, Blust R, Vereecken H, De Boeck G. A comparison of swimming capacity and energy use in seven European freshwater fish species.
Ecol. Freshwater Fish 2008,
17, 284–291. doi:10.1111/j.1600-0633.2007.00280.x.
[Google Scholar]
-
22.
Marriner BA, Baki AB, Zhu D, Cooke SJ, Katopodis C. The hydraulics of a vertical slot fishway: a case study on the multi-species vianney-legendre fishway in quebec, Canada.
Ecol. Eng. 2016,
90, 190–202. doi:10.1016/j.ecoleng.2016.01.032.
[Google Scholar]