1. Introduction
The gaseous cloud formed during the discharge of a firearm consists of volatilized products originating from gunpowder deflagration and the primer cup’s low-brisance deflagration. These products rapidly condense, forming various components, including particles known as gunshot residues (GSR) [
1].
GSR analysis using scanning electron microscopy coupled with energy-dispersive X-ray spectroscopy (SEM/EDS) is a scientifically validated method for confirming the occurrence of a firearm discharge by detecting the presence of GSR particles on specific parts of a suspect’s body [
2]. SEM/EDS is considered the gold standard for GSR identification, as it allows for both the morphological characterization and qualitative chemical analysis of individual particles.
According to the literature, GSR particles typically exhibit either spherical morphologies with diameters ranging from 0.5 to 5 μm or irregular shapes with diameters exceeding 100 μm [
3]. The presence of characteristic particles containing lead (Pb), barium (Ba), and antimony (Sb) within a single particle in a given sample constitutes unequivocal evidence of characteristic GSR when identified by SEM/EDS [
3].
However, Laflèche et al. [
4] reported the detection of such particles in samples collected from vehicle occupants exposed to deployed airbags. These particles also contained additional elements—such as zirconium (Zr), copper (Cu), cobalt (Co), and calcium (Ca)—which, despite not typically being associated with characteristic GSR, raise concerns about potential false positives. Consequently, although elemental composition remains the primary criterion for GSR identification, morphometric analysis can provide valuable complementary information for distinguishing characteristic GSR from non-firearm-related particulate sources.
Particle morphometry is widely employed across various scientific disciplines to analyze the physical characteristics of microscopic particles. Commonly used parameters include Feret diameter, aspect ratio, circularity, and roundness [
5,
6,
7,
8,
9,
10,
11,
12,
13,
14,
15,
16,
17,
18]. Several studies have focused on the morphometry of GSR-characteristic particles [
16,
17,
19,
20,
21], with the aim of not only differentiating them from others as described above, but also identifying the type of ammunition used and assessing the influence of primer composition on particle morphology at crime scenes or on a suspect’s body. Therefore, a more detailed morphometric analysis of GSR particles—supported by digital image processing and analysis (DIPA) techniques—is scientifically justified.
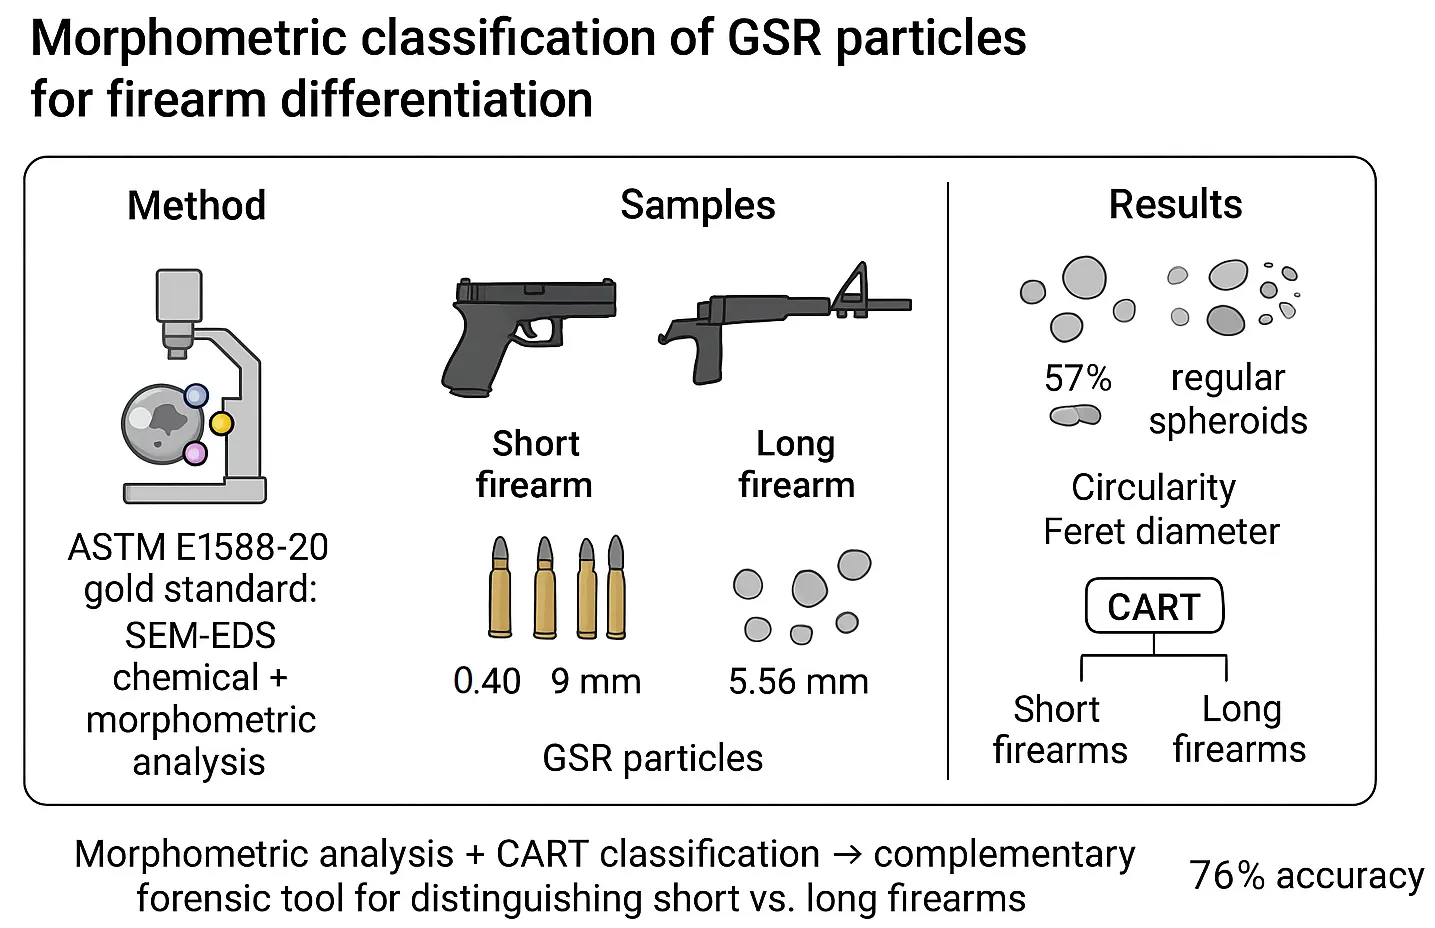
This study aimed to develop an automated measurement protocol for the morphometric classification of characteristic GSR particles, based on Feret diameter (FD), aspect ratio (AR), roundness (R), and circularity (C). Using this protocol, the study sought to establish correlations between the distinct morphometric features of characteristic GSR particles generated by 0.40, 9 mm, 5.56 mm, and 7.62 mm ammunition and the type of firearm, applying the Classification and Regression Tree (CART) method.
Future investigations by our research group will include additional variables—such as firearm mechanics (e.g., closing system, automatic or semi-automatic operation, barrel-to-cylinder gap in revolvers), which significantly influence GSR particle morphometry, and the composition of the priming mixture. These variables are expected to enhance further the accuracy and robustness of morphometric classification, especially considering the demonstrated effectiveness of the CART method in distinguishing between GSR particle profiles associated with different firearms/ammunition in the present study.
2. Materials and Methods
2.1. Type of Study, Data Collection and GSR Particle Selection
This research is classified as a cross-sectional study, as it involves data collection at a single point in time, without longitudinal follow-up. Collecting and selecting characteristic GSR particles were carried out using SEM/EDS, focusing on four types of Brazilian-manufactured ammunition (0.40, 9 mm, 5.56 mm, and 7.62 mm).
Samples were collected by experts from the General Department of Homicide and Protection of Persons (DGHPP) of the State of Rio de Janeiro, in accordance with ASTM E1588-20 standards [
3]. In summary, the stubs containing double-sided carbon tape were pressed 50 times onto the palms and 50 times onto the backs of both hands of the shooters. Additionally, for long firearms (5.56 and 7.62 mm), 50 presses were performed on the chest area and across the entire face (cheek, forehead, and chin) of the shooters, as gas dispersion in these regions is common when rifles are fired. All samples were collected immediately after firearm discharge, within a maximum interval of two minutes. The entire data collection process occurred in the same indoor shooting range under controlled environmental conditions, with temperatures ranging from 20 to 25 °C and relative humidity maintained between 70% and 80%.
Samples were obtained from five different shooters, each of whom fired one and ten shots with the tested firearms. Negative control samples were also collected from each shooter before the first discharge. For each shooting sequence (one or ten shots), four different firearms were used in combination with four types of ammunition, all manufactured by
Companhia Brasileira de Cartuchos (CBC), as detailed in .
.
Specification of firearms and ammunition used in the study.
| Firearm |
Ammunition |
| Taurus G2C pistol, 0.40 caliber |
CBC 0.40 S&W CSCV 160 gr |
| Glock G23 pistol, 9 mm caliber |
CBC 9 mm copper bullet, batch BNC10 |
| Colt M16A2 rifle, 5.56 mm caliber |
CBC 5.56 mm AXO46, batch A0142946 |
| IMBEL Fal rifle, 7.62 mm caliber |
CBC 7.62 × 51 mm Common |
After each shooting series, the shooters washed their hands thoroughly with running water and soap, allowing them to air dry. Samples were labeled using a color-coded system: red for the left hand (LH), green for the right hand (RH), and blue for the face (F) and chest (C). The caliber of the ammunition used was marked on the lid of each collection container. To prevent any form of contamination, all firearms were cleaned after each shot, and the same individual performed sample collection throughout the study. All firearms were used by every shooter, except for the 0.40 pistol, which was assigned for individual use only. This exception was justified by the fact that each police marksman already possesses this firearm as standard service equipment. As such, its use did not introduce contamination risks or increase particle generation, since they were very well cleaned between each shot.
Samples were analyzed using a field emission scanning electron microscope (FEG-SEM), model QUANTA 450 from FEI (Hillsboro, OR, USA), in accordance with ASTM E1588-20 standards. The microscope was equipped with an EDAX Genesis EDS accessory and the Magnum V1.0 automated GSR analysis system. Automated analyses were conducted with the following parameters: acceleration voltage of 25 kV, working distance of 10 mm, scan speed of 10.0 µs, and a backscattered electron (BSE) detector. For each shot or shooting sequence, samples were collected and images were acquired of particles displaying either spheroidal or irregular morphology. Only particles classified as characteristic under ASTM E1588-20 [
3]—containing Pb, Ba, and Sb were imaged. Each particle image was captured using a BSE detector, scan speed of 10 µs, resolution of 1024 × 1024 pixels, 1000× to 55,000× magnification and 300 dpi.
180 samples were analyzed: 30 from 9 mm caliber ammunition, 30 from 0.40 caliber, 60 from 7.62 mm caliber, and 60 from 5.56 mm caliber. Across all collected samples, 86,518 particles were detected, of which only 2522 were classified as characteristic GSR particles; therefore, this constituted our sample size (n).
2.2. Development of an Automated Measurement Protocol
Using digital image processing software, an automated protocol was developed to measure characteristic GSR particles. This protocol was designed to minimize operator-related errors during particle morphometric characterization and to reduce the need for rework. The measurement system, developed and implemented by the authors, leverages digital image processing techniques, wherein the accuracy of the measurements depends primarily on the quality of the original images and the efficacy of the object pre-processing stage [
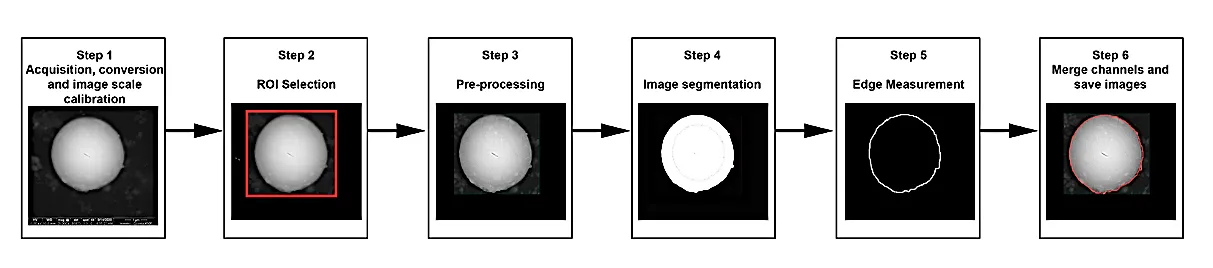
22]. A custom macro was written in Java and integrated into the Fiji distribution of ImageJ (version 2.3.0/1.53q). The complete workflow of the measurement protocol is illustrated in
.
. Overview of the digital image processing and analysis flowchart, divided into six distinct steps. Each step represents a key stage in the automated protocol for measurement and characterization of GSR particles using digital image processing techniques.
Step 1: Image Acquisition, Conversion, and Scale Calibration
An RGB micrograph was duplicated and converted to 8-bit greyscale. Spatial calibration for each magnification level was performed in ImageJ with the NIST Scanning Electron Microscope Scale Calibration Artifact (Reference Material 8820, NIST, Gaithersburg, ML, USA). The on-screen ImageJ ruler was standardized by manually measuring the NIST scale in triplicate and cross-checking those readings against ImageJ outputs, thereby minimizing measurement uncertainty and improving accuracy [
23].
Step 2: Region-of-Interest (ROI) Definition
To exclude superfluous annotations and background features, a rectangular ROI was delineated around the area under analysis (step 2,
).
Step 3: Image Pre-processing
Offline filtering was applied to sharpen particle edges and optimize subsequent morphometry. Using the aperture morphological operator, Grey level tone filtering targeted a minimum ROI area of 20,000 pixels with 4-pixel connectivity. These parameters derive from spatial-domain enhancement techniques that accentuate structural detail while suppressing noise in particle detection [
24].
Step 4: Image Segmentation
Threshold-based segmentation was selected for its ability to exploit regional intensity similarity and convert greyscale data into binary form, facilitating edge verification within the ROI [
24]. A binary mask storing the (x, y) coordinates of each candidate particle was generated and associated with the black channel of the segmented image. The Fill Holes function removed intraparticle voids, after which Find Edges was executed to delineate boundaries further.
Step 5: Morphometric Measurement
Particle metrics were extracted with Analyze Particles in ImageJ, restricted to the defined ROI. Via Set Measurements, the following parameters were enabled: FD, AR, R, and C. Group 1 of the dialog box controls the measurement types—here, FD and shape descriptors—while Group 2 sets additional options.
Step 6: Channel Overlay Verification
To verify that the segmentation threshold precisely circumscribed each particle, the binary particle layer generated in Step 5 was merged with the original greyscale image from Step 1 using Merge Channels. Proper overlap is indicated by a red outline coincident with the particle perimeter; mis‑registration reveals under‑ or over‑thesholding effects on measured size. The composite image was archived for traceability.
2.3. Morphometric Analysis of Characteristic GSR Particles
FD measurements were performed using ImageJ (version 2.3.0/1.53q) software to determine the particle length. Morphology analysis used the shape descriptors C, AR, and R. The FD data are summarized in , which includes the measurement intervals of particle FD, the caliber of the ammunition, and the body region where the particles were collected. This information is crucial for identifying the predominant morphometric types of particles produced by short or long firearms using ammunition calibers of 0.40, 9 mm, 5.56 mm, and 7.62 mm. The characteristic GSR particles were categorized into classes, as shown in .
To define these classes, measurement intervals were created based on the shape descriptor data collected from 2522 characteristic GSR particle images (one image per particle). The classes of particles were defined from the evaluation and combination of the results of the shape descriptors C, R, and AR described in studies related to particle morphology by Blott and Pye [
13], summarized in . The morphometric differences among the particles were further illustrated using box plot graphs, providing a clear representation of the variation in particle shapes across different ammunition calibers.
.
Nomenclature, concept, and acceptance criteria for characteristic GSR particle classes from 0.40, 9 mm, 5.56 mm, and 7.62 mm ammunition.
| Classes |
Concept and Acceptance Criteria |
Guiding Morphologies |
| Regular spheroidal |
Continuously curved morphology, very rounded with a circular shape and R values between 0.7 and 1, C between 0.7 and 1, and AR between 1.01 and 1.43. |
 |
| Regular non-spheroidal |
Rounded morphology, with a circular shape with R values between 0.5 and 0.69, C between 0.6 and 0.699, and AR between 1.44 and 2. |
 |
| Irregular rounded |
Irregular rounded morphology, with a partially circular shape with R values between 0.25 and 0.49, C between 0.477 and 0.599, and AR between 2.02 and 3.75. |
 |
| Irregular angular |
Morphology with a sharp angle, with a very elongated shape with R values between 0 and 0.249, C between 0 and 0.446, and AR between 4.11 and 6.57. |
 |
2.4. Statistical Correlation Analysis
A double entry database was compiled in Microsoft Excel to minimize transcription errors. All subsequent analyses were executed in Minitab® v 20.0 (Minitab LLC, State College, PA, USA).
The frequency distribution of FD measurements was inspected via histograms. Because the data violated normality assumptions, Mood’s median test was applied (H₀: identical population medians; H₁: at least one differing median). This test was preferred over parametric ANOVA and rank-based alternatives (e.g., Kruskal–Wallis, Mann–Whitney) owing to its robustness to skewed distributions, heterogeneous variances, small unequal samples, and extreme values when the principal focus directly compares medians.
Correlations between morphometric predictors—FD, C, AR, R and firearm class (short vs long) were modelled by the CART algorithm that begins with the full dataset and recursively partitions it into binary subsets based on decision rules defined at internal nodes. The resulting structure includes a root node (representing the entire dataset), internal nodes (which split the data based on specific features), and leaf nodes (terminal nodes that assign a class label or a predicted value). This method was selected due to its robustness in handling non-linear relationships, insensitivity to outliers, and capacity to operate without assuming normality or homogeneity of variances in the data.
During the cross-validation process, nodes in a decision tree were constructed and evaluated repeatedly to ensure that the resulting model is robust and generalizable to unseen data. This iterative process involves the creation of multiple data partitions and enables comprehensive comparisons across subsets, thereby enhancing the model’s reliability and minimizing bias [
25]. The interaction between cross-validation and node development occurs through several key steps: (i) Data Splitting: The dataset was divided into multiple folds or subsamples. In each iteration, one fold was used as a validation set while the remaining folds were used for model training, providing a more reliable estimate of model performance. (ii) Tree Construction: For each training subset, the decision tree was generated starting from the root node and progressively split into internal and leaf nodes, with each node representing a decision based on a specific input feature. (iii) Model Evaluation: The model trained on each fold was evaluated against its respective validation set, typically by assessing prediction accuracy or other performance metrics at the leaf node level. (iv) Overfitting Mitigation: Cross-validation helped to detect overfitting, particularly in overly complex trees with excessive node splits that capture noise rather than meaningful patterns. This process aids in selecting a model structure that generalizes well. (v) Hyperparameter Optimization: Cross-validation was also employed to fine-tune tree-specific hyperparameters, such as maximum tree depth and minimum sample size per node, ensuring that the final model balances complexity and predictive accuracy.
This study assumed that the probability of reaching each response level was equal across all levels, meaning that the likelihood of each event occurring was uniform for all predictor variables (FD, C, AR, and R). The Gini index was selected for node splitting due to its proven effectiveness and ability to result in binary divisions. Specifically, this index identifies the optimal split by minimizing the weighted average of the Gini indices of the successor nodes. This index enables CART to create the purest nodes possible, thereby reducing data uncertainty.
The K-fold method was applied for cross-validation, with rows randomly assigned to each fold. This approach is particularly appropriate for datasets with fewer than 5000 observations. It was also determined that a minimum of ten cases was required for an internal node to be eligible for further splitting, while terminal nodes required at least three cases, preventing further division. A comparative graph was generated to evaluate the tree with the fewest terminal nodes and assess the cost of misclassification, plotting “misclassification cost” against the “number of terminal nodes”.
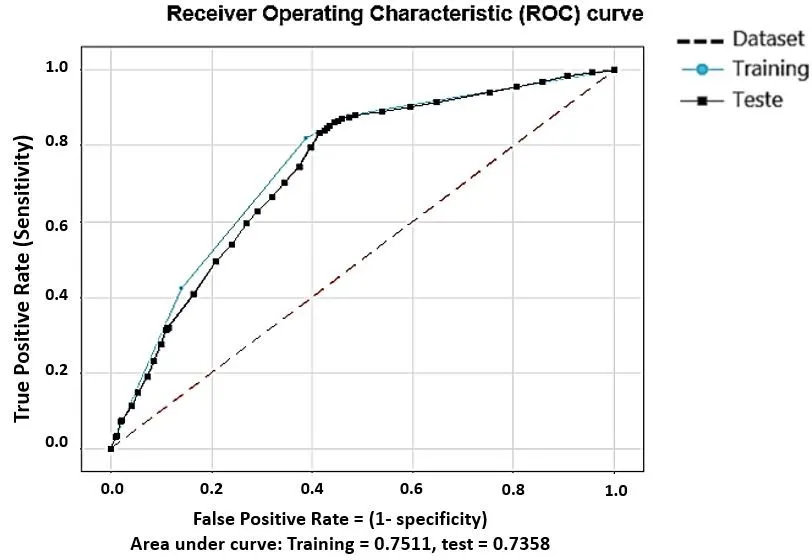
The classification performance of the decision tree was assessed using a confusion matrix, which evaluates the accuracy of class predictions based on the following metrics: True Positive Rate (TPR), also referred to as sensitivity or statistical power, defined as the probability of correctly predicting the occurrence of an event; False Positive Rate (FPR), or Type I error, representing the probability of incorrectly predicting an event when it did not occur; False Negative Rate (FNR), or Type II error, indicating the probability of failing to predict an event that did occur; and True Negative Rate (TNR), defined as the probability of correctly predicting the absence of an event. A Receiver Operating Characteristic (ROC) curve was constructed to validate model performance by plotting the TPR on the
Y-axis against the FPR on
X-axis. The Area Under the Curve (AUC) was calculated as 0.75 for the training set (20% of the sample) and 0.73 for the test set (80% of the sample). These values are considered acceptable, as an AUC of 1.0 represents a model with perfect discriminative ability, whereas an AUC of 0.5 reflects no better classification performance than random chance [
25].
3. Results and Discussion
A total of 86,518 particles were detected in the collected samples. Of these, 2522 particles (approximately 3% of the total) were classified as characteristic GSR particles, in accordance with ASTM E1588-20 [
3]. Characteristic GSR particles were present in all analyzed samples, with the highest count originating from 9 mm caliber ammunition. The number of particles detected—categorized by ammunition type, shooter, and region of the shooter’s body—is detailed in :
.
Number of characteristic particles identified by ammunition type, shooter, and region of the shooter’s body.
| Ammunition |
9 mm |
0.40 |
5.56 mm |
7.62 mm |
Total |
|
LH |
RH |
LH |
RH |
LH |
RH |
F |
C |
LH |
RH |
F |
C |
|
| Shooter 1 |
18 |
53 |
56 |
60 |
177 |
129 |
2 |
2 |
11 |
16 |
0 |
1 |
484 |
| Shooter 2 |
85 |
239 |
53 |
44 |
36 |
17 |
1 |
3 |
12 |
17 |
1 |
9 |
440 |
| Shooter 3 |
38 |
38 |
56 |
63 |
47 |
33 |
3 |
2 |
19 |
43 |
10 |
5 |
334 |
| Shooter 4 |
29 |
10 |
39 |
35 |
13 |
27 |
1 |
1 |
30 |
45 |
0 |
3 |
188 |
| Shooter 5 |
592 |
80 |
70 |
40 |
10 |
24 |
1 |
4 |
25 |
32 |
0 |
12 |
844 |
| Total |
762 |
420 |
274 |
242 |
283 |
230 |
8 |
12 |
97 |
153 |
11 |
30 |
2522 |
Regarding the recovery of these particles after sample collection, the number of characteristic GSR particles after discharging 5.56 and 7.62 mm cartridges was markedly lower than that detected for 9 mm and 0.40 caliber ammunition, even when supplementary swabs from the shooters’ chest and facial regions were analyzed. Although it has been reported that residues from long weapons tend to accumulate preferentially on the face and torso [
26], GSR dispersion is a multifactorial phenomenon. Key determinants include the firing hand (adjacent to the ejection port), the support hand (near gas exhaust apertures), ammunition design, barrel length, shooter’s grip and stance, pre-shot cleaning, and other weapon-specific parameters [
27,
28]. Ditrich et al. [
29] and Chohra et al. [
30] demonstrated significant inter-weapon variation in particle dispersal patterns. For instance, revolvers (short firearm) release residues in close proximity to the shooter, whereas shotguns and repeating rifles generate comparatively sparse particle clouds.
In line with these findings, the present study recorded the highest particle concentrations on shooters’ hands for both long and short firearms. Similarly, Brozek-Mucha [
31] reported greater particle counts on hand swabs compared to facial swabs after discharging short weapons [
17,
26,
31]. These observations highlight the importance of considering weapon architecture and handling dynamics when interpreting GSR distribution in forensic reconstructions. Although the number of characteristic GSR particles recovered is generally lower than that of other particle types classified under ASTM E1588-20 [
3] (
i.e., consistent and commonly associated particles), the observed variation in dispersion patterns also contributes to the relatively low number of characteristic GSR particles recovered (2522).
Regarding secondary transfer of particles and/or previous contamination, it is important to emphasize that such occurrences can significantly impact the interpretation of GSR findings. Particles may be transferred through indirect contact with contaminated surfaces, objects, or individuals, particularly in confined or shared environments. Moreover, the presence of characteristic GSR particles on control samples before shooting highlights the need for stringent contamination control measures and thorough background screening in forensic protocols. The data presented in exclude characteristic GSR particles detected in the control samples. The analyzed control samples identified 168 particles with both regular (spheroidal) and irregular morphologies. Among these, the highest contamination levels were observed in the samples from 0.40 ammunition, with shooters 2 and 5 identified as the primary sources of contamination. A salient finding was that background contamination was present in every pre-fire control swab, irrespective of the ammunition caliber. Shooter 4 yielded the fewest control particles, presumably owing to a more stringent decontamination protocol. Residues nevertheless persisted after each shot—despite interim cleaning of both firearm and hands—implicating secondary transfer, most plausibly from the holster or ancillary gear.
Systematic scrutiny of control data is essential for quantifying false positive risk in forensic casework. In operational settings such as law-enforcement duty, secondary GSR transfer can undermine evidential reliability [
31,
32]. We implemented a hand-cleaning regimen to mitigate this hazard and collected 30 paired samples to evaluate its efficacy. Before cleaning, 176 characteristic particles were recovered from weapons and hands; post cleaning, the count dropped to just 14. These results underscore the necessity of decontaminating both hands and firearms before firing, and interpreting residual particles in light of potential cross-transfer mechanisms. Despite the post-cleaning decline in particle abundance, SEM retained sufficient analytical sensitivity to detect and classify every residual GSR particle, underscoring the method’s robustness under low contamination conditions.
Once characteristic GSR particles were verified, high-resolution micrographs were archived in a database that served as the training set (504 samples were used) for an automated morphometric workflow. This algorithm extracted FD and the shape descriptors C, R, and AR.
Automated analysis yielded a comprehensive morphometric profile for 2522 particles. For regular spheroidal particles, a single FD measurement adequately represents size. In contrast, irregular or non-spheroidal morphotypes may require multiple dimensional metrics to be fully characterized [
33]. Because FD is defined as the maximum chord length of an object irrespective of orientation [
34], it was adopted as the principal metric for length assessment across all particle classes.
Of the 2552 characteristic GSR particles analyzed, 76% had diameters ranging from 1 to 10 µm. Within this range, 56.2% of the particles originated from 9 mm caliber ammunition, 22.3% from 0.40 ammunition, 11.2% from 5.56 mm caliber ammunition, and 10.3% from 7.62 mm caliber ammunition. When each ammunition type is considered individually, 92% of the particles generated by 9 mm ammunition, 82% of those from 0.40 ammunition, and 65% of those from 7.62 mm ammunition had diameters between 1 and 10 µm. In contrast, the majority of particles produced by 5.56 mm ammunition fell within the 11–40 µm range. The study conducted by Kara [
16] analyzed the FD of 1200 characteristic GSR particles collected from five European 9 mm caliber ammunition types produced by the manufacturers MKE, GECO, S&B, WIN, and LIBRA. The results indicated that 91% of the analyzed particles had an FD between 1 µm and 10 µm [
16]. Comparing Kara’s [
16] findings with those of this study, for samples collected from the same caliber and within the same measurement range, there was a difference of only 1%, with this study identifying 92% of particles within this range. These results highlight a strong trend indicating that characteristic GSR particles from 9 mm caliber ammunition predominantly exhibit an FD between 1 and 10 µm.
In the case of 5.56 and 7.62 mm caliber ammunition, the average FD values obtained in this study—29.21 and 21.23 µm, respectively—were slightly higher than those reported by Kara and Tahillioglu [
17], who observed mean values of 26.77 µm for 5.56 mm and 18.16 µm for 7.62 mm particles [
17]. These variations may reflect differences in experimental conditions, ammunition batches, or firearm models used during testing. For 0.40 caliber ammunition, an average FD of 16.08 µm was recorded; however, no comparable data were found in the literature, limiting direct analysis. The absence of reference values for certain calibers emphasizes the need for further studies to expand GSR morphometric databases to improve comparative assessments in forensic investigations.
After presenting the FD results, a new classification for morphological classes of characteristic GSR particles from the four national ammunitions analyzed in this study was created (see ). According to Blott and Pye [
13], the term “regular” is used to describe shapes with straight edges or those that have a continuously curved outline, in two or three dimensions. When a particle exhibits significant indentations (concavities) and projections (convexities) on its surface, it can be described as irregular. Of the regular particles, 57% are regular spheroidal, a value slightly lower than that found in the literature, which considers 70% of characteristic GSR particles to be spheroidal [
35], 36% are regular non-spheroidal, 6.7% are irregular rounded, and 0.3% are irregular angular. The new classification supports the qualitative evaluation of particle occurrence frequency for each type of ammunition.
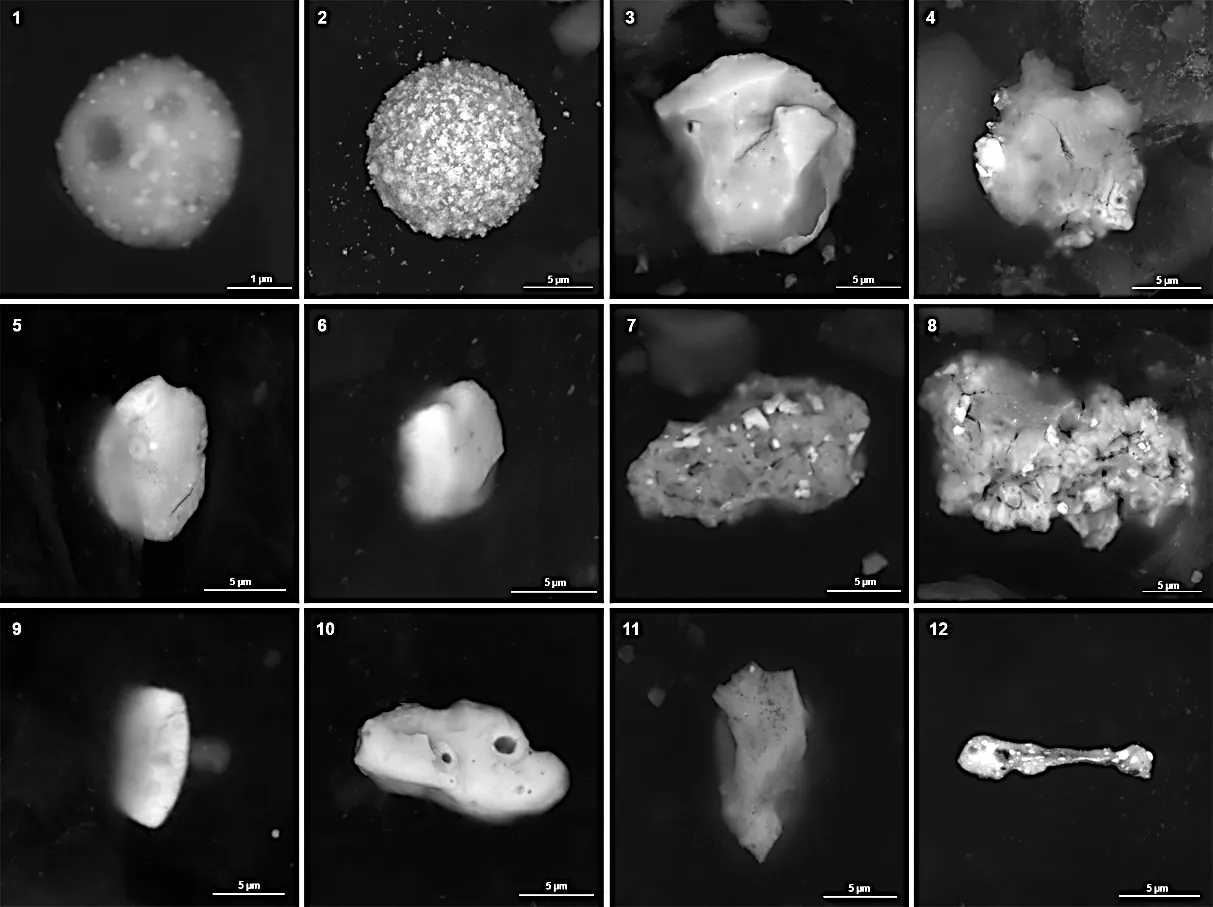
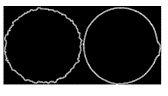
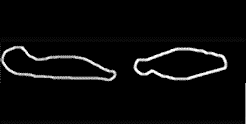
This revised classification system facilitates the qualitative assessment of particle occurrence frequency for each ammunition type. To highlight the morphological variations observed in the analyzed samples, all characteristic GSR particle classes are illustrated in .
. Representative Electron Micrographs of Characteristic GSR Particles from Brazilian Ammunition (7.62 mm, 5.56 mm, 9 mm, and 0.40 Calibers); (1–4) Regular Spheroidal, (5–8) Regular Non-Spheroidal, (9–11) Irregular Rounded, (12) Irregular Angular.
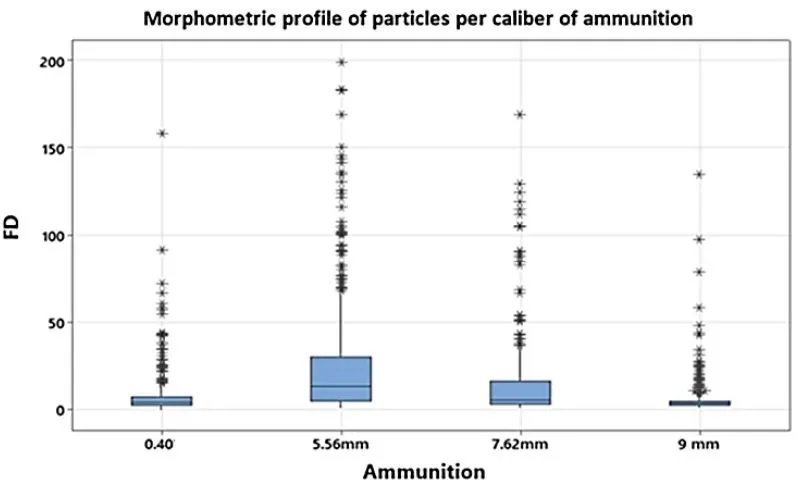
By evaluating the combination of two variables—FD and particle morphology—it is possible to observe clear differences in the morphometric profiles of characteristics GSR particles from long firearms (5.56 and 7.62 mm) compared to those from short firearms (9 mm and 0.40). These differences are illustrated in the box plots (, , , and ). Specifically, when analyzing the characteristics of GSR particles according to ammunition type, it becomes evident that the median FD values for particles originating from long firearms are higher than those observed for particles from short firearms ().
. Consolidated box plot of morphometric analysis of all collected particles by ammunition caliber.
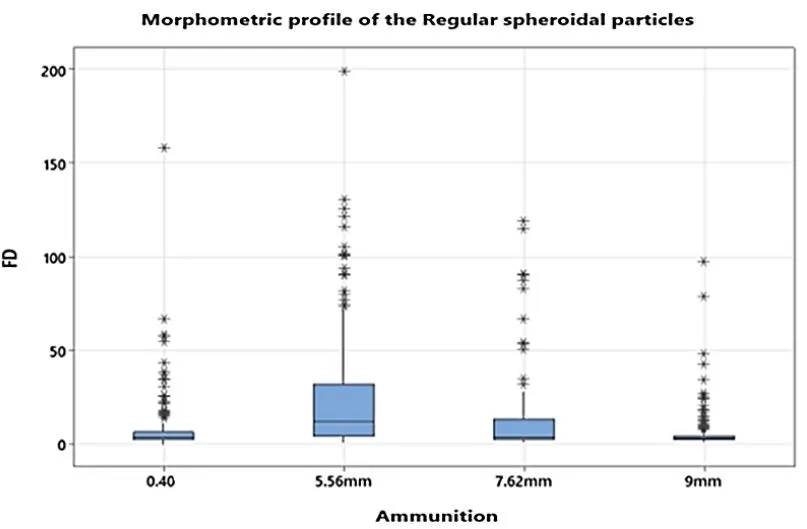
Regular spheroidal particles exhibit the lowest median FD values among all morphological classes, with a median of 3.35 µm. Although FD measurements in this class range from 0.09 to 9.77 µm, the highest concentration of particles falls within the 2.58 to 4.75 µm range. Among the short firearms, particles from 0.40 ammunition have a median FD of 3.37 µm, with most particles also concentrated between 2.56 µm and 4.77 µm. When comparing the median FD of 0.40 ammunition with that of 9 and 7.62 mm ammunition, the values are quite similar—3.18 and 3.36 µm, respectively. However, differences emerge in the distribution ranges: while 9 mm particles are most frequently found between 1.73 and 3.18 µm, 7.62 mm particles, like those from 0.40 ammunition, are concentrated in the 2.49 to 4.75 µm range.
Among regular spheroidal particles, 5.56 mm ammunition (a long firearm) exhibits the highest median FD value, at 4.34 µm. The majority of these particles fall within the 3.02 to 6.84 µm range, indicating that regular spheroidal particles from 5.56 mm ammunition tend to be larger than those from other calibers ().
. Box plot of the morphometric profile of regular spheroidal particles by ammunition caliber.
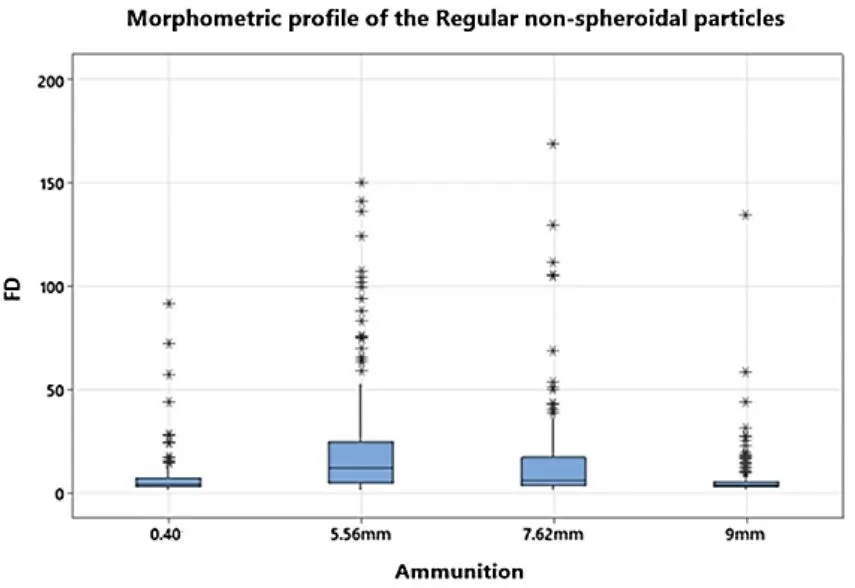
Non-spheroidal regular particles have a median FD value of 4.02 µm, with the highest concentration of particles ranging from 3.18 to 5.51 µm, although the full range extends from 1.60 to 9.93 µm. Within this morphological class, the results suggest that ammunition from long firearms tends to produce particles with larger FD values compared to short firearms. Specifically, 5.56 mm ammunition exhibits the highest median FD in this class, at 4.89 µm (), reinforcing the trend of larger particle sizes associated with long firearms.
. Box plot of the morphometric profile of non-spheroidal regular particles by ammunition caliber.
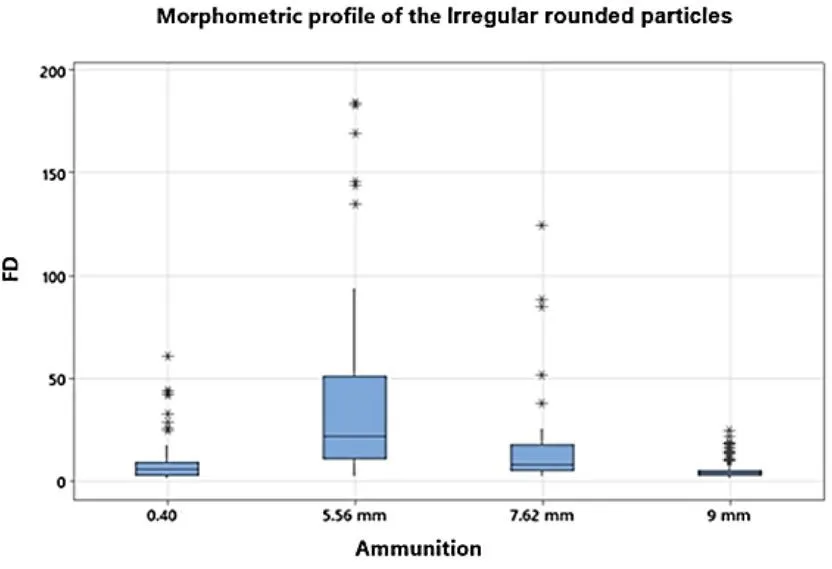
The irregular rounded particle class has a median FD of 4.02 µm, similar to that observed in class 2. However, most particles in this category are distributed within the FD range of 2.84 to 5.48 µm. Within this class, particles originating from short firearm ammunition exhibit lower median FD values compared to those from long firearms. Notably, particles from 7.62 mm ammunition present the highest median FD value in this class, measuring 5.79 µm ().
. Box plot of the morphometric profile of irregular rounded particles by ammunition caliber.
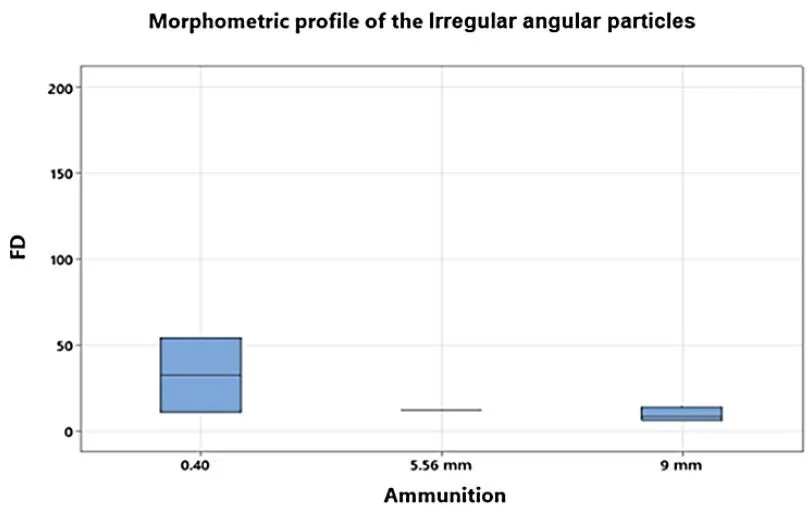
The irregular angular class presented only seven particles, with a median FD value higher than the other classes, being 6.60 µm (). This class occurred mainly in short firearms, with four particles in 9 mm ammunition, two particles in 0.40 ammunition, and one particle in 5.56 mm ammunition.
. Box plot of the morphometric profile of irregular angular particles by ammunition caliber.
The analysis of characteristic GSR particles was approached from the perspective of particle morphometry. The results indicate that regular particles can exhibit diameters larger than those previously reported in the literature and display highly specific morphologies depending on the type of ammunition. This finding offers a new perspective on the relevance of morphometric analysis, a method already employed in other scientific fields to better understand diverse processes. Among the parameters commonly used to characterize particle morphometry—such as Length, FD, AR, C and R—none have yet been systematically applied to characteristic GSR particles [
5,
6,
7,
8,
9,
10,
11,
12,
13,
14,
15,
16,
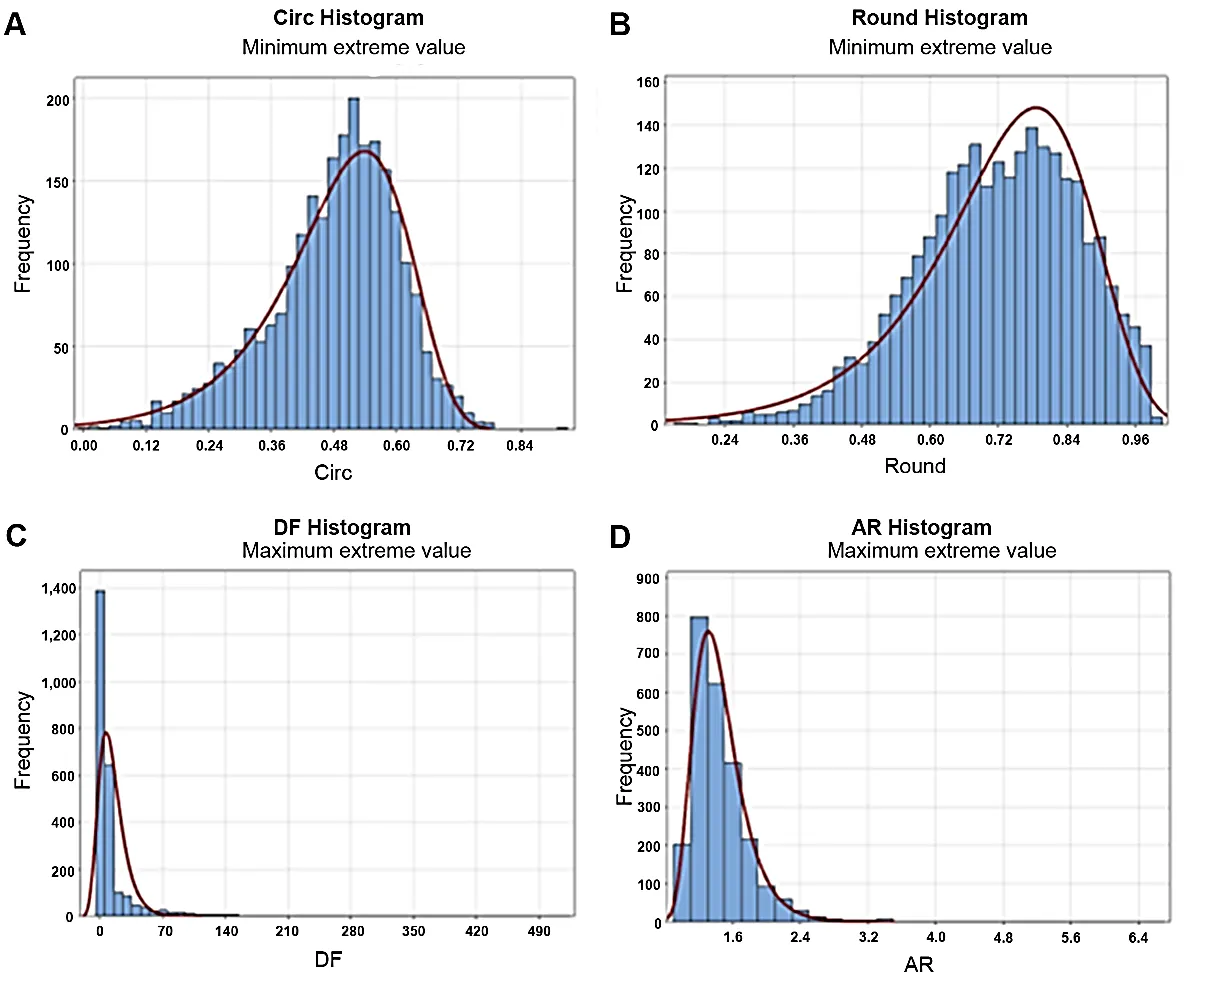
18]. In this study, the focus was placed on analyzing FD, AR, R, and C. The data were initially examined using frequency histograms. The histograms () reveal that the samples do not follow symmetrical distributions for the evaluated parameters.
. Frequency histogram and location analysis. (<b>A</b>) Frequency analysis of the circumference parameter; (<b>B</b>) Frequency analysis of the roundness parameter; (<b>C</b>) Frequency analysis of the Feret diameter parameter; (<b>D</b>) Frequency analysis of the aspect ratio parameter.
Since the distribution is not normal, using the mean as an estimator is not advisable, as it lacks robustness of validity. Confidence intervals based on the mean are generally imprecise when the underlying distribution deviates from normality. Robustness of validity refers to the ability of confidence intervals for population location to have a 95% probability of covering the true population location, regardless of the underlying distribution. The median, on the other hand, is an example of an estimator that tends to exhibit robustness of validity [
36].
Non-parametric Mood tests for the median were conducted, with the null hypothesis (H₀) stating that the population medians are all equal, and the alternative hypothesis (H₁) stating that the population medians are not all equal. All tests were performed at a 95% confidence level. The four parameters selected for the study were analyzed in two phases: Comparing the medians based on the type of weapon (long or short) and comparing the medians across different ammunition calibers. The results revealed that the parameters FD and C exhibited significant differences in their median values for both the weapon type comparison and the ammunition type evaluation. Conversely, the parameters R and AR showed no differences in median values.
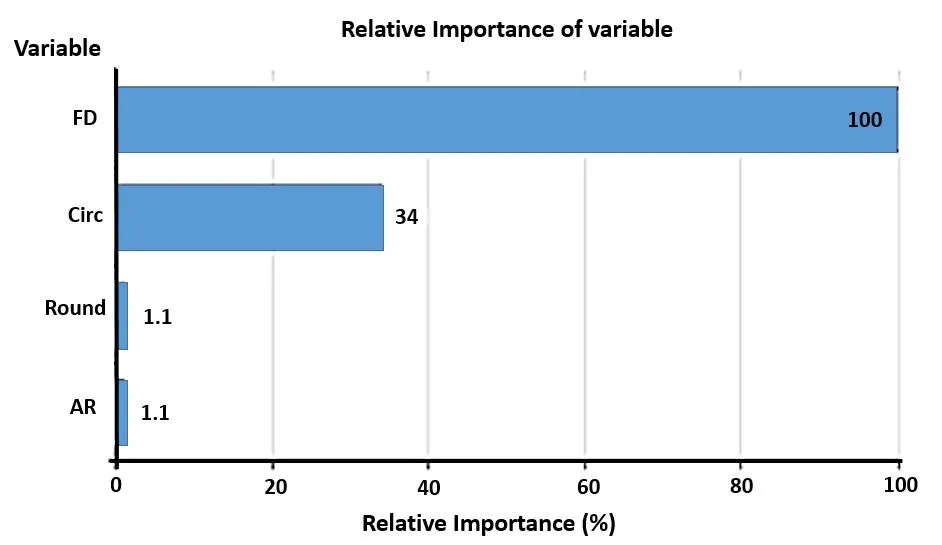
The results from the CART method analysis corroborated the findings of the Mood tests, confirming the same level of importance for the parameters FD and C (). The graph generated by the CART methodology ranks the variables based on their importance in node divisions, with values ranging from 0 to 100%. The most important variable is assigned a value of 100%, while the relevance of the other variables is expressed as a proportion relative to this maximum importance.
. Graph of relative importance among variables.
This analysis indicates that the most significant predictor variable in the model is FD, followed by the shape descriptor C. In contrast, the shape descriptors AR and R exhibit limited relevance. The variables FD and C contribute the most to the improvement of the model when performing predictor splits, suggesting that the algorithm identifies them as the most discriminative among the evaluated features [
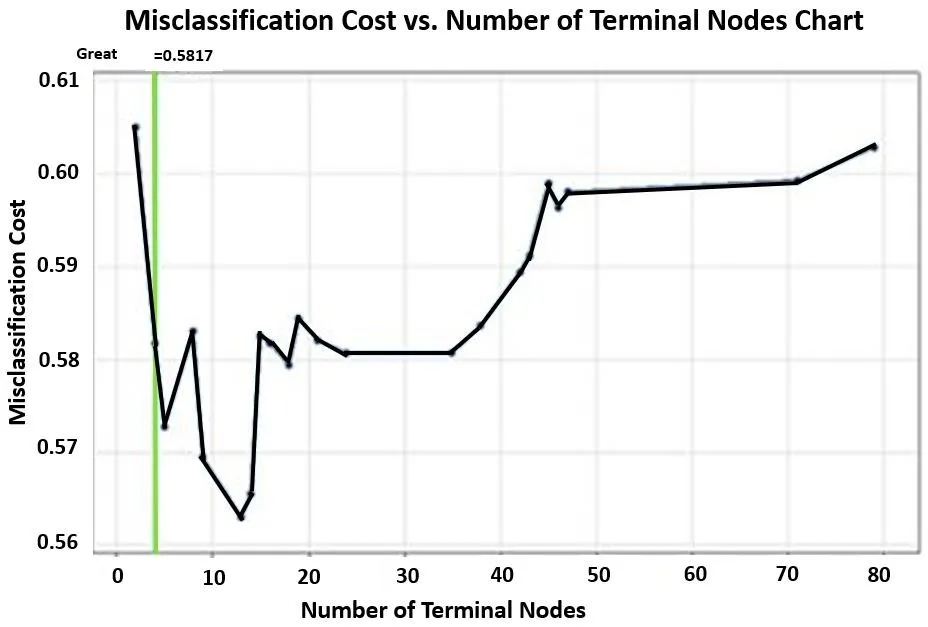
36]. To determine the most appropriate decision tree for the study, the graph of misclassification cost versus the number of terminal nodes was analyzed (). Terminal nodes represent a trade-off between model complexity and classification accuracy, with the optimal number being selected based on the minimization of misclassification cost. This analysis prioritizes trees with fewer nodes and the lowest achievable misclassification cost.
. Graph of misclassification cost x number of terminal nodes.
The graph reveals a milestone identified by Minitab at the tree with four terminal nodes, which is considered the optimal model for this dataset. This tree is labeled “Optimal” because it represents the smallest tree whose misclassification cost falls within one standard error of the minimum observed misclassification cost. The four-terminal-node tree exhibits a misclassification cost of approximately 0.5817. Although the tree with five terminal nodes has a slightly lower misclassification cost (approximately 0.57), and the six-node tree achieves the minimum cost (approximately 0.584), the difference is marginal (). Therefore, the tree with four terminal nodes was selected for further analysis. This choice is justified by the fact that increasing the number of nodes leads to minimal gains in predictive performance, with misclassification costs remaining close to the optimal value. As such, the increased model complexity is not warranted.
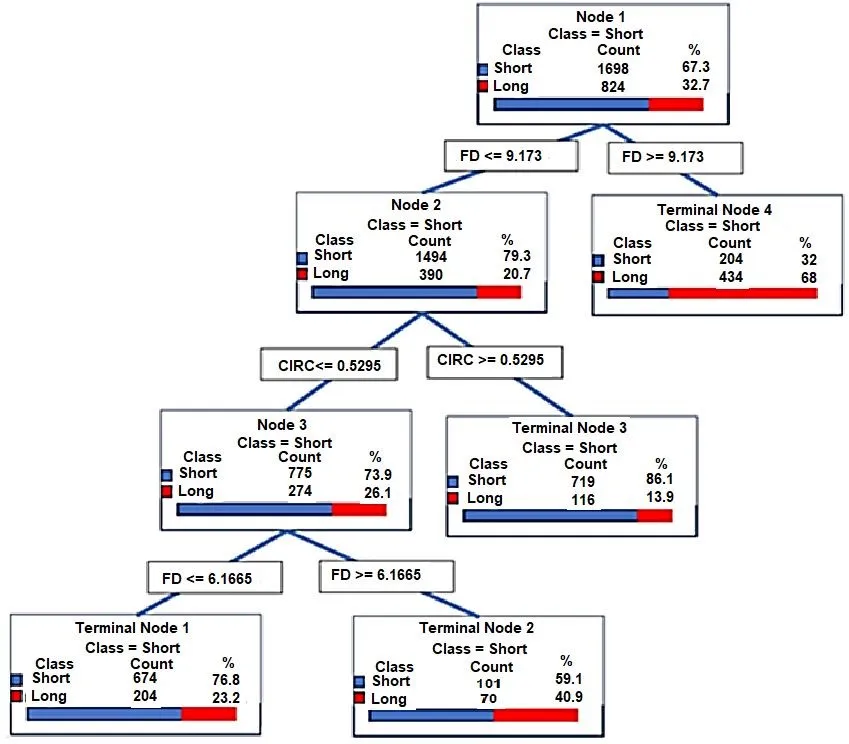
In this study, the first node of the tree (short firearm class) (node 1) was established by a cut in the proportion of short and long firearm ammunition. Of the total count of 2522 characteristic GSR particles, node 1 indicated that 67.3% were identified as originating from 9 mm and 0.40 ammunition. The second node, called node 2, made the cut considering the FD value ≤ 9.173 μm. Among the 1884 particles selected with this criterion, 79.3% were considered from short firearms. This initial binary division already presented the first terminal node 4 to the right of the tree, considering FD values greater than 9.173 μm. Node 3 was generated from the cut considering the variable C with the value ≤ 0.529. With this parameterized value, the algorithm classified 73.9% of the characteristic GSR particles as originating from 9 mm and 0.40 ammunition.
Considering the condition C > 0.529, terminal node 3 was generated. Terminal node 1 resulted from a subsequent split based on the FD value ≤ 6.166 µm, in which 76.8% of the characteristic GSR particles were classified as originating from 9 mm and 0.40 caliber ammunition. FD values greater than 6.166 µm led to the formation of terminal node 2, where 59.1% of the particles were associated with short-barreled firearms ().
. Diagram of the Optimal Tree (Probability tree of occurrence of short or long firearm ammunition probability based on FD analysis).
In addition to the decision tree, further results were obtained and are described in the . The performance of the decision tree model was evaluated using a confusion matrix, which provides a detailed assessment of the model’s classification accuracy through four key statistical metrics. The true positive rate (sensitivity or power) reflects the model’s ability to correctly identify the occurrence of an event, indicating how effectively it classifies particles when the predicted class matches the actual one. Conversely, the false positive rate (Type I error) represents the probability of incorrectly classifying a non-event as an event, thus capturing the model’s tendency to generate false alarms. The false negative rate (Type II error) measures the likelihood of failing to detect an actual event, revealing potential weaknesses in the model’ sensitivity. Lastly, the true negative rate (TNR) quantifies the model’s capacity to correctly identify non-events, contributing to a balanced evaluation of sensitivity and specificity [
36]. Together, these metrics provide a comprehensive understanding of the classification model’s strengths and limitations in differentiating between particle classes based on their morphometric characteristics, ensuring its reliability in forensic analysis.
.
Statistics of true positive rate x true negative rate.
| Statistics |
Training (%) |
Test (%) |
| True Positive Rate (sensitivity or power) |
82.0 |
83.3 |
| False Positive Rate (Type I error) |
38.8 |
41.5 |
| False Negative Rate (Type II error) |
18.0 |
16.7 |
| True Negative Rate (specificity) |
61.2 |
58.5 |
The results in
show that the true positive rate is above 80% in both training and testing, which is considered satisfactory for the analysis. According to Lima [
37], training refers to the iterative execution phase of the algorithm that occurs before the final implementation, while testing represents the algorithm’s execution after the optimal decision tree has been established. A ROC curve was generated to validate these results, plotting the rate of correctly classified events on the
Y-axis and the rate of incorrectly classified events on the
X-axis. The area under the curve was 0.75 during the training period and 0.73 during the testing period. According to the literature, this result is acceptable because a perfect ROC curve has an area under the curve equal to 1, indicating the tree’s ability to separate the model categories perfectly. Trees with an area under the curve equal to 0.5 demonstrate an inability to separate the model categories [
36] (
).
. Receiver Operating Characteristic (ROC) curve evaluates the relationship between the true and false positive rates.
The results obtained using the CART classification method indicate a 76% accuracy in identifying the type of firearm based on GSR particle morphometry, considering the analyzed measurement parameters.
4. Conclusions
According to the parameters used for particle measurement, 57% of the particles were identified as regular spheroids, a value slightly lower than those reported in the literature. Furthermore, a new particle classification system was developed based on a combination of parameters described in previous studies. This classification comprises four categories: Regular Spheroids, Non-Spheroidal Regulars, Irregular Rounded, and Irregular Angular.
It was observed that 76% of the characteristic regular and irregular particles had a Feret diameter within the range of 1 to 10 µm. Comparing short and long firearms using the CART methodology, a statistical difference was identified in the median FD values for each weapon type. Specifically, the parameters of C and FD were critical in differentiating particle origins, with particles from long firearms (5.56 and 7.62 mm ammunition) exhibiting higher median FD values compared to those from short firearms (0.40- and 9-mm ammunition).
A decision tree was constructed, enabling the development of a statistical model capable of classifying particles as originating from either a short or long firearm with an accuracy of 76%.
This study demonstrates that the integration of elemental and morphometric analysis provides a more comprehensive and reliable methodology for the forensic identification of GSR. By reducing reliance on a single analytical criterion, this combined approach enhances the robustness of forensic interpretations and supports more accurate conclusions in shooting investigations. The development of baseline morphometric data for Brazilian-manufactured ammunition represents an essential step toward the construction of reference databases, which may assist in future firearm classification efforts.
Moreover, the application of decision tree modeling (CART) emphasizes the potential of data-driven approaches to integrate material science, forensic science, and data science, thereby fostering innovation in criminal investigation techniques. Although the model achieved a promising classification accuracy of 76%, it is essential to note that the findings are based on a limited dataset, restricted to ammunition and firearms manufactured exclusively in Brazil, which may limit the generalizability of the results.
To address these limitations and strengthen the reliability of the proposed methodology, further studies are warranted. These should include the analysis of a broader range of particle images and the evaluation of alternative predictive models capable of handling binary or multinomial outcomes. Such efforts are essential to refine machine learning techniques like CART and enhance the accuracy of associations between GSR particle characteristics and different types of ammunition and firearms.
Acknowledgments
The authors would like to express their sincere gratitude to FAPERJ (Research Support Foundation of the State of Rio de Janeiro) for the financial support that made this research possible. We also thank INMETRO (National Institute of Metrology, Quality and Technology) for providing the infrastructure and laboratory facilities essential to the development of this study. Special thanks are extended to our colleagues who contributed to the review and refinement of the English language in this manuscript.
Author Contributions
Conceptualization, R.C.S.; Methodology, A.L.M.d.S., C.B.d.P., M.A.R., I.d.A.R.; Software, A.L.M.d.S.; Data Curation, R.C.S., A.L.M.d.S., C.B.d.P.; Writing—Original Draft Preparation, A.L.M.d.S.; Writing—Review & Editing, R.C.S., C.B.d.P., I.d.A.R., M.A.M.G.; Visualization, R.C.S., I.d.A.R.; Supervision, R.C.S.
Ethics Statement
Ethical review and approval were waived for this study, as the research did not involve any experimental procedures with human participants. All data analyzed were fully anonymized prior to inclusion in the study, ensuring the protection of personal and sensitive information. Furthermore, the study was based exclusively on the routine collection of samples carried out by police authorities in the normal course of their activities, without any direct interaction with individuals or additional interventions beyond standard forensic practice.
Informed Consent Statement
Informed consent was waived for this study, as no experiments or interventions involving human participants were performed. All data were fully anonymized prior to analysis, ensuring the confidentiality and protection of personal information. Moreover, the study relied exclusively on forensic samples obtained through routine police procedures, without any additional collection or interaction beyond standard investigative practice.
Data Availability Statement
The data supporting this study’s findings are available from the corresponding author upon reasonable request.
Funding
We would like to thank funding support from Faperj—Research Support Foundation of the State of Rio de Janeiro, Brazil. Grant number: E-26/290.038/2021.
Declaration of Competing Interest
The authors declare that they have no known competing financial interests or personal relationships that could have appeared to influence the work reported in this paper.
References
-
1.
Basu S. Formation of Gunshot Residues.
J. Forensic Sci. 1982,
27, 72–91. doi:10.1520/JFS11453J.
[Google Scholar]
-
2.
SWGGSR, Guide for Primer Gunshot Residue Analysis by Scanning Electron Microscopy/Energy Dispersive X-ray Spectrometry 11-29-11. 2011. Available online: https://docs.wixstatic.com/ugd/4344b0_46da982f600840abbfa2100e44021875.pdf (accessed on 10 April 2024).
-
3.
ASTM International. Standard Practice for Gunshot Residue Analysis by Scanning Electron Microscopy/Energy-Dispersive Spectrometry. ASTM Standards, Designation E 1588-20. ASTM International: West Conshocken, PA, USA, 2020. Available online: https://store.astm.org/e1588-20.html (accessed on 10 April 2024).
-
4.
Laflèche DJ, Brière SJ, Faragher NF, Hearns NG. Gunshot residue and airbags: Part I. Assessing the risk of deployed automotive airbags to produce particles similar to gunshot residue.
Canad. Soc. Forensic Sci. J. 2018,
51, 48–57. doi:10.1080/00085030.2018.1463202.
[Google Scholar]
-
5.
Cox EP. A method of assigning numerical and percentage values to the degree of roundness of sand grains.
J. Paleontol. 1927,
1, 179–183.
[Google Scholar]
-
6.
Wadell H. Sphericity and roundness of rock particles.
J. Geol. 1933,
41, 310–331.
[Google Scholar]
-
7.
Barret PJ. The shape of rock particles, a critical review.
Sedimentology 1980,
27, 291–303.
[Google Scholar]
-
8.
Clark MW. Quantitative shape analysis: a review.
J. Int. Assoc. Mathemat. Geol. 1981,
13, 303–320.
[Google Scholar]
-
9.
Winkelmolen AM. Critical remarks on grain parameters, with special emphasis on shape.
Sedimentology 1982,
29, 255–265. doi:10.1111/j.1365-3091.1982.tb01722.x.
[Google Scholar]
-
10.
Barreiros FM, Ferreira PJ, Figueiredo MM. Calculating shape factors from particle sizing data.
Part. Part. Syst. Character. 1996,
13, 368–373. doi:10.1002/ppsc.19960130607.
[Google Scholar]
-
11.
Diepenbroek M, Bartholomä A, Ibbeken H. How round is round? A new approach to the topic ‘roundness’ by Fourier grain shape analysis.
Sedimentology 1992,
39, 411–422. doi:10.1111/j.1365-3091.1992.tb02125.x.
[Google Scholar]
-
12.
Igathinathane C, Pordesimo LO, Columbus EP, Batchelor WD, Methuku SR. Shape identification and particles size distribution from basic shape parameters using ImageJ.
Comput. Electron. Agr. 2008,
63, 168–182. doi:10.1016/j.compag.2008.02.007.
[Google Scholar]
-
13.
Blott SJ, Pye K. Particle shape: a review and new methods of characterization and classification.
Sedimentology 2008, 55, 31–63. doi:10.1111/j.1365-3091.2007.00892.x.
[Google Scholar]
-
14.
Takashimizu Y, Liyoshi M. New parameter of roundness R: circularity corrected by aspect ratio.
Progr. Earth Planet. Sci. 2016,
3, 2. doi:10.1186/s40645-015-0078-x.
[Google Scholar]
-
15.
Cruz-Matías I, Ayala D, Hiller D, Gutsch S, Zacharias M, Estradé S, et al. Sphericity and roundness computation for particles using the extreme vertices model.
J. Comput. Sci. 2019,
30, 28–40. doi:10.1016/j.jocs.2018.11.005.
[Google Scholar]
-
16.
Kara İ. The relationship between gunshot-residue particle size and Boltzmann distribution.
Forensic Sci. Res. 2020,
7, 47–52. doi:10.1080/20961790.2020.1713433.
[Google Scholar]
-
17.
Kara İ, Tahillioglu E. Digital image analysis of gunshot residue dimensional dispersion by computer vision method.
Microsc. Res. Tech. 2022,
85, 971–979. doi:10.1002/jemt.23966.
[Google Scholar]
-
18.
Madkour FA, Mohammed ES, Radey R, Abdelsabour‐Khalaf M. Morphometrical, histological, and scanning electron microscopic investigations on the hard palate of Rahmani sheep (Ovis aries).
Microsc. Res. Tech. 2022,
85, 92–105. doi:10.1002/jemt.23887.
[Google Scholar]
-
19.
Vermeij E, Duvalois W, Webb R. Koeberg M. Morphology and composition of pyrotechnic residues formed at different levels of confinement.
Forensic Sci. Int. 2009, 186, 68–74. doi:10.1016/j.forsciint.2009.01.019.
[Google Scholar]
-
20.
Tucker W, Lucas N, Seyfang KE, Kirkbride KP, Popelka-Filcoff RS. Gunshot residue and brakepads: Compositional and morphological considerations for forensic casework.
Forensic Sci. Int. 2017,
270, 76-82.
[Google Scholar]
-
21.
Kara L, Sarikavak Y, Lisesivdin SB, Kasap M. Evaluation of morphological and chemical differences of gunshot residues in different ammunitions using SEM/EDS technique.
Environ. Forensics 2016,
17, 68–79.
[Google Scholar]
-
22.
Wirth MA. Performance evaluation of image processing algorithms in CADe.
Technol. Cancer Res. Treat. 2005,
4, 159–172. doi:10.1177/153303460500400207.
[Google Scholar]
-
23.
De Martins de Souza AL, Carreteiro Damasceno J, Prado CB, Magalhães Gurgel MA, Carvalho Silva R. Uncertainty model for automated gunshot residue particle length measurements obtained from electron microscopy images.
J. Microsc. 2023,
292, 105–116. doi:10.1111/jmi.13232.
[Google Scholar]
-
24.
Dias FC. Use of ImageJ Software for Quantitative Analysis of Material Microstructure Images; INPE: São José dos Campos, Brazil, 2008; pp. 33–126.
-
25.
Hosokawa EO. Decision tree technique in data mining [Undergraduate thesis, Faculdade de Tecnologia de São Paulo]. Faculdade de Tecnologia de São Paulo. 2011. Available online: http://www.fatecsp.br/dti/tcc/tcc0003.pdf (accessed on 4 August 2023).
-
26.
Krishna S, Ahuja P. A chronological study of gunshot residue (GSR) detection techniques: a narrative review.
Egypt. J. Forensic Sci. 2023,
13, 51. doi:10.1186/s41935-023-00369-8.
[Google Scholar]
-
27.
Schwoeble AJ, Exline DL. Current Methods in Forensic Gunshot Residue Analysis, 1st ed.; CRC Press: Boca Raton, FL, USA, 2000. doi:10.1201/9781420042573.
-
28.
Garofano L, Capra M, Ferrari F, Bizzaro GP, Di Tullio D, Dell’Olio M, et al. Gunshot residue: further studies on particles of environmental and occupational origin.
Forensic Sci. Int. 1999,
103, 1–21. doi:10.1016/S0379-0738(99)00035-3.
[Google Scholar]
-
29.
Ditrich H. Distribution of gunshot residues—The influence of weapon type.
Forensic Sci. Int. 2012,
220, 85–90. doi:10.1016/j.forsciint.2012.01.034.
[Google Scholar]
-
30.
Chohra M, Beladel B, Baba Ahmed L, Mouzai M, Akretche D, Zeghdaoui A, et al. Study of gunshot residue by NAA and ESEM/EDX using several kinds of weapon and ammunition.
J. Radiat. Res. Appl. Sci. 2015,
8, 404–410. doi:10.1016/j.jrras.2015.02.012.
[Google Scholar]
-
31.
Brożek-Mucha Z. Chemical and morphological study of gunshot residue persisting on the shooter by means of scanning electron microscopy and energy dispersive X-ray spectrometry.
Microsc. Microanal. 2011,
17, 972–982. doi:10.1017/S1431927611012141.
[Google Scholar]
-
32.
Cook M. Gunshot residue contamination of the hands of police officers following start-of-shift handling of their firearm.
Forensic Sci. Int. 2016,
269, 56–62.
[Google Scholar]
-
33.
Papini CJ. Comparative Study of Methods for Determining Particle Size. Master Dissertation, Universidade de São Paulo, São Paulo, Brazil, 2003.
-
34.
Ferreira T, Rasband W. ImageJ User Guide IJ 1.46. 2012. 1.89–91. Available online: https://imagej.net/ij/docs/guide/ (accessed on 30 July 2023).
-
35.
Wallace JS. Chemical Analysis of Firearms, Ammunition, and Gunshot Residue, 2nd ed.; CRC Press: Boca Raton, FL, USA, 2018; pp. 3–4.
-
36.
Mosteller F, Tukey JW. Data Analysis and Regression: A Second Course in Statistics, Reading; Addison-Wesley: Boston, MA, USA, 1977.
-
37.
Lima NM. Statistical Analysis of a Process Aimed at Increasing the Service Life of Starch Application Roller Coating in Paper Production. Undergraduate Thesis, Universidade Federal de São Carlos, São Carlos, Brazil, 2022.
 Renata Carvalho Silva
1,2,*
Renata Carvalho Silva
1,2,*