1. Introduction
Aviation is under increasing pressure to reduce its greenhouse gas (GHG) emissions in alignment with global climate targets. Although aviation currently contributes approximately 2.5% of global CO
2 emissions, its total climate impact is significantly larger due to high-altitude effects like contrails and nitrogen oxides [
1]. Without strong mitigation measures, aviation’s relative share of climate forcing is expected to grow as other sectors decarbonise faster [
2].
While sustainable aviation fuels (SAFs) and battery-electric aircraft have received attention, both face scalability and technical barriers. SAFs remain expensive and limited in supply, while battery-powered aircraft are constrained by low energy density, restricting their use to very short-haul routes [
3]. Furthermore, SAF raises a fundamental question about sustainability that has not been fully answered yet [
4]. Hydrogen has therefore emerged as a leading candidate for deep decarbonisation. When produced via renewable electricity (green hydrogen), it produces no CO
2 emissions at the point of use. Combusted hydrogen emits only water vapour and low levels of NO
x, making it a promising zero-carbon aviation fuel [
5].
Industry roadmaps suggest that hydrogen-powered aircraft could become commercially available by the mid-2030s, especially for short-haul operations. However, hydrogen presents distinct engineering and operational challenges. It has low volumetric energy density and must be stored at cryogenic temperatures, requiring bulky, insulated tanks that reduce aircraft payload and range. According to a 2022 McKinsey study, early hydrogen aircraft may be range-limited to 2500–3000 km, suitable only for regional or medium-haul missions [
5]. However, this may be a pessimistic assumption. This makes network design and refuelling infrastructure critical. The cost of green hydrogen is also 2–4 times higher than kerosene, though projected to decline with scale and experience [
6].
To overcome these constraints, any realistic hydrogen transition must involve gradual fleet renewal, targeted infrastructure investment, and network adaptation. This study simulates such a transition using detailed aircraft performance and cost modeling. We compare two scenarios over the 2030–2050 period:
- 1.
-
A baseline scenario is where the airline operates only conventional aircraft: a narrowbody inspired by the Conventional Medium Range Transport (CMRT) and a long range twin inspired by the Conventional Long Range Transport (CLRT). These are inspired by the research in [7] and open some interesting opportunities, particularly with tankering to reduce turnaround times.
- 2.
-
A hydrogen transition (mixed) scenario, where hydrogen-powered inspired by the Airbus ZEROe [8] and HVLMR [9] aircraft are phased in starting in 2035, eventually replacing the kerosene fleet.
The mixed scenario introduces two strategically chosen hydrogen refueling hubs—London Heathrow (LHR) and Neom Bay Airport (NUM) in Saudi Arabia. These locations were selected for their policy alignment and infrastructure readiness. In the model, all long-haul flights are routed through these hubs to stay within the range limits of hydrogen aircraft. Short-haul and triangular flights are flown directly when range allows.
Using the Orion modelling tool developed at Cranfield University, the simulation accounts for aircraft performance, energy use, emissions, direct operating costs (DOC), and capital expenditures. The study provides a grounded, quantitative view of the challenges and opportunities in decarbonising commercial aviation by comparing fuel mass, energy consumption, and cumulative costs between scenarios. The findings contribute to emerging literature on sustainable aviation and support strategic planning for airlines, airports, and policymakers working toward net-zero goals. The present evaluation focuses on the existing applications of hydrogen fuel systems in aircraft. By examining both the theoretical context of alternative fuels and practical demonstrations of hydrogen in flight, the authors establish a foundation for evaluating hydrogen’s viability in commercial aviation.
1.1. Existing Applications
Experience from real-world projects has begun to demonstrate both the potential and the challenges of hydrogen in aviation. On the civilian side, several hydrogen-powered aircraft experiments have shown encouraging results. For example, the British-American company ZeroAvia retrofitted a 14-seat Cessna 208 Caravan turboprop with a liquid hydrogen fuel cell powertrain and successfully completed a 350-km (218-mile) flight under normal operating conditions. This demonstration flight lasted approximately 1.5 h, showing that a hydrogen-fueled system could achieve performance metrics approaching those of a conventional engine [
10]. Another notable trial in the urban air mobility sector was a hydrogen fuel cell-powered air taxi tested in Stuttgart, Germany. This small two-seat aircraft achieved up to 200 km/h speeds, suggesting that hydrogen-electric propulsion is viable for short-range commercial applications [
11]. These early projects indicate that hydrogen can power flight, at least for smaller aircraft and shorter distances, without compromising basic performance or safety.
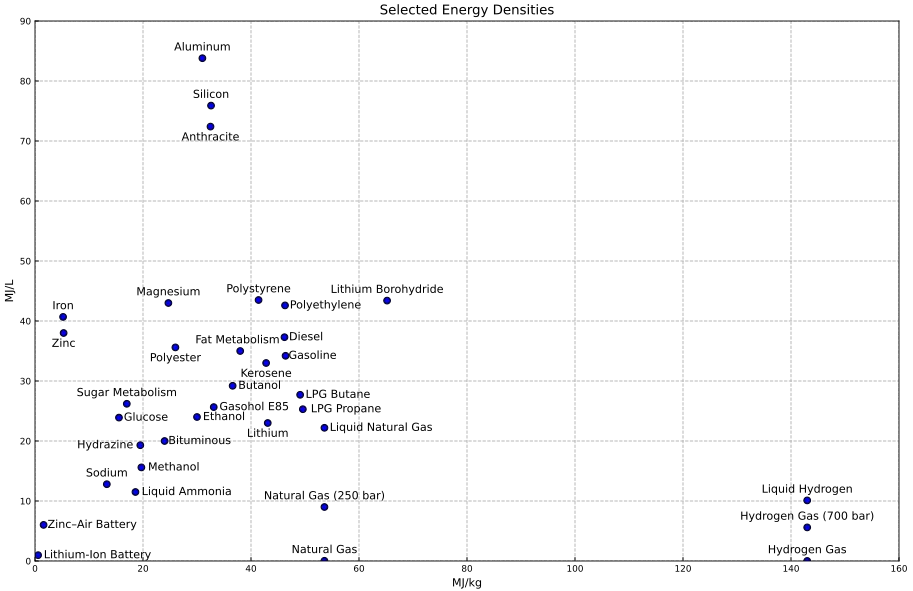
compares the energy density characteristics of various aviation fuels, highlighting hydrogen’s unique profile. The horizontal axis shows mass-specific energy (MJ/kg), while the vertical axis represents volumetric energy density (MJ/L). Liquid hydrogen (“LH
2 (cryogenic)”) provides approximately 120 MJ/kg nearly three times that of conventional jet fuel (~43 MJ/kg) but only 8–9 MJ/L by volume, far less than Jet A kerosene (~35 MJ/L). This trade-off is high energy per unit mass but low per unit volume which means hydrogen supports longer ranges by weight but requires larger storage tanks. illustrates this duality: hydrogen offers outstanding energy-per-weight potential [
12] but presents storage challenges due to low energy-per-volume [
13].
In addition to civil aviation trials, military programs have explored hydrogen fuel under more demanding conditions. As early as 1956, the U.S. Air Force successfully flew a modified Martin B-57 Canberra bomber using liquid hydrogen, proving the concept’s feasibility in a high-performance jet platform. The Soviet Union later conducted tests with a modified Tupolev Tu-154 airliner in 1988, in which one of the aircraft’s engines was adapted to run on hydrogen. These Cold War-era experiments established the basic viability of hydrogen for powered flight in larger airframes [
11]. Recently, Boeing developed the Phantom Eye, an unmanned, high-altitude, long-endurance aircraft powered entirely by liquid hydrogen. The Phantom Eye first flew in 2012 and demonstrated multi-day flight endurance, highlighting hydrogen’s potential for specialised applications requiring extremely long flight times [
11]. Such military and experimental projects, while not commercial, have pushed the boundaries of hydrogen aviation and provided valuable data on system performance in demanding scenarios.
. Comparison of various energy sources for aviation. Adapted from [
14] licensed under CC BY-SA 4.0.
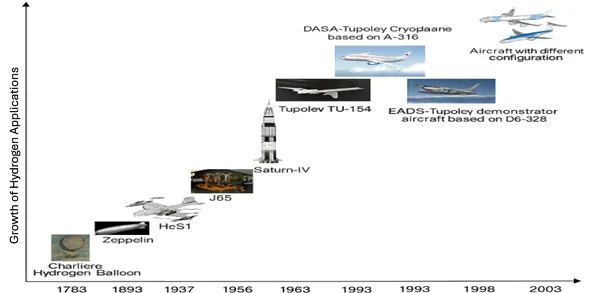
. Historical development timescale for hydrogen Adapted from [
11].
Timeline of major milestones in hydrogen aviation development, from early experiments to modern prototypes. Early innovations such as the 1783 hydrogen balloon (invented by J.A.C. Charles) and the 1890s era Zeppelin airships demonstrated lighter-than-air uses of hydrogen. In the mid-20th century, hydrogen was tested in propulsion: the 1937 HeS1 and later J65 turbojet experiments, and the hydrogen-powered Rocketdyne engines (e.g., the Saturn IV stage) in the 1960s space program. By the late 20th century, experimental aircraft like a modified Tupolev Tu-154 (USSR, 1988) and the Airbus-DASA Cryoplane project (1990s) brought hydrogen into actual aeroplane designs. This progression, as illustrated in , shows steady advances in both the technical capabilities and the operational understanding of hydrogen as an aviation fuel. However, despite this promising evolution, significant challenges remain before hydrogen can be widely adopted in mainstream commercial service. Key hurdles include the development of lightweight, safe onboard hydrogen storage (e.g., cryogenic tanks for liquid H
2), the creation of refuelling infrastructure at airports, and the integration of hydrogen powerplants into larger commercial aircraft designs. Addressing these challenges will be critical for realising hydrogen’s full potential as a viable and sustainable fuel for the aviation industry in the coming decades.
1.2. Simulation Tool (Orion)
The author has employed Orion, an aircraft performance simulation and mission analysis tool developed by Cranfield University, to model the operational performance of each aircraft type on the network routes. Orion has been used in prior studies of alternative aviation fuels (e.g., LNG) to integrate aircraft and engine performance with novel fuel systems [
15]. In our analysis, Orion computes mission fuel burn, flight time, and payload-range capabilities for each route–aircraft pairing. This simulation has been run by Matlab software. The model takes detailed inputs including aircraft geometry, mass properties, aerodynamic coefficients, engine parameters (via Turbomatch integration), and mission profile data such as cruise altitude, Mach number, and route structure. It simulates flight segments (climb, cruise, descent) and outputs metrics such as fuel consumption, range, reserve fuel needs, and emissions. ORION enables mission-level performance evaluation across different aircraft types and scenarios, forming the basis for downstream energy use and environmental impact analysis.
For the conventional aircraft (CMRT, CLRT), the tool uses known performance data and engine models; for the hydrogen aircraft (ZeroE, HVLMR), the authors input estimated parameters based on concept specifications and assumptions (discussed below). The simulation captures how differences in energy density, weight, and aerodynamics affect fuel consumption and range. For instance, the hydrogen planes carry insulated cryogenic tanks, which add weight and occupy volume, potentially reducing usable payload or range. Orion’s outputs per flight (fuel used,
etc.) are aggregated across all flights (routes) in a given year to obtain annual fuel consumption by fuel type (kerosene
vs. hydrogen), total block hours, and other fleet-level metrics.
1.3. Technoeconomic Environmental Risk Assessment (TERA) Framework
The performance results are evaluated under the TERA framework [
15,
16], which extends the analysis to economic and environmental metrics and considers uncertainty (risk factors). This means we not only simulate the engineering performance (fuel burn, range,
etc.), but also calculate direct operating costs and emissions, and identify key risk variables. The Direct Operating Cost (DOC) is estimated for each aircraft type and year, including costs for fuel, maintenance, crew, and fees. We assume crew and landing/airport fees are similar for hydrogen aircraft as for conventional aircraft of comparable size. Maintenance costs for hydrogen-fueled planes are less certain; however, the authors assume initially higher maintenance due to new technology (in 2035 adding ~10% over an equivalent conventional aircraft), improving over time as reliability grows and economies of scale reduce spare parts costs by 2050. Capital costs (purchase/lease of new aircraft) are not directly included in DOC here, but we discuss their impact qualitatively in the risk assessment. The fuel cost assumptions are informed by industry forecasts: in 2030, jet fuel is assumed at $2.00 per gallon (roughly $0.50 per kg), escalating moderately with oil price and carbon costs by 2050. Hydrogen fuel (liquid, delivered to aircraft) is assumed to cost about $5–6 per kg in the 2030s (reflecting the high cost of early green hydrogen production, liquefaction, and distribution) and to decline to around $2 per kg by 2050 [
15,
16]. These estimates align with projections that hydrogen, currently 3–6 times the cost of jet fuel per energy unit, could drop to 1.5–2.5 times the cost of jet fuel by mid-century with scaled-up production and learning curves [
17]. We conduct a sensitivity analysis on the hydrogen price to gauge its impact on overall DOC.
For the environmental assessment, the authors calculate CO
2 emissions directly from the fuel burn of kerosene using a standard emissions factor (3.15 tonnes CO
2 per tonne of Jet A fuel) [
18]. Hydrogen fuel, being carbon-free, produces zero CO
2 at the point of use. Thus, the hydrogen flights in our model have no direct CO
2 emissions. (We acknowledge that upstream emissions for hydrogen production are possible if energy is not fully renewable; however, the authors assume green hydrogen to focus on the maximum climate benefit case). We also track water vapour emissions from both fuel types and qualitatively consider NO
x emissions. For kerosene, NO
x is based on typical cruise emission indices for the aircraft engines. For hydrogen combustion, studies suggest NO
x formation can be much lower—on the order of 50–90% less than conventional fuel [
19]. Especially with optimised combustor designs (e.g., “micromix” burners) [
19]. We assume a 75% reduction in NO
x per thrust for hydrogen engines as a median estimate, acknowledging uncertainty. While the climate impact of hydrogen’s water emissions and contrails is complex, the authors note relevant research in our discussion; however, we do not assign a CO
2-equivalent metric to contrails in this study.
Finally, the TERA framework considers risk factors such as technology readiness and policy. We qualitatively evaluate risks: for example, the risk that hydrogen aircraft entry into service is delayed beyond 2035, or that hydrogen fuel supply is insufficient or more costly than expected. We also consider operational risks like the need for en-route refueling if range is inadequate. These factors are discussed to contextualise the robustness of the simulation results.
2. Methodology
2.1. Overview of Scenarios
The study evaluates two scenarios for the 2030–2050. The Baseline Scenario involves a conventional fleet using only Jet A (kerosene) fuel. The fleet comprises Airbus CMRT and CLRT aircraft, representing single-aisle and twin-aisle categories that cover short-haul and long-haul operations, respectively. Fleet growth is modelled to meet increasing travel demand—starting from an initial 2030 fleet of 126 aircraft (88 CMRT and 38 CLRT) and expanding to 276 aircraft by 2050 (193 CMRT and 83 CLRT). These numbers reflect the airline’s projected annual traffic growth and fleet replacement needs (assuming no extraordinary constraints on operations in the baseline). The Hydrogen Transition (Mixed) Scenario, on the other hand, introduces hydrogen-fueled aircraft into the fleet in a phased manner. We assume that starting around 2035, the airline begins procuring hydrogen-powered aeroplanes as they become available (consistent with forecasts of hydrogen aircraft readiness by 2035 for short-haul use [
8]). Early hydrogen aircraft in the scenario are single-aisle jets comparable in size to the CMRT, used primarily on short to medium routes. As a hydrogen propulsion technology matures, the fleet incorporates HVLMR aircraft, “Hydrogen very large medium range”, designed for medium to long-range missions. The HVLMR concept, inspired by the Airbus CLRT, features a widebody design capable of accommodating larger passenger capacities and extended ranges [
9]. Four aircraft types are modelled to evaluate baseline and hydrogen transition scenarios. The kerosene-powered fleet includes the Airbus CMRT and CLRT, while the hydrogen-powered fleet consists of Airbus’s ZEROe (a conceptual single-aisle aircraft) and the HVLMR, a widebody hydrogen aircraft inspired by the CLRT platform. The
below summarises their technical and economic characteristics:
.
Aircraft Design Characteristics and Estimated Purchase Prices.
| Design |
CMRT |
CLRT |
HVLMR |
ZEROe |
| Range (nm) |
4000 |
8100 |
3300 |
2000 |
| Passengers |
200 |
350 |
388 |
200 |
| Engine |
2 |
2 |
2 |
2 |
| Price (M$) |
120 |
320 |
640 |
240 |
Sources: [
1,
7,
8,
9]. Values adapted and estimated for modelling purposes.
An annual traffic growth rate of 4% is assumed [
20]. By 2050, the mixed scenario’s fleet is predominantly hydrogen-powered, with only a few kerosene-fueled jets remaining. The total number of aircraft in 2050 is the same order as the baseline (on the order of 280–300 aircraft). However, during the transition, the mix shifts from kerosene-only to a combination of hydrogen and kerosene propulsion. For simplicity, the authors assume identical passenger demand is served in both scenarios
i.e., the route network is adjusted in the hydrogen scenario to compensate for aircraft range limitations without loss of connectivity or capacity.
2.2. Route Network and Hydrogen Hubs
The authors adopted the philosophical approach of basing the hypothetical airline in two hydrogen hubs. This philosophical approach [
7] promises to reduce infrastructure costs greatly. A core infrastructure assumption in the hydrogen transition scenario is the establishment of two key hydrogen refuelling hubs: London Heathrow Airport (LHR) in the United Kingdom, and Neom Bay Airport (NUM/OENN) in Saudi Arabia. These hubs are deliberately chosen for their strategic locations and supportive environments. Heathrow is a major European intercontinental hub with a strong interest in sustainable aviation; it is involved in trials to enable hydrogen fuel operations by 2028 [
21]. As a large airport near abundant renewable energy resources (e.g., offshore wind in the North Sea) and a proactive decarbonisation policy environment, Heathrow is envisioned as an early adopter that can supply and utilise hydrogen for aviation at scale. Neom Bay Airport, on the other hand, is part of Saudi Arabia’s ambitious Vision 2030 development plan. Situated in the planned futuristic city of NEOM in northwest Saudi Arabia, Neom Bay is poised to become a global showcase for clean technology. Saudi Arabia is investing heavily in green hydrogen production. For instance, the NEOM Green Hydrogen Company is constructing the world’s largest green hydrogen plant, expected to produce 600 tons of hydrogen per day by 2026 using 100% renewable energy [
22]. Positioning Neom Bay as a hydrogen hub leverages this local green hydrogen supply and aligns with the region’s goal of becoming a leader in hydrogen energy. Geographically, the two hubs (London and Neom) create a network bridge between Europe and the Middle East (and beyond). In both baseline and mixed scenarios, all intercontinental routes are organised to either originate from, terminate at, or connect through one of these two hubs. Long-distance flights exceeding the range of hydrogen aircraft are broken into smaller legs via the hubs. For example, a flight from London to South Asia or East Africa would route through Neom Bay, and a flight from Neom to North America would route through London, ensuring no single segment exceeds the ~2500–3000 km practical range of early hydrogen jets [
5].
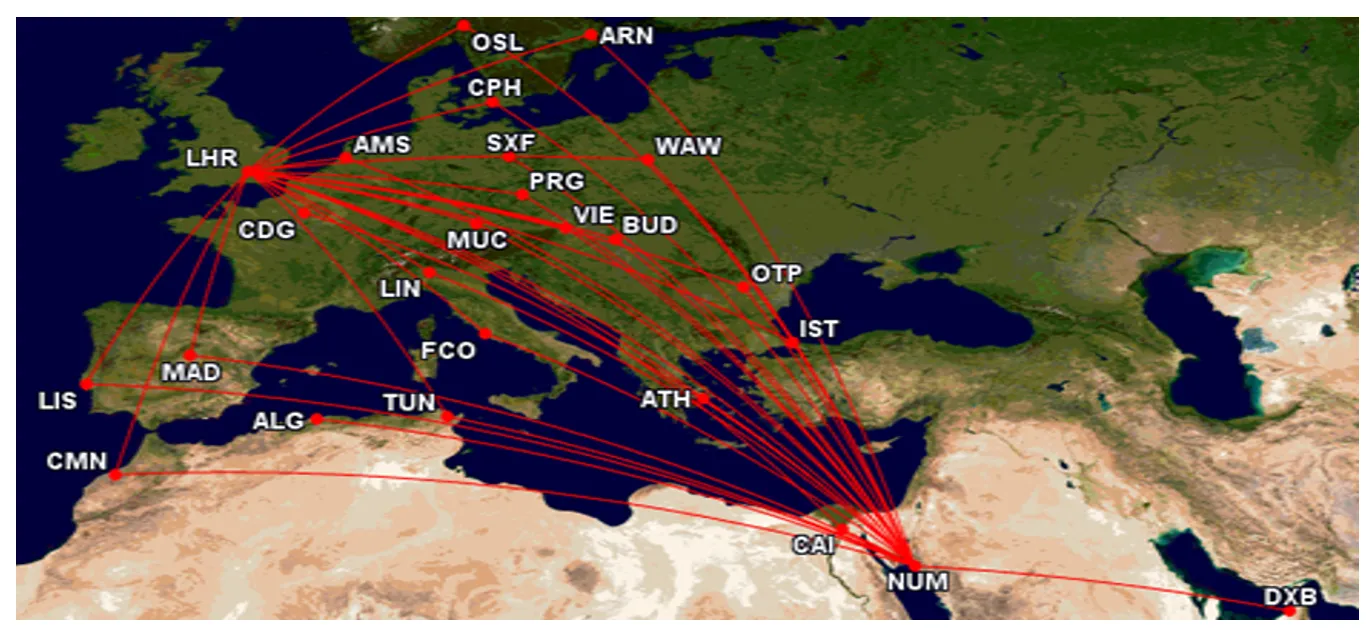
shows the route network in the 2030s–2040s, centred on two hubs (LHR in northwest Europe, and “NUM”—Neom Bay—in the Middle East). Red lines indicate flight segments operated. The network is split such that London Heathrow (LHR) primarily connects to cities in Europe and the western part of the network, while Neom (NUM) connects to destinations in Eastern Europe, North Africa, and West Asia (e.g., PRG = Prague, WAW = Warsaw, ALG = Algiers, CAI = Cairo, DXB = Dubai). This hub-and-spoke structure allows hydrogen aircraft with limited range to cover a wide geography by linking through the two central airports.
. Geographic locations of the two designated hydrogen hubs—London Heathrow in the UK (top left) and Neom Bay in Saudi Arabia (bottom right). The hydrogen transition scenario concentrates refuelling infrastructure at these hubs, and long-haul routes are accomplished by linking through the hubs rather than flying non-stop.
All other destination airports in the network are connected to one of these hubs by hydrogen-capable routes. The route structure thus shifts from a predominantly point-to-point or direct network in the baseline to more of a hub-and-spoke system in the hydrogen scenario.
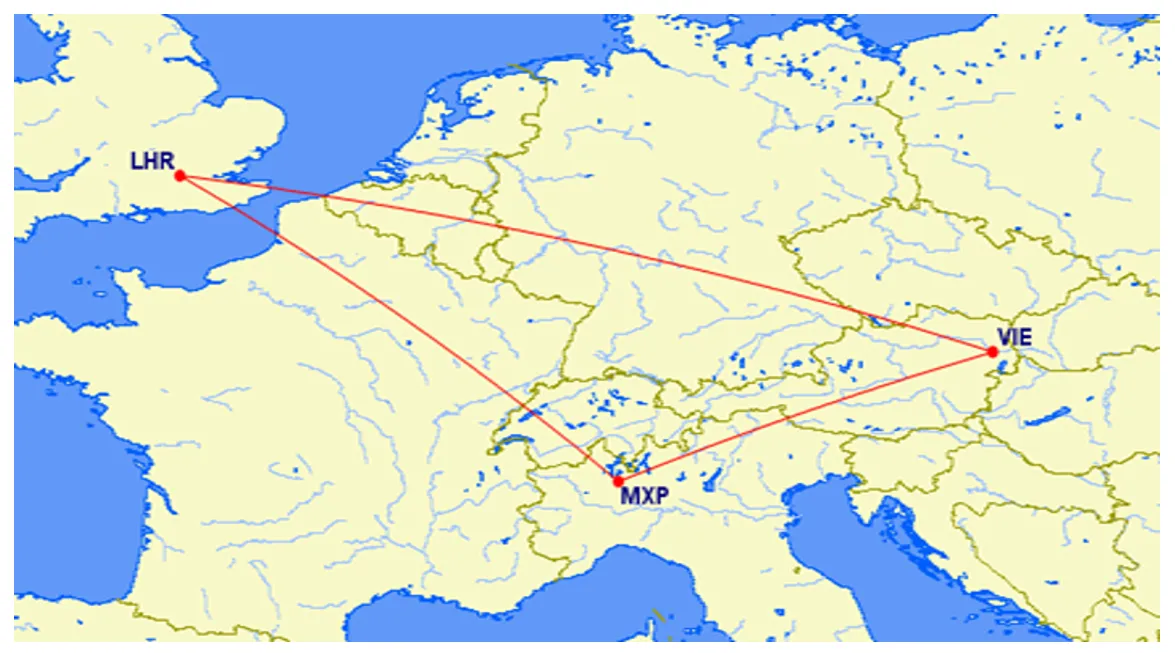
shows An additional operational feature in the scenario is the inclusion of triangular routes for certain regional connections. Triangular routing means an aircraft may fly in a closed circuit connecting three airports, which can be useful to cover two destinations with one loop while returning to the hub. This is employed for shorter routes to maximise aircraft utilisation and ensure hydrogen range constraints are not exceeded. For instance, an aircraft might originate at Heathrow, stop at Vienna, proceed to Milan, and finally return to Heathrow, forming a triangle. Such triangular flights are only used when the total circuit is within the aircraft’s fuel range and when direct hub return for each leg is unnecessary. They are exceptions rather than the norm, applied to nearby regional destinations to avoid excessive backtracking.
. Example of a triangular route within aircraft range under the hydrogen scenario. In this illustration, a hydrogen narrowbody departs London Heathrow (LHR) to Vienna (VIE), then flies onward to Milan Malpensa (MXP) before returning to LHR. Such routes are used sparingly to serve regional markets efficiently without requiring every leg to return to a hub.
The fuel consumption for each scenario is computed annually based on the fleet composition, aircraft performance, and route network. In the baseline scenario, total jet fuel (kerosene) consumption is calculated from the block hours flown by CMRT and CLRT fleets each year, using representative fuel burn rates for those types. In the hydrogen scenario, fuel consumption is split into kerosene and hydrogen components. We assume that before hydrogen aircraft introduction (2030–2034), the mixed scenario’s fuel use is 100% kerosene and nearly identical to the baseline (since the fleets are initially the same). From 2035 onward, as hydrogen aircraft begin operating from the hubs, a portion of total fuel energy is provided by hydrogen, displacing some kerosene. By 2050, with a fully hydrogen fleet, kerosene use drops to zero. Hydrogen contains about 120 MJ/kg, nearly three times the specific energy of jet fuel (~43 MJ/kg) [
23,
24]. In our simulation, the authors assumed trip energy requirements might be slightly higher on a per-seat basis for hydrogen aircraft due to added tank weight, lower thermal efficiency, and route detours [
12,
13]. The modelling accounts for the higher energy content per kilogram of hydrogen: Hydrogen contains about 120 MJ/kg, nearly three times the specific energy of jet fuel (~43 MJ/kg). Thus, for an equivalent energy requirement, the mass of hydrogen fuel needed is roughly one-third of the mass of kerosene. However, hydrogen aircraft may have different efficiency characteristics (e.g., different engine efficiency or added weight from tanks). In our simulation, the authors assumed overall trip energy requirements might be slightly higher (on a per-seat basis) for hydrogen flights due to aircraft design and possible longer routing. We tracked the mass of fuel consumed (in kilograms) and the energy content of the fuel (in megajoules, MJ) for each fuel type annually. This allows for the comparison of total energy demand between scenarios, alongside mass-based consumption.
Carbon emissions are calculated for each scenario based on kerosene fuel burn. We use the standard emission factor that burning 1 kg of jet fuel produces about 3.15 kg of CO
2 [
18]. The baseline scenario’s CO
2 emissions are directly proportional to its jet fuel use. The hydrogen scenario’s CO
2 emissions come only from the fraction of operations still using kerosene; hydrogen fuel use is assumed to be “green” (produced from renewables) and thus generates no net CO
2 in operation. Other emissions and climate impacts (such as nitrogen oxides and contrails) are discussed qualitatively. We note that hydrogen combustion can still produce NOx and water vapour that lead to contrail formation, but with potentially different characteristics (e.g., fewer soot particles may reduce persistent contrails) [
5].
2.4. Cost Modelling
The analysis considers two major cost components: aircraft purchase (capital) and fuel costs. For fleet procurement, the authors tally the number of new aircraft added each year in both scenarios and multiply by unit costs. The baseline purchases consist of additional CMRTs and CLRTs. The mixed scenario purchases include hydrogen single-aisle aircraft from 2035 onward modelled after the Airbus ZEROe—as well as HVLMR widebody aircraft for medium- to long-haul service. These hydrogen aircraft costs are assumed to be moderately higher than their kerosene counterparts (e.g., CMRT and CLRT), reflecting early production limitations and emerging technology [
9]. We also account for the possibility that some existing aircraft might be retired earlier than their 20–25 year lifespan in the hydrogen scenario (to be replaced by hydrogen models), which could effectively add to capital requirements. All costs are reported in U.S. dollars (USD) and, for simplicity, the authors do not apply net present value discounting. Instead, we sum nominal expenditures over the period for a cumulative comparison. Fuel costs per unit are based on projected prices: the authors use an average kerosene price baseline of around $0.80 per kg (roughly $2.5 per gallon, consistent with pre-2020 jet fuel prices) with inflation to higher prices by 2050, and for green hydrogen the authors assume a higher cost, starting equivalent to about $3–4 per kg (reflecting current green hydrogen costs being several times higher than jet fuel on an energy basis [
5,
23], but declining towards $2/kg by 2050 as technology matures. These are rough estimates to capture the expected premium of hydrogen. Given hydrogen’s higher energy per kg, the per-MJ cost difference is somewhat less stark, but hydrogen fuel remains more expensive throughout the scenario. The model calculates annual fuel expenses by multiplying the fuel consumption of each type by its unit price in that year. Maintenance, operations, infrastructure, and other costs are not explicitly modelled. However, the hydrogen scenario would likely incur additional infrastructure costs (e.g., building hydrogen production, liquefaction, and storage facilities at Heathrow and Neom). We focus on the primary cost drivers of fuel and fleet to isolate how a switch to hydrogen affects the airline’s operating economics in those areas.
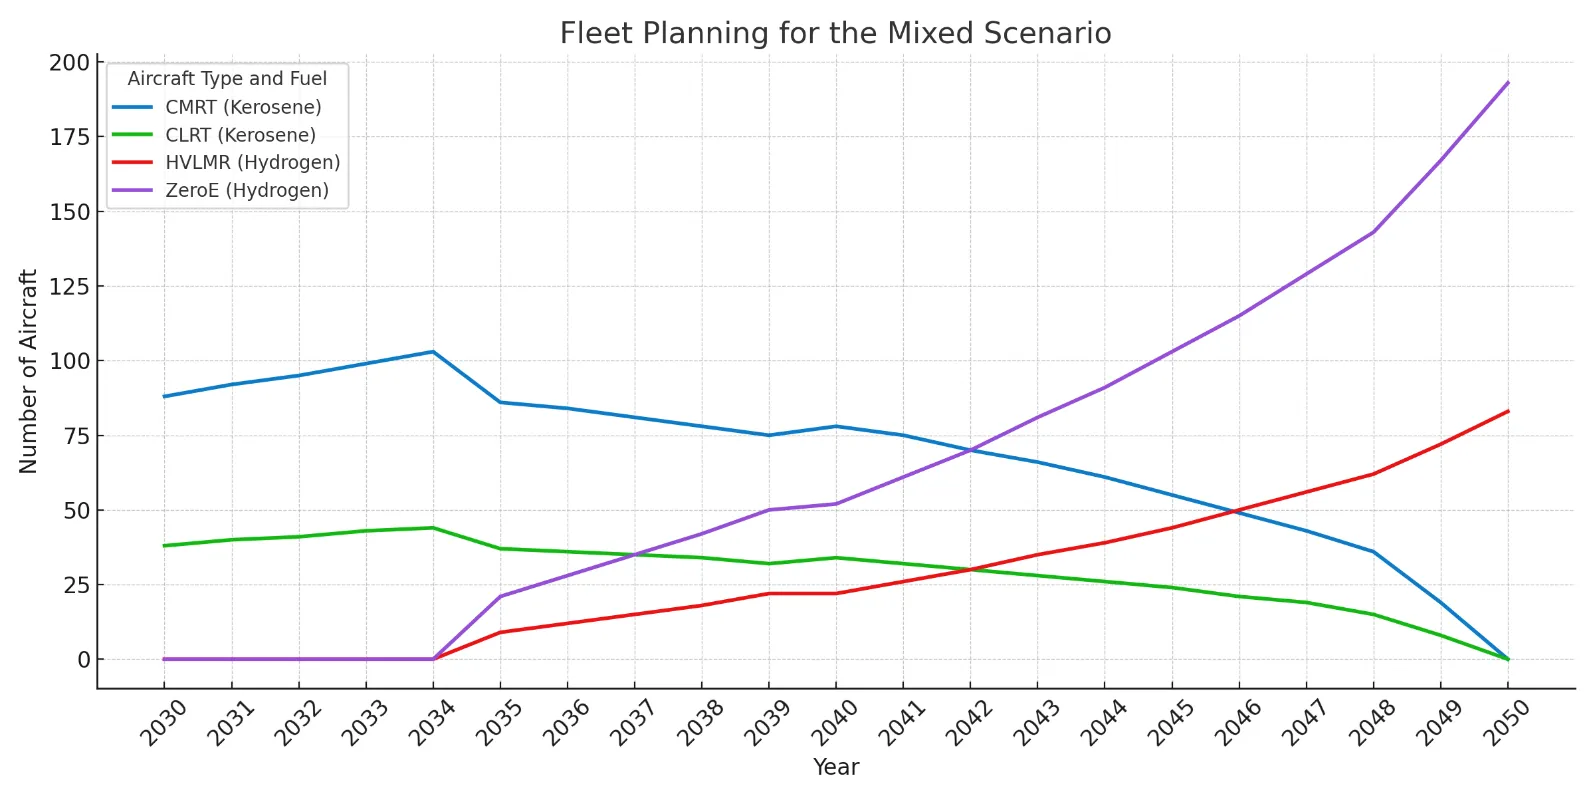
By 2050, the scenario envisions a complete fleet renewal where all kerosene-fueled jets have been retired and the airline operates only hydrogen-powered aircraft. A fleet planning schedule for this mixed-transition scenario is given in Figure$$\,$$5, detailing the number of each aircraft type in service from 2030 through 2050. The fleet evolution is designed such that growth in traffic is met while progressively phasing out fossil-fueled aircraft. Notably, the transition is gradual: between 2035 and 2045, the fleet is mixed, with hydrogen and kerosene aircraft operating. This allows the airline to gain experience with hydrogen technology and for infrastructure to scale up, while still meeting demand. By 2050, the fleet consists entirely of hydrogen models (ZeroE and HVLMR), aligned with the industry’s net-zero 2050 target.
2.5. Simulation Tool (Orion)
The author has employed Orion, an aircraft performance simulation and mission analysis tool developed by Cranfield University, to model the operational performance of each aircraft type on the network routes. Orion has been used in prior studies of alternative aviation fuels (e.g., LNG) to integrate aircraft and engine performance with novel fuel systems [
15]. In our analysis, Orion computes mission fuel burn, flight time, and payload-range capabilities for each route–aircraft pairing. For the conventional aircraft (CMRT, CLRT), the tool uses known performance data and engine models; for the hydrogen aircraft (ZeroE, HVLMR), the authors input estimated parameters based on concept specifications and assumptions (discussed below). The simulation captures how differences in energy density, weight, and aerodynamics affect fuel consumption and range. For instance, the hydrogen planes carry insulated cryogenic tanks, which add weight and occupy volume, potentially reducing usable payload or range. Orion’s outputs per flight (fuel used,
etc.) are aggregated across all flights (routes) in a given year to obtain annual fuel consumption by fuel type (kerosene
vs. hydrogen), total block hours, and other fleet-level metrics.
3. Results
3.1. Fleet Evolution (2030–2050)
The projected fleet transition is visualised in
. The airline begins with 126 aircraft in 2030 (88 CMRT and 38 CLRT). By 2035, the first hydrogen planes will enter service—the authors project 21 ZeroE narrowbodies and 9 HVLMR widebodies in that year, allowing the retirement of about 17 CMRTs and 7 A350s. Thereafter, hydrogen aircraft rapidly expand their share. The crossover point is around the early 2040s: by 2040, roughly half the fleet is hydrogen (e.g., ~60 ZeroE and ~27 HVLMR out of 189 total aircraft), and by 2045, the vast majority of aircraft are hydrogen-fueled. The last CMRT and CLRT are retired by ~2048 in this scenario. The total fleet grows to approximately 300 aircraft in 2050, composed of about 220 ZeroE and 80 HVLMR. This growth (126 to 300 aircraft over 20 years) corresponds to a 4–5% annual fleet increase, aligning with the 4% traffic demand growth assumption (the slightly higher fleet growth is due to the gauge difference when switching from 350-seat A350s to 380-seat HVLMRs and a conservative oversupply of capacity for reliability).
3.1.1. Fleet Composition and Operations
Both the baseline and mixed (hydrogen transition) scenarios are structured to serve identical passenger demand across 85 routes between 2030 and 2050, assuming 4% annual traffic growth. However, the strategies used to meet that demand diverge sharply in terms of aircraft selection, fleet planning, and network operations.
In the baseline scenario, the airline expands its conventional fleet using Airbus CMRT and CLRT aircraft. The narrowbody CMRT fleet grows from 88 aircraft in 2030 to 193 by 2050, while the widebody CLRT fleet expands from 38 to 83 in the same period. This roughly doubles the narrowbody fleet and more than doubles the widebody count, supporting growing medium- and long-haul demand. Aircraft are introduced gradually, averaging 3–6 new CMRTs and 1–3 A350s per year. By 2050, the fleet will have an average mix of older and newer jets, with some aircraft reaching 20 years in service.
The hydrogen transition scenario follows the same trajectory until 2035, when hydrogen-powered aircraft begin entering the fleet. Early models are single-aisle aircraft similar in range and capacity to the CMRT, assumed to be Airbus ZEROe concepts. These aircraft are initially deployed on short- and medium-haul flights within Europe and the Middle East, with operations based on two dedicated hydrogen hubs: London Heathrow (LHR) and Neom Bay Airport (NUM) in Saudi Arabia.
As confidence and infrastructure scale up, the airline gradually increases hydrogen adoption. By the early 2040s, the widebody hydrogen-capable aircraft—referred to here as HVLMR (Hydrogen Very Long-Range Medium-Range) begin replacing planned CLRT deliveries. These are deployed on long-haul routes via a multi-leg hub-based model, rather than direct city-pair connections. By 2045, hydrogen aircraft will constitute the majority of the fleet. The last kerosene aircraft (mainly older CMRTs and A350s) are retired or held in limited reserve.
By 2050, the hydrogen scenario features a fully hydrogen-powered fleet, comprising both ZEROe and HVLMR aircraft. The total fleet size reaches approximately 300 aircraft slightly larger than the baseline to accommodate range constraints and multi-leg routing, which require a higher number of frames to deliver the same seat-kilometers.
Operationally, the hydrogen network is designed around hub-and-spoke routing to mitigate the limited range of early hydrogen aircraft (~2500–3000 km). Virtually all flights either originate from, terminate at, or connect through Heathrow or Neom. Long-haul city pairs are broken into segments. For example, in the hydrogen case, a baseline London–Dubai non-stop becomes London–Neom–Dubai. Flights from Neom to Southeast Asia or Africa follow similar patterns. This routing increases the number of flight legs per itinerary, reduces average stage length, and raises the number of takeoffs and landings, slightly increasing maintenance and crew demand.
Despite the operational complexity, the two-hub design offers strategic refueling, maintenance, and passenger transfer capabilities. Neom is supported by the NEOM Green Hydrogen Company, projected to produce 600 tons of green hydrogen per day by 2026 [
25]. Heathrow is advancing hydrogen infrastructure trials with UK Civil Aviation Authority support [
21]. Concentrating hydrogen operations at these hubs avoids duplicating infrastructure at smaller airports and maximises refueling efficiency.
The shift in fleet composition and operational design has cascading effects on fuel consumption, emissions, and energy demand—topics discussed in the following sections. presents the fleet planning for the mixed scenario to 2050.
. Fleet composition over time under the 4% growth, hydrogen-transition scenario. Each line represents the number of aircraft in service of a specific type. The blue and green lines (CMRT and CLRT, kerosene-fueled) decline steadily and phase out completely by 2050. In contrast, the red and purple lines (HVLMR and ZeroE, hydrogen-fueled) rise consistently, becoming the dominant fleet types. By 2050, the entire fleet operates on hydrogen-powered aircraft.
3.1.2. Fuel Consumption
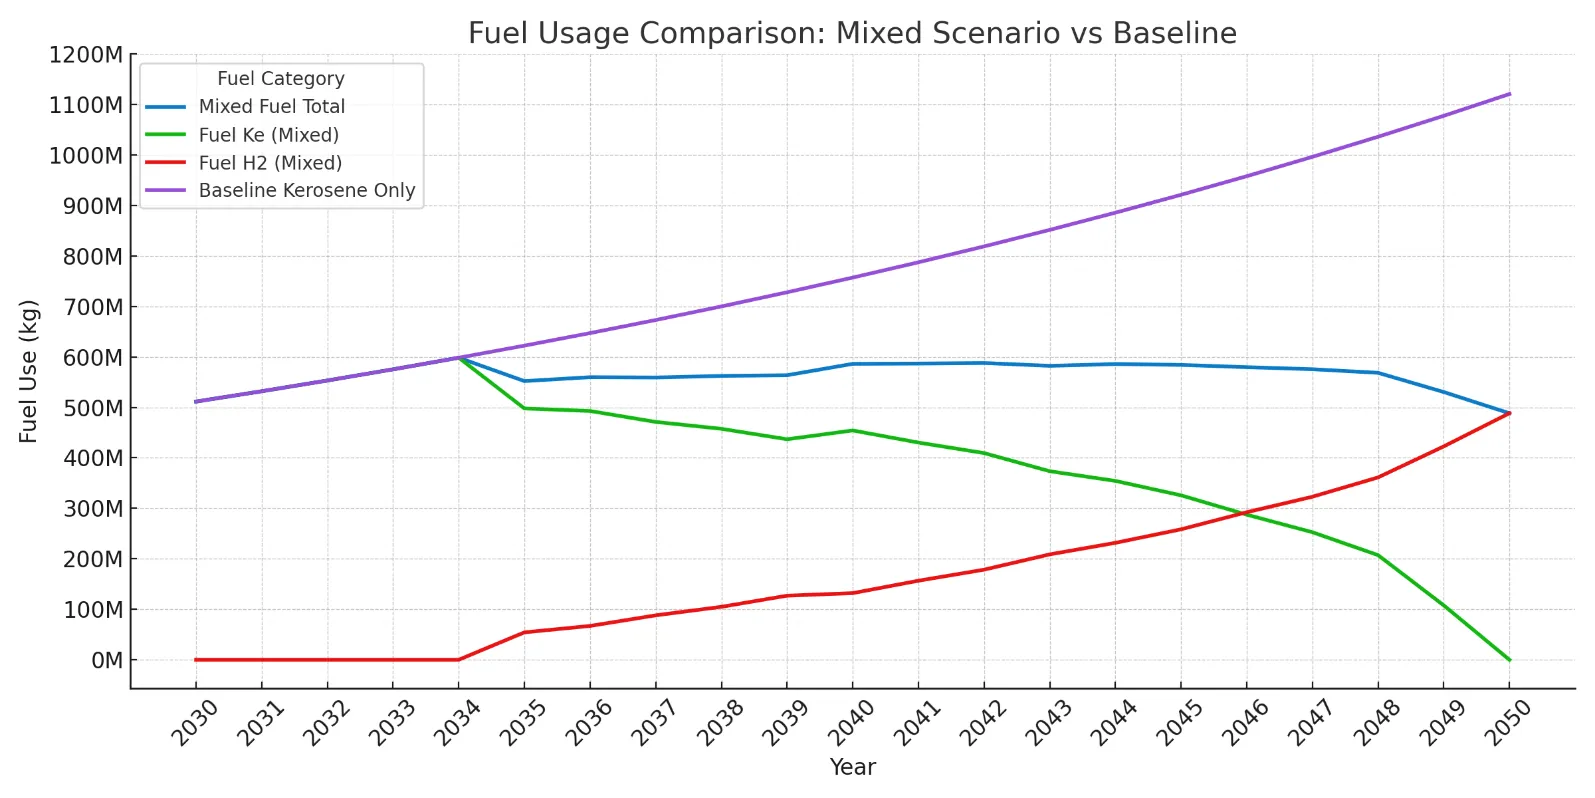
The annual fuel consumption for both scenarios is shown in , measured in millions of kilograms (kg) of fuel per year. The baseline scenario (Purple) sees a steady increase in fuel consumption from 2030 to 2050 as the airline’s operations grow. In 2030, the baseline fuel usage is about 511.5 million kg; by 2050, it reaches approximately 1120.8 million kg per year (more than 2× the 2030 value), reflecting the larger fleet and higher traffic. This growth corresponds to an average annual increase of about 4% in fuel use, consistent with projected air travel growth. The hydrogen transition scenario’s total fuel mass consumption (blue line) follows a very different trajectory. From 2030 up to the mid-2030s, the blue line overlaps with the baseline, since initially there is no hydrogen in use, and both scenarios burn the same kerosene fuel. Once hydrogen aircraft are introduced (starting in 2035), the total fuel mass in the hydrogen scenario starts to diverge downward relative to the baseline. By design, hydrogen has higher energy per unit mass, so replacing some kerosene with hydrogen reduces the mass of fuel required (even if energy demand stays the same). Indeed, the mixed scenario’s fuel mass peaks around 2033–2034 and declines slightly as more hydrogen is used. From 2035 onward, the mixed scenario’s fuel comprises two components: kerosene (Green line in ) and hydrogen (Red line). The Green line (kerosene in the hydrogen scenario) drops sharply after 2035, indicating the displacement of jet fuel by hydrogen. By 2040, kerosene use in the mixed scenario is roughly 454.3 million kg, and it will continue to fall to near zero by 2050 (the Green line approaches the x-axis). Conversely, the Red line (hydrogen fuel mass) rises from 0 in 2034 to 488.4 million kg by 2050. The hydrogen mass overtakes the kerosene mass by the mid-2040s in this scenario. Notably, because hydrogen is much lighter for the same energy, even when hydrogen completely replaces kerosene by 2050, the total fuel mass (blue) remains below the baseline’s fuel mass. In fact, the blue line (mixed total fuel mass) stays relatively flat from the late 2030s onward, even decreasing slightly toward 2050, ending around ~488.4 million kg/year. This is less than half of the baseline’s 2050 fuel mass, showcasing the potential weight saving from switching to a hydrogen energy carrier.
. Annual fuel consumption from 2030 to 2050 under the baseline and mixed hydrogen-transition scenarios (in million kilograms per year). The baseline scenario (purple line) uses only kerosene and shows a steady increase in fuel demand over time. In the mixed scenario, total fuel use (blue line) initially aligns with the baseline but diverges after hydrogen introduction in 2035. Kerosene use (green line) steadily declines to zero by 2050, while hydrogen consumption (red line) increases correspondingly. Due to hydrogen’s higher energy content per unit mass, the total fuel mass in the mixed scenario remains significantly lower than in the baseline by 2050.
summarises the cumulative fuel usage over the entire 2030–2050 period to quantify the overall fuel consumption differences. The baseline scenario consumes approximately 16,352.8 million kg of kerosene in total from 2030 through 2050. In contrast, the hydrogen scenario consumes about 11,720.7 million kg of fuel in total, broken down into 8256.5 million kg of kerosene and 3464.2 million kg of hydrogen. Thus, the mixed scenario uses about 28% less total mass of fuel than the baseline (11,721
vs. 16,353 million kg). The kerosene requirement is cut by roughly 50% (as hydrogen gradually replaces half the fuel by energy), but the new hydrogen fuel mass partially offsets this. Importantly, reducing fuel mass has operational benefits: lifting less fuel weight can reduce aircraft gross weights, potentially improving efficiency and reducing payload penalties. It’s also critical for logistics the airline would need to uplift billions of kilograms less fuel over two decades, easing some supply chain burdens (though those shift to supplying hydrogen). By 2050, the baseline scenario’s yearly fuel consumption is more than twice that of the hydrogen scenario in mass terms, a stark difference attributable to the lighter hydrogen fuel.
.
Cumulative Fuel Consumption (2030–2050).
| Scenario |
Kerosene Fuel (Million kg) |
Hydrogen Fuel (Million kg) |
Total Fuel (Million kg) |
| Baseline (kerosene-only) |
16,352.8 |
0 |
16,352.8 |
| Hydrogen Transition |
8256.5 |
3464.2 |
11,720.7 |
3.1.3. Energy Use
While the mass of fuel differs greatly, it is also instructive to compare the energy content of the fuel burned, since that relates to the work done (and potentially the emissions, if any).
illustrates the annual energy use in each scenario, measured in megajoules (MJ). The baseline scenario’s energy consumption (Purple line in
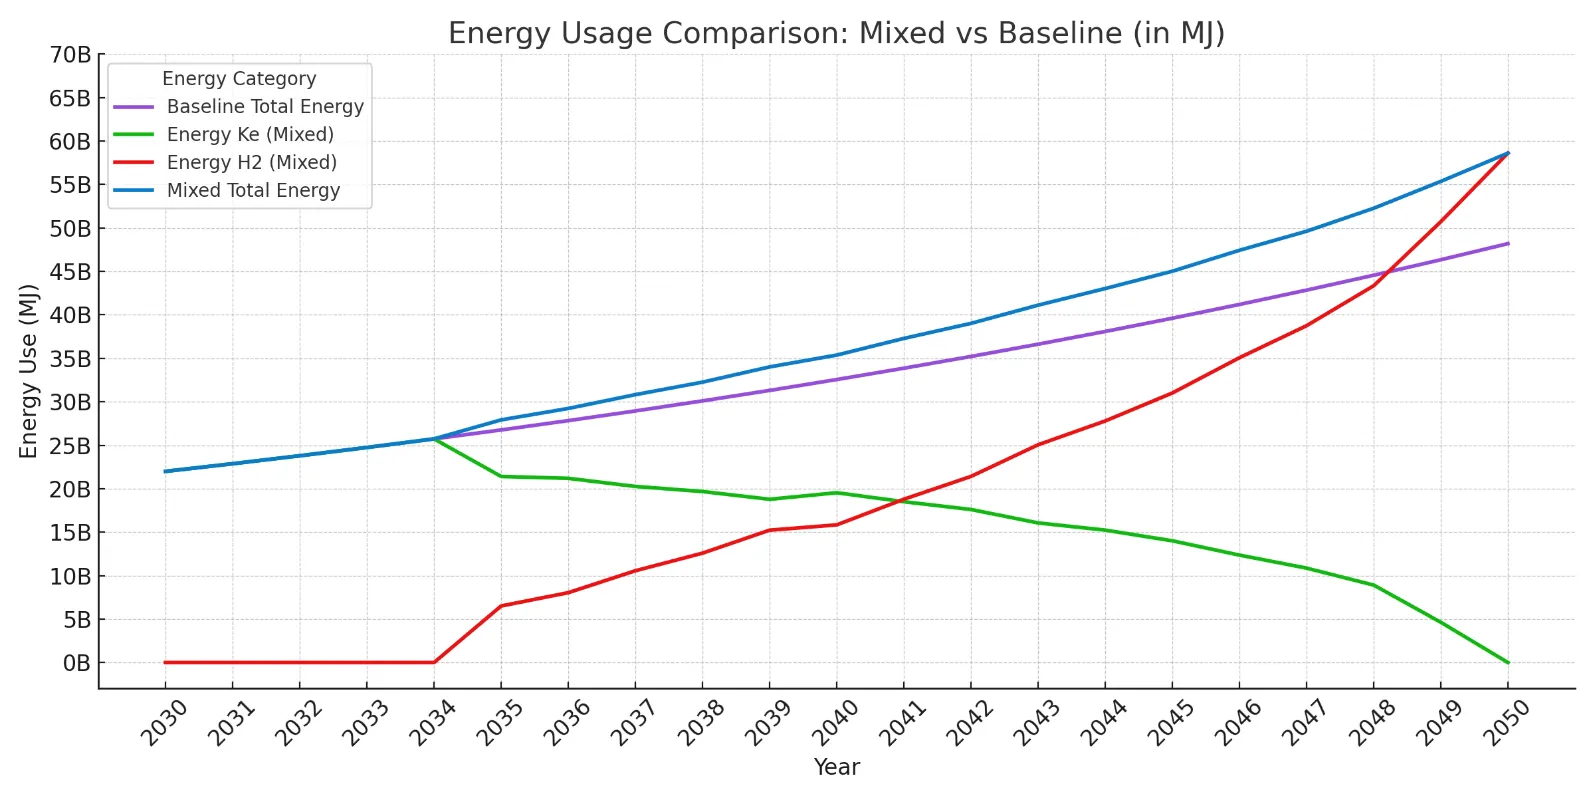
) grows over time, reflecting more flying. By 2050, the baseline reaches around 48,194,338 MJ, up from 21,995,267 MJ in 2030. Despite using less fuel mass, the hydrogen scenario’s total energy demand (Blue line) is consistently higher than the baseline after the mid-2030s. This indicates that the airline expends more energy overall under the hydrogen network. There are a few reasons: the hydrogen scenario involves longer total flight distances (due to routing detours via hubs), and possibly less efficient operations (smaller aircraft, more climbs and descents). Also, hydrogen aircraft might have slightly lower efficiency or need extra energy for tank cooling, though those are secondary. The green line in
shows the energy provided by kerosene in the mixed scenario, and it falls steadily to 0 by 2050 (mirroring the decline in the Green line of
, but converted to energy). The Red line represents the energy from hydrogen in the mixed scenario, rising from 0 to 58,609,883 MJ by 2050. By 2050, the hydrogen scenario’s total energy (Blue) exceeds the baseline’s energy (Purple). In numerical terms, over the entire period 2030–2050:
. Annual energy use under baseline and hydrogen-transition scenarios (in megajoules). The baseline scenario (purple line) shows a steady rise in total energy demand. In the mixed scenario, kerosene (green line) energy declines sharply as hydrogen aircraft are introduced, while hydrogen energy use (red line) rises in parallel. The total energy use in the mixed scenario (blue line) overtakes the baseline by 2050, reflecting the additional energy required to support hydrogen aircraft’s lower efficiency and shorter range. Cumulatively from 2030 to 2050, the mixed scenario requires approximately 9.6% more energy than the baseline.
This represents a 9.6% increase in cumulative energy use in the hydrogen scenario. Essentially, the airline had to burn more total energy to serve the same transport work, due to the network changes and potentially less favorable airplane performance. While undesirable from an efficiency standpoint, this trade-off is unsurprising—carrying fuel to alternate hubs and making additional takeoff/climb cycles can raise energy needs. It highlights that a hydrogen transition may demand more energy input overall, even as it reduces carbon emissions. In the future, improved hydrogen aircraft designs (e.g., optimised aerodynamics to offset tank volume, or more efficient propulsion cycles) could narrow this gap.
From an annual perspective, the two scenarios use nearly identical energy until the mid-2030s, after which the baseline continues a smoother climb. The mixed scenario’s energy curve shows a dip around 2035 when hydrogen is first introduced (since total flying might be curtailed slightly during the transition). Then, there will be a sharper rise as more, smaller hydrogen flights are added. By 2040, both scenarios use roughly similar annual energy (~34,012,419 MJ). Still, beyond 2040, the baseline grows more slowly, whereas the hydrogen scenario accelerates energy use due to intensive operations via hubs. By the late 2040s, as shows, the gap widens—with the brown line peaking at ~58,609,883 MJ, while the baseline stabilises around 48,194,338 MJ. A summary of the energy use for the two scenarios is presented in .
.
Cumulative Fuel Energy Usage (2030–2050).
| Scenario |
Energy from Kerosene (MJ) |
Energy from Hydrogen (MJ) |
Total Energy (MJ) |
| Baseline (kerosene-only) |
703,171,122 |
0 |
703,171,122 |
| Hydrogen Transition |
355,030,537 |
415,699,412 |
770,729,949 |
3.1.4. Aircraft Purchase Costs
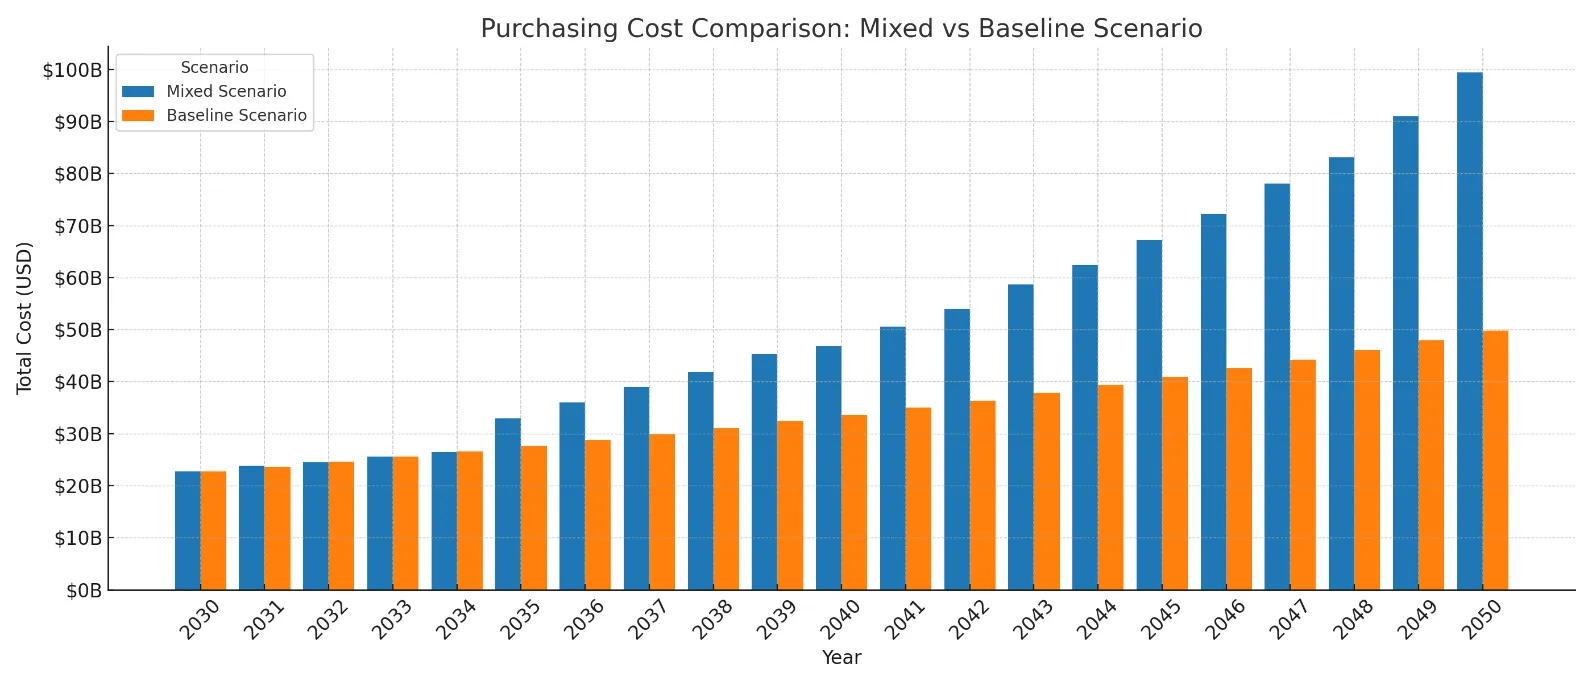
The capital investment in new aircraft over 2030–2050 differs significantly between the two scenarios. The following cost analysis is based on actual fleet planning and unit price assumptions used in this study.As shown in
, In the baseline scenario, the airline expands its fleet with kerosene-fueled aircraft: CMRT priced at $120 million and CLRT at $320 million. Over the period, the fleet grows steadily, reaching 193 CMRTs and 83 CLRTs by 2050. Based on the annual purchasing quantities and unit costs, the estimated cost of new aircraft purchases in the baseline scenario is $49.78 billion. In the mixed hydrogen scenario, the fleet evolves differently. 2030–2034, conventional jets (CMRT and CLRT) are still added. Starting in 2035, hydrogen-powered aircraft are introduced: ZEROe (at $240 million each) and HVLMR (at $640 million each). These gradually replace kerosene aircraft. By 2050, the mixed fleet consists entirely of hydrogen-powered aircraft. According to the fleet count and pricing assumptions, the total estimated aircraft procurement cost in the mixed scenario is $99.44 billion, reflecting the high upfront investment in hydrogen technology and additional airframes required. These values are derived from actual annual fleet data and purchasing schedules for each aircraft type, as shown in the figures below. The mixed scenario’s cost is roughly double the baseline’s, primarily due to the high price of early hydrogen aircraft and greater fleet turnover.
presents the Total Aircraft Procurement Cost (2030–2050).
. Total Aircraft Purchase Cost for Both Scenarios (2030–2050).
.
Total Aircraft Procurement Cost (2030–2050).
| Scenario |
Total Aircraft Purchase Cost (USD) |
| Baseline (kerosene-only) |
$49.78 billion |
| Hydrogen Transition (mixed) |
$99.44 billion |
From an operational standpoint, the airline in the hydrogen scenario makes a full transition to new-generation aircraft, while the baseline continues expanding with current models. The higher capital expenditure reflects a front-loaded investment typical in decarbonisation efforts. However, by 2050, the baseline’s fleet would be older, potentially requiring major renewal shortly thereafter, while the mixed scenario would have already modernised its entire fleet with zero-emission aircraft.
3.1.5. Fuel Costs
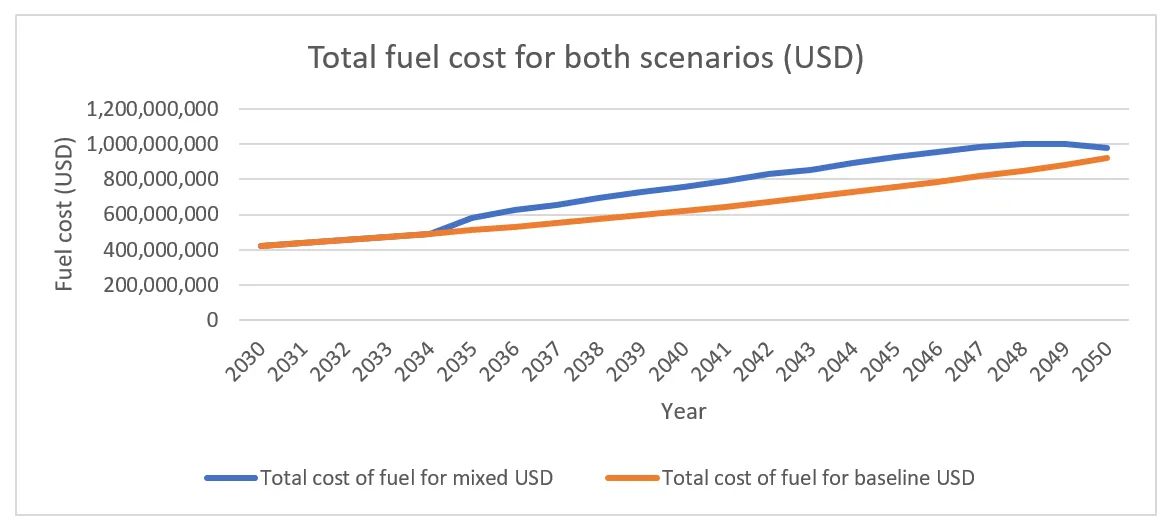
Fuel Costs: The cost of fuel over time shows a divergent pattern due to both volumes of fuel and price differences. In the baseline scenario, annual fuel expenditure rises proportionally to fuel use. In 2030, fuel cost is about $419 million for the airline (at $0.82/kg for jet fuel). By 2050, annual fuel costs in the baseline reach $919 million. Cumulatively, the baseline scenario spends about $13.41 billion on kerosene from 2030 to 2050. Despite using less fuel mass, the hydrogen transition scenario incurs higher fuel costs due to hydrogen’s price premium. Fuel costs are identical for the first few years (since only kerosene is used). As hydrogen usage begins around 2035, the total fuel bill in the mixed scenario starts to exceed the baseline. For example, in 2040, the mixed scenario’s fuel cost is approximately $757 million, compared to $597 million in the baseline, even though less fuel is burned overall. This is due to the higher cost of hydrogen ($2.00/kg), which offsets the weight savings.
By 2050, the hydrogen scenario’s fuel cost rises to $976 million, slightly higher than the baseline at $919 million. Over the full 2030–2050 period, the mixed scenario accumulates about $15.53 billion in fuel expenditures, compared to $13.41 billion in the baseline a difference of ~$2.1 billion, or ~16% more. This result hinges on price assumptions: kerosene at $0.82/kg (converted from $820/ton), and hydrogen at a flat $2.00/kg. If green hydrogen production costs drop further, the gap could narrow. Conversely, future carbon pricing could make kerosene more expensive, potentially reversing the cost advantage. Both and show the fuel cost for the two scenarios.
. Total Fuel Cost for Baseline <i>vs.</i> Mixed Scenario (2030–2050).
.
Total Fuel Cost Summary (2030–2050).
| Scenario |
Total Fuel Cost (USD) |
| Baseline (kerosene-only) |
$13.41 billion |
| Hydrogen Transition (mixed) |
$15.53 billion |
In summary, the total cost of fuel plus the total cost of new aircraft in each scenario shows a clear trade-off: the baseline is cheaper in both respects. Still, it carries a huge carbon emission burden, whereas the hydrogen scenario achieves sustainability goals at a calculable financial cost. The combined extra cost of the hydrogen scenario in our model (fuel + planes) is on the order of $4.8 billion over 20 years (roughly 12–15% higher cumulative cost than baseline). This is a significant investment, but it yields very large emissions reductions and aligns the airline with long-term climate targets, potentially avoiding future carbon pricing costs or penalties.
In the next section, the authors discuss these implications, including environmental benefits and the strategic importance of the chosen hub approach.
3.1.6. Direct Operating Costs (DOC) and Comparative Results
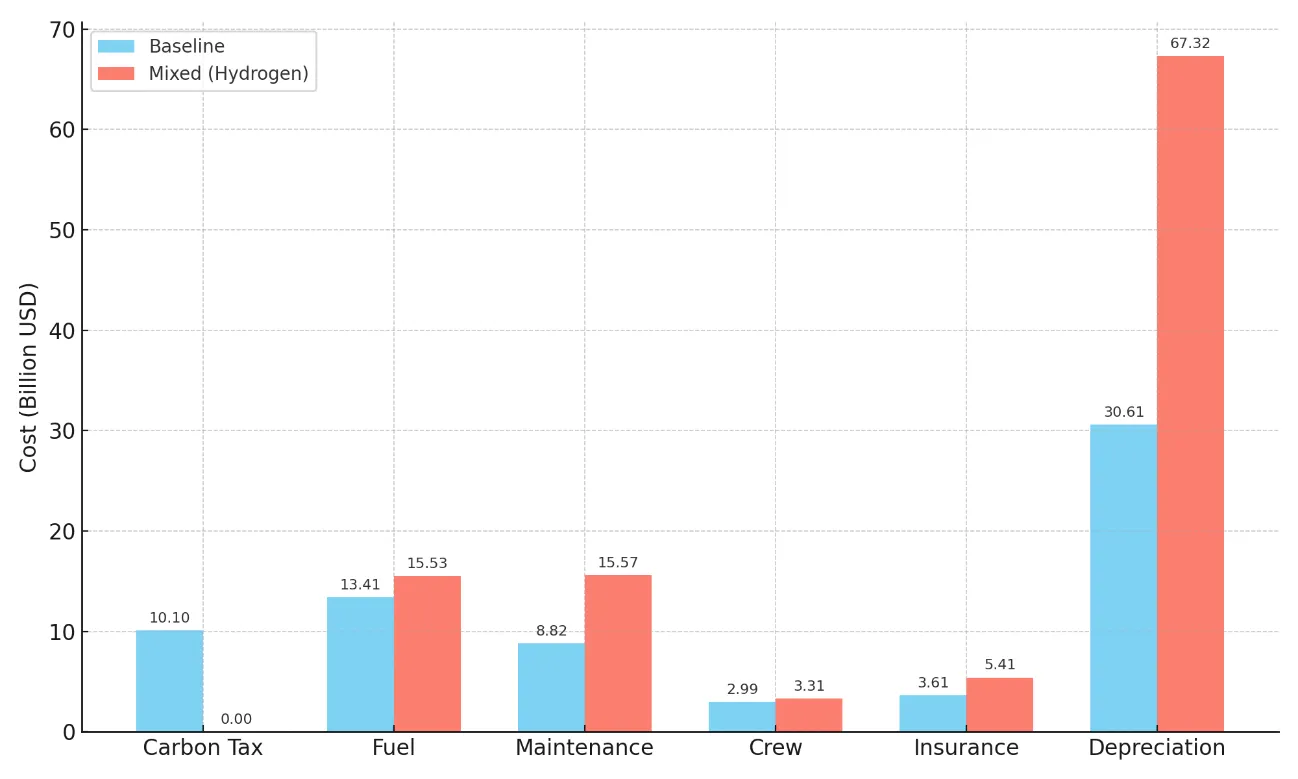
In addition to capital and fuel costs, Direct Operating Costs (DOC) are critical to airline economics. These include fuel, maintenance, crew, insurance, depreciation, and carbon taxes in the baseline scenario. In the baseline scenario, total DOC over the 2030–2050 period is estimated at $69.22 billion, while in the mixed hydrogen scenario, it rises to $102.55 billion, marking a 48% increase.
The main drivers behind the DOC difference include higher aircraft acquisition costs and their impact on depreciation and insurance. Aircraft in both scenarios are assumed to have an economic life of 20 years and a residual value of 10%. Depreciation, which accounts for the decline in aircraft value over time, is significantly greater in the mixed scenario ($67.32B) due to the adoption of more expensive hydrogen aircraft and faster fleet turnover, compared to $30.61B in the baseline. Insurance costs, calculated as 0.5% of the aircraft’s purchase value per year, also reflect this disparity. Hydrogen aircraft’s higher upfront costs lead to increased insurance expenses in the mixed case ($5.41B) relative to the baseline ($3.61B). Crew costs rise slightly in the hydrogen case, reaching $3.31B versus $2.99B, partly due to operational differences like shorter ranges and increased rotations. Each aircraft is assumed to complete 700 cycles per year, meaning that network structure and fleet size impact staffing levels. Maintenance costs nearly double from $8.82B in the baseline to $15.57B in the mixed case. This accounts for the complexity and infancy of hydrogen systems, additional infrastructure demands, and the anticipated higher cost of servicing early-generation hydrogen aircraft. Though lighter in weight for hydrogen, fuel costs are higher in dollar terms $15.53B versus $13.41B due to hydrogen’s elevated price per kilogram. However, the baseline scenario incurs an added $10.10B in carbon tax, based on a levy of $0.50/litre of kerosene, a cost entirely absent in the hydrogen scenario.
Together, and show that while hydrogen brings increased operating costs in today’s financial terms, it also reduces environmental externalities and avoids penalties associated with carbon. Over time, as hydrogen technologies mature and costs fall, the DOC premium could diminish, making the case for sustainable aviation even stronger.
. Cumulative Direct Operating Costs (2030–2050) for Baseline and Mixed Scenarios.
.
Summary of Direct Operating Costs (2030–2050).
| Scenario |
Total DOC (USD) |
Carbon Tax |
Fuel |
Maintenance |
Crew |
Insurance |
Depreciation |
| Baseline |
$69.22B |
$10.10B |
$13.41B |
$8.82B |
$2.99B |
$3.61B |
$30.61B |
| Mixed |
$102.55B |
$0 |
$15.53B |
$15.57B |
$3.31B |
$5.41B |
$67.32B |
3.1.7. Discussion and Interpretation
The results reveal clear cost differentials between the baseline and hydrogen transition scenarios. The mixed scenario incurs a 48% higher total DOC over the 20 years. This is largely due to higher capital costs, increased maintenance, and associated insurance and depreciation.
Depreciation, in particular, is significantly higher in the hydrogen scenario. Aircraft economic life is assumed to be 20 years, with a residual value of 10% of the acquisition cost. The hydrogen transition demands more frequent aircraft turnover and higher upfront costs (especially with the HVLMR fleet), thus pushing depreciation up to $67.32B, more than double the baseline’s $30.61B.
Insurance costs, calculated as 0.5% of aircraft acquisition value per year, also scale with total aircraft investment. With hydrogen aircraft being more expensive and increasing in number over the years, total insurance expenditure in the mixed scenario reaches $5.41B, compared to $3.61B in the baseline.
Crew costs grow slightly in the hydrogen scenario due to potential increases in flight cycles, especially because of routing detours and range limitations of early hydrogen jets. With each aircraft assumed to operate 700 flight cycles per year, the hydrogen network likely demands more aircraft rotations, hence a slight increase in crew cost from $2.99B to $3.31B.
Maintenance costs nearly double in the hydrogen transition scenario. This reflects uncertainty around hydrogen propulsion systems, new ground infrastructure, and unproven long-term reliability. Maintenance cost jumps from $8.82B in the baseline to $15.57B in the mixed case.
Finally, the carbon tax which applies only to the baseline scenario adds a substantial $10.10B over the period. This tax, calculated at $0.50/litre of kerosene, will become more burdensome as policies tighten.
Despite the higher DOC, the mixed scenario aligns with climate goals and regulatory trends, offering long-term strategic value. If green hydrogen becomes more affordable and technologies mature, many of these costs (especially maintenance and depreciation) are expected to fall, improving the competitiveness of hydrogen aviation.
3.1.8. Emissions and Environmental Impact
One of the most significant benefits of transitioning to hydrogen fuel in aviation is the potential to dramatically reduce greenhouse gas (GHG) emissions. In the baseline scenario, emissions are directly proportional to the volume of kerosene burned. Using the standard emission factor of 3.15 kg of CO
2 per kg of jet fuel [
26], the cumulative kerosene consumption of 16.35 billion kg results in approximately 51.5 billion kg of CO
2 released into the atmosphere over the 2030–2050 period.
In the hydrogen transition scenario, CO
2 emissions are significantly reduced. While this scenario still consumes 8.26 billion kg of kerosene, primarily in the earlier years, the remaining fuel is green hydrogen assumed to be produced via electrolysis powered by renewable energy and thus carbon-free at the point of use. This reduces total CO
2 emissions in the mixed scenario to approximately 26.0 billion kg, cutting emissions nearly in half compared to the baseline.
Moreover, the hydrogen scenario eliminates the need for carbon offset payments or carbon taxes associated with jet fuel combustion. As policies tighten globally, the absence of a carbon tax in the hydrogen case becomes an important cost and regulatory advantage.
From a broader climate perspective, hydrogen combustion also emits water vapour and NO
x, contributing to non-CO
2 climate effects such as contrail formation and ozone production. However, studies suggest that optimised hydrogen engines (e.g., using micromix burners) could reduce NO
x emissions by 50–90% relative to kerosene engines [
11]. Additionally, the absence of carbon-based soot in hydrogen combustion may result in less persistent contrails [
9], although research is ongoing in this area.
Another operational advantage is the ability to restructure flight networks around hydrogen-capable hub airports, such as Neom Bay (Saudi Arabia) and London Heathrow, where dedicated hydrogen infrastructure is planned. These hubs support the refuelling and handling of hydrogen aircraft and reduce the risk of en-route range limitations. By routing long-distance flights through these two major nodes, the airline ensures no single segment exceeds the approximate 2500–3000 km range of early hydrogen aircraft [
22]. In total, the hydrogen scenario offers a 49% reduction in CO
2 emissions, avoids more than 25 billion kg of CO
2, and positions the airline on a credible path to achieving net-zero emissions by 2050, aligned with global aviation targets and national sustainability roadmaps [
2,
27].
3.1.9. Energy and Infrastructure Considerations
The transition to hydrogen-powered aviation brings with it not only a change in energy carriers but also a substantial shift in infrastructure and energy requirements. This study tracked energy use across both the baseline (kerosene-only) and mixed (hydrogen transition) scenarios from 2030 to 2050. While hydrogen aircraft reduce the mass of fuel required—due to hydrogen’s higher specific energy (120 MJ/kg
vs. 43 MJ/kg for kerosene) they do not necessarily reduce the total energy demand.
Our results show that the baseline scenario consumes approximately 703 terajoules (TJ) of energy over the 20 years, all from kerosene. The mixed scenario requires approximately 771 TJ, representing a 9.6% increase in total energy use. This is primarily due to longer detour routes (to accommodate hydrogen refuelling at hubs), increased aircraft cycles, and slightly reduced propulsion efficiency in early hydrogen aircraft. These outcomes highlight that while hydrogen provides environmental advantages, it requires more total energy input for the same transport work an important consideration in airline operations and sustainability planning.
To support this energy shift, the model assumes the creation of two major hydrogen refuelling hubs at London Heathrow Airport (LHR) and Neom Bay Airport (NUM) in Saudi Arabia. These hubs were selected based on geography, policy alignment, and existing infrastructure plans. Heathrow has been identified as a likely early adopter of hydrogen aviation, participating in research and planning for ground-based hydrogen storage and refuelling systems [
21]. Its location near offshore wind capacity also supports large-scale green hydrogen generation and import potential.
Neom Bay Airport plays an even more strategic role. As part of Saudi Arabia’s Vision 2030 strategy, the city of NEOM is designed as a global innovation hub. It includes the development of the NEOM Green Hydrogen Company (NGHC)—a joint venture by ACWA Power, Air Products, and NEOM. This facility is expected to become the world’s largest green hydrogen plant, with a planned production capacity of 600 tons per day by 2026 [
25]. Locating one of the hubs here aligns the airline with a long-term, local hydrogen supply and reinforces regional leadership in clean aviation.
All long-haul operations in the hydrogen scenario are routed through these two hubs to remain within the range constraints of early hydrogen aircraft, estimated at 2500–3000 km per segment. For example, a flight from Europe to Asia might stop in NEOM, while a journey from the Middle East to North America may route through London. This network reconfiguration ensures that no single leg exceeds the feasible range of the hydrogen aircraft while maintaining overall connectivity and fleet utilisation.
From a logistics perspective, hydrogen aircraft require additional infrastructure such as cryogenic fuel storage, liquefaction facilities, and specialised ground handling. These capital investments are not directly modelled in the DOC but are considered in the scenario’s broader implications. The dual-hub strategy minimises redundant infrastructure across all destinations, focusing capital on high-utilisation points where economies of scale can be leveraged.
Despite the infrastructure costs and additional energy demands, the hydrogen scenario offers transformative environmental and strategic benefits. By 2050, the fleet will become fully hydrogen-powered, eliminating direct CO
2 emissions from flight operations. With infrastructure anchored in hubs like Heathrow and Neom each backed by policy, financial, and energy commitments the transition appears feasible and highly synergistic with national and industry decarbonisation goals.
3.1.10. Economic and Policy Implications
The cost differential observed in this analysis highlights the financial challenge and strategic opportunity of transitioning aviation to hydrogen fuel. Over the 2030–2050 period, the mixed (hydrogen transition) scenario incurred approximately $4.8 billion more in combined fleet acquisition and fuel costs than the baseline. While this represents a significant investment, it corresponds to nearly 50% fewer CO
2 emissions and positions the airline for long-term compliance with climate regulations.
From a policy standpoint, carbon pricing can strongly influence this cost gap. The baseline scenario burns over 16.35 billion kg of kerosene, producing an estimated 51.5 million tonnes of CO
2. A carbon price of $100 per tonne a figure aligned with the EU ETS and IEA forecasts [
6] would add $5.15 billion to the baseline’s total cost. If such a policy were implemented, the hydrogen scenario would suddenly become more economically favourable, or even cheaper, than the conventional approach. While the authors did not explicitly model carbon pricing in our cost calculations, this qualitative overlay illustrates how policy mechanisms can accelerate clean aviation adoption.
Incentives and public investments are also essential. Governments may need to subsidise hydrogen aircraft development or fund initial infrastructure to reduce the early adopter burden on airlines. The UK, for example, has launched initiatives such as Project 601, aiming to enable hydrogen operations at London Heathrow Airport by 2028, with the Civil Aviation Authority supporting early trials and regulatory frameworks [
28]. Such public-private collaboration can de-risk deployment and promote learning curves.
However, the hydrogen scenario carries technological and operational risks. It assumes that viable hydrogen airliners such as Airbus’s ZEROe or future long-range models like HVLMR become commercially available in the mid-2030s. If timelines slip to 2040 or beyond, airlines may need to continue purchasing kerosene aircraft and face costly early retirements later in the transition. The assumed smooth rollout in our simulation is contingent on progress in hydrogen propulsion R&D, certification standards, and supply chain readiness [
9].
Operationally, the transition also creates complexity during intermediate years. For example, by 2040, the fleet will be roughly half hydrogen and half kerosene. This requires maintaining dual fueling infrastructure at key airports like Heathrow and Neom, training personnel in both systems and ensuring compatible logistics. Although our model assumes both fuels are available during transition, this duality imposes costs that are not fully captured in DOC but are acknowledged as real.
Despite these challenges, the hydrogen scenario may offer a competitive edge. Airlines operating zero-emission flights could benefit from green branding, regulatory access (e.g., carbon-neutral corridors), and even market share if passengers or governments begin to prioritise sustainable carriers. Conversely, by 2050, airlines in the baseline scenario would likely face mounting regulatory and reputational risks. For example, the UK’s legally binding net-zero law for 2050 could penalise or constrain carriers that fail to decarbonise [
29].
Regarding global network strategy, the two-hub model proposed here using Neom Bay and London Heathrow as hydrogen refuelling nodes demonstrates a scalable approach. If replicated by other carriers, it could evolve into a multi-hub global hydrogen network, with airports like Dubai, Singapore, or Paris joining. This model reinforces that a clean energy transition in aviation is not merely a technical upgrade; it is also a redefinition of route structure, base strategy, and infrastructure planning.
Lastly, the geopolitical implications are not trivial. Countries investing early in hydrogen, like Saudi Arabia with the NEOM project, may attract new air traffic, economic growth, and technological leadership. Neom Bay could emerge as a necessary waypoint for transcontinental hydrogen flights, shifting the competitive landscape of global aviation. Likewise, Heathrow’s role as a regulatory sandbox and hydrogen pioneer may help secure its status as a leading intercontinental hub in the net-zero era.
4. Conclusions
This study has presented a detailed simulation and comparative analysis of two strategic pathways for a commercial airline operating between 2030 and 2050: continuing with kerosene-fueled aircraft versus transitioning to hydrogen propulsion under a structured, hub-based network. The results underscore the fundamental trade-off between maintaining low operational costs and achieving substantial environmental benefits.
In the baseline scenario, the airline relies on continued procurement of CMRT and CLRT aircraft, powered by conventional jet fuel. Over the 20-year horizon, this approach leads to approximately 16.35 billion kilograms of kerosene consumption and more than 51.5 million tonnes of CO
2 emissions, assuming an emission factor of 3.15 kg CO
2 per kg of fuel [
1]. While this scenario offers the lowest total capital and operating cost about $119 billion across fleet, fuel, and DOC it locks the airline into increasing exposure to carbon taxes, reputational risks, and future regulatory constraints.
Conversely, the hydrogen transition scenario demonstrates that a near-complete decarbonisation of aviation operations is achievable by 2050 with realistic assumptions. By introducing hydrogen aircraft (ZEROe for single-aisle and HVLMR for widebody), reconfiguring the route network around two major hydrogen hubs London Heathrow and Neom Bay, and phasing out kerosene aircraft after 2035, the airline reduces emissions by nearly 49% while maintaining traffic growth and network coverage. By 2050, the airline will operate an entirely hydrogen-powered fleet. However, this scenario comes at an estimated $18–20 billion higher cumulative cost, driven by aircraft acquisition, maintenance, and infrastructure complexity. It also requires 9.6% more total energy, as hydrogen operations are less energy-efficient during early phases and involve longer routing via hubs.
Importantly, the analysis shows that policy instruments could change the financial calculus. A carbon price of $100/tonne CO
2 which aligns with long-term IEA forecasts would add over $5 billion in external costs to the baseline scenario, effectively closing much of the cost gap between the two pathways [
6]. Moreover, regulatory support such as airport infrastructure investments, hydrogen fuel subsidies, or early deployment incentives (as seen in the UK’s Hydrogen Aviation Challenge or NEOM’s NGHC facility) could further tip the balance.
The role of hydrogen hubs is especially central. Heathrow is advancing plans to enable hydrogen operations by 2028 [
28]. NEOM is investing over $8 billion in the world’s largest green hydrogen production facility, capable of generating 600 tonnes per day by 2026 [
25]. These locations are not just technical enablers but also strategic assets creating a scalable model for global hydrogen aviation corridors.
The implications of this study extend across the aviation value chain. Airlines can use these insights to plan early fleet diversification strategies and pilot hydrogen routes. Airports and governments can identify critical nodes for infrastructure investment. Aircraft manufacturers gain confirmation that hydrogen aircraft can meet real-world network needs under credible demand growth. Meanwhile, policy leaders are reminded that decarbonising aviation is technically feasible and economically within reach, especially with carbon pricing and coordinated action.
In conclusion, while the hydrogen transition demands upfront investment, network adaptation, and technology risk, it offers transformative environmental benefits. The pathway to a net-zero airline by 2050 is neither simple nor cheap, but achievable. The 2030s will be the critical decade for demonstration and deployment; the 2040s, for scaling. By 2050, the analysis suggests that the era of kerosene-dominant fleets could be over, replaced by a new generation of clean, hydrogen-powered aviation.
Author Contributions
Conceptualization, T.A.A. and P.P.; Methodology, T.A.A. and P.P.; Software, T.A.A. and E.P.; Validation, T.A.A., B.M.A. and P.P.; Formal Analysis, T.A.A., B.M.A. and P.P.; Investigation, T.A.A., B.M.A. and P.P. Resources, T.A.A., B.M.A., E.P. and P.P. Data Curation, T.A.A., B.M.A., E.P. and P.P. Writing Original Draft Preparation, T.A.A. Writing Review & Editing, T.A.A., E.P. and P.P.; Visualization, T.A.A., B.M.A.; Supervision, P.P. and E.P. Project Administration, T.A.A., B.M.A.
Ethics Statement
Not applicable.
Informed Consent Statement
Not applicable.
Data Availability Statement
The original contributions presented in this study are included in the article. Further inquiries can be directed to the corresponding authors.
Funding
This research received no external funding.
Declaration of Competing Interest
The authors declare no conflicts of interest.
Nomenclature Table
| Term/Abbreviation |
Definition |
| TERA |
Technoeconomic Environmental Risk Analysis |
| ORION |
Aircraft performance simulation tool developed by Cranfield University |
| TURBOMATCH |
Gas turbine engine performance simulator developed by Cranfield University |
| RPK |
Revenue Passenger Kilometer—one paying passenger transported one kilometer |
| ASK |
Available Seat Kilometer—one seat available for sale flown one kilometer |
| DOC |
Direct Operating Cost—includes fuel, maintenance, crew, insurance, and depreciation |
| CMRT |
Conventional Medium Range Transport (equivalent to Airbus A321neo) |
| CLRT |
Conventional Long-Range Transport (equivalent to Airbus A350-900) |
| HVLMR |
Hydrogen Very Large Aircraft Medium Range Transport—conceptual hydrogen aircraft for long-haul missions |
| ZeroE |
Conceptual hydrogen-powered single-aisle aircraft by Airbus for medium-range applications |
| CO2 |
Carbon dioxide—a greenhouse gas emitted from kerosene fuel combustion |
| SAF |
Sustainable Aviation Fuel |
| GHG |
Greenhouse Gases |
References
-
1.
ICAO. ICAO Environmental Report 2022: Innovation for a Green Transition. Montreal, QC, Canada: ICAO; 2022. Available online: https://www.icao.int/environmental-protection/Pages/envrep2022.aspx (accessed on 1 June 2025).
-
2.
International Air Transport Association (IATA). Fly Net Zero: Delivering the Aviation Sector’s 2050 Net-Zero Commitment. 2021. Available online: https://www.iata.org/en/programs/environment/fly-net-zero/ (accessed on 1 June 2025).
-
3.
Energy Connects—Bloomberg News. UK Bets on Unproven Tech to Limit Heathrow’s Climate Impact. 2025. Available online: https://www.energyconnects.com/news/renewables/2025/january/uk-bets-on-unproven-tech-to-limit-heathrow-s-climate-impact/ (accessed on 1 June 2025).
-
4.
Mourouzidis C, Singh G, Sun X, Huete J, Nalianda D, Nikolaidis T, et al. Abating CO₂ and non-CO₂ emissions with hydrogen propulsion.
Aeronaut. J. 2024,
128, 1576–1593. doi:10.1017/aer.2024.20.
[Google Scholar]
-
5.
Lecca T, News EE. Hydrogen-Powered Airplanes Face 5 Big Challenges. Scientific American. 4 May 2024. Available online: https://www.scientificamerican.com/article/hydrogen-powered-airplanes-face-5-big-challenges/ (accessed on 1 June 2025).
-
6.
International Energy Agency (IEA). World Energy Outlook 2021—Carbon Pricing Projections. 2021. Available online: https://www.iea.org/reports/world-energy-outlook-2021 (accessed on 1 June 2025).
-
7.
Pantelis I, Block Novelo A, Nikolaidis T, Pilidis P. A Market Introduction of Hydrogen Propulsion for First Generation Civil Airliners (Paper No. ISABE-2024-197). International Society for Air Breathing Engines (ISABE 2024); Cranfield University: Toulouse, France, 2024.
-
8.
Airbus. ZEROe: Towards the World’s First Hydrogen-Powered Commercial Aircraft. 2024. Available online: https://www.airbus.com/en/innovation/energy-transition/hydrogen/zeroe (accessed on 1 June 2025).
-
9.
Huete J, Nalianda D, Pilidis P. Propulsion system integration for a first-generation hydrogen civil airliner.
Aeronaut. J. 2021,
125, 1654–1665. doi:10.1017/aer.2021.36.
[Google Scholar]
-
10.
Kasim AA, Marek EJ. Performance and failure analysis of a retrofitted Cessna aircraft with a Fuel Cell Power System fuelled with liquid hydrogen.
J. Power Sources 2022,
521, 230987.
[Google Scholar]
-
11.
Sürer AO, Arat HT. Experimental and theoretical study on hydrogen powered aircraft: A review.
Int. J. Hydrogen Energy 2018,
43, 21178–21190. doi:10.1016/j.ijhydene.2018.09.176.
[Google Scholar]
-
12.
Adler EJ, Martins JRRA. Hydrogen-powered aircraft: Fundamental concepts, key technologies, and environmental impacts.
Prog. Aerosp. Sci. 2023,
141, 100922. doi:10.1016/j.paerosci.2023.100922.
[Google Scholar]
-
13.
Bruce S, Temminghoff M, Hayward J, Palfreyman D, Munnings C, Burke N, et al. Opportunities for Hydrogen in Aviation; CSIRO—Commonwealth Scientific and Industrial Research Organization: Canbera, Australia, 2020.
-
14.
Wikimedia Commons. (n.d.). Energy density plot. Available online: https://commons.wikimedia.org/wiki/File:Energy_density.svg (CC BY-SA 4.0) (accessed on 1 June 2025).
-
15.
Laskaridis P. Performance Investigations and Systems Architectures for the More Electric Aircraft. Doctoral dissertation, Cranfield University, Bedford, UK, 2004.
-
16.
Cranfield University. Technoeconomic Environmental Risk Assessment (TERA): A Decision-Support Tool for Aviation Decarbonisation [Unpublished Internal Report]; Cranfield Centre for Propulsion Engineering: Bedford, UK, 2020.
-
17.
Ogaji S, Pilidis P, Hales R. TERA—A tool for aero-engine modelling and management. In Proceedings of the Second World Congress on Engineering Asset Management & the Fourth International Conference on Condition Monitoring, Harrogate, UK, 11–14 June 2007.
-
18.
Carbon Offset Guide. CO₂ Emissions Factors for Jet Fuel. 2020. Available online: https://offsetguide.org/understanding-carbon-offsets/air-travel-climate/climate-impacts-from-aviation/co2-emissions (accessed on 1 June 2025).
-
19.
Dyoung A. Advanced Hydrogen Combustion Systems for Aviation: Emission Performance of Micromix Combustors.
J. Sustain. Aviat. Technol. 2022,
12, 125–137.
[Google Scholar]
-
20.
International Civil Aviation Organization. Global Long-Term Traffic Forecast (RPKs 2024–2050) [Presentation]. ICAO. 2024. Available online: www2023.icao.int/NACC/Documents/Meetings/2024/NACCDCA12/NACCDCA12P11.pdf (accessed on 1 June 2025).
-
21.
UK Civil Aviation Authority. UK on Course to Lead World in Hydrogen Fuel. 2024. Available online: https://www.caa.co.uk/newsroom/news/uk-on-course-to-lead-world-in-hydrogen-fuel-as-aviation-regulator-expands-hydrogen-challenge (accessed on 1 June 2025).
-
22.
Smart Water Magazine. ACWA Power/NEOM Green Hydrogen Project on Track for 2026. “NEOM Green Hydrogen Project on Track for 2026 Completion” (NEOM to Produce 600 Tons H2/day by 2026). 2023. Available online: smartwatermagazine.com (accessed on 1 June 2025).
-
23.
International Energy Agency. The Future of Hydrogen: Seizing Today’s Opportunities. 2019. Available online: https://www.iea.org/reports/the-future-of-hydrogen (accessed on 1 June 2025).
-
24.
Nikolaidis P, Poullikkas A. A comparative overview of hydrogen production processes.
Renew. Sustain. Energy Rev. 2017,
67, 597–611. doi:10.1016/j.rser.2016.09.044.
[Google Scholar]
-
25.
NEOM. NEOM Green Hydrogen Company Completes Financial Close at a Total Investment Value of USD 8.4 Billion in the World’s Largest Carbon-Free Green Hydrogen Plant. 22 May 2023. Available online: https://www.neom.com/en-us/newsroom/neom-green-hydrogen-investment (accessed on 1 June 2025).
-
26.
ICAO—International Civil Aviation Organization. Environmental Report. (Referenced via Carbon Offset Guide: 3.16 kg CO2 per kg Jet Fuel). 2017. Available online: offsetguide.org (accessed on 1 June 2025).
-
27.
Saudi Vision 2030. Vision 2030 Objectives—NEOM and Green Hydrogen. 2023. Available online: https://www.vision2030.gov.sa/en (accessed on 1 June 2025).
-
28.
UK Civil Aviation Authority—UK CAA News Release. “UK on Course to Lead World in Hydrogen Fuel as Aviation Regulator Expands Hydrogen Challenge” (Details Heathrow Project 601, Hydrogen Operations by 2028). 2024. Available online: caa.co.uk (accessed on 1 June 2025).
-
29.
Department for Business, Energy & Industrial Strategy (UK BEIS). UK Net Zero Strategy: Build Back Greener. 2022. Available online: https://www.gov.uk/government/publications/net-zero-strategy (accessed on 1 June 2025).