1. Introduction
Decarbonisation is a vital global objective aimed at reducing or limiting carbon dioxide (CO
2) emissions to help prevent a climate disaster. It is essential for industries, particularly in the energy sector, that depend on fossil fuels to shift toward more environmentally sustainable energy sources. Numerous studies have suggested various solutions, with one prominent approach being the replacement of fossil gas with green hydrogen [
1]. There is a growing need to improve the environmental sustainability of electricity generation by redesigning gas turbine engines to use hydrogen instead of fossil fuels [
2].
Felix et al. [
3] presented a predictive algorithm-based method that optimises hourly day-ahead operations for integrated renewable energy systems, aiming to maximise profits while addressing forecasting uncertainties. Applied to a system combining wind and solar power, an electrolyser, a Haber-Bosch ammonia plant, and supporting infrastructure, the approach allows for more precise economic evaluations of green hydrogen and ammonia production. The results demonstrate improved economic performance and operational reliability, highlighting the method’s potential to support investment decisions and strategic planning in the renewable hydrogen and ammonia sector.
Tonon [
4] explained a conceptual model for a U.S. hydrogen-based economy predominantly powered by solar and wind energy, with electrolytic hydrogen serving as the primary medium for energy storage and distribution. Fossil fuels would be reserved for non-energy uses, such as the production of plastics and chemicals. Key infrastructure requirements include approximately 350 pit storage facilities, an estimated $27.8 trillion in public infrastructure investment, and renewable energy farms covering about 4.6% of the land area in the 48 contiguous states. The model suggests this system could fulfil 96% of the country’s 2022 energy needs and notes that incorporating batteries for transportation and utility-scale storage could lower overall costs, provided current technological hurdles are addressed.
This study examined the viability of anion exchange membrane water electrolysers (AEMWEs) as a sustainable approach for hydrogen generation via water electrolysis utilising renewable energy sources, thereby positioning them as a viable alternative to conventional steam reforming techniques. The findings present a techno-economic model that estimates the baseline levelized cost of hydrogen (LCOH) for AEMWE at $5.79/kg, pinpointing the optimal current density of 1.38 A cm
−2 that achieves an equilibrium between stability and performance, while concurrently emphasising the potential for further reductions in costs through technological advancements and the adoption of low-cost electricity [
5].
Dumancic et al. [
6] presented an economic framework for evaluating hydrogen production at existing thermal power plant sites and its integration into the current gas infrastructure over a 25-year period. It considers the projected costs of electricity, natural gas, and CO
2, as well as the expenses of the power-to-gas system. The findings reveal that yellow hydrogen is not yet economically viable without policy incentives, requiring support of 52.90 EUR/MWh by 2025 and 36.18 EUR/MWh by 2050. Despite current cost barriers, hydrogen holds promising potential to support the green transition through ancillary services and energy system balancing.
The study provides a preliminary economic assessment aimed at guiding strategic decision-makers in Libya’s transition from oil dependency to non-carbon energy exports while pursuing net-zero emissions. It emphasises the importance of maintaining environmental integrity without hindering economic growth. The study assesses the costs and feasibility of various renewable technologies, such as solar, wind, and helium closed-cycle gas turbines, highlighting capital investment needs and the potential for future cost reductions to support Libya’s path toward energy independence and global carbon reduction efforts. The paper provides an in-depth economic evaluation of Libya’s transition from oil dependence to non-carbon energy exports, with a focus on solar, wind, and helium closed-cycle technologies. Solar panels represent only 0.67% of total solar energy costs, with future reductions expected to lower overall costs to USD 0.74 trillion. Helium closed-cycle gas turbines, contributing 0.78% of total energy costs (USD 0.36 trillion), are essential for stabilising energy supply and supporting global decarbonisation without compromising economic growth [
7].
This study examines a thorough economic evaluation of hydrogen farms utilising two different production technologies. The first involves alkaline electrolysers, assessed in two configurations with 600 MW and 900 MW combined-cycle gas turbine (CCGT) systems. The second focuses on proton exchange membrane (PEM) electrolysers, also examined under the same CCGT capacity scenarios. Each of the four scenarios includes hydrogen storage solutions and essential safety infrastructure, such as hydrogen sensors and detectors, gas detection panels, pressure-relief valves (PRVs), flame detectors, fire suppression systems, high-pressure rupture discs, blast-resistant walls, and alarm systems. These elements were thoroughly considered to ensure a realistic and robust economic evaluation of each hydrogen farm configuration. A comprehensive and independent comparative analysis of the costs and feasibility associated with both the alkaline electrolyser farm and the proton exchange membrane farm, in conjunction with the two combined cycle gas turbine (CCGT) packages, is conducted, which builds upon previous studies, comprising Preliminary Assessment of a Hydrogen Farm Including Health and Safety and Capacity Needs [
8], and Assessment of Hydrogen Storage and Pipelines for Hydrogen Farm [
9].
The primary objective of this study is to conduct a comprehensive economic evaluation of two proposed hydrogen farm projects in an oil-exporting country, specifically Libya, which currently relies almost entirely on oil for its energy needs. By transitioning toward hydrogen production, the country has the potential not only to advance its decarbonisation efforts but also to contribute to global emissions reductions, particularly if it evolves into a hydrogen-exporting nation. As outlined earlier, this analysis builds upon two previously published studies that serve as the foundational basis for the current assessment. Libya has approximately 2000 km of coastline along the Mediterranean Sea, offering significant potential for water access in hydrogen production. Additionally, its vast desert regions provide ideal conditions for large-scale solar energy generation.
Some reasons for Choosing Alkaline and PEM Electrolysers over SOE and AEM are that alkaline and PEM electrolysers are commercially mature technologies that have been widely adopted in large-scale hydrogen production projects, offering proven performance and reliability. In contrast, Solid Oxide Electrolysers (SOE) and Anion Exchange Membrane (AEM) electrolysers are still considered emerging technologies, with limited demonstration at commercial scale and lower levels of technological readiness.
2. Analysis Method
The methodological framework employed in the economic assessment of renewable energy systems, specifically the alkaline hydrogen farm and the proton exchange membrane hydrogen farm, necessitates an exhaustive examination of both capital expenditures (CAPEX) and ongoing operational and maintenance (O&M) expenses. In this comprehensive analysis, the total capital investment required for each system has been delineated, encompassing expenditures for various components such as Hydrogen-Fueled Combined Cycle Gas Turbine (H2CCGT) packages in two distinct configurations—600 MW CCGTs and 900 MW CCGTs—alongside alkaline electrolysers, proton exchange membrane electrolysers, hydrogen storage systems, and safety equipment such as hydrogen detectors and sensors, gas detection system control panels, pressure-relief valves (PRVs), flame detectors, fire suppression systems, blast-proof walls, and alarm and warning systems, as illustrated in . This meticulous financial appraisal provides stakeholders with a clear understanding of the necessary financial investments required for establishing these sustainable energy systems.
.
The requirements as assessed for hydrogen farm projects.
| Method of Hydrogen Production |
Electrolyser GW |
Hydrogen Storage Tonnes |
H2 CCGTs Units |
| Alkaline |
519 |
28,889 |
600 MW |
| PEM |
510 |
28,889 |
600 MW |
| Alkaline |
519 |
28,889 |
900 MW |
| PEM |
510 |
28,889 |
900 MW |
In addition to capital expenses, continuing operation and maintenance costs have been carefully allocated to individual components such as alkaline electrolyser, proton exchange membrane electrolyser, hydrogen combined cycle gas turbine (H2CCGTs) 600 MW and 900 MW, and hydrogen storage and safety equipment such as hydrogen detectors and sensors, gas detection system control panels, pressure-relief valves (PRVs), flame detectors, fire suppression systems, blast-proof walls, and alarm and warning systems.
This classification facilitates a comprehensive assessment of the long-term financial requirements for operating and maintaining these systems. Additionally, the paper examines two scenarios for each hydrogen production method. For the alkaline farm, the first scenario includes 600 MW CCGTs, while the second scenario includes 900 MW CCGTs. Similarly, for the proton exchange membrane (PEM) farm, the first scenario involves 600 MW CCGTs, and the second scenario involves 900 MW CCGTs.
The selection of 600 MW and 900 MW capacities for combined-cycle gas turbines (CCGTs) in this study is based on prevailing industry standards rather than arbitrary choice. As outlined in the U.S. Department of Energy’s Gas Turbine Handbook, capacities within the range of 300 to 600 MW are widely adopted for utility-scale CCGT applications across both 50 Hz and 60 Hz power systems. This is primarily due to their optimal balance between grid compatibility, economic efficiency, and widespread developer experience [
10].
In parallel, several operational projects affirm the commercial viability of 900 MW-class CCGTs. Notable examples include the 900 MW Cascade Power Project in Alberta, Canada [
11], and the 893 MW Keadby 2 plant in the United Kingdom [
12]. These facilities exemplify the scale and feasibility of deploying large-capacity turbines within contemporary power generation portfolios.
In the context of Libya’s future energy strategy, both for domestic self-sufficiency and for potential electricity exports, the modelling framework estimates that approximately 54 single-shaft 600 MW units or 36 single-shaft 900 MW CCGTs would be required. This dual-capacity assessment allows for a comparative analysis of medium- and large-scale configurations, reflecting the diverse spectrum of current and next-generation energy infrastructure.
Furthermore, including both sizes enables an evaluation of trade-offs in spatial footprint and economic factors. The 900 MW units, despite their larger physical size, tend to offer cost advantages per megawatt, whereas the 600 MW units, though more compact, are generally associated with higher costs. This comparison contributes to a nuanced understanding of scale-related efficiencies and infrastructure planning considerations.
These economic frameworks provide essential understanding of the financial components of renewable energy infrastructures, underscoring the significance of substantial initial capital outlays alongside persistent operational costs. They empower stakeholders to make well-informed decisions by evaluating both the economic viability and the long-term sustainability of these systems.
In selecting unit cost values for the hydrogen farm economic model, a balanced and context-sensitive approach was adopted. Wherever possible, mid-range market prices were chosen to avoid bias from extreme values, ensuring that the estimates reflect typical market conditions rather than overly optimistic or pessimistic scenarios. The differences in cost between technologies, such as alkaline and PEM electrolysers, were informed by their varying levels of technological maturity, operational lifespans, and maintenance requirements. Regional factors were also considered, with adjustments made to account for specific North African conditions, including transport logistics, import duties, and infrastructure constraints. To enhance reliability, all cost inputs were verified through cross-referencing with multiple credible sources, including peer-reviewed studies and real-world vendor quotations.
Furthermore, this analytical methodology employs meticulous calculations and widely recognised formulas to evaluate capital expenditures, ongoing operations, and maintenance costs associated with each constituent and element of infrastructure. By employing such a methodology, stakeholders are afforded enhanced insight into the financial ramifications, thereby enabling them to make informed decisions regarding the implementation and management of renewable energy systems. presents the criteria as evaluated for hydrogen farm initiatives of two distinct hydrogen production techniques, namely the alkaline electrolyser and the PEM electrolyser.
The number of required electrolysers was determined based on Libya’s significant dependence on oil. A recent study by Rawesat et al. (2024) [
13] examined how the country could decarbonise its energy sector by transitioning to clean hydrogen. The researchers calculated Libya’s total energy consumption and exports in 2020, expressed in petajoules, and proposed replacing this oil-derived energy with hydrogen. Their analysis concluded that achieving this transition would require approximately 519 GW of alkaline electrolysers or 510 GW of proton exchange membrane (PEM) electrolysers. The slight difference between these figures reflects the varying efficiencies of the technologies, 75% for alkaline and 77% for PEM, demonstrating how higher efficiency can reduce the total capacity needed.
The hydrogen storage capacity of 78,614 tonnes is grounded in system-wide energy balancing and export-oriented planning considerations. This figure represents the cumulative hydrogen output from the proposed electrolysis systems over a 30-day production period under baseline operational conditions, assuming near-continuous operation and optimal electrolyser efficiency. The intent behind this duration is to simulate a monthly storage buffer, which accounts for both domestic consumption fluctuations and logistical requirements for bulk export scenarios, particularly relevant in regions like Libya, where hydrogen is expected to be shipped internationally via pipelines or carriers, by the Mediterranean Sea.
Furthermore, this storage capacity aligns with the projected scale of energy integration with CCGT infrastructure, supporting a realistic dispatch and export window. It allows the hydrogen farm to operate with a degree of resilience, ensuring supply continuity in the event of short-term disruptions, maintenance periods, or grid intermittency. The storage size also reflects precedents set by proposed hydrogen hubs and export terminals in Europe and the Middle East, where Reuters stated that [
14] storage capacities are often sized to support weekly or monthly production volumes to optimise shipment cycles and contract delivery terms.
This approach ensures that the system design accommodates technical feasibility, supply chain coordination, and market readiness, making the 78,614-tonne capacity a practical assumption for a national-scale hydrogen infrastructure strategy.
The capacity factor, which directly influences annual hydrogen output, was carefully varied across scenarios to reflect realistic operational conditions. For both AWE and PEM electrolysers, a baseline capacity factor of 20% was selected, consistent with IEA recommendations for hybrid solar-wind deployment in desert regions.
In terms of water consumption, electrolysis consumes approximately 9 litres of water per kilogram of hydrogen, which results in a vast water demand. The model assumes that treated seawater would be used; the cost of water treatment was added to the cost of the electrolysers. However, no explicit unit water cost (e.g., $/m
3) is stated in the spreadsheet or paper. For full transparency, a typical treated water cost of $0.50–$1.00/m
3 could be integrated in future studies.
Regarding financial assumptions, the model maintains consistency in applying real values, excluding inflation escalation beyond O&M, for simplicity, and its effect is implicitly embedded in the total project cost summaries. To improve clarity and allow replication, the discount rate was excluded.
The land acquisition costs are excluded, assumption access to public desert land in Libya. This is explicitly justified due to the country’s vast uninhabited areas and publicly owned terrain. However, this assumption may not be transferable to other geographies, such as Europe or East Asia, where land competition is fierce, often accounting for 10–20% of total CAPEX in renewable installations.
In this research, each approach has been evaluated as the foundation for cost calculations related to hydrogen farms [
8]. The study assesses the economic feasibility of hydrogen farms designed to produce hydrogen for operating combined cycle gas turbines (CCGTs) to generate electricity and export hydrogen. This contributes to decarbonisation efforts in Libya and beyond.
This article’s unique contribution lies in its economic evaluation of large-scale hydrogen farms in an oil-exporting country, with a particular emphasis on safety, an aspect that has not been previously addressed.
In the next study, the levelized cost of hydrogen will be examined for two scenarios. Four variables will be entered, and each variable will be simulated several times in MATLAB, from which the levelized cost of hydrogen will be obtained. To conduct an economic assessment of hydrogen production, it is necessary to compare it with other production methods and to assess market competitiveness.
3. Baseline Economic Model for Alkaline Electrolyser Farm
The economic model for an alkaline electrolyser farm, specifically within the framework of energy exportation, requires an exhaustive evaluation of both capital expenditures (CAPEX) and regular operation and maintenance (O&M) expenses. outlines the prerequisites across two different scenarios: the first scenario entails the utilisation of 600 MW combined cycle gas turbines (CCGTs), whereas the second scenario incorporates the application of 900 MW CCGTs.
.
Hydrogen farms requirements.
| Scenario |
The Requirements of the H2 Export |
| Alkaline electrolyser GW |
519 |
| PEM electrolyser GW |
510 |
| Storage of hydrogen tonnes |
78,614 |
| In case 600 MW CCGTs |
54 |
| In case 900 MW CCGTs |
36 |
| Gas Leak Detectors and Sensors |
51,900 |
| Gas Detector Panel Controller |
5190 |
| Pressure Relief Safety Valve |
46,710 |
| Flame Detector |
62,280 |
| Fire Suppression System |
15,570 |
| High-Pressure Rupture Disc |
67,470 |
| Fire alarm system |
519 |
| Blast-proof walls m |
11,888 |
4. Total Capital Cost of Equipment
The comprehensive capital expenditure is ascertained through the evaluation of various elements encompassing alkaline electrolysers, proton exchange membrane electrolysers, hydrogen combined cycle gas turbines (H2CCGTs) rated at 600 MW and 900 MW, alongside hydrogen storage and safety apparatus, which includes hydrogen detection devices and sensors, gas detection system control panels, pressure-relief valves (PRVs), flame detection systems, fire suppression mechanisms, blast-resistant barriers, and alarm and warning systems.
The capital expenditure (CAPEX) associated with hydrogen combined cycle gas turbines (H2CCGTs) is determined by the product of the total number of units and the expense incurred per unit, considering a nominal capacity of 600 megawatts for each unit.
The number of electrolysers is calculated based on the electrolysis GW needed in the oil export country decarbonisation project, which is Libya.
The capital expenditure (CAPEX) associated with electrolysis units is determined by the gigawatt (GW) capacity and the financial expenditure required for a single electrolysis unit.
The capital expenditure (CAPEX) associated with hydrogen storage is determined by converting 78,614 tonnes of hydrogen (H2) into kilograms and subsequently multiplying this figure by the cost of storage on a per-kilogram basis.
The capital expenditure (CAPEX) of gas leak detectors and sensors is determined based on the number of gas leak detectors and sensors required for each one electrolyser GW, multiplied by the total number of electrolyser GW.
The capital expenditure (CAPEX) of a gas detector panel controller is calculated based on the total number of panel controllers needed for one electrolysis GW, multiplied by the number of electrolysis GW required in the hydrogen farm.
The capital expenditure (CAPEX) associated with the pressure relief safety valve is determined by multiplying the total quantity of pressure relief safety valves required for a single electrolysis gigawatt by the total number of electrolysis gigawatts necessitated within the hydrogen production facility.
Furthermore, the capital expenditures (CAPEX) associated with the flame detector, the fire suppression system, the high-pressure rupture disc, and the fire alarm system is calculated by considering the quantity of each category of equipment necessitated for every individual electrolyser GW, subsequently multiplied by the aggregate number of electrolyser GW present within the hydrogen production facilities.
5. Breakdown of the Capital Cost of Hydrogen Farm
The capital expenditures associated with hydrogen production facilities and their ancillary apparatus utilised for the synthesis of gaseous hydrogen in Libya are delineated into investment costs (ICs) and operational and maintenance (O&M) expenditures. The investment costs are further categorised into several distinct components, while the operational and maintenance costs are also systematically organised. The levelized cost of hydrogen (LCOH) exhibits considerable variation across distinct production methodologies. Where hydrogen generated from fossil fuels (black/brown, grey, and blue) is predominantly less expensive than hydrogen sourced from renewable energy (green, yellow). Aqua hydrogen is recognised as the most cost-effective alternative, with a LCOH of $0.23/kg. This examination is pivotal for assessing the financial advantages of extensive hydrogen production, underscoring the significance of production methodologies in cost evaluations [
15].
The breakdown of costs for hydrogen farm equipment is as follows.
5.1. Alkaline Water Electrolyser (AWE)
This element of the capital expenditure is associated with the generation of hydrogen via the electrolysis method, which constitutes a critical dimension of renewable energy storage and application [
16]. The capital expenditure for electrolysis is determined by considering the gigawatt (GW) capacity alongside the financial outlay for an individual electrolysis unit.
The total capital expenditures associated with a 1-GW green-hydrogen facility employing alkaline water electrolysis (AWE) technology are projected to amount to USD 795 million (approximately $ 795/kW of installed capacity). When quantified in terms of hydrogen output, the anticipated total installation expenditures would equal 1720 $/(kg/day) for AWE technology. This latter figure is utilised as it is predicated on the volume of hydrogen generated rather than the electrical input, thereby accounting for efficiency considerations.
Furthermore, the balance of plant components—including piping systems, utility services, and civil engineering works—imparts a significant contribution to the direct expenditures. Direct costs associated with AWE are comparatively lower than those related to Proton Exchange Membrane (PEM) technology. Additionally, indirect costs and ownership expenditures constitute a considerable portion of the overall installed costs. The indirect costs, ownership costs, and contingency allowances are incorporated as a percentage increase atop the direct expenditures [
17].
5.2. Proton Exchange Membrane (PEM)
The capital expenditure (CAPEX) associated with electrolysis is calculated by taking into account the gigawatt (GW) capacity alongside the financial outlay required for an individual electrolysis unit. The total capital expenditures associated with a 1-GW green-hydrogen facility are projected to be USD 900 million (900 $/kW of installed capacity) for a plant employing Proton Exchange Membrane (PEM) technology. When articulated in terms of hydrogen output, the anticipated total installation costs are estimated at 1925 $/(kg/day) for PEM technology. This latter figure is utilised as it is predicated on the volume of hydrogen generated rather than the electrical input, thereby accounting for the efficiency of the process. Moreover, the balance of plant components—including piping, utilities, and civil works—substantially impacts the direct costs incurred. The direct costs associated with PEM technology are found to be analogous to those of Alkaline Water Electrolysis (AWE); however, the cost distribution diverges, with PEM exhibiting elevated stack costs and diminished expenses for the balance of plant elements. Indirect costs and owners’ expenditures represent a considerable fraction of the overall installed costs. The indirect costs, owners’ costs, and contingency allowances are incorporated as a percentage on top of the direct costs [
17].
5.3. H2CCGTs (Hydrogen-Fueled Combined Cycle Gas Turbine)
For Combined Cycle facilities, benchmark pricing inclusive of Engineering, Procurement, and Construction (EPC) installation project scope (installed) is approximately 1050 $/kW for 600 MW Combined Cycle Gas Turbines (CCGTs). The costs associated with both equipment-only, Generating Set prices and fully installed plant prices exhibit a significant reduction about scale, with the most sizable and efficient gas turbines generating electricity at the lowest cost per kilowatt, where the estimated price for 900 MW CCGTs is 990 $/kW. The prices delineated represent the so-called “overnight” costs, which do not account for escalation, interest accrued during construction, or other time-sensitive cost augmentations. Furthermore, they do not encompass costs borne by the owner that are associated with project development, land procurement, permitting, and utility interconnections, among others [
18].
5.4. Hydrogen Storage
The capital expenditure (CAPEX) of hydrogen storage is determined by converting 78,614 tonnes of hydrogen into kilograms and subsequently multiplying this figure by the cost per kilogram. This calculation elucidates the financial investment requisite for the storage of hydrogen, an essential element in mitigating the fluctuations inherent in renewable energy sources [
19].
5.5. Safety Equipment
The capital expenditure (CAPEX) for safety equipment is determined through a structured three-step process. First, the per-gigawatt (GW) requirements for safety equipment are identified. Next, this estimated quantity per GW is multiplied by the total number of GWs required, yielding the total equipment quantity. Finally, the CAPEX is calculated by multiplying the total equipment quantity by the cost per unit of safety equipment.
The breakdown of costs for safety equipment is as follows.
5.5.1. Hydrogen Gas Leak Detector
This apparatus represents a premier-grade FORENSICS DETECTORS Hydrogen Gas Leak Detector, equipped with an integrated pump that facilitates expedited response times, point probe sampling, and uninterrupted monitoring. Our RANGE variant offers users an expanded capacity to identify hydrogen gas in proximity to its Lower Explosive Limit, specifically quantified at 40,000 ppm. It is ideally suited for (a) the surveillance of hydrogen gas leaks within hydrogen storage and distribution facilities, (b) the identification of hydrogen tracer gas leaks pertinent to plumbing applications, including pipe and system leak detection, and (c) the assessment of hydrogen accumulation within battery rooms or any facility that may release hydrogen, where such accumulation could present a significant safety risk. This Hydrogen Leak Detector is recognised as one of the most sophisticated devices available on the marketplace, featuring a 32-bit microprocessor, a colour LCD screen, and the capability for graphical representation. Furthermore, the detector is traceable to the USA NIST standards and calibrated specifically for Hydrogen (H2) gas. Where the price of one detector is $1195, and based on these details and the size of the electrolyser the number of hydrogen leak detectors has been determined [
20].
5.5.2. Gas Detector Panel Controller
This apparatus is meticulously engineered to address the detection of gas leaks and mitigate potential hazards, boasting an expedited response time of T90 < 30 s, thereby facilitating immediate intervention during critical situations. Constructed from high-grade stainless-steel materials, this gas alarm control panel guarantees both resilience and durability; additionally, it can manage multiple channels, thereby offering extensive surveillance and regulation of gas concentrations, rendering it an optimal selection for scenarios necessitating concurrent oversight of several gas channels. The device has an LED digital display and supports 4–20 mA/RS485 input, providing unambiguous and accurate readings for streamlined monitoring and regulation. The estimated quantity of gas detection panel controllers was determined by multiplying the number required for a single gigawatt-scale electrolyser by the total number of electrolysers in the farm. Each panel controller is priced at $80 (Wuxi Yongan Electronic Technology, Wuxi, China, 2024) [
21].
5.5.3. Hydrogen Overflow Pressure Relief Safety Valve
The 3.5a25 safety relief valve is used in hydrogen pipelines to regulate and safely release pressure, preventing damage or hazards when pressure exceeds safe limits. Made of corrosion-resistant brass, this features a valve body, core, and spring assembly, with adjustable pressure settings to suit various operating conditions. Each valve costs $650, and the total number required is based on the number of valves needed per gigawatt-scale electrolyser multiplied by the total electrolysers in the farm [
22].
5.5.4. Flame Detector for Hydrogen Applications
The FL500-H2 represents an advanced Ultraviolet/Infrared flame detection apparatus meticulously engineered for the identification of hydrogen (H2) combustion incidents. The optical flame detection system of the FL500-H2 is adept at surveilling the radiation emitted by a hydrogen flame across both the ultraviolet (UV) and infrared (IR) spectral domains. This integration of UV and IR detection methodologies facilitates a rapid response capability and enhances resistance to false alarms arising from various radiation sources, thereby ensuring dependable protective measures [
23]. The projected quantity of Flame Detectors designated for Hydrogen Applications was ascertained by calculating the product of the quantity required for an individual gigawatt-scale electrolyser and the cumulative quantity of electrolysers present within the facility. The cost of each Flame Detector tailored for Hydrogen Applications is established at $2957.
5.5.5. Fire Suppression System
The number of fire suppression systems was determined based on the requirements for a single gigawatt-scale electrolyser, then scaled by the total number of electrolysers in the farm. The capital expenditure (CAPEX) was calculated by multiplying the unit cost of one fire suppression system by the total number required. The cost of each fire suppression system is established at $383 [
24].
5.5.6. Rupture Disc, High-Pressure Rupture Disc
Hydrogen demonstrates a significant propensity for combustion and volatility, consequently making any build-up of pressure within storage tanks or systems a substantial risk for explosive occurrences or equipment malfunctions. A rupture disc serves as a vital safety apparatus by effectively venting excess pressure, thereby averting catastrophic failures and perilous conditions while simultaneously ensuring the overall safety of the hydrogen production facility. This rupture disc, engineered to withstand pressures approaching 65,000 psi, is particularly suited for exceedingly high-pressure hydrogen systems that necessitate stringent safety protocols [
25]. The capital expenditure (CAPEX) for high-pressure rupture discs was calculated by multiplying the unit cost of one disc ($48) by the total number required for all electrolysers in the hydrogen farm.
5.5.7. Fire Alarm System
The dimensions of the facility edifice will profoundly influence the financial implications associated with the fire alarm system. Generally, an increase in the square footage of the facility corresponds with higher expenses for both equipment and installation, owing to the necessity for a greater quantity of sensors, alarms, and manual pull stations. For a one-gigawatt-scale electrolyser, the capital expenditure (CAPEX) is estimated at $2.4 million [
26].
5.5.8. Blast Proof Walls
To estimate the total length of 4.5-m-high blast-proof walls required to enclose 78,614 kilotonnes of hydrogen storage tanks (each with a capacity of 1000 kg), the perimeter of the storage area must be calculated. This calculation is based on several layout assumptions: each tank has a diameter of 3 m, tanks are spaced 10 m apart, and a 25-m safety buffer is maintained between the outermost tanks and the surrounding blast walls. Based on this configuration, the total required perimeter is 11,888 m. The blast-proof walls, typically constructed from reinforced concrete, are estimated to cost approximately $400 per linear meter at a height of 4.5 m [
27].
6. Explanation of the Formulas and Values Used in Alkaline Electrolyser Farm
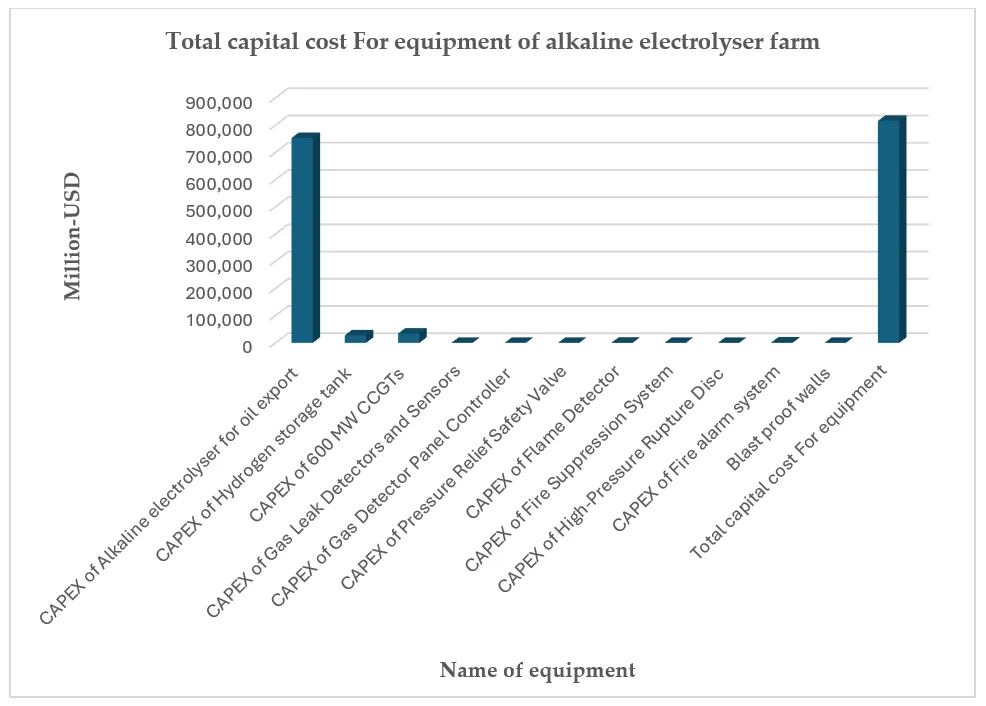
A comprehensive economic overview has been outlined for an alkaline electrolyser-based hydrogen production facility aimed at supporting decarbonisation efforts, with a focus on hydrogen exports as presented in . It details both replacement and transition costs in terms of real capital investment and operational expenditures.
From a capital expenditure perspective, the cost of the alkaline electrolysers dominates, accounting for 90.48% of the total. The 600 MW H
2CCGT package contributes 4.09%, hydrogen storage systems 3.30%, and safety equipment 2.13%, as shows. Collectively, these components result in a total capital cost of approximately USD 0.8156 trillion.
.
Total actual capital cost for equipment in the case of an alkaline electrolyser farm with 600 MW CCGTs.
| Total Capital Cost Items |
Million-USD |
% |
| CAPEX of Alkaline electrolyser for oil export |
752,550 |
90.48 |
| CAPEX of the Hydrogen storage tank |
27,514.900 |
3.30 |
| CAPEX of 600 MW CCGTs |
34,020 |
4.09 |
| CAPEX of Gas Leak Detectors and Sensors |
62.021 |
0.0074 |
| CAPEX of Gas Detector Panel Controller |
0.415 |
0.00004 |
| CAPEX of Pressure Relief Safety Valve |
30.362 |
0.0036 |
| CAPEX of Flame Detector |
184.162 |
0.022 |
| CAPEX of Fire Suppression System |
5.963 |
0.00071 |
| CAPEX of High-Pressure Rupture Disc |
3.374 |
0.00040 |
| CAPEX of Fire Alarm System |
1245.600 |
0.149 |
| CAPEX Blast-proof walls |
4.755 |
0.00057 |
| Total Capital Cost |
815,622 |
|
On the operations and maintenance (O&M) side, as shown in , the largest costs are attributed to the alkaline electrolysers and hydrogen storage, followed by the H
2CCGT systems. Safety equipment costs are also included, covering gas leak detectors and sensors, gas detector panel controllers, pressure relief safety valves, flame detectors, fire suppression systems, high-pressure rupture discs, and fire alarm systems. Together, these O&M components amount to a total cost of USD 0.01604 trillion. Given the project’s 25-year lifespan, the maintenance costs over this period—amounting to USD 0.401 trillion—are included in the capital expenditure. As a result, the total cost, combining both capital expenditure and operation and maintenance, reaches USD 1.2166 trillion. A frequently referenced metric for the escalation of operations and maintenance (O&M) expenses within energy systems, encompassing hydrogen, is approximately 2–3% annually. This estimation is derived from historical patterns associated with the maintenance of energy infrastructure and corresponding inflationary trends, where maintenance costs increase as the equipment ages and requires more frequent servicing [
28].
. Total capital cost for the equipment of an alkaline electrolyser farm with 600 MW CCGTs.
.
Total actual O&M cost for equipment in the case of an alkaline electrolyser farm with 600 MW CCGTs.
| Total O&M Cost for Items |
Million-USD |
% |
| Alkaline electrolyser for oil export O&M Cost |
15,051 |
1.809 |
| Hydrogen storage tank O&M Cost |
275 |
0.033 |
| 600 MW CCGTs O&M Cost |
680 |
0.081 |
| Gas Leak Detectors and Sensors O&M Cost |
1.861 |
0.00022 |
| Gas Detector Panel Controller O&M Cost |
0.0083 |
0.00000099 |
| Pressure Relief Safety Valve O&M Cost |
0.6072 |
0.000073 |
| Flame Detector O&M Cost |
5.5249 |
0.00066 |
| Fire Suppression System O&M Cost |
0.1193 |
0.000014 |
| High-Pressure Rupture Disc O&M Cost |
0.0337 |
0.0000040 |
| Fire Alarm System O&M Cost |
24.912 |
0.0029 |
| Total O&M Cost |
16,040 |
|
In the second scenario, which involves an alkaline electrolyser farm paired with 900 MW H
2CCGTs, the capital expenditure is slightly lower compared to the 600 MW configuration. This is due to the lower unit cost of the 900 MW H
2CCGTs. This observation highlights an important trend: as system size increases, the cost per unit of capacity tends to decrease, demonstrating economies of scale.
presents the total capital cost for the equipment, which remains consistent with the previous alkaline electrolyser farm scenario, except for the inclusion of the 900 MW CCGTs. These have a lower cost compared to the 600 MW units, resulting in a reduced overall capital expenditure (CAPEX). The financial outlay associated with the alkaline electrolysers is predominant, accounting for 90.70% of the overall expenditure. The 900 MW H
2CCGT system contributes 3.86%, hydrogen storage systems account for 3.31%, and safety equipment represents 2.13%, as illustrated in
. In totality, these components culminate in an aggregate capital cost of approximately USD 0.8136 trillion.
.
Total actual capital cost for equipment in the case of an alkaline electrolyser farm with 900 MW CCGTs.
| Total Capital Cost for Equipment |
Million-USD |
% |
| CAPEX of Alkaline electrolyser for oil export |
752,550.000 |
90.703 |
| CAPEX of Hydrogen storage tank |
27,514.900 |
3.316 |
| CAPEX of 900 MW CCGTs |
32,076.000 |
3.866 |
| CAPEX of Gas Leak Detectors and Sensors |
62.021 |
0.0074 |
| CAPEX of Gas Detector Panel Controller |
0.415 |
0.000050 |
| CAPEX of Pressure Relief Safety Valve |
30.362 |
0.00365 |
| CAPEX of Flame Detector |
184.162 |
0.0221 |
| CAPEX of Fire Suppression System |
5.963 |
0.00071 |
| CAPEX of High-Pressure Rupture Disc |
3.374 |
0.00040 |
| CAPEX of Fire Alarm System |
1245.600 |
0.1501 |
| Blast proof walls |
4.755 |
0.00057 |
| Total Capital Cost for Equipment |
813,678 |
|
. Total capital cost for the equipment of an alkaline electrolyser farm with 900 MW CCGTs.
In the realm of operations and maintenance (O&M), as illustrated in
, the predominant expenditures are attributed to alkaline electrolysis systems and hydrogen storage facilities, followed by the hydrogen combined cycle gas turbine (H
2CCGT) systems. Additionally, costs associated with safety apparatus are encompassed, which include gas leak detection devices and sensors, gas detector panel controllers, pressure relief safety valves, flame detection systems, fire suppression mechanisms, high-pressure rupture discs, and fire alarm systems. Collectively, these O&M elements result in a comprehensive expenditure amounting to USD 0.0160 trillion. Considering the project’s projected lifespan of 25 years, the maintenance expenses incurred throughout this duration, totalling USD 0.400 trillion, are incorporated within the capital expenditure. Consequently, the aggregate cost, which encompasses both capital expenditure as well as operational and maintenance expenses, amounts to USD 1.2136 trillion.
.
Total actual O&M cost for equipment in the case of an alkaline electrolyser farm with 600 MW CCGTs.
| Total O&M Cost for Equipment |
Million-USD |
% |
| Alkaline electrolyser for oil export O&M Cost |
15,051 |
1.814 |
| Hydrogen Storage Tank O&M Cost |
275.14 |
0.033 |
| 900 MW CCGTs O&M Cost |
641.52 |
0.077 |
| Gas Leak Detectors and Sensors O&M Cost |
1.86 |
0.00022 |
| Gas Detector Panel Controller O&M Cost |
0.0083 |
0.0000010 |
| Pressure Relief Safety Valve O&M Cost |
0.6072 |
0.000073 |
| Flame Detector O&M Cost |
5.5249 |
0.00066 |
| Fire Suppression System O&M Cost |
0.1193 |
0.000014 |
| High-Pressure Rupture Disc O&M Cost |
0.0337 |
0.0000040 |
| Fire Alarm System O&M Cost |
24.91 |
0.00300 |
| Total O&M cost for equipment |
16,001 |
|
7. Explanation of the Formulas and Values Used in PEM Electrolyser Farm
An extensive economic analysis has been conducted of a hydrogen production farm utilising proton exchange membrane electrolyser technology, specifically designed to facilitate decarbonisation initiatives while emphasising hydrogen exportation, as shown in . It delineates both the costs associated with replacement and transition, articulated through the lens of actual capital investment and operational expenditures.
From a capital expenditure standpoint, the financial outlay associated with the PEM electrolysers is predominant, comprising 91.92% of the aggregate cost. The 600 MW H
2CCGT system contributes 3.31%, hydrogen storage infrastructures account for 2.68%, and safety apparatus represents 2.09%, as illustrated in .
. Total capital cost for equipment of PEM electrolyser farm with 600 MW CCGTs.
.
Total actual capital cost for equipment in the case of a PEM electrolyser farm with 600 MW CCGTs.
| Total Capital Cost for Equipment |
Millions-USD |
% |
| CAPEX of PEM electrolyser for oil export |
943,500.000 |
91.92 |
| CAPEX of the Hydrogen storage tank |
27,514.900 |
2.68 |
| CAPEX of 600 MW CCGTs |
34,020.000 |
3.31 |
| CAPEX of Gas Leak Detectors and Sensors |
60.945 |
0.0059 |
| CAPEX of Gas Detector Panel Controller |
0.408 |
0.000039 |
| CAPEX of Pressure Relief Safety Valve |
29.835 |
0.0029 |
| CAPEX of Flame Detector |
180.968 |
0.0176 |
| CAPEX of Fire Suppression System |
5.860 |
0.00057 |
| CAPEX of High-Pressure Rupture Disc |
3.315 |
0.00032 |
| CAPEX of Fire Alarm System |
1224.000 |
0.119 |
| Blast proof walls |
4.755 |
0.00046 |
| Total Capital Cost for Equipment |
1,006,545 |
|
In the domain of operations and maintenance (O&M), as delineated in
, the primary financial outlays are attributed to the PEM electrolysis systems and hydrogen storage infrastructures, followed closely by the hydrogen combined cycle gas turbine (H
2CCGT) systems. Furthermore, expenses related to safety equipment are included, encompassing gas leak detection instruments and sensors, gas detector panel controllers, pressure relief safety valves, flame detection systems, fire suppression apparatus, high-pressure rupture discs, and fire alarm systems. In aggregate, these O&M components result in a total expenditure amounting to USD 0.0198 trillion. Considering the anticipated duration of the project, projected at 25 years, the maintenance costs incurred over this period—amounting to USD 0.495 trillion—are integrated within the capital expenditure. As a result, the total cost, which encompasses both capital expenditure as well as operational and maintenance costs, aggregates to USD 1.5214 trillion.
.
Total actual O&M cost for equipment in the case of a PEM electrolyser farm with 600 MW CCGTs.
| Total O&M Cost for Equipment |
Million-USD |
% of the Total |
| Alkaline electrolyser for oil export O&M Cost |
18,870.0 |
1.83 |
| Hydrogen Storage Tank O&M Cost |
275.14 |
0.026 |
| 600 MW CCGTs O&M Cost |
680.40 |
0.066 |
| Gas Leak Detectors and Sensors O&M Cost |
1.82 |
0.00017 |
| Gas Detector Panel Controller O&M Cost |
0.0082 |
0.00000079 |
| Pressure Relief Safety Valve O&M Cost |
0.59 |
0.000058 |
| Flame Detector O&M Cost |
5.42 |
0.00052 |
| Fire Suppression System O&M Cost |
0.117 |
0.0000114 |
| High-Pressure Rupture Disc O&M Cost |
0.0332 |
0.0000032 |
| Fire Alarm System O&M Cost |
24.48 |
0.00238 |
| Total O&M cost |
19,858 |
|
In the subsequent scenario, which involves a PEM electrolyser facility integrated with 900 MW H
2CCGTs, the capital expenditure is marginally reduced compared to the 600 MW configuration. This phenomenon can be attributed to the diminished unit cost associated with the 900 MW H
2CCGTs.
outlines the total capital cost for the apparatus, which remains congruent with the prior PEM electrolyser farm scenario, with the exception of the incorporating the 900 MW CCGTs. Furthermore, these units possess a lower cost relative to their 600 MW counterparts, culminating in an overall reduction in capital expenditure (CAPEX). The financial commitment associated with PEM electrolysers is notably substantial compared to alkaline electrolysers, representing 92.10% of the total expenditure. The 900 MW H
2CCGT system accounts for 3.13%, hydrogen storage systems constitute 2.68%, and safety equipment comprises 2.09%, as depicted in
. Collectively, these elements result in a cumulative capital cost approximating USD 1.0046 trillion.
.
Total actual capital cost for equipment in the case of a PEM electrolyser farm with 900 MW CCGTs.
| Total Capital Cost for Equipment |
Million-USD |
% of the Total |
| CAPEX of PEM electrolyser for oil export |
943,500 |
92.10 |
| CAPEX of the Hydrogen storage tank |
27,514.90 |
2.68 |
| CAPEX of 900 MW CCGTs |
32,076 |
3.13 |
| CAPEX of Gas Leak Detectors and Sensors |
60.945 |
0.0059 |
| CAPEX of Gas Detector Panel Controller |
0.408 |
0.000039 |
| CAPEX of Pressure Relief Safety Valve |
29.835 |
0.0029 |
| CAPEX of Flame Detector |
180.968 |
0.017 |
| CAPEX of Fire Suppression System |
5.860 |
0.00057 |
| CAPEX of High-Pressure Rupture Disc |
3.315 |
0.00032 |
| CAPEX of Fire Alarm System |
1224.000 |
0.119 |
| Blast-proof walls |
4.755 |
0.00046 |
| Total capital cost for equipment |
1,004,601 |
|
. Total capital cost for the equipment of PEM electrolyser farm with 900 MW CCGTs.
Moreover, in operations and maintenance (O&M), as outlined in
, the predominant expenditures are attributed to the alkaline electrolysers and hydrogen storage systems, followed by the H
2CCGT systems. The costs associated with safety equipment are also significant. Collectively, these components of O&M culminate in a comprehensive cost of USD 0.01981 trillion. Considering the project’s anticipated lifespan of 25 years, the maintenance expenditures over this duration—which total USD 0.495 trillion—are encapsulated within the capital expenditure. Consequently, the aggregate cost, combining both capital expenditure and operational, as well as maintenance costs, rises to USD 1.519 trillion.
.
Total actual O&M cost for equipment in the case of a PEM electrolyser farm with 900 MW CCGTs.
| Total O&M Cost for Equipment |
Million-USD |
% of the Total |
| Alkaline electrolyser for oil export O&M Cost |
18,870 |
1.84 |
| Hydrogen Storage Tank O&M Cost |
275.1490 |
0.026 |
| 600 MW CCGTs O&M Cost |
641.5200 |
0.062 |
| Gas Leak Detectors and Sensors O&M Cost |
1.8284 |
0.00017 |
| Gas Detector Panel Controller O&M Cost |
0.0082 |
0.00000079 |
| Pressure Relief Safety Valve O&M Cost |
0.5967 |
0.000058 |
| Flame Detector O&M Cost |
5.4291 |
0.00052 |
| Fire Suppression System O&M Cost |
0.1172 |
0.0000114 |
| High-Pressure Rupture Disc O&M Cost |
0.0332 |
0.0000032 |
| Fire Alarm System O&M Cost |
24.4800 |
0.00238 |
| Total O&M cost |
$19,819 |
|
8. Reasons for Electrolysers’ High Expense
Electrolysers are the most capital-intensive component in hydrogen production systems due to their material complexity, engineering demands, and limited industrial scaling. High costs are driven by the use of expensive materials, such as platinum group metals in PEM electrolysers and corrosion-resistant components in alkaline types, as well as the lack of mass production, which results in expensive, customised large-scale units. In addition, electrolysers require a range of supporting systems, including power electronics, thermal management, and gas purification, further inflates capital costs. Efficiency requirements also increase expenses, as manufacturers invest in advanced materials and system controls to minimise energy losses, especially in electricity-constrained regions [
29].
Factors That Could Drive Cost Reductions: Economies of Scale: As global hydrogen demand grows, larger production runs and standardised designs will lead to reduced per-unit costs. Gigawatt-scale projects planned in Europe, Asia, and MENA could catalyse this trend.
Material Substitution and Catalyst Innovation: Research into alternative catalysts (e.g., non-platinum group metals), cheaper membranes, and advanced coatings could reduce costs without compromising performance.
Manufacturing Automation: Automation in stack assembly, welding, and quality control could lower labour costs and improve consistency, particularly for PEM stacks.
Integration and System Optimisation: Improvements in integrating electrolysers with renewable energy sources and better thermal/electrical management could reduce the need for oversized or redundant components, lowering both CAPEX and OPEX.
Policy Support and Learning Curves: As with solar PV and wind turbines, policy incentives, learning by doing, and increased deployment will reduce costs through experience and innovation. Current projections suggest electrolyser costs could fall by 40–70% by 2030 under aggressive deployment scenarios.
9. Reasons for the High O&M Costs of PEM Compared to AWE
PEM electrolysers, while offering advanced performance features such as compact design and rapid response, incur higher operation and maintenance (O&M) costs than alkaline systems due to several interrelated factors. Their reliance on expensive, sensitive components, like platinum-group catalysts and polymer membranes, requires meticulous environmental control and more frequent part replacements. Unlike alkaline systems, PEM units demand ultra-pure deionised water, which adds the burden of maintaining water purification systems and monitoring water quality. Furthermore, their balance-of-plant components (e.g., power electronics, thermal control, and pressurisation) are more complex and require regular calibration and servicing. The shorter stack lifespan of PEM electrolysers, typically 40,000–60,000 h versus over 90,000 for alkaline, means more frequent and costly replacements over the project lifecycle [
30]. Lastly, limited supply chain maturity and the need for specialised technical support, especially in emerging markets like Libya, further escalates service costs compared to the more established and widely supported alkaline technology.
A detailed sensitivity analysis has already been conducted and is fully presented in our separate paper, titled “Techno-Economic Environmental Risk Analysis (TERA) in Hydrogen Farms”. This study specifically explores how variations in key parameters, such as electrolyser capital costs, electricity prices, electrolyser efficiency, and capacity factor, impact the overall project feasibility. The aim was to capture a comprehensive view of the economic uncertainties and risks associated with large-scale hydrogen deployment. By modelling 81 distinct scenarios, the TERA paper offers valuable insights into cost fluctuations. It identifies the most influential factors affecting long-term viability, thereby strengthening the robustness of our trillion-dollar cost estimates.
10. Total Expenditure Comparison Across Hydrogen Farms Scenarios
The comparison of the four hydrogen farm scenarios reveals clear cost differences depending on the type of electrolyser and the capacity of the turbines used, as shown in . The Alkaline + 600 MW CCGT setup has a total cost of $1.2166 trillion, made up of $0.8156 trillion in capital investment and $0.401 trillion in operational and maintenance expenses. Switching to a larger 900 MW CCGT reduces the overall cost slightly to $1.2136 trillion, demonstrating how larger-scale turbines can lower costs through economies of scale. On the other hand, the PEM + 600 MW CCGT option is the most expensive, with total spending reaching $1.5214 trillion, mainly due to the higher costs of PEM equipment and maintenance. Upgrading this setup to 900 MW CCGTs reduces the total cost slightly to $1.519 trillion, again demonstrating how scaling up improves cost efficiency. In summary, while PEM technology provides advantages in terms of compact design and performance, it is noticeably more expensive than alkaline alternatives, and the benefits of scaling turbine capacity are evident across all configurations.
. Total Expenditure Comparison Across Hydrogen Farms Scenarios.
11. Comparative Visuals Illustrating Cost-Efficiency Trade-offs and Scaling Trends
illustrates the relationship between electrolyser efficiency and the total cost (CAPEX + O&M over 25 years) across four hydrogen farm configurations. Although PEM systems offer slightly higher efficiency (77%) than their alkaline counterparts (75%), they come with significantly higher total costs, approximately USD 1.52 trillion compared to around USD 1.21 trillion for alkaline systems. This trade-off highlights a critical decision-making factor: marginal gains in efficiency do not necessarily justify the steep increase in overall cost. The visual makes it evident that for contexts prioritising cost-effectiveness over compactness, such as Libya, alkaline systems are more economically viable despite their slightly lower efficiency.
. Cost <i>vs.</i> Efficiency.
examines the response of total system costs to scaling from 600 MW to 900 MW of combined-cycle gas turbines (CCGTs) for both alkaline and PEM electrolyser technologies. The trend reveals a modest but consistent decrease in total cost with scale-up, demonstrating clear economies of scale. For alkaline systems, increasing turbine size reduces cost from USD 1.2166 to 1.2136 trillion, while PEM systems also show a slight cost reduction from USD 1.5214 to 1.519 trillion. This scaling insight is crucial for stakeholders seeking to minimise per-unit costs in large-scale deployments and confirms that larger systems offer enhanced financial efficiency regardless of technology type.
. Cost <i>vs.</i> System Scale.
Unlike previous techno-economic assessments that typically focus on static system modelling or high-level cost estimations, this study introduces a dynamic, modular framework specifically designed for ‘hydrogen farm’ configurations. It integrates plant-level scaling behaviours, site-specific load profiles, and adaptive infrastructure sizing—features that are often overlooked in earlier models. By incorporating parametric flexibility and aligning infrastructure with export contract timelines and renewable availability, this approach enables for more accurate optimisation of cost-to-output ratios across different deployment scales and regions.
12. Parametric Sensitivity Matrix (PSM)
A Parametric Sensitivity Matrix is a powerful extension to the scenario-based TERA approach, designed to systematically quantify how changes in each input parameter, such as CAPEX, efficiency, electricity cost, and capacity factor, affect the levelized cost of hydrogen (LCOH). This matrix format offers a comparative, at-a-glance overview of parameter weightings under different technology configurations (AWE
vs. PEM), allowing researchers and investors to prioritise factors most critical to cost control. For instance, our study already identifies CAPEX and electrolyser efficiency as the dominant cost drivers. The PSM formally captures this influence numerically, as shown in the . By doing so, the methodology introduces a transparent, reproducible, and scalable evaluation tool for hydrogen system modelling—something rarely integrated into prior techno-economic assessments focused solely on point-based results or non-quantified sensitivities. Moreover, this structure supports adaptation to other regional contexts by updating the parameter ranges and weights, enhancing transferability.
.
Parametric Sensitivity Matrix.
| Parameter |
Impact on LCOH (AWE) |
Impact on LCOH (PEM) |
| CAPEX |
High (43%) |
High (46%) |
| Efficiency |
Medium (28%) |
High (33%) |
| Electricity Cost |
Medium (21%) |
Medium (16%) |
| Capacity Factor |
Low (8%) |
Medium (12%) |
13. Implications for Decision-Makers
The comparative analysis between alkaline electrolyser farms and PEM electrolyser farms provides key insights for energy sector decision-makers. This knowledge supports the adoption of diversified energy strategies, enabling a balanced approach that considers the advantages and limitations of each technology. Combining both AEW and PEM systems in hydrogen production enhances the overall resilience and reliability of hydrogen-based energy generation [
31].
Recognising the technological maturity and innovation levels of hydrogen systems is essential for decision-makers to develop effective adoption strategies. Mature technologies, such as alkaline and PEM electrolysers, provide reliable, well-established solutions. This understanding supports risk mitigation by promoting diversification, reducing dependence on a single hydrogen source, and aligning energy strategies with long-term sustainability objectives [
32].
This report further elucidates the potential avenues for economic development, wherein hydrogen farms exhibit significant promise for substantial local economic advancement and the generation of employment opportunities [
33].
Decision-makers can amalgamate the energy strategy with regional economic imperatives, consequently facilitating the generation of employment opportunities and the advancement of community development. The process of financial planning is made more straightforward as insights into initial capital expenditures and recurring operational costs for each model enable decision-makers to allocate resources with greater efficiency.
The research outcomes offer valuable insights into renewable energy sources characterised by diminished environmental repercussions for individuals engaged in decision-making processes aimed at mitigating greenhouse gas emissions. Policymakers may leverage this empirical data to formulate evidence-based energy policies that advocate for the judicious integration of diverse renewable energy sources. Regulatory frameworks have the potential to encourage the adoption of technologies that align with overarching sustainability objectives.
The adaptability and expandability of each model are accentuated, enabling decision-makers to effectively respond to fluctuating hydrogen production requirements and administer its distribution according to regional demands or for export purposes. The involvement of the community is of paramount importance, and we underscore the imperative of tackling apprehensions regarding visual and auditory repercussions to foster robust relationships with the local populace.
In conclusion, policymakers have the capacity to render enlightened decisions by evaluating the distinct ramifications associated with each hydrogen generation framework. This examination lays the groundwork for the development of holistic and robust methodological strategies that tackle environmental, economic, and technological aspects, thereby guaranteeing a sustainable and effective energy future.
14. Discussion
In this hydrogen farm economic model, land acquisition costs were intentionally excluded based on the assumption that development would occur on publicly owned land. This is particularly relevant to Libya, where vast areas of uninhabited desert, largely state-owned, are readily accessible for such infrastructure projects.
While this assumption aligns well with Libyan conditions, it is critical to recognise how overlooking land costs can significantly distort economic viability assessments when applying the model to other global regions. In countries with dense populations, competitive land markets, or fragmented ownership structures, such as those found in Western Europe, Japan, or urban parts of China and India, land acquisition can be a major cost driver. Research shows that land-related expenses, including purchase or lease agreements, legal fees, environmental offsets, and compensation for displaced stakeholders, can constitute up to 10–20% of total capital expenditures (CAPEX) in renewable energy projects [
34,
35].
Moreover, land acquisition challenges, such as disputes, delays in permitting, or opposition from local communities, can lead to significant time and budget overruns, undermining project timelines and investor confidence. Such risks are often underappreciated in models that assume free or easily available land.
Thus, while Libya offers a unique strategic advantage by minimising land-related barriers, it’s crucial to explicitly state that this is a context-specific benefit and may not generalise to other regions.
14.1. Justification for Scale and Key Assumptions
To justify the large-scale deployment of electrolysers (510–519 GW), our model is grounded in Libya’s 2020 national energy export data, which quantified the total energy content of oil exports in petajoules. This figure was then converted into an equivalent hydrogen energy output, considering electrolyser efficiency (75% for alkaline and 77% for PEM), which directly led to the required electrolyser capacities. Additionally, a 20% capacity factor was used, reflecting expected performance in hybrid solar-wind conditions typical of North African deserts. The model assumes a 25-year lifespan with an O&M cost escalation of 2–3% annually, consistent with IEA standards; however, no further inflation adjustment was applied to capital costs.
14.2. Expanded Sustainability Assessment for Hydrogen Farms
14.2.1. Socio-Economic Impacts beyond General Employment
Large-scale hydrogen infrastructure can generate both direct and indirect jobs across various sectors, including construction, operations, maintenance, and associated supply chains. For example, a recent analysis found that hydrogen investments in developing countries can create up to 30,000 jobs per gigawatt of electrolyser capacity over the plant’s life cycle [
33].
However, specialised hydrogen technologies may create a mismatch between the labor needs and the existing local workforce’s skills. If unaddressed, this could exclude local populations from economic benefits. Bridging this gap would require significant investment in workforce training programs and technical education, particularly in rural or underdeveloped regions such as Libya’s desert areas.
14.2.2. Community-Level Benefits and Risks
Hydrogen farms can contribute to local development by improving infrastructure (e.g., roads, power lines) and creating service demand in adjacent towns. But there are potential drawbacks, especially if community concerns about land use, noise, and safety are not adequately addressed. Lessons from Kenya’s Kipeto Wind Project highlight that successful land-intensive energy projects must be paired with robust community engagement strategies and fair compensation to avoid backlash or delays [
35].
14.2.3. Skills Gap and Educational Requirements
Hydrogen energy projects rely on engineers, system operators, and safety experts, who are often in short supply in many developing countries. Without targeted educational policies and industrial partnerships, the region could become overly reliant on foreign labor and technology providers, therby undermining long-term self-reliance. This challenge was echoed in Southeast Asian projects where land access was easier than securing skilled labor and ensuring technology transfer [
34].
14.3. Addressing Environmental Challenges in Hydrogen Production
While hydrogen is often celebrated as a clean energy carrier, its production isn’t without environmental trade-offs. Key concerns include water consumption, land use, and the generation of waste byproducts. To ensure hydrogen systems are truly sustainable, especially in regions with limited natural resources, strategic mitigation approaches are essential.
14.3.1. Tackling Water Use in Electrolysis
Producing hydrogen through electrolysis consumes a substantial amount of water, about 9 L for every kilogram of hydrogen produced. In water-scarce regions like North Africa and the Middle East, this poses a significant challenge. One promising solution is substituting freshwater with treated wastewater or seawater. Technologies like reverse osmosis and advanced membrane systems make this feasible by purifying non-potable water for use in electrolysis. Some innovative studies, such as supercritical water gasification, have even demonstrated the ability to convert wastewater sludge into hydrogen, addressing two key issues simultaneouslywater scarcity and waste management [
36].
14.3.2. Turning Waste into Feedstock
Hydrogen production doesn’t always have to rely on virgin materials or land-intensive crops. An increasingly viable pathway is converting existing waste, such as municipal solid waste (MSW), agricultural residues, or old tyres, into hydrogen. This approach not only reduces land pressure but also addresses waste disposal challenges. For instance, pyrolysis-gasification of waste tyres has shown high hydrogen yields while diverting harmful materials from landfills. Multi-output systems that convert MSW into hydrogen while generating electricity or heat offer both environmental and energy efficiency benefits [
37].
14.3.3. Managing Byproducts Sustainably
Hydrogen production processes, particularly those involving electrolysis or biomass conversion, can generate solid and chemical residues. Without proper disposal, these byproducts could undermine the environmental benefits of hydrogen itself. A more sustainable approach involves integrating circular economy principles, finding secondary uses for byproducts rather than discarding them. For example, biochar produced from gasification can be used to improve soil health. Likewise, advanced catalytic systems in aqueous-phase reforming processes can help minimise harmful emissions while efficiently managing residual compounds [
38].
14.3.4. Rethinking Land Use
Establishing hydrogen farms at scale can have a noticeable footprint, potentially encroaching on farmland or natural habitats. To mitigate this impact, project developers are increasingly exploring co-location strategies, installing electrolysers alongside solar farms or on rooftops, and making use of underutilised or contaminated land (brownfields). Offshore and urban hydrogen systems, while still emerging, offer high-density alternatives that dramatically reduce the land requirements of traditional installations. Life cycle assessments support these approaches, highlighting their role in preserving valuable land resources while supporting clean energy goals [
39].
14.4. Realism, Financing, and Timeline Analysis
The proposed hydrogen farm in Libya, with a projected capital cost nearing USD a trillion, raise critical questions about its practical feasibility within a single national economy. While the ambition aligns with global decarbonisation goals, implementing such a vast infrastructure project demands a deeper examination of realism, financing, and timelines. Here is an evidence-based exploration of these issues:
14.4.1. Practical Implementation in Libya
Implementing a hydrogen farm of this scale would require a national effort equivalent to several times Libya’s annual GDP. Even under optimistic conditions, such projects are typically phased across decades. For example, global energy megaprojects like the Noor Ouarzazate Solar Complex in Morocco took over 10 years to develop, and that project cost less than USD 10 billion. According to Mohamadi (2021), successful project execution in developing countries often depends on strong public-private coordination, robust legal frameworks, and reliable institutions for project oversight [
40].
14.4.2. Financing Mechanisms for Trillion-Dollar Hydrogen Projects
Given the scale, Libya cannot fund the project solely through public budgets or sovereign debt alone. However, several mechanisms exist to attract international investment
Project Finance and Public-Private Partnerships (PPP)
Project finance enables non-recourse funding, where the project’s revenue stream is used to repay lenders. This model isolates financial risk and is especially useful for energy projects. Mohamadi (2021) notes that project finance is the most common form used in renewable energy infrastructure due to its ability to handle large-scale capital and long-term returns.
PPP models, especially Build-Operate-Transfer (BOT) and Public-Private Partnerships, are already being used for infrastructure across Africa, with mixed success. Bai & Zhang (2020) found that PPPs are especially effective for hydrogen infrastructure in capital-constrained countries due to their ability to share risks across stakeholders [
41].
Development Banks and Blended Finance
Institutions such as the World Bank, African Development Bank, and International Finance Corporation (IFC) can provide concessional loans, technical support, and risk guarantees. Bond (1994) emphasised that IFC-financed infrastructure projects have grown rapidly in developing nations and can unlock significant private capital with proper risk mitigation [
42].
Project finance and public-private partnerships (PPPs) offer a practical solution for Libya by attracting private investment while limiting financial risk to the government. This approach allows large-scale hydrogen projects to move forward without placing pressure on national budgets, making it a strong fit for Libya’s economic situation.
14.4.3. Timeline for Implementation
Hydrogen megaprojects typically unfold over 15–30 years, depending on institutional readiness, financing, and infrastructure maturity. A phased approach, starting with pilot projects (1–5 GW scale), followed by progressive expansions, would be more realistic and help attract incremental investment while building local capacity.
Case in point: Saudi Arabia’s NEOM green hydrogen project, targeting 4 GW by 2030, has committed USD 8.4 billion in its first stage alone and involves a partnership between ACWA Power, Air Products, and NEOM itself, a clear example of gradual, high-stakes investment pacing [
43].
14.5. Comparative Analysis of Hydrogen Farms vs. Other Low-Carbon Export Pathways for Libya
Libya’s geographic and solar potential positions it as a promising exporter of clean energy. However, to support strategic policymaking, it’s important to weigh the case for large-scale hydrogen farms against other non-carbon energy export options, such as direct renewable electricity export, and emerging technologies like helium-based closed-cycle gas turbines.
14.5.1. Economic Viability
Hydrogen Farms: Hydrogen production (especially green hydrogen via electrolysis) is capital-intensive. Projects often require USD billions in up-front investment due to the cost of electrolysers, renewable generation, water treatment, storage, and transportation infrastructure. However, hydrogen is a flexible and globally tradable commodity. Once liquefied or converted into ammonia, it can be exported via ship to distant markets. The global hydrogen trade is expected to scale significantly by 2030, particularly driven by demand from Europe and East Asia [
44].
Direct Renewable Electricity Export: Electricity export, particularly via high-voltage direct current (HVDC) cables, is less capital-intensive and far more energy-efficient. There are fewer conversion losses compared to hydrogen (transmission losses can be <3% per 1000 km, versus ~30–40% energy loss in hydrogen conversion and logistics) [
45]. However, this pathway requires stable regional political relations and compatible grid infrastructure—challenges that Libya may face with its neighbours.
Helium Closed-Cycle Gas Turbines (He-CCGT): These remain largely at experimental or pilot scale, especially in the context of renewable integration. While they offer theoretical thermodynamic efficiency and low emissions, they are not yet commercially viable for energy export, and there’s limited market demand for helium-based power exports [
46].
14.5.2. Strategic Fit for Libya
Hydrogen Farms: Hydrogen can be produced in remote desert areas, independent of the national grid, and exported via ports, ideal for Libya’s vast, underutilised land and weak internal grid. It also supports diversification of the economy beyond oil. However, hydrogen production requires large volumes of water, which necessitates the use of seawater and the incorporation of desalination [
47]. Libya’s Mediterranean coastline is approximately 1770 km long, the longest in North Africa.
Electricity Export: This route might be faster to deploy if regional interconnectors are developed (e.g., to Egypt or Southern Europe via Tunisia). However, it relies on geopolitical stability, grid harmonisation, and Libya’s ability to stabilise and modernise its domestic transmission systems. Without such upgrades, Libya may struggle to generate surplus electricity for export [
48].
Helium-Based Technologies: Currently, these technologies are better suited for internal efficiency improvements or niche applications (e.g., space cooling or high-efficiency nuclear) rather than national-scale exports. Their strategic export role for Libya remains minimal for now [
49].
14.6. Preliminary Profitability Considerations and Future Financial Outlook
To enhance the economic depth of the techno-economic environmental risk analysis (TERA), we recognise the value of evaluating profitability metrics such as revenue, NPV, and IRR. Although the primary emphasis in this study was on CAPEX and long-term O&M costs, a supplementary profitability perspective was also considered using the hydrogen output capacity derived from installed electrolysers and paired CCGT infrastructure. Based on international hydrogen market trends, export prices ranging from $3 to $6 per kg can be reasonably applied. When cross-referenced with electrolyser production capacity and expected availability (capacity factor), the model estimates annual hydrogen revenues that can reach tens of billions USD under favourable market conditions. While this initial study does not yet calculate IRR or NPV in detail, the cost sheets already incorporate a 25-year operational lifespan and factor in escalating O&M expenses. Future iterations of this model will integrate projected hydrogen selling prices, discount rates, and inflation assumptions to provide a comprehensive financial outlook and enabling global policymakers to assess market competitiveness and long-term profitability with greater confidence.
15. Conclusions
This study presents a thorough economic evaluation of large-scale hydrogen farms utilising two primary production technologies: alkaline electrolysers and proton exchange membrane (PEM) electrolysers, each assessed in conjunction with 600 MW and 900 MW combined-cycle gas turbine (CCGT) systems. The analysis provides critical insights into capital and operational costs, revealing that although PEM-based farms demand higher upfront investment, they offer improved land-use efficiency. In contrast, alkaline systems present lower capital requirements, especially at larger scales, illustrating the benefits of economies of scale.
All scenarios incorporate essential infrastructure, such as hydrogen storage and comprehensive safety systems, resulting in a realistic economic model designed for a 25-year operational period. The framework addresses both immediate and long-term financial needs, equipping decision-makers with practical benchmarks for investment planning and infrastructure development. While land acquisition costs were excluded, assuming access to public land, this variable could notably affect the feasibility of similar projects in other regions.
The results are particularly applicable to oil-exporting nations like Libya, where shifting to low-carbon energy exports can contribute to climate goals, diversify the economy, and enhance energy security. The use of established technologies, such as alkaline and PEM electrolysers further supports system stability and reduces reliance on a single solution through technological diversity.
This research highlights significant differences between the two technologies in terms of scale and economic performance. PEM electrolysers, while technologically advanced and space-efficient, come with a much higher price tag, both for setup and ongoing maintenance. This makes them more appropriate for areas where space is scarce, but funding is more flexible. In contrast, alkaline systems are more financially accessible and show clear economic advantages as project size increases. The 900 MW alkaline configuration, for instance, becomes slightly more cost-effective per megawatt than the 600 MW option, demonstrating how scaling can drive down costs. For a country like Libya, with abundant land and tighter budget constraints, this positions alkaline technology as a more practical solution. These conclusions provide a valuable foundation for decision-makers aiming to match hydrogen production strategies with national development priorities and available resources.
In conclusion, this research offers a strong foundation for strategic decision-making in the clean energy sector and highlights the viability of hydrogen as a scalable, sustainable energy solution. Future work should incorporate real-world cost factors and adapt to evolving market conditions to improve the relevance and effectiveness of these models globally. The next phase of this research involves conducting a sensitivity analysis as outlined in the paper titled “Techno-Economic Environmental Risk Analysis in Hydrogen Farms” (TERA). This analysis is essential for testing the robustness of the findings, identifying the most influential cost drivers, and equipping decision-makers with a more nuanced understanding of the investment risks associated with large-scale hydrogen projects. It is also important to note that the cumulative cost method used in the baseline study, where projected operation and maintenance (O&M) costs over 25 years were aggregated with capital expenditure, served as a broad techno-economic benchmarking approach. However, a more refined and widely accepted method, the Levelized Cost of Hydrogen (LCOH), was later applied in the follow-up TERA study. In that work, future costs were discounted and calculated on a per unit basis of hydrogen output, enabling a clearer assessment of financial viability and facilitating direct comparisons with global hydrogen benchmarks. This progression allows for a more comprehensive evaluation of the economic performance and competitiveness of hydrogen production systems.
Author Contributions
Conceptualisation, E.A., P.H. and P.P.; investigation, E.A., P.H. and P.P.; writing—original draft preparation, E.A., P.H. and P.P.; writing—review and editing, E.A., P.H. and P.P.; supervision, P.H. and P.P. All authors have read and agreed to the published version of the manuscript.
Ethics Statement
Not applicable.
Informed Consent Statement
Not applicable.
Data Availability Statement
The original contributions presented in this study are included in the article. Further inquiries can be directed to the corresponding authors.
Funding
This research received no external funding.
Declaration of Competing Interest
The authors declare no conflicts of interest.
References
-
1.
Altaf CT, Demir O, Colak TO, Karagöz E, Kurt M, Sankir ND, et al. Decarbonizing the Industry with Green Hydrogen. In Towards Green Hydrogen Generation; Wiley: Hoboken, NJ, USA, 2024; pp. 1–48. doi:10.1002/9781394234110.ch1.
-
2.
Zhou Q, Liao L, Zhou H, Li D, Tang D, Yu F. Innovative strategies in design of transition metal-based catalysts for large-current-density alkaline water/seawater electrolysis.
Mater. Today Phys. 2022,
26, 100727. doi:10.1016/j.mtphys.2022.100727.
[Google Scholar]
-
3.
Félix P, Oliveira F, Soares FJ. Economic Viability Analysis of a Renewable Energy System for Green Hydrogen and Ammonia Production. In Proceedings of the 2024 20th International Conference on the European Energy Market (EEM), Istanbul, Turkiye, 10–12 June 2024; pp. 1–5. doi:10.1109/EEM60825.2024.10608489.
-
4.
Tonon T. What would a US green hydrogen energy economy look like?
Clean Energy 2023,
7, 1148–1172. doi:10.1093/ce/zkad047.
[Google Scholar]
-
5.
Titheridge LJ, Marshall AT. Techno-economic modelling of AEM electrolysis systems to identify ideal current density and aspects requiring further research.
Int. J. Hydrogen Energy 2024,
49, 518–532. doi:10.1016/j.ijhydene.2023.08.181.
[Google Scholar]
-
6.
Dumančić A, Vlahinić Lenz N, Majstrović G. Can Hydrogen Production Be Economically Viable on the Existing Gas-Fired Power Plant Location? New Empirical Evidence.
Energies 2023,
16, 3737. doi:10.3390/en16093737.
[Google Scholar]
-
7.
Rawesat A, Pilidis P. A Preliminary Economic Analysis of the Process of Decarbonising an Oil-Exporting Country: The Case of Libya.
Wind 2024,
4, 395–411. doi:10.3390/wind4040020.
[Google Scholar]
-
8.
Alssalehin E, Holborn P, Pilidis P. Preliminary Assessment of a Hydrogen Farm Including Health and Safety and Capacity Needs.
Energies 2024,
17, 6395. doi:10.3390/en17246395.
[Google Scholar]
-
9.
Alssalehin E, Holborn P, Pilidis P. Assessment of Hydrogen Storage and Pipelines for Hydrogen Farm.
Energies 2025,
18, 1167. doi:10.3390/en18051167.
[Google Scholar]
-
10.
Shiozaki S, Fujii T, Takenaga K, Ozawa M, Yamada A. Gas turbine combined cycle. Advances in Power Boilers; Elsevier: Amsterdam, The Netherlands, 2021; pp. 305–344. doi:10.1016/B978-0-12-820360-6.00006-0.
-
11.
Kineticor. Cascade Power Project. Kineticor Resource Corp. 2024. Available online: https://kineticor.ca/operation/cascade-power-project/?utm_sourc (accessed on 2 July 2025).
-
12.
SSE Thermal. Keadby 2 Power Station. SSE plc. 2024. Available online: https://www.ssethermal.com/flexible-generation/operational/keadby-2/?utm_source (accessed on 2 July 2025).
-
13.
Rawesat A, Mohammed M, Impey S, Pilidis P. Greening an Oil Exporting Country: Libyan Hydrogen, Solar and Gas Turbine Case Study.
Ecol. Conserv. Sci. 2024,
4, 8–11. doi:10.19080/ECOA.2023.04.555633.
[Google Scholar]
-
14.
Reuters. Norway’s Hoegh Maps Out Hydrogen Delivery Plans for Germany. 2025. Available online: https://www.reuters.com/business/energy/norways-hoegh-maps-out-hydrogen-delivery-plans-germany-2025-02-05/?utm_source (accessed on 2 July 2025)
-
15.
Ezechi CG, Sekar LK, Okoroafor ER. Analysing the Levelized Cost of Hydrogen: Leveraging Machine Learning for Evaluating Production Pathways. In Proceedings of the ADIPEC, Abu Dhabi, United Arab Emirates, 4–7 November 2024. doi:10.2118/222850-MS.
-
16.
Franco A, Giovannini C. Recent and Future Advances in Water Electrolysis for Green Hydrogen Generation: Critical Analysis and Perspectives.
Sustainability 2023,
15, 16917. doi:10.3390/su152416917.
[Google Scholar]
-
17.
van’t Noordende H, Ripson P. A One-GigaWatt Green-Hydrogen Plant-Advanced Design and Total Installed-Capital Costs; Institute for Sustainable Process Technology: Amersfoort, The Netherlands, 2022.
-
18.
MEGAWATT EXHIBITION. Gas Turbine World. 2025. Available online: https://gasturbineworld.com/gas-turbine-costs-kw/ (accessed on 7 February 2025).
-
19.
Kakavand A, Sayadi S, Tsatsaronis G, Behbahaninia A. Techno-economic assessment of green hydrogen and ammonia production from wind and solar energy in Iran.
Int. J. Hydrogen Energy 2023,
48, 14170–14191. doi:10.1016/j.ijhydene.2022.12.285.
[Google Scholar]
-
20.
FORENSICS DETECTORS. Hydrogen Gas Leak Detector|High Range 40,000 ppm|USA NIST Calibration. 2025. Available online: https://www.forensicsdetectors.com/products/hydrogen-gas-leak-detector-high-range-40-000-ppm-usa-nist-calibration?srsltid=AfmBOoqHe6Ke56GyxjJPibga4SetYWiW3gijlAM76q8QIjYwFlR2KqXq&utm (accessed on 26 January 2025).
-
21.
Wuxi Yongan Electronic Technology. ATEX Explosion-Proof Digital Fixed Gas Detector Panel Controller O2 H2S NH3 H2 LEL Gas Leak Alarm Detector. 2024. Available online: https://www.alibaba.com/product-detail/ATEX-Explosion-Proof-Digital-Fixed-Gas_62343600582.html?spm=a2700.7724857.0.0.468e63e4YKHNaI (accessed on 26 January 2025).
-
22.
Dongfang Yoyik Engineering Co. L. Hydrogen Overflow Pressure Relief Safety Valve. 2024. Available online: https://yoyik1688.en.made-in-china.com/product/TnKRUxWCaOVp/China-3-5A25-Brass-Hydrogen-Overflow-Pressure-Relief-Safety-Valve.html?utm (accessed on 27 January 2025).
-
23.
MSA The Safety Company. Flame Detector for Hydrogen Applications. 2024. Available online: https://us.msasafety.com/Fixed-Gas-%26-Flame-Detection/Flame-Detectors/FL500-H2-UV-IR-Flame-Detector-for-Hydrogen-Applications/p/000014000600011019 (accessed on 27 January 2025).
-
24.
United Fire. Fire Suppression System. 2024. Available online: https://www.unitedfire.net/clean-agent/fx-amerex-2-5-halotron-amxb385ts (accessed on 31 January 2025).
-
25.
Hiflux. Rupture Disc, High-Pressure Rupture Disc. 2024. Available online: https://hifluxshop.com/product/rupture-disc-high-pressure-rupture-disc-65000-psi/3042/?utm (accessed on 27 January 2025).
-
26.
Safe and Sound Security. Commercial Fire Alarm System Installation Cost. 2025. Available online: https://getsafeandsound.com/blog/commercial-fire-alarm-system-installation-cost/?utm_source=chatgpt.com (accessed on 2 February 2025).
-
27.
NFPA 2. Hydrogen Technologies Code. National Fire Protection Association (NFPA). 2023. Available online: https://www.nfpa.org/codes-and-standards/nfpa-2-standard-development/2 (accessed on 25 February 2025).
-
28.
Emanuele T, Herib B, Raul M, Marcelo C. GREEN HYDROGEN COST REDUCTION SCALING UP ELECTROLYSERS TO MEET THE 1.5 °C CLIMATE GOAL H2O2. 2020. Available online: www.irena.org/publications (accessed on 10 March 2025).
-
29.
Ghadim HV, Canessa R, Haas J, Peer R. Electrolyzer cost projections compared to actual market costs: A Critical Analysis. In Proceedings of the 2023 IEEE PES Innovative Smart Grid Technologies—Asia (ISGT Asia), Auckland, New Zealand, 21–24 November 2023; pp. 1–5. doi:10.1109/ISGTAsia54891.2023.10372757.
-
30.
Hancke R, Bujlo P, Holm T, Ulleberg Ø. High-Pressure PEMWE Stack and System Characterization. In ECS Meeting Abstracts; The Electrochemical Society, Inc.: Pennington, NJ, USA, 2022; pp. 1748–1748. doi:10.1149/MA2022-01391748mtgabs.
-
31.
Guo Y, Li G, Zhou J, Liu Y. Comparison between hydrogen production by alkaline water electrolysis and hydrogen production by PEM electrolysis.
IOP Conf. Ser. Earth Environ. Sci. 2019,
371, 042022. doi:10.1088/1755-1315/371/4/042022.
[Google Scholar]
-
32.
Sadeq AM, Homod RZ, Hussein AK, Togun H, Mahmoodi A, Isleem HF, et al. Hydrogen energy systems: Technologies, trends, and future prospects.
Sci. Total Environ. 2024,
939, 173622. doi:10.1016/j.scitotenv.2024.173622.
[Google Scholar]
-
33.
Bezdek RH. The Hydrogen Economy and Jobs of the Future.
ECS Trans. 2020,
96, 107–120. doi:10.1149/09601.0107ecst.
[Google Scholar]
-
34.
Kennedy SF, Qayyum F. Land Acquisition Governance and Its Implications for Renewable Energy Development in Indonesia and the Philippines.
J. Plan. Educ. Res. 2024,
44, 2056–2067. doi:10.1177/0739456X221147859.
[Google Scholar]
-
35.
NDI FA. Land acquisition, renewable energy development, and livelihood transformation in rural Kenya: The case of the Kipeto wind energy project.
Energy Res. Soc. Sci. 2024,
112, 103530. doi:10.1016/j.erss.2024.103530.
[Google Scholar]
-
36.
Ibrahim ABA, Akilli H. Supercritical water gasification of wastewater sludge for hydrogen production.
Int. J. Hydrogen Energy 2019,
44, 10328–10349. doi:10.1016/j.ijhydene.2019.02.184.
[Google Scholar]
-
37.
Hai T, Alenizi FA, Alshahri AH, Chauhan BS, Metwally ASM, Almujibah HR. Energy and environmental analyses of a sustainable multi-generation municipal solid waste-to-energy integrated system for hydrogen production.
Process Saf. Environ. Prot. 2023,
177, 307–321. doi:10.1016/j.psep.2023.06.030.
[Google Scholar]
-
38.
Jamil F, Inayat A, Hussain M, Ghenai C, Shanableh A, Sarwer A, et al. Green hydrogen production through a facile aqueous-phase reforming technique from waste biomass: A comprehensive review.
Int. J. Hydrogen Energy 2024,
96, 126–146. doi:10.1016/j.ijhydene.2024.11.239.
[Google Scholar]
-
39.
Nnabuife SG, Darko CK, Obiako PC, Kuang B, Sun X, Jenkins K. A Comparative Analysis of Different Hydrogen Production Methods and Their Environmental Impact.
Clean Technol. 2023,
5, 1344–1380. doi:10.3390/cleantechnol5040067.
[Google Scholar]
-
40.
Mohamadi F. Project Finance and Other Financing Forms. In Introduction to Project Finance in Renewable Energy Infrastructure; Springer International Publishing: Cham, Switzerland, 2021; pp. 35–42. doi:10.1007/978-3-030-68740-3_5.
-
41.
Bai W, Zhang L. How to finance for establishing hydrogen refueling stations in China? An analysis based on Fuzzy AHP and PROMETHEE.
Int. J. Hydrogen Energy 2020,
45, 34354–34370. doi:10.1016/j.ijhydene.2019.12.198.
[Google Scholar]
-
42.
Bond G. Financing Private Infrastructure Projects: Emerging Trends from IFC’s Experience; The World Bank: Washington, DC, USA, 1994.
-
43.
Saudi NEOM Green Hydrogen Co. Saudi NEOM Green Hydrogen Co closes deals on $8.4 bln Green Hydrogen Plant. Reuters. 2023. Available online: https://www.reuters.com/business/energy/saudi-neom-green-hydrogen-co-closes-deals-84-bln-green-hydrogen-plant-2023-05-22/ (accessed on 20 June 2025).
-
44.
Kenny J, Timoney D, Syron E. A techno-economic analysis of global renewable hydrogen value chains.
Int. J. Hydrogen Energy 2024,
79, 690–701. doi:10.1016/j.ijhydene.2024.06.377.
[Google Scholar]
-
45.
Mukelabai MD, Wijayantha UKG, Blanchard RE. Renewable hydrogen economy outlook in Africa.
Renew. Sustain. Energy Rev. 2022,
167, 112705. doi:10.1016/j.rser.2022.112705.
[Google Scholar]
-
46.
Schatz M, Wachter M. Thermodynamic modeling of a closed gas turbine process working with Helium and stoichiometric combustion of Hydrogen and Oxygen. In Proceedings of the 13th European Conference on Turbomachinery Fluid dynamics & Thermodynamics, Lausanne, Switzerland, 8–12 April 2019. doi:10.29008/ETC2019-185.
-
47.
Arunachalam M, Yoo Y, Al-Ghamdi AS, Park H, Han DS. Integrating green hydrogen production with renewable energy-powered desalination: An analysis of CAPEX implications and operational strategies.
Int. J. Hydrogen Energy 2024,
84, 344–355. doi:10.1016/j.ijhydene.2024.08.250.
[Google Scholar]
-
48.
Brand B. Transmission topologies for the integration of renewable power into the electricity systems of North Africa.
Energy Policy 2013,
60, 155–166. doi:10.1016/j.enpol.2013.04.071.
[Google Scholar]
-
49.
Scholes C, Ghosh U. Review of Membranes for Helium Separation and Purification.
Membranes 2017,
7, 9. doi:10.3390/membranes7010009.
[Google Scholar]