1. Introduction
The impact of global warming, driven by the rise in greenhouse gas emissions, has become increasingly evident across various regions worldwide, especially since the 2000s [
1]. In particular, ongoing global warming will result in hotter days and fewer cold days, but also retreating glaciers, rising sea levels, and ocean acidification across the southwest Pacific nations. Moreover, more fires will occur, and rainfall intensity will increase; yet, at the same time, more droughts will occur [
1]. The Sixth Assessment Report (AR6) of the United Nations (UN) Intergovernmental Panel on Climate Change (IPCC) identified several key risks in this area. In particular, as regards Australia, the IPCC predicts loss and degradation of coral reefs; loss of alpine biodiversity due to lack of snow cover; loss of forests in South Australia, as well as in southeastern New Zealand; the disruption and decline in agricultural production and increased stress on rural communities in the southwest, south and east of mainland Australia, and an increased heat-related mortality and disease occurrence among both people and wildlife [
1].
Due to the significant effects that climate change could have on the southwest Pacific nations and their population, understanding and forecasting climate variability and change have become critical priorities for the research community [
2]. In particular, over the past century, analyzing precipitation trends has attracted substantial attention. As an example, Salinger and Griffiths [
3] analyzed climate trends from 1861 to 1990 and reported variability in precipitation patterns across different decades. Moreover, work by Salinger et al. [
4] highlighted increases in rainfall in the northeastern parts of the Southern Pacific and decreases in the southwest. Notably, over the last century, eastern Australia has recorded more summer precipitation, while parts of southwestern Australia have seen reduced winter rainfall [
4,
5]. For the period between 1961 and 1998, a general decline in annual total rainfall has been observed in the South Pacific region. However, some stations in French Polynesia and parts of New Zealand recorded increases in total rainfall [
6], while at seasonal scale, a positive trend in winter and in spring and a negative trend in summer and autumn have been detected [
7].
As regards Australia, its rainfall patterns, characterized by significant spatial and temporal variability, have been the focus of numerous studies conducted at national and regional scales [
8]. Considering the whole of Australia, Nicholls and Lavery [
9] analyzed 20th century rainfall trends across 191 high-quality stations and observed a sharp increase in summer rainfall in eastern Australia around 1950, accompanied by a gradual decline in winter rainfall in southwestern Australia. Suppiah and Hennessy [
10] explored trends in extreme rainfall, total rainfall, and dry days across 125 stations and reported an upward trend in extreme and total rainfall during the summer months. In winter, rainfall also increased except in far southwestern Western Australia and inland Queensland. Using data from 379 high-quality stations, Hennessy et al. [
11] identified significant increases in annual rainfall, especially in Victoria, the second most populous state of Australia. Smith [
12] revealed a positive long-term trend in Australian rainfall between 1901 and 2002, largely driven by increases in summer rainfall in western, northern, and central Australia, while winter rainfall in southwestern Australia showed notable declines. Alexander et al. [
13] reported that trends in extreme rainfall across most Australian regions exceeded those in average rainfall. Liu et al. [
14] investigated spatial and temporal patterns in annual and seasonal rainfall, as well as extreme and non-extreme events across Australia. In the last years, several studies have been performed at regional scales. Chowdhury and Beecham [
15] analyzed monthly rainfall trends across 10 Australian rainfall stations and observed an increasing trend year observation period. Similarly, Hope et al. [
16] and Cai and Cowan [
17] found that annual rainfall in southeastern Australia has significantly decreased since the 1950s. Davis and Hanna [
18] examined rainfall changes in northern Australia from 1911 to 2013, noting that the region has become wetter. Yildirim and Rahman [
19] studied rainfall and drought patterns at 45 stations in southeastern Australia and observed a rise in annual rainfall from 1920 to 2019, even though the period 1970–2019 showed a significant decline in rainfall. Rauniyar and Power [
20] examine rainfall variability and change in three sub-regions of the state of Victoria in Australia. Finally, Fu et al. [
21] analyzed the trend and the variability of rainfall characteristics influencing streamflow across the state of Victoria in southeastern Australia.
Within this context, while previous studies on Australian rainfall trends have predominantly focused on regional or sub-national scales, often using limited temporal windows or aggregated seasonal data, this study offers a comprehensive and high-resolution analysis of rainfall variability across the entire Australian continent by analyzing the monthly, seasonal and annual rainfall series recorded in the period 1920–2020.
2. Study Area and Data
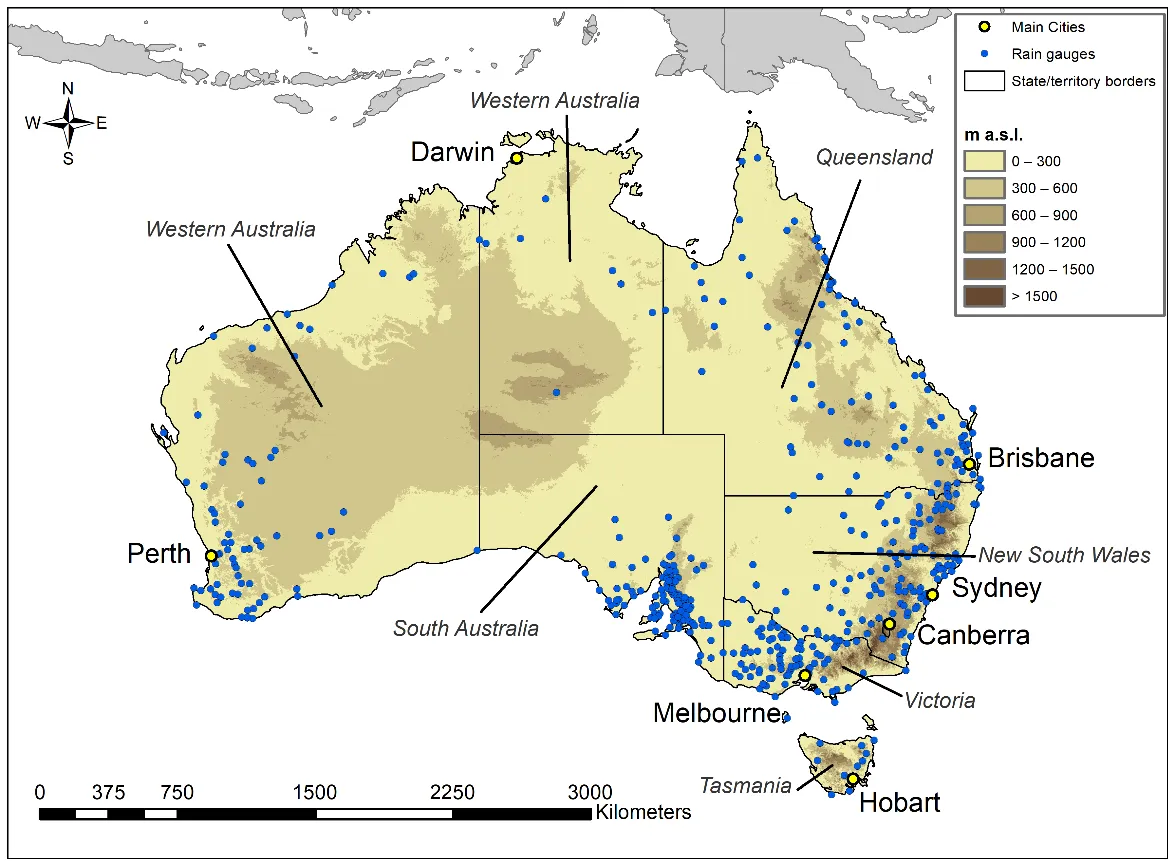
Located in the southern hemisphere, Australia is the sixth largest country in the world with a surface area of over 7,688,000 km
2, stretching from 10°41′ S to 43°39′ S and 113°09′ E to 153°39′ E (). Most of the territory is made up of plains and plateaus with an average altitude of 200 m. The Australian Alps are Australia’s highest mountain range (e.g., the Great Dividing Range), located in southeastern Australia between the states of New South Wales and Victoria, and are the only Australian mountain system with peaks over 2000 m snowcapped in winter. The major waterways of the entire Oceanic continent lie within the Australian territory; however, since the land is predominantly dry and arid, no major hydrographic networks have developed [
22].
Four basic factors influence Australia’s climate: the size and shape of the country causing considerable changes in air masses; the topography of the country and its effect on the movement of air masses; its position between the Pacific Ocean to the east and the Indian Ocean to the west that characterize and influence the coastal climate; and its location corresponding to a subtropical high-pressure zone. About 50% of the country has an average annual rainfall of less than 300 mm per year, and 80% has less than 600 mm per year. The highest rainfall is registered in the northeast and north coast of the country and reaches 3800 mm per year, while the lowest is registered in the Simpson Desert with values lower than 150 mm per year. In general, there are five main rainfall regimes that characterize the continent. Northern Australia has an extremely wet monsoon season with dry winters. Northeastern Queensland has the highest annual rainfall of the continent. In southeastern Queensland and northeastern New South Wales, summer is wet, and winter is dry. Southeastern Australia, including parts of Victoria, eastern New South Wales, and Tasmania, has a relatively uniform rainfall regime. The southwest of Western Australia has wet winters and dry summers, but the Mediterranean climate causes a change in the subtropical high-pressure zone and the formation of westerlies [
22].
The data used for this study were extracted from the official website of the Australian government, the Bureau of Meteorology (BOM), which is responsible for collecting and publishing hydrometeorological data for the Australian territory (http://www.bom.gov.au/, accessed on 31 December 2024). From the lists of national or state stations collecting hydrometeorological data, those that have been in operation for more than 100 years were selected. Then, records were checked for errors, metadata were analyzed for inhomogeneities, and stations with low-quality records or with a significant number of missing data (more than 5%), were not used. Finally, 505 sets of observations were selected, covering the period from 1920 to 2020 ().
. Study area with the selected rain gauges, the main cities and the different states.
3. Materials and Methods
The Theil–Sen estimator [
23] and the Mann–Kendall test [
24,
25] have been selected, among the several non-parametric tests for trend detection, for the assessment of the slope of the trend and of its statistical significance, respectively.
As regards the Theil–Sen estimator, for
N pairs of observations, the slope estimates can be evaluated as follows:
where
Pj and
Pi are the observations at time
tj and
ti (
tj >
ti), respectively.
The Sen's estimator of the slope is the median of these
N values of
Qi, and is calculated as:
The
Qmed value reveals both the sign of the trend behavior and the magnitude of the trend.
As regards the Mann–Kendall test,
For a number of data (
n) larger than 10, the standard normal test statistic can be evaluated as follows:
in which
S is the test statistic and
Var (S) is the variance of
S computed as:
where
P is the observation at times
k and
j (with
j >
k),
ti is the number of ties of extent
i and
m is the number of tied rank groups.
By applying a two-sided test, the significance of the trend can be assessed. In this work, the precipitation series were analyzed considering a
p-value = 0.05.
4. Results
4.1. Summary of the Trend Results
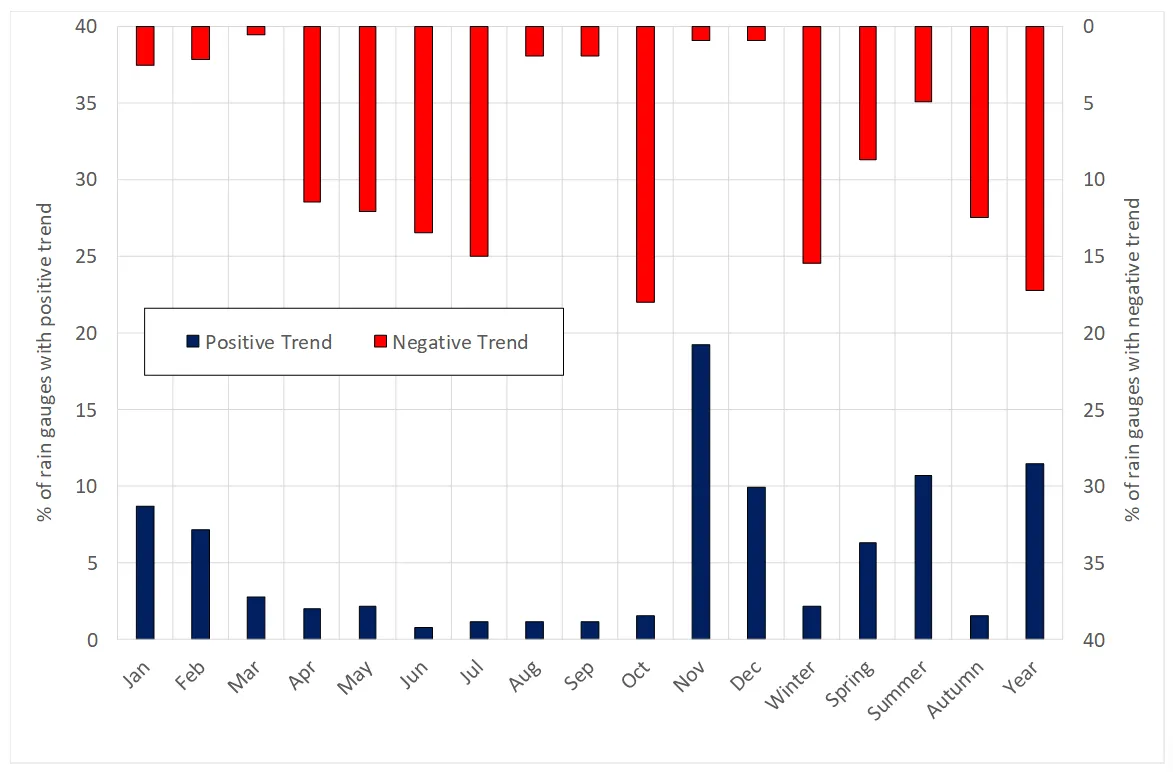
By analyzing the percentage of rain gauges showing significant trends, it is possible to detect the temporal aggregations most affected by increases or decreases in precipitation (
).
Figure 2. Percentages of the rain gauges showing positive or negative trends.
On the seasonal scale, only the summer season showed a higher percentage of positive trend, detected in 10.7% of the rain gauges, than a negative one (5% of the rain gauges). On the contrary, in the other seasons, negative trends prevail, especially in winter (15.4% of rain gauges against 2.2%) and autumn (12.5% and 1.6% of negative and positive trends, respectively). The results of the analysis for the spring season showed 76 stations with a presence of a trend, accounting for about 15% of the total, with negative and positive trends detected in 8.7% and 6.3% of the rain gauges, respectively (
). Seasonal results reflect the ones obtained on a monthly scale. As an example, the spring months showed a marked negative trend in October (18% of the rain gauges). At the same time, a high percentage of rain gauges with positive trends in November (19.2%), thus confirming the balance between negative and positive trend values detected in this season. Also, in summer, the results have been confirmed by the monthly analyses, which showed a majority of positive trends in December, January, and February (9.9%, 8.7%, and 7.1% of rain gauges, respectively). The decrease in rainfall identified in autumn and winter is mainly due to the negative trends identified between April and July. In fact, in autumn, negative trend values have been identified especially in April and May in 11.5% and 12.1% of the rain gauges, respectively, whereas positive values have been detected in about 2% of the rain gauges for the different months. Winter showed the highest percentage of negative trends on the seasonal scale; results for June and July presented a majority of negative trends identified in 13.5% and 15% of the rain gauges, respectively, while only about 1% showed positive values (
). Finally, on the annual scale, a prevailing negative trend has been detected. In fact, 17.2% and 11.5% of the rain gauges showed negative and positive trends, respectively (
).
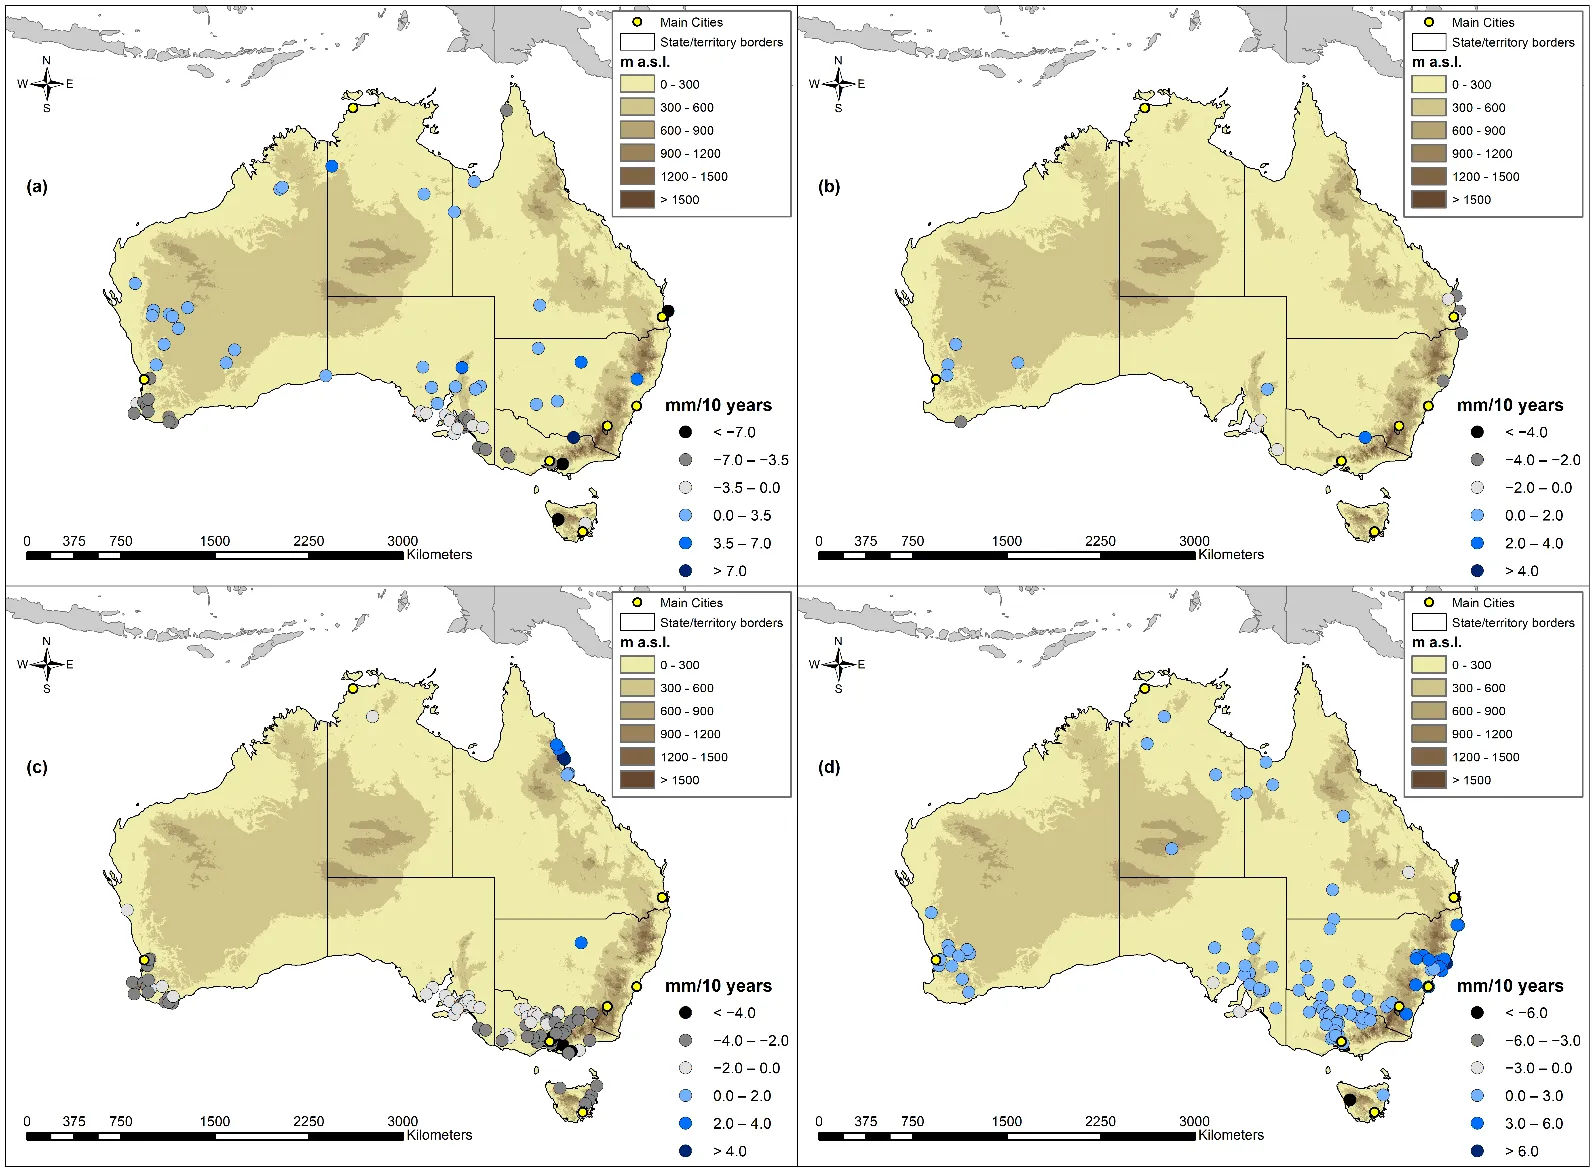
4.2. Spatial Results of the Trend Analysis for Spring
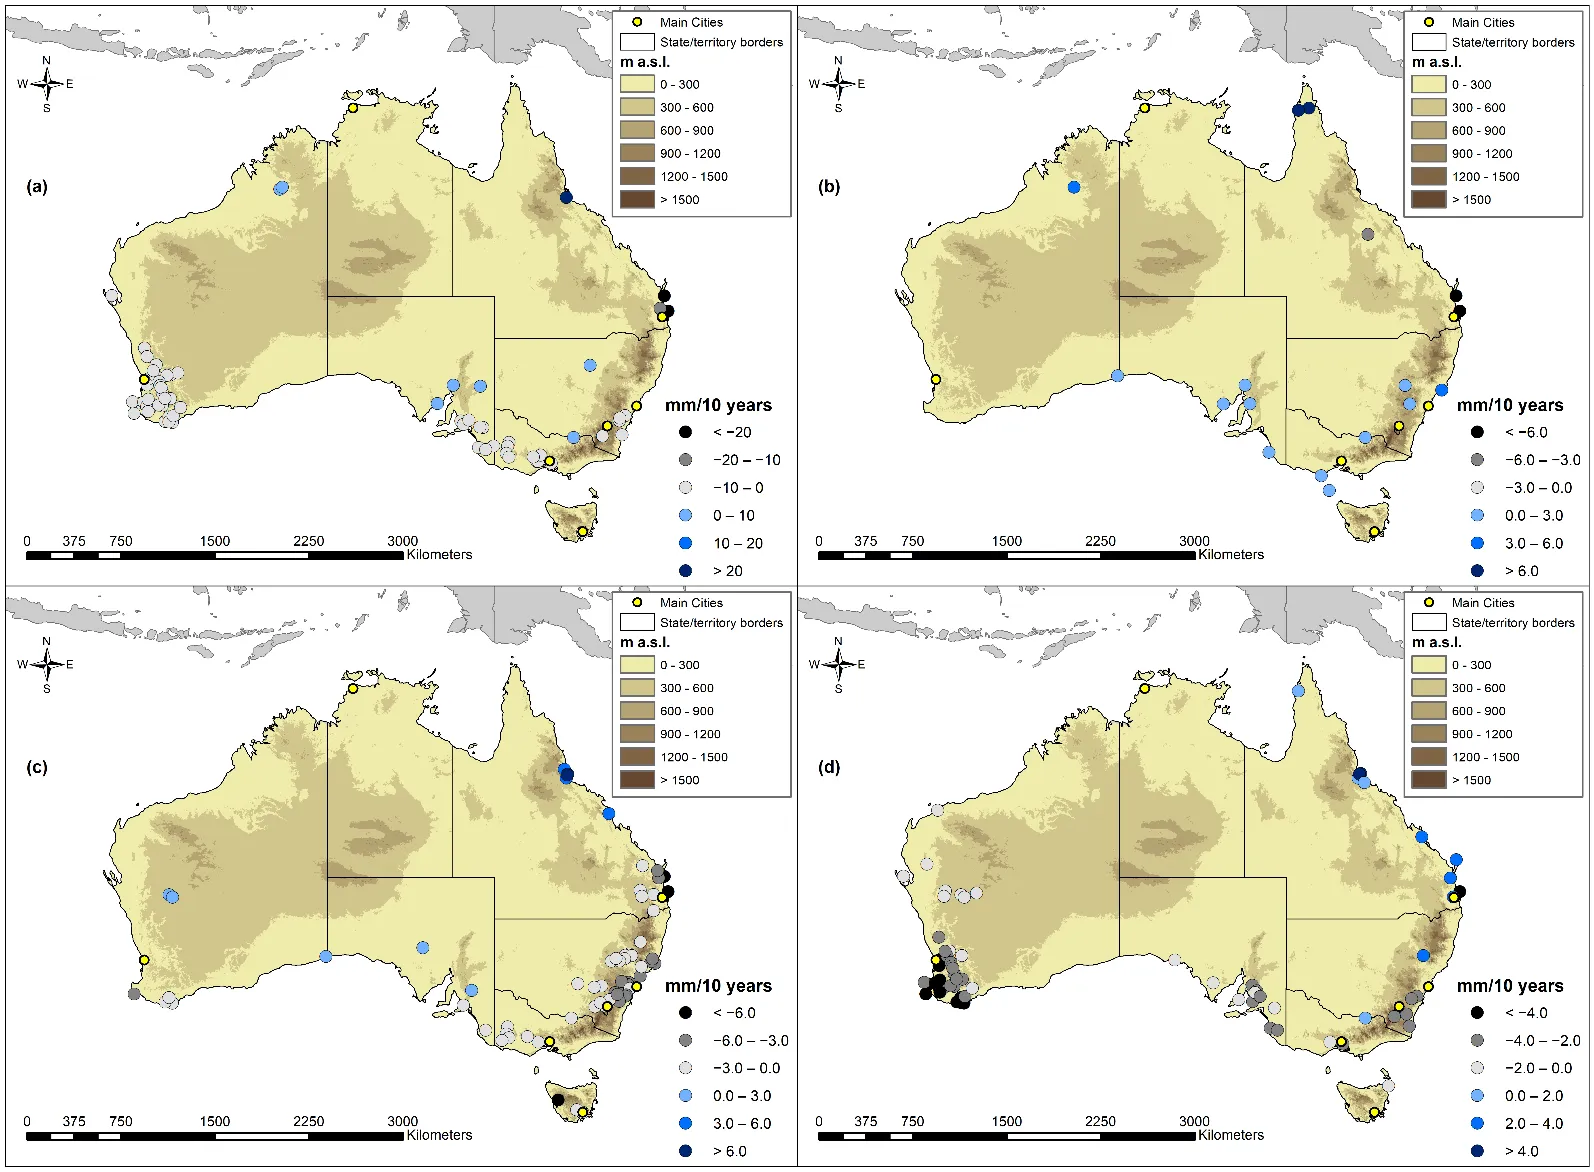
The spatial analyses of the spring trends showed a rainfall reduction, particularly along the coasts in southern Western Australia near the cities of Perth and Augusta and in Victoria, especially around Melbourne (
a).
. Spatial results of the trend analysis for: (<b>a</b>) Spring; (<b>b</b>) September; (<b>c</b>) October; (<b>d</b>) November.
They also resulted notably in Tasmania, near the city of Queenstown, where the largest decreases were recorded. By contrast, increasing trends were observed in the internal areas, with the highest positive values detected in Victoria (in the Alpine National Park) and in New South Wales (near Sydney). Results for September showed only a few significant trends, with negative values mainly identified in the eastern side of Australia, across Queensland and New South Wales (
b). October showed a large number of rain gauges with negative trends (18%), concentrated almost exclusively in southern Western Australia, including Perth, Augusta, and the city of Denmark, in southern South Australia, near the city of Adelaide and Ngarkat Conservation Park, and throughout Victoria, and interestingly, the city of Melbourne and the Alpine National Park (
c). Conversely, results for November showed increasing trends (in 19.2% of rain gauges) distributed throughout Australia, with the largest increases in Adelaide and in the Australian Capital Territory (
d).
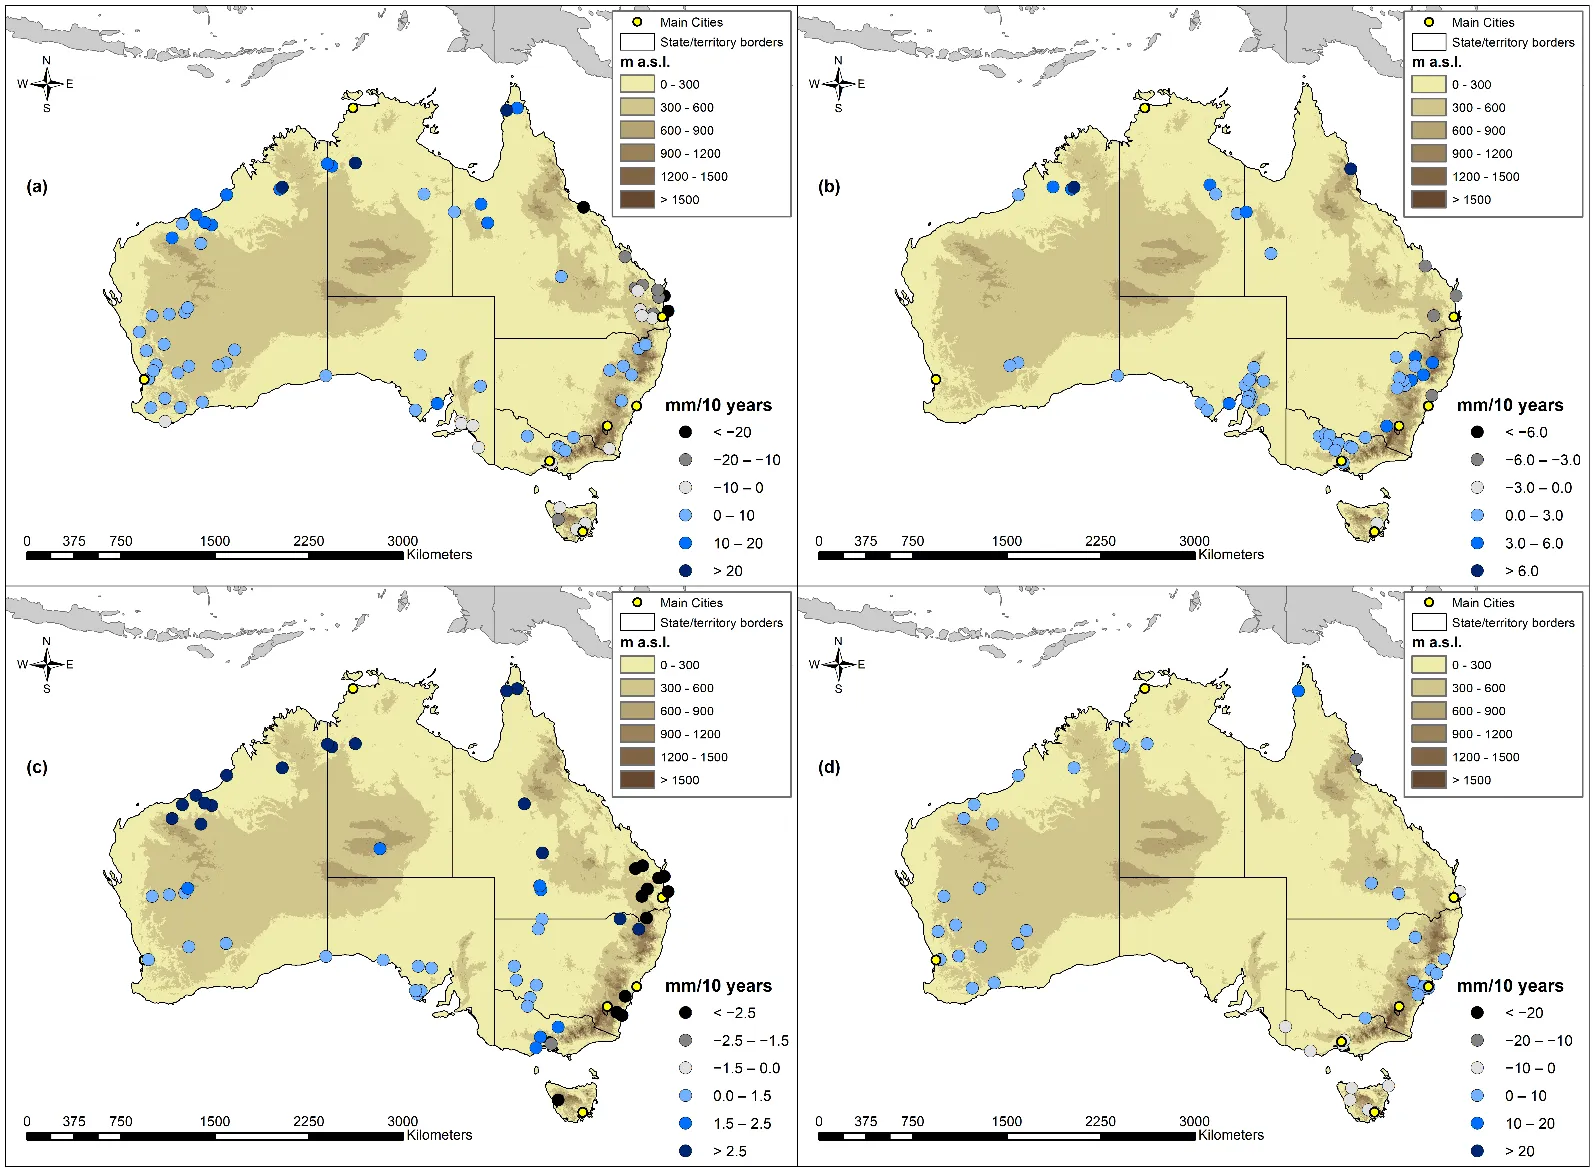
4.3. Spatial Results of the Trend Analysis for Summer
In summer, results showed mostly increasing trends along the coastline, with the largest increases in Jardine River National Park (Queensland) and the largest decreases on the coasts of the same region, near the city of Townsville and K'gari. Negative trend values have also been identified in the coastal areas of South Australia, Victoria, and Tasmania, especially in the Franklin-Gordon Wild Rivers National Park (
a). In December, results showed an almost total increase in precipitation (9.9% of the rain gauges), recorded throughout Adelaide, Tumby Bay, and Ord River Regeneration Reserve in northern Western Australia, but with the highest values still on the coastal areas, at Port Duglas in northern Queensland. Few negative records were registered on the south coasts of Queensland, in Great Sandy National Park, and Tasmania, near Hobart (
b).
. Spatial results of the trend analysis for: (<b>a</b>) Summer; (<b>b</b>) December; (<b>c</b>) January; (<b>d</b>) February.
The spatial distribution of the trend results in January is similar to the one obtained in December, with increases recorded especially in northern Western Australia, interesting the Karlamilyi National Park, and in northern Australia, in the Fish River Gorge Block National Park. On the contrary, decreases were recorded on the southern coasts of Queensland, near Brisbane and the Barakula State Forest, and in the coastal area of Sydney (
c). In February, positive values were identified in the northwestern and easternmost sides of Australia (Western Australia, Northern Territory, and New South Wales), while negative trends mainly involved Victoria and Tasmania (
d).
4.4. Spatial Results of the Trend Analysis for Autumn
The autumn season showed a general downward trend in the rainfall values. The largest decreases were recorded on the Queensland coast, near Brisbane and Great Sandy National Park, but also in southern Western Australia, where a large number of rain gauges showed negative trends in the Dwellingup State Forest and in Victoria, near Melbourne (
a).
. Spatial results of the trend analysis for: (<b>a</b>) Autumn; (<b>b</b>) March; (<b>c</b>) April; (<b>d</b>) May.
In March, a small number of rain gauges showed significant trends (3.4%), most of which were positive, even though marked negative values had been identified in Queensland (
b). In contrast, April has a considerable number of rain gauges showing a negative trend, spatially concentrated in Victoria, in the Grampians National Park, New South Wales, interesting the Wollemi National Park and the Blue Mountains National Park, in southern Queensland, and in Tasmania, in the Meredith Range Regional Reserve (
c). The latter two sites showed the largest declines. May results can be compared to the April ones, as the percentage of the rain gauges shows significant decreasing trends but with a different spatial distribution. In fact, most of the decreases were recorded throughout Western Australia, especially in the south, interesting Dwellingup State Forest, Blackwood National Park, and Mount Frankland National Park (
d).
4.5. Spatial Results of the Trend Analysis for Winter
Results for the winter season produced the largest number of series with significant trends compared to other seasons. Most of these showed negative trends, which are distributed throughout Melbourne, Great Sandy National Park, and especially throughout Western Australia, with a large concentration in the south and on the coasts, in Milyeannup National Park, Greater Beedelup National Park, and the city of Perth, where the largest decreases were recorded (
a). The majority of the negative trends were recorded in June in Western Australia (Toolonga Nature Reserve, Greater Beedelup National Park, and the city of Perth), Queensland (in the Great Sandy National Park), and Tasmania (Douglas-Apsley National Park and Lime Bay State Reserve) (
b). July also showed several negative trends spatially distributed as in June but with a higher concentration in southern Queensland and New South Wales (
c). On the other hand, the results for August did not yield a significant number of marked trends; yet, the majority of them showed negative values, most evident in South Australia, Adelaide, and Hardwicke Bay (
d).
. Spatial results of the trend analysis for: (<b>a</b>) Winter; (<b>b</b>) June; (<b>c</b>) July; (<b>d</b>) August.
shows a summary of the trend results obtained for the different seasons in the 7 states/territories of Australia.
.
Summary table aggregating seasonal trend results by state.
| State |
Spring |
Summer |
Autumn |
Winter |
| Western Australia |
➖ Decreases near Perth, Augusta (southwestern coast). |
➕ Increases in December & January in the north (Ord River, Karlamilyi NP); some ➖ on coasts. |
➖ Significant decreases in the south (Dwellingup SF, Blackwood & Mount Frankland NPs). |
➖ Widespread decreases, especially in the south and coast (Milyeannup NP, Perth). Largest seasonal decline. |
| Victoria |
➖ Decreases around Melbourne; ➕ increases in Alpine NP (inland). |
➖ Negative trends on coasts; particularly in summer months. |
➖ Decreases in Melbourne and Grampians NP (April); consistent downward trend across season. |
➖ Widespread negative trends, including in Melbourne. |
| Tasmania |
➖ Largest spring decreases near Queenstown. |
➖ Negative trends in Franklin-Gordon NP and near Hobart; minor ➕ in some parts. |
➖ Decreases in Meredith Range (April); continued declines into May. |
➖ June declines in Douglas-Apsley & Lime Bay SR. |
| New South Wales |
➕ Spring increases inland (near Sydney); ➖ in eastern regions (September). |
➖ January decreases near Sydney; ➕ increases in the northeast. |
➖ April decreases in Wollemi & Blue Mountains NPs. |
➖ July declines, especially in the south. |
| Queensland |
➖ September and autumn decreases along eastern side and coastal areas (Brisbane, Great Sandy NP). |
➕ Strong summer increases in Jardine River NP; ➖ on southern coast (Townsville, K'gari, Great Sandy NP). |
➖ Autumn decreases around Brisbane and Great Sandy NP; some ➕ in March. |
➖ Negative trends in Great Sandy NP (June/July); more scattered in August. |
| South Australia |
➖ October decreases (Adelaide, Ngarkat CP); mixed trends in other months. |
➕ December increases (Adelaide, Tumby Bay); ➖ on coasts. |
➖ Negative trends more apparent in May (notably drier period). |
➖ August decreases (Adelaide, Hardwicke Bay). |
Northern
Territory
|
Not mentioned in spring results. |
➕ January–February increases (Fish River Gorge, eastern NT). |
No significant trend noted. |
No significant trend noted. |
5. Discussion
5.1. Seasonal Dynamics and Spatial Variability
Different tendencies depending on the areas and seasons investigated resulted from the analysis performed in this study. In particular, a widespread rainfall increase in summer and spring was observed throughout the territory, with the exception of Tasmania and the coastal area of Queensland. By contrast, autumn and winter showed a marked rainfall decrease, with the greatest evidence along the coastal areas of Queensland, in the southern part of Western Australia, and in New South Wales. These results agree with past regional studies conducted in the past century in Australia, such as the ones by Nicholls and Lavery [
9], Yu and Neil [
26], Suppiah and Hennessy [
10], and Hennessy et al. [
11] who, for different observation periods, generally detected an increase in summer rainfall and a decrease in winter ones. Moreover, as regards the different regions of Australia, the results of this study confirmed the decreasing trend of winter rainfall identified in the southwestern and eastern sides of Australia by Smith [
12] and Hope et al. [
16], and the increasing rainfall trend of detected in northern Australia by Davis and Hanna [
18] and in northwest Australia, especially in summer [
12,
27].
shows a comparative summary between the main results obtained in this study and the ones reported in literature, considering some regional researches.
.
Comparative summary: this study vs. literature regional research.
| Findings of This Study |
Literature Results |
| Spring & Summer increases, except in TAS and QLD coast |
Nicholls and Lavery [9] demonstrated increased summer rainfall across eastern Australia; Suppiah and Hennessy [10] reported rising intensity/frequency of summer precipitation. |
| Autumn & Winter decreases, pronounced along QLD coast, S WA, NSW |
Nicholls and Lavery [9], Theobald et al. [28], and Montazerolghaem et al. [29] consistently reported declining cool-season precipitation, particularly in southern and eastern Australia. |
| Winter rainfall decreases in southwestern and eastern Australia (SW WA, NSW) |
Allan and Haylock [30] and Haylock M, Nicholls [31] described significant summer/winter drying trends tied to shifting westerlies and Southern Annular Mode. |
| Increasing rainfall trends in northern and northwest Australia in summer |
Nicholls and Lavery [9] noted northern rainfall increases; follow-up analyses by Suppiah and Hennessy [10] support rising wet-season precipitation in northern regions. |
5.2. Climatic Drivers and Synoptic Mechanisms
These spatial and seasonal patterns are consistent with the influence of multiple large-scale atmospheric and oceanic processes [
32,
33]. The poleward expansion of the Hadley cell and the strengthening of the subtropical ridge (STR) [
34,
35] have contributed to the northward displacement of storm tracks, especially in winter, reducing the frequency and intensity of frontal systems and westerly disturbances reaching southern Australia. This mechanism is especially significant for the persistent drying trends in southern Western Australia and the southeast coast, which historically relied on these mid-latitude systems for winter precipitation. The Southern Annular Mode (SAM), trending toward more positive phases [
36], further explains reduced winter rainfall. A positive SAM is associated with a contraction of westerly winds toward Antarctica, suppressing precipitation in southern Australia. These changes in circulation patterns, along with increased positive Indian Ocean Dipole (IOD) events [
37], have reduced the moisture influx from the Indian Ocean, compounding dry conditions during autumn and winter. Additionally, the increasing frequency of Central Pacific El Niño events [
38], as opposed to traditional Eastern Pacific events, modifies the Walker circulation and suppresses convection over Australia, leading to rainfall reductions in eastern and southeastern regions during critical planting and growing seasons. The Madden-Julian Oscillation (MJO) has also demonstrated prolonged phases in recent decades [
39], potentially influencing intra-seasonal rainfall variability, especially in the northern and tropical parts of the country.
5.3. Comparison of Observed Rainfall Trends with IPCC Climate Model Projections
The spatial and temporal trends identified in this study reveal a clear pattern of seasonal rainfall redistribution across Australia from 1920 to 2020. These findings align closely with the climate projections of the AR6 in which an increasing intensity of the hydrological cycle under global warming scenarios has been highlighted [
1].
In particular, the observed spring rainfall reductions along the southern and coastal fringes agree with the IPCC simulations, which projected a poleward shift of the Southern Hemisphere storm tracks and a weakening of mid-latitude frontal systems. In fact, the CMIP6 models under the Shared Socioeconomic Pathways (SSPs) SSP2-4.5 and SSP5-8.5, projected continued drying in southern Australia, especially in regions such as southwest Western Australia and southeast Australia, including the Murray-Darling Basin. By contrast, the increasing spring rainfall observed in the internal areas of New South Wales and Victoria (Alpine National Park) may reflect localized convective intensification due to warming-driven increases in atmospheric moisture content. While these trends are more spatially heterogeneous than those predicted by coarse-scale global models, they do align with the general expectation of increased extreme precipitation events and greater intra-seasonal variability, particularly in subtropical and monsoonal regions. During summer, the spatial pattern of rainfall trends shows widespread increases, especially along northern and northwestern coasts, agreeing with the AR6 projections that suggested enhanced rainfall in northern Australia under warmer climates. At the same time, some coastal areas, particularly in southern Queensland and Tasmania, showed decreasing summer rainfall trends, consistent with the high variability and regional irregularities projected in IPCC scenarios. In autumn, the general downward trends in rainfall across Queensland, southern Western Australia, and Victoria are also aligned with model projections of drying during the transitional seasons as the subtropical ridge continues to intensify and shift southward. Finally, in winter, which displayed the most significant and widespread negative trends, especially in southwestern Australia and eastern coastal regions, strongly supports the climate model consensus of a drying trend across southern Australia. This is mainly due to the poleward shift of the westerlies and the increased dominance of high-pressure systems, both of which limit moisture-laden frontal systems from reaching these regions. These changes are robust across all major emissions scenarios and are expected to become more pronounced in the coming decades.
5.4. Implications for Water Resources and Ecosystems
Such rainfall trends have significant hydrological effects on the Australian continent. The combination of diminished winter and autumn rainfall, especially in southern and coastal regions, and increased evaporative demand due to rising temperatures [
40] has resulted in reduced runoff and streamflow across large areas of the continent [
41,
42]. Consequently, surface water availability is decreasing [
43], significantly threatening water security, especially in heavily populated and agriculturally intensive regions such as Perth, Melbourne, and parts of Queensland. Reduced water availability affects not only urban water supplies but also agricultural productivity, wetland ecosystems, and groundwater recharge. Declining rainfall and runoff compromise irrigation-dependent farming, affecting both crop yields and livestock and increasing competition for water resources between sectors. Ecosystems depending on consistent hydrological cycles, such as those in Tasmania, the Grampians, and Dwellingup State Forest, face altered habitats and reduced biodiversity. Furthermore, shifts in rainfall timing and intensity may influence the frequency and severity of bushfires, particularly in regions with extended dry seasons and fuel accumulation. The increase in dust storm events, linked to soil desiccation and vegetation loss in drying regions, poses additional risks to public health and transportation safety [
44].
5.5. Outlook and Adaptation
Understanding these rainfall trends is crucial for designing effective climate adaptation strategies. Water infrastructure planning, such as reservoir management, irrigation systems, and urban water supply networks, must account for seasonal shifts in rainfall and increased variability. Similarly, ecosystem management policies must foster Nature-Based solutions such as revegetation or wetland restoration. Continuous monitoring and integration of high-resolution climate models are required to anticipate future changes in rainfall patterns under various greenhouse gas emission scenarios. Coupled with socioeconomic planning, these efforts can mitigate the worst effects of hydrological stress and support sustainable water management and biodiversity conservation in Australia’s vulnerable regions.
5.6. Possible limitations
The spatial distribution of rain gauges, as shown in
, reveals an imbalance in data coverage across the study area. In fact, rain gauges are mainly clustered in certain areas, corresponding to population centers or zones of economic and agricultural significance. In contrast, large portions of the study area, particularly the more remote and arid desert areas, appear to have little to no rain gauge coverage. This uneven distribution could present a limitation in terms of spatial data coverage; however, desert regions are likely to have less or no concentration of rain gauges because they receive very little rainfall, making frequent measurements less critical than cities or agriculture areas, especially for climate change analyses.
The use of traditional methods for trend analysis may constitute another limitation. In any case, in this study, non-parametric tests have been chosen for trend detection in environmental data because they do not assume a specific data distribution, making them well-suited for datasets that are non-normal, skewed, or contain outliers, common characteristics of hydrological and climatic data. These methods are also robust against missing values and can handle irregular sampling intervals, which is advantageous in long-term observational datasets. However, non-parametric tests do have limitations. They typically do not account for serial correlation (autocorrelation) unless specifically adjusted, which can inflate the significance of detected trends.
6. Conclusions
In this study, two established non-parametric methods, the Theil–Sen estimator and the Mann–Kendall test, have been applied to assess temporal trends in rainfall across Australia based on a dataset of 505 monthly rainfall time series. The findings reveal a predominance of negative rainfall trends at the annual scale and spatial and seasonal variability. Rainfall reductions were most evident along the southern coastal regions of Western Australia, Victoria, and Tasmania, particularly during the spring, autumn, and winter seasons. These declines are especially concerning in regions critical for water supply and agriculture. Conversely, positive trends were identified in the inland areas of Victoria and New South Wales and along the Queensland coastline during summer, suggesting localized increases that may reflect changing atmospheric circulation patterns.
Overall, the persistence of declining rainfall across multiple seasons and regions suggests a long-term reduction in water availability in several parts of Australia. Should these trends continue, they may lead to more frequent and severe drought conditions, with implications for ecosystem sustainability, agricultural productivity, and water resource management. These results highlight the need for regionally adaptive planning and nature-based solutions to mitigate future hydrological risks.
Author Contributions
Conceptualization, R.G. and T.C.; methodology, A.R. and T.C.; software, T.C.; validation, R.G. and T.C.; formal analysis, A.R. and T.C.; investigation, A.R. and T.C.; resources, R.G. and T.C.; data curation, A.R. and F.F.; writing—original draft preparation, A.R. and T.C.; writing—review and editing, A.R. and T.C.; visualization, A.R. and T.C.; supervision, R.G. and T.C.
Ethics Statement
Not applicable.
Informed Consent Statement
Not applicable.
Data Availability Statement
The data presented in this study are available on request from the corresponding authors.
Funding
This research received no external funding.
Declaration of Competing Interest
The authors declare that they have no known competing financial interests or personal relationships that could have appeared to influence the work reported in this paper.
References
-
1.
IPCC. Summary for Policymakers. In IPCC, 2022: Climate Change 2022: Mitigation of Climate Change, Contribution of Working Group III to the Sixth Assessment Report of the Intergovernmental Panel on Climate Change; Shukla PR, Skea J, Slade R, Khourdajie AA, Diemen RV, McCollum D, et al., Eds.; Cambridge University Press: Cambridge, UK, 2022.
-
2.
Caloiero T. Evaluation of rainfall trends in the South Island of New Zealand through the innovative trend analysis (ITA).
Theor. Appl. Climatol. 2020,
139, 493–504.
[Google Scholar]
-
3.
Salinger MJ, Griffiths GM. Trends in New Zealand daily temperature and rainfall extremes.
Int. J. Climatol. 2001,
21, 1437–1452.
[Google Scholar]
-
4.
Salinger MJ, Allan R, Bindoff N, Hannah J, Lavery BM, Lin Z, et al. Observed variability and change in climate and sea level in Australia, New Zealand and the South Pacific. In Greenhouse: Coping with Climate Change; Bouma WJ, Pearman GI, Manning MR, Eds.; CSIRO Publishing: Melbourne, Australia, 1996.
-
5.
Plummer N, Salinger MJ, Nicholls N, Suppiah R, Hennessy KJ, Leighton RM, et al. Changes in climate extremes over the Australian region and New Zealand during the twentieth century.
Clim. Chang. 1999,
42, 183–202.
[Google Scholar]
-
6.
Manton MJ, Della-Marta PM, Haylock MR, Hennessy KJ, Nicholls N, Chambers LE, et al. Trends in extreme daily rainfall and temperature in southeast Asia and the south Pacific: 1961–1998.
Int. J. Climatol. 2001,
21, 269–284.
[Google Scholar]
-
7.
Caloiero T. Analysis of rainfall trend in New Zealand.
Environ. Earth Sci. 2015,
73, 6297–6310.
[Google Scholar]
-
8.
Peel MC, McMahon TA, Finlayson BL. Continental differences in variability of annual runoff–update and reassessment.
J. Hydrol. 2004,
295, 185–197.
[Google Scholar]
-
9.
Nicholls N, Lavery B. Australian rainfall trends during the twentieth century.
Int. J. Climatol. 1992,
12, 153–163.
[Google Scholar]
-
10.
Suppiah R, Hennessy KJ. Trends in total rainfall, heavy rain events and number of dry days in Australia, 1910–1990.
Int. J. Clim. 1998,
18, 1141–1164.
[Google Scholar]
-
11.
Hennessy KJ, Suppiah R, Page CM. Australian rainfall changes, 1910–1995.
Aust. Meteorol. Mag. 1999,
48, 1–13.
[Google Scholar]
-
12.
Smith I. An assessment of recent trends in Australian rainfall.
Aust. Meteorol. Mag. 2004,
53, 163–173.
[Google Scholar]
-
13.
Alexander LV, Hope P, Collins D, Trewin B, Lynch A, Nicholls N. Trends in Australia's climate means and extremes: a global context.
Aust. Meteorol. Mag. 2007,
56, 1–18.
[Google Scholar]
-
14.
Liu DL, Teng J, Ji F, Anwar MR, Feng P, Wang B, et al. Characterizing spatiotemporal rainfall changes in 1960–2019 for continental Australia.
Int. J. Climatol. 2020,
41, 2420–2444.
[Google Scholar]
-
15.
Chowdhury R, Beecham S. Australian rainfall trends and their relation to the southern oscillation index.
Hydrol. Process Int.
J. 2010,
24, 504–514.
[Google Scholar]
-
16.
Hope P, Timbal B, Fawcett R. Associations between rainfall variability in the southwest and southeast of Australia and their evolution through time.
Int. J. Clim. 2009,
30, 1360–1371.
[Google Scholar]
-
17.
Cai W, Cowan T. Southeast Australia Autumn Rainfall Reduction: A Climate-Change-Induced Poleward Shift of Ocean–Atmosphere Circulation.
J. Clim. 2013,
26, 189–205.
[Google Scholar]
-
18.
Davis CJ, Hanna EG. Temperature and rainfall trends in northern Australia 1911–2013: implications for human activity and regional development.
Clim. Res. 2017,
71, 1–16.
[Google Scholar]
-
19.
Yildirim G, Rahman A. Homogeneity and trend analysis of rainfall and droughts over Southeast Australia.
Nat. Hazards 2022,
112, 1657–1683.
[Google Scholar]
-
20.
Rauniyar SP, Power SB. Past and future rainfall change in sub-regions of Victoria, Australia.
Clim. Chang. 2023,
176, 92.
[Google Scholar]
-
21.
Fu G, Chiew FHS, Post DA. Trends and variability of rainfall characteristics influencing annual streamflow: A case study of southeast Australia.
Int. J. Climatol. 2023,
43, 1407–1430.
[Google Scholar]
-
22.
Oliver JE. Encyclopedia of World Climatology; Springer: Amsterdam, The Netherlands, 2005.
-
23.
Sen PK. Estimates of the Regression Coefficient Based on Kendall’s Tau.
J. Am. Stat. Assoc. 1968,
63, 1379–1389.
[Google Scholar]
-
24.
Mann HB. Non-parametric tests against trend.
Econometrica 1945,
13, 245–259. doi:10.2307/1907187.
[Google Scholar]
-
25.
Kendall MG. Rank Correlation Methods; Oxford University Press: New York, NY, USA, 1975.
-
26.
Yu B, Neil DT. Long-term variations in regional rainfall in the south-west of Western Australia and the difference between average and high intensity rainfalls.
Int. J. Climatol. 1993,
13, 77–88.
[Google Scholar]
-
27.
Wheeler M, McBride JL. Australasian monsoon. In Intraseasonal Variability in the Atmosphere-Ocean Climate System; Springer: Berlin, Germany, 2012.
-
28.
Theobald A, Mcgowan H, Speirs J. Trends in synoptic circulation and precipitation in the Snowy Mountains region, Australia, in the period 1958–2012.
Atmos. Res. 2016,
169, 434–448.
[Google Scholar]
-
29.
Montazerolghaem M, Vervoort W, Minasny B, McBratney A. Long-term variability of the leading seasonal modes of rainfall in south-eastern Australia.
Weather Clim. Extrem. 2016,
13, 1–14.
[Google Scholar]
-
30.
Allan RJ, Haylock MR. Circulation Features Associated with the Winter Rainfall Decrease in Southwestern Australia.
J. Clim. 1993,
6, 1356–1367.
[Google Scholar]
-
31.
Haylock M, Nicholls N. Trends in Extreme Rainfall Indices for an Updated High Quality Data Set for Australia, 1910–1998
. Int. J. Climatol. 2000,
20, 1533–1541.
[Google Scholar]
-
32.
McKay RC, Boschat G, Rudeva I, Pepler A, Purich A, Dowdy A, et al. Can southern Australian rainfall decline be explained? A review of possible drivers.
WIREs Clim. Chang. 2023,
14, e820.
[Google Scholar]
-
33.
Wasko C, Stephens C, Peterson TJ, Nathan R, Pepler A, Hettiarachchi S, et al. Understanding the implications of climate change for Australia’s surface water resources: Challenges and future directions.
J. Hydrol. 2024,
645, 132221.
[Google Scholar]
-
34.
Post DA, Timbal B, Chiew FHS, Hendon HH, Nguyen H, Moran R. Decrease in southeastern Australian water availability linked to ongoing Hadley cell expansion.
Earth’s Future 2014,
2, 231–238.
[Google Scholar]
-
35.
Timbal B, Drosdowsky W. The relationship between the decline of Southeastern Australian rainfall and the strengthening of the subtropical ridge.
Int. J. Climatol. 2013,
33, 1021–1034.
[Google Scholar]
-
36.
Fogt RL, Marshall GJ. The Southern Annular Mode: Variability, trends, and climate impacts across the Southern Hemisphere.
WIREs Clim. Chang. 2020,
11, e652.
[Google Scholar]
-
37.
Abram NJ, Wright NM, Ellis B. Coupling of Indo-Pacific climate variability over the last millennium.
Nature 2020,
579, 385–392.
[Google Scholar]
-
38.
Freund MB, Henley BJ, Karoly DJ, McGregor HV, Abram NJ, Dommenget D. Higher frequency of central pacific El Niño events in recent decades relative to past centuries.
Nat. Geosci. 2019,
12, 450–455.
[Google Scholar]
-
39.
Borowiak A, King A, Lane T. The Link between the Madden-Julian Oscillation and Rainfall Trends in Northwest Australia.
Geophys. Res. Lett. 2023,
50, e2022GL101799.
[Google Scholar]
-
40.
Stephens CM, McVicar TR, Johnson FM, Marshall LA. Revisiting Pan Evaporation Trends in Australia a Decade on.
Geophys. Res. Lett. 2018,
45, 164–172.
[Google Scholar]
-
41.
Ho M, Nathan R, Wasko C, Vogel E, Sharma A. Projecting Changes in Flood Event Runoff Coefficients under Climate Change.
J. Hydrol. 2022,
615, 128689.
[Google Scholar]
-
42.
Peterson TJ, Saft M, Peel MC, John A. Watersheds may not recover from drought.
Science 2021,
372, 745–749.
[Google Scholar]
-
43.
Wasko C, Shao Y, Vogel E, Wilson L, Wang Q, Frost A, et al. Understanding trends in hydrologic extremes across Australia.
J. Hydrol. 2021,
593, 125877.
[Google Scholar]
-
44.
Environment Protection Authority. Available online: https://soe.epa.sa.gov.au/files/documents/SOER-Summary-Report.pdf (accessed on 31 December 2024).