1. Introduction
Accelerating climate change has fundamentally altered hydrological regimes, with precipitation variability now exceeding the design thresholds of conventional flood control paradigms [
1,
2]. Although “standard” and “risk-based” models have long been the foundation of flood management, their dependence on static probability distributions and isolated engineering solutions has proven insufficient, especially in the face of recent compound and extreme flood events from the global to local scales [
3]. This highlights the urgent need for a paradigm shift towards resilience-based flood governance [
4], moving beyond traditional structural defences and addressing the latent risks associated with the “levee effect” [
5], to enhance the adaptive capacity of infrastructure, cities, and regions [
6].
The resilience paradigm has evolved through advances in sustainable flood management [
7]. Early approaches, such as the best management practices (BMPs) and low-impact development (LID) in the U.S, sustainable drainage systems (SuDSs) in the UK, and water-sensitive urban design (WSUD) in Australia [
8], marked a shift from drainage-centric to storage-centric strategies [
9], emphasizing onsite runoff retention through ecological measures. China’s Sponge City initiative exemplifies the global trend of transforming “resistant” into “resilient” cities [
10], which emphasizes urban water retention, infiltration, and ecological restoration [
11], and shares common goals with international frameworks such as the EU Floods Directive mandating integrated flood risk assessment and management at the river basin scale [
12] and the U.S. FEMA’s flood risk management policies promoting community-based resilience and risk reduction [
13]. However, there still remain gaps in how to scale up the urban-focused solutions to address watershed-level challenges [
14]. Recent policies and practices in China, such as the 2021 Sponge City pilots, have explicitly called for “systematic watershed implementation” [
15] to prevent urban flood disasters through the establishment of watershed protection systems [
14] and applied the “sponge watershed” approach in post-disaster reconstruction projects to cope with flood issues beyond urban areas and rivers [
16]. These trends reflect a broader shift from site/urban-based to watershed-based resilience frameworks [
17], catalyzing the need for defining the concept of watershed flood resilience (WFR) [
18].
However, the development of WFR faces both theoretical and methodological challenges. Compared to urban flood resilience [
19,
20], WFR research started later [
21] and is constrained by the complexity of watershed systems and the abstract nature of resilience theory [
22]. Watersheds are coupled natural‒economical systems [
21], integrating hydraulic infrastructure, land use, and urban/rural settlements [
23], making it difficult to define and measure WFR [
24]. Moreover, the flooding process involves multiple subprocesses, including rainfall, runoff, and inundation [
25], which requires coupled modelling and complicates the operational assessment of WFR. Therefore, there is a pressing need for spatially explicit frameworks that integrate ecological, engineering, and planning perspectives [
26] to increase flood resilience at the watershed scale [
27,
28,
29].
This study proposes a spatially process-coupled framework for WFR assessment, which quantifies resilience by combining resistance and adaptation capacities derived from hydrograph and loss curve analysis. The framework leverages the “source-flow-sink” paradigm from landscape ecology to analyze the spatial impacts of watershed elements on WFR. Using the Sishui River Basin reconstruction program after the 2021 Zhengzhou “7·20” flood as a case, this study validates and applies the framework to optimize watershed-scale flood prevention planning, demonstrating significant improvements in WFR. This operational approach bridges the gap between resilience theory and spatial practice, supporting climate adaptation in watershed management.
2. Conceptual Framework of WFR
2.1. The Resilience Paradigm in Watershed Flood Processes
The evolution of the resilience concept has undergone three major paradigm shifts [
27,
30]: (1) Engineering resilience, focusing on a system’s ability to return to equilibrium after disturbance; (2) Ecological resilience, introduced by Holling in the 1970s, emphasizing an ecosystem’s capacity to absorb and withstand disturbances before shifting to an alternative state; and (3) Socio-ecological or evolutionary resilience, which emerged in the 1990s, highlighting the adaptive and transformative capacities of coupled human-natural systems [
31]. Despite the existence of over 70 definitions of resilience regarding different contents, groups, and issues [
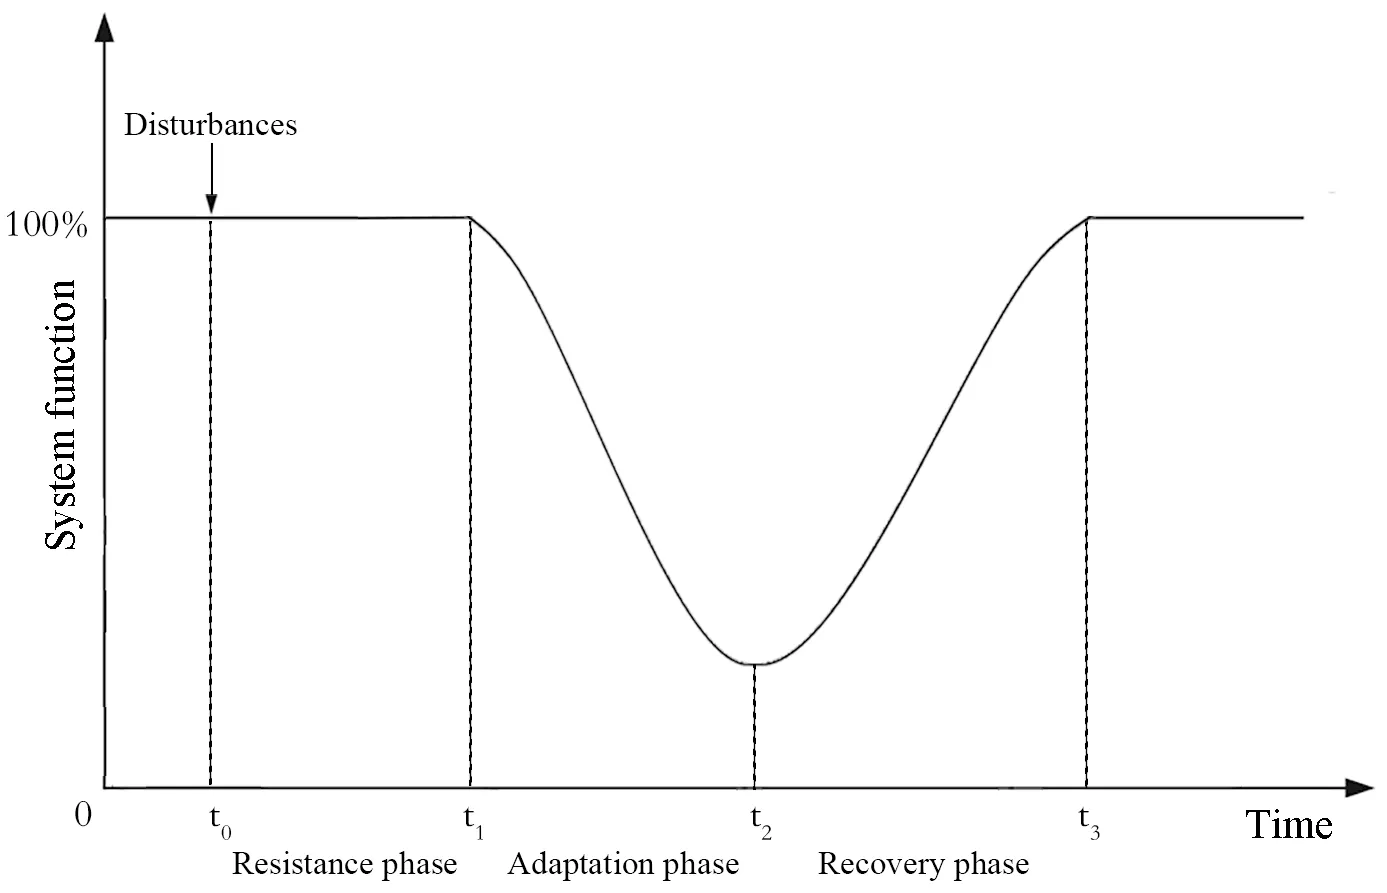
22], a transdisciplinary consensus has gradually formed around three temporally related phases: resistance and response, tolerance and adaptation, and recovery and reorganization [
32,
33]. These phases correspond to the stages of a system’s functionality–time curve under disturbances (). In the resistance phase, the system attempts to prevent the disaster and maintain its function; in the adaptation phase, it adjusts to changing conditions; and in the recovery phase, it restores or even enhances its original function [
34]. The area under this curve quantifies system resilience and is usually used as a measurement indicator [
35].
. System functionality-time curve during disturbance events.
Correspondingly, watershed flood disasters can be divided into three temporally sequential and causally linked phases: resistance (pre-event), adaptation (in-event), and recovery (post-event). The resistance phase involves the hydrological regulation process, where atmospheric precipitation transforms into terrestrial runoff through surface–subsurface interactions, and hydraulic infrastructures such as reservoirs and levees enhance the system’s ability to buffer floods. The adaptation phase focuses on mitigating impacts through measures like urban planning, blue-green infrastructure, flood-resilient designs, and emergency preparedness, aiming to reduce losses to infrastructure and human life [
36,
37]. The recovery phase centers on socio-ecological restoration, with outcomes influenced by socio-economic capacity and governance [
38]. These phases form a sequential chain, allowing for targeted interventions at each stage [
39].
2.2. Key Attributes and Implications of WFR
Extending resilience theory to flood management has established flood resilience as a key indicator in disaster mitigation strategies [
36]. From a system perspective, resilience is reflected in the system’s resistance, adaptation, recovery, and self-learning capacities in response to flood events [
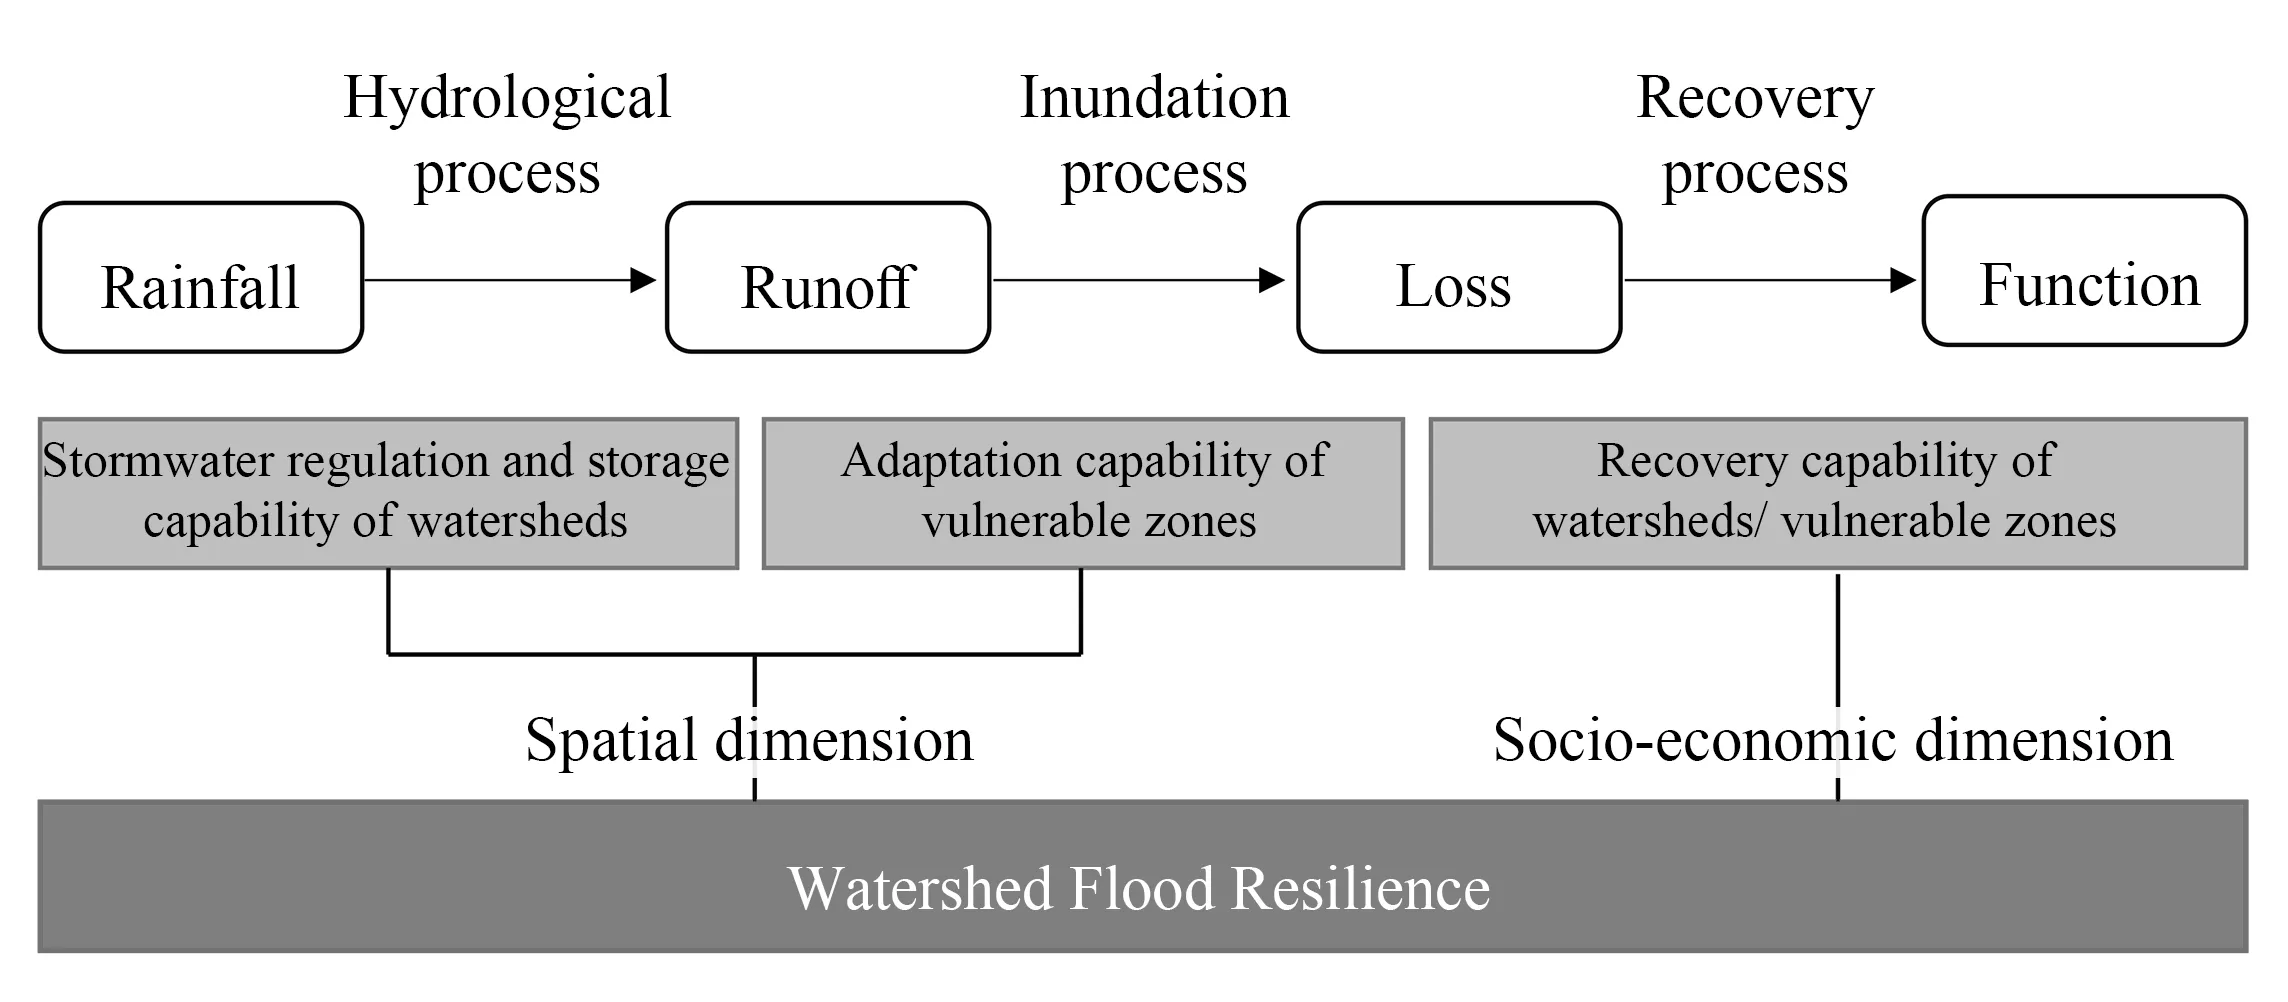
40]. Corresponding to this, WFR is defined by a watershed’s ability to withstand, adapt to, and recover from extreme precipitation and flooding [
18] ().
. Conceptual framework of water flood resilience (WFR).
WFR’s resistance capacity primarily manifests through hydrological processes and flood attenuation, influenced by watershed morphology [
41], soil and geological conditions, land use, and infrastructure such as artificial retention facilities [
42]. Adaptation capacity reflects the ability of socio-ecological elements to mitigate disaster impacts, mainly depending on the vulnerability and exposure characteristics of urban/rural settlements and farmlands in floodplains[
36]. Recovery capacity represents the non-structural dimension of resilience and involves post-disaster rehabilitation, relying on governance [
43], social capital [
44], and community organization [
45].
Unlike urban flood resilience, WFR operates across broader spatial scales and includes more complex mechanisms. Urban resistance relies mainly on engineered infrastructures, such as levees and floodwalls, while watershed resistance is governed by rainfall-runoff dynamics and integrated land use, reservoirs, and nature-based solutions (NbSs) [
46]. Adaptation at the watershed scale must address vulnerabilities across both ecological assets and human settlements [
47]. Recovery in urban areas focuses on built-environment rehabilitation, whereas watershed recovery requires both hydrological infrastructure restoration and socio-economic reconstruction.
3. Assessment Methodology for WFR
3.1. Measurement Framework for WFR
3.1.1. Dimensions of Resilience Measurement
Although many methods exist in the resilience measurement area [
48], they can be broadly categorized into process-based and state-based paradigms [
49]. The process-based approach focuses on the dynamic evolution of system functionality, recovery capacity, and resilience over time, typically utilizing functionality-time curves or temporal models to capture these changes. In contrast, the state-based approach treats resilience as an inherent property of the system, focusing on its capacity to resist, adapt to, and recover from disturbances [
50]; it typically relies on quantifiable performance metrics [
49], such as the case using the proportion of floodable land in flood-prone areas to evaluate flood resilience [
10].
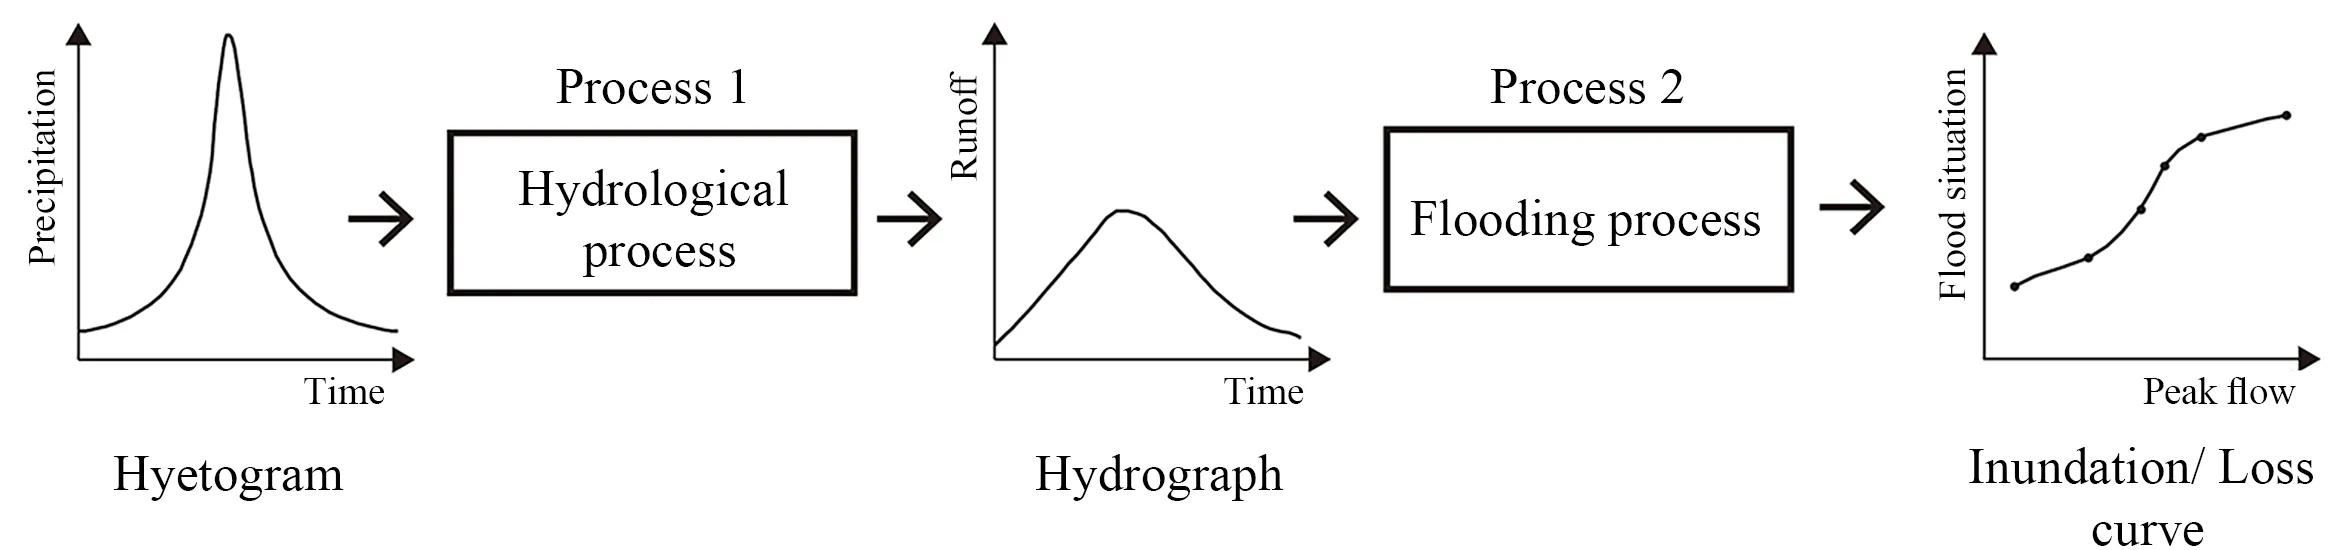
Although functionality-time curves have been extensively validated in infrastructure resilience quantification, such as in urban water supply and drainage systems [
51], their direct application to WFR measurement entails practical complexities due to the complexity of socio-economic factors and governance structures within the watershed, particularly the recovery-phase trajectory [
52]. In contrast, the resistance and adaptation phases are more amenable to mechanistic modeling, as they are directly linked to physical processes: the rainfall-runoff relationship for resistance, and the inundation-damage relationship for adaptation. By leveraging hydrological and inundation analyses, it becomes feasible to develop spatially explicit and physically grounded resilience metrics (). Therefore, the proposed framework quantifies WFR by integrating resistance and adaptation capacities, capturing both spatial heterogeneity and process determinism.
. Physical processes in a watershed flood event.
3.1.2. Process-Based Metrics and Equations
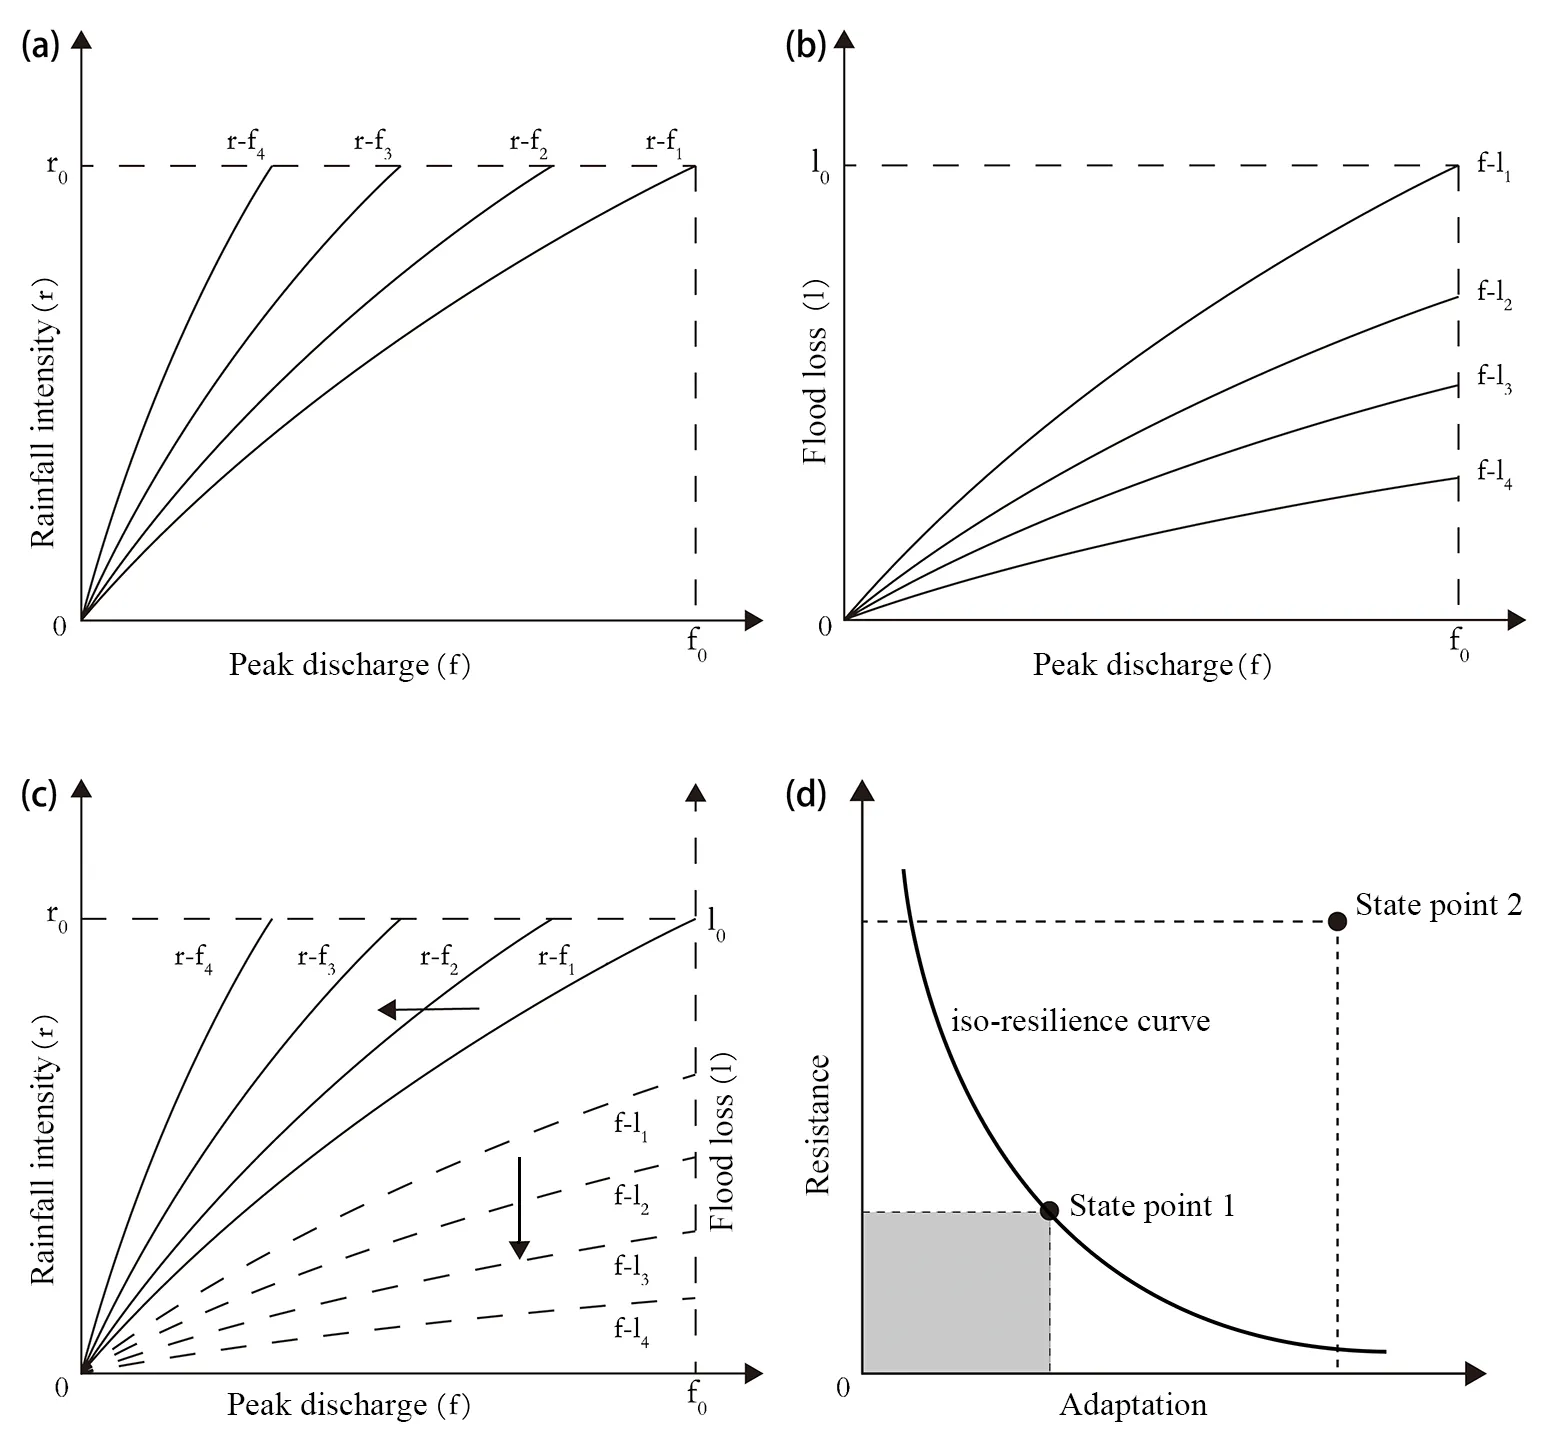
With the intensification of climate change, extreme precipitation events are projected to become more frequent and severe, resulting in higher peak flows within watersheds. As shown in a, a rightward shift in the rainfall-flow (r-f) curve signifies a more pronounced hydrological response to rainfall events; and when the peak discharge exceeds the flood control capacity of vulnerable zones, the resulting inundation triggers a upward shift in the flow-loss (f-l) curve as shown in b, indicating an increased potential for flood damage. Variations in watershed resistance or adaptation capacity are manifested as changes in the shape of the r-f and f-l curves, respectively, which provide a robust basis for characterizing and quantifying WFR ().
. Conceptual diagrams of WFR with subprocess curves: (<b>a</b>) Rainfall-flow (r-f) curves, (<b>b</b>) Flow‒loss (f-l) curves, (<b>c</b>) Combined effects of resistance and adaptation, and (<b>d</b>) WFR state space and iso-resilience curve.
Resistance Capacity of a Watershed
The resistance capacity, also referred to as flood regulation capacity, measures the ability of a watershed to buffer and attenuate extreme rainfall and flood events. As shown in
a, higher resistance capacity is indicated by a lower peak flow (f) for a given rainfall intensity (r), corresponding to an upward or leftward shift of the curve (e.g., from r-f
1 to r-f
4). The area enclosed by the r-f curve and the vertical axis is a quantitative indicator: a smaller area denotes greater resistance capacity. This relationship is formalized as follows:
where $$D e f_{i}$$ represents the resistance capacity of the watershed in the
i-th state, $$A r e a_{V i}$$ represents the area enclosed by the r-f
i curve and the vertical axis within the 0-r
0 range in the
i-th state, and r
0 represents the maximum rainfall considered.
Adaptation Capability of Vulnerable Zones
Adaptation capacity refers to the ability of vulnerable zones, such as settlements, farmlands, and critical infrastructure, to reduce flood-induced losses through both engineered and nature-based interventions. As shown in
b, enhanced adaptation capacity is reflected by a lower loss (l) for a given peak flow (f), resulting in a downward or rightward shift of the curve (e.g., from f-l
1 to f-l
4). The area under the f-l curve and above the horizontal axis serves as a metric: a smaller area indicates higher adaptation capacity. This relationship is mathematically expressed as:
where $$A d a_{i}$$ represents the adaptation capacity in the
i-th state, $$A r e a_{H i}$$ represents the area enclosed by the f-l
i curve and the horizontal axis within the 0-f
0 range in the
i-th state, and f
0 represents the maximum peak flow considered.
Integrated Measurement of WFR
As shown in
c, a comprehensive resilience assessment matrix can be constructed by spatially coupling hydrological regulation (r‒f curves) with adaptation in the vulnerable zone (f‒l curves). This integrated system enables the calculation of composite WFR, accounting for the synergistic effects of both resistance and adaptation capacities.
d shows the combined metric, which is visualized as a trajectory in state space
1, and the product of resistance and adaptation capacities (
i.e., the area of the shaded region in
d serves as a robust indicator of overall WFR:
where $$R e s_{i}$$ represents the WFR in the
i-th state, $$D e f_{i}$$ represents the resistance capacity in the
i-th state, and $$A d a_{i}$$ represents the adaptation capacity in the
i-th state, with $$D e f_{i}$$ > 0 and $$A d a_{i}$$ > 0.
The indices for resistance $$\left(D e f_{i}\right)$$, adaptation $$\left(A d a_{i}\right)$$, and overall resilience $$\left(R e s_{i}\right)$$ are dimensionless and function as relative performance metrics. For cross-system or cross-watershed comparisons, these indicators can be normalized to a 0–1 scale using the min-max normalization. Besides, iso-resilience curves
2 represent combinations of resistance and adaptation that yield equivalent WFR, illustrating that different intervention strategies can achieve similar resilience outcomes. This framework thus provides a theoretical and practical basis for evaluating and comparing watershed flood management strategies. Notably, only resistance capacity is relevant for flood resilience assessments in natural watersheds without vulnerable zones (e.g., uninhabited catchments).
3.2. Analytical Framework for WFR
3.2.1. Influencing Factors in the “Source-Flow-Sink” Paradigm
To systematically identify and analyze the factors influencing WFR, this study adopts the “source-flow-sink” paradigm from landscape ecology
3. Originally developed as the “source-sink” theory, this framework classifies landscape elements based on their roles in ecological processes: “sources” promote the initiation and propagation of processes, “sinks” inhibit or delay them, and “flows” represent the pathways of transmission [
53]. This analytical lens enables the investigation of material and energy dynamics across spatial and temporal scales [
54]. The paradigm has been widely applied in research on nonpoint source pollution, soil erosion, urban heat islands [
53], and stormwater management, such as the spatiotemporal evolution of watershed “source” and “sink” landscapes [
55], the factors influencing watershed runoff and sediment [
56], regional stormwater processes [
57], and urban flood management [
58]. Importantly, the classification of spatial units as sources, flows, or sinks is both scale-dependent and functionally relative; a sink in one process may act as a source in another, underscoring the need for clear analytical boundaries in WFR studies [
59].
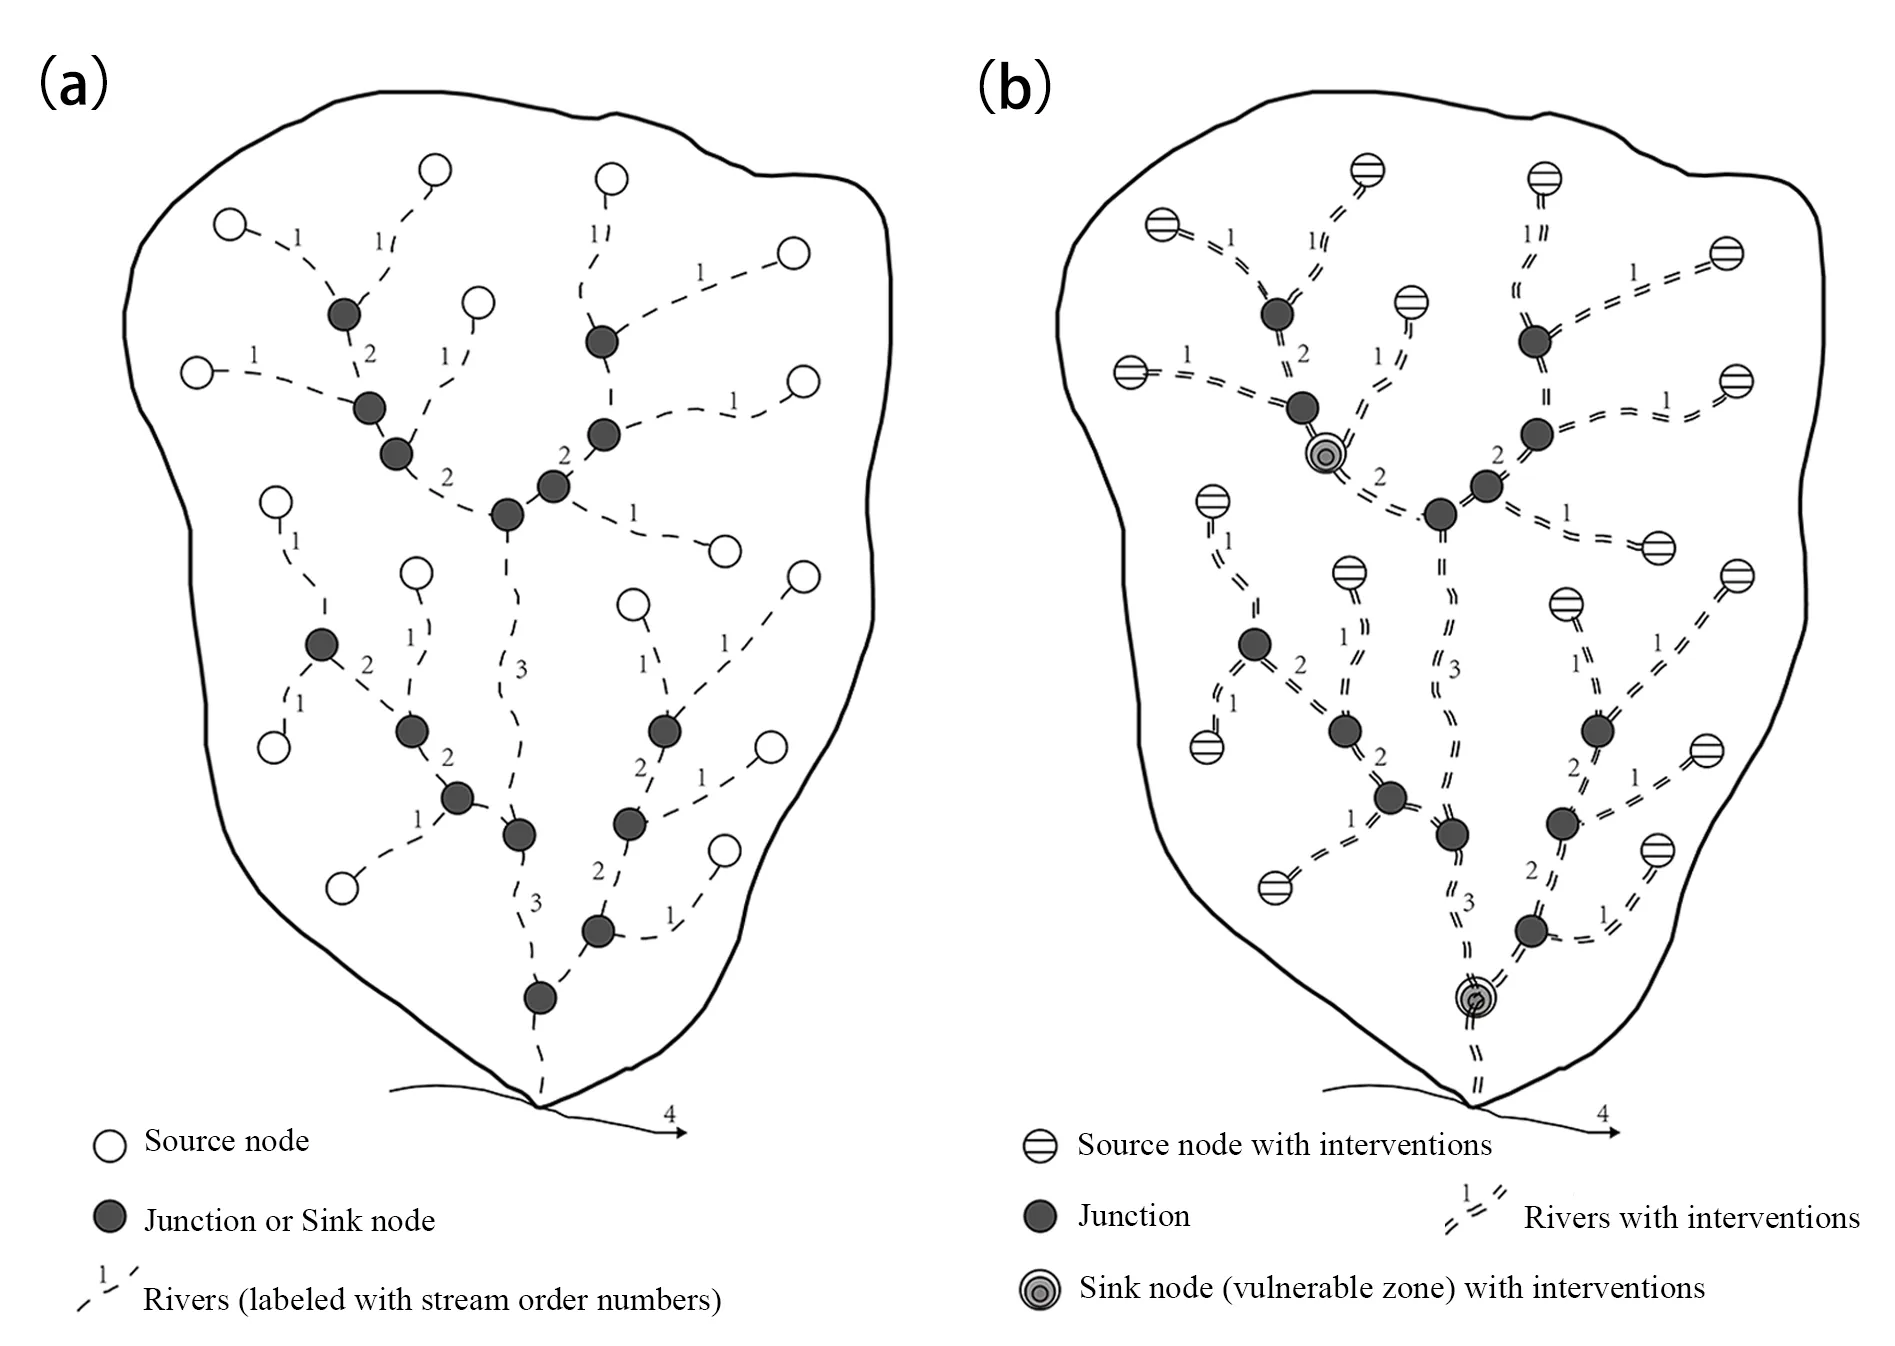
In the context of watershed hydrology, the “source-flow-sink” paradigm enables the functional classification of landscape units according to their roles in flood processes. Source areas, such as forests, farmlands, and artificial retention structures, act as primary interfaces for precipitation reception and runoff generation, where rainfall is partitioned via vegetation interception, soil infiltration, and storage in surface depressions or reservoirs. Flow areas, mainly rivers and drainage channels, facilitate the downstream transport of runoff, with their hydraulic properties (e.g., river length, width, slope, cross-section, and roughness) influencing flood propagation. Sink areas, typically comprising settlements and floodplains, represent zones where floodwaters accumulate and interact with socio-ecological systems, leading to potential disasters when protective thresholds are exceeded.
Additionally, watershed systems are inherently organized as hierarchical, multiscale networks of nested subbasins, each integrating source, flow, and sink components. This spatial configuration is analogous to the modular structure used in semi-distributed hydrological models [
60]. By strategically reconfiguring the connectivity and function of these components, planners and managers can proactively enhance flood resilience. For example, interventions may include constructing distributed detention structures in source areas, optimizing channel geometry in flow corridors, or restoring floodplains in sink zones [
61]. These targeted modifications, as conceptually illustrated in
, highlight the practical value of the proposed framework for adaptive watershed management.
. Watershed network configurations: (<b>a</b>) Source–flow–sink hierarchy, (<b>b</b>) Strategic interventions for WFR.
3.2.2. Strategic Interventions for Enhancing WFR
Building on the “source-flow-sink” paradigm, intervention strategies for enhancing WFR can be systematically classified into three complementary categories. Source-oriented interventions focus on upstream water retention and infiltration, employing measures such as retention ponds, afforestation, terracing, sediment-retention dams, and rainwater harvesting. Flow-oriented interventions target the hydraulic properties of rivers and channels, including channel widening, meander restoration, embankment construction, and landform diversification, to optimize flood conveyance and reduce peak flows. Sink-oriented interventions aim to improve downstream flood adaptation, for example by developing floodplains, elevating critical infrastructure, and implementing flood-resilient architectural designs. The spatial allocation of these differentiated interventions should be informed by watershed characteristics such as river network structure, slope, and land use patterns [
16].
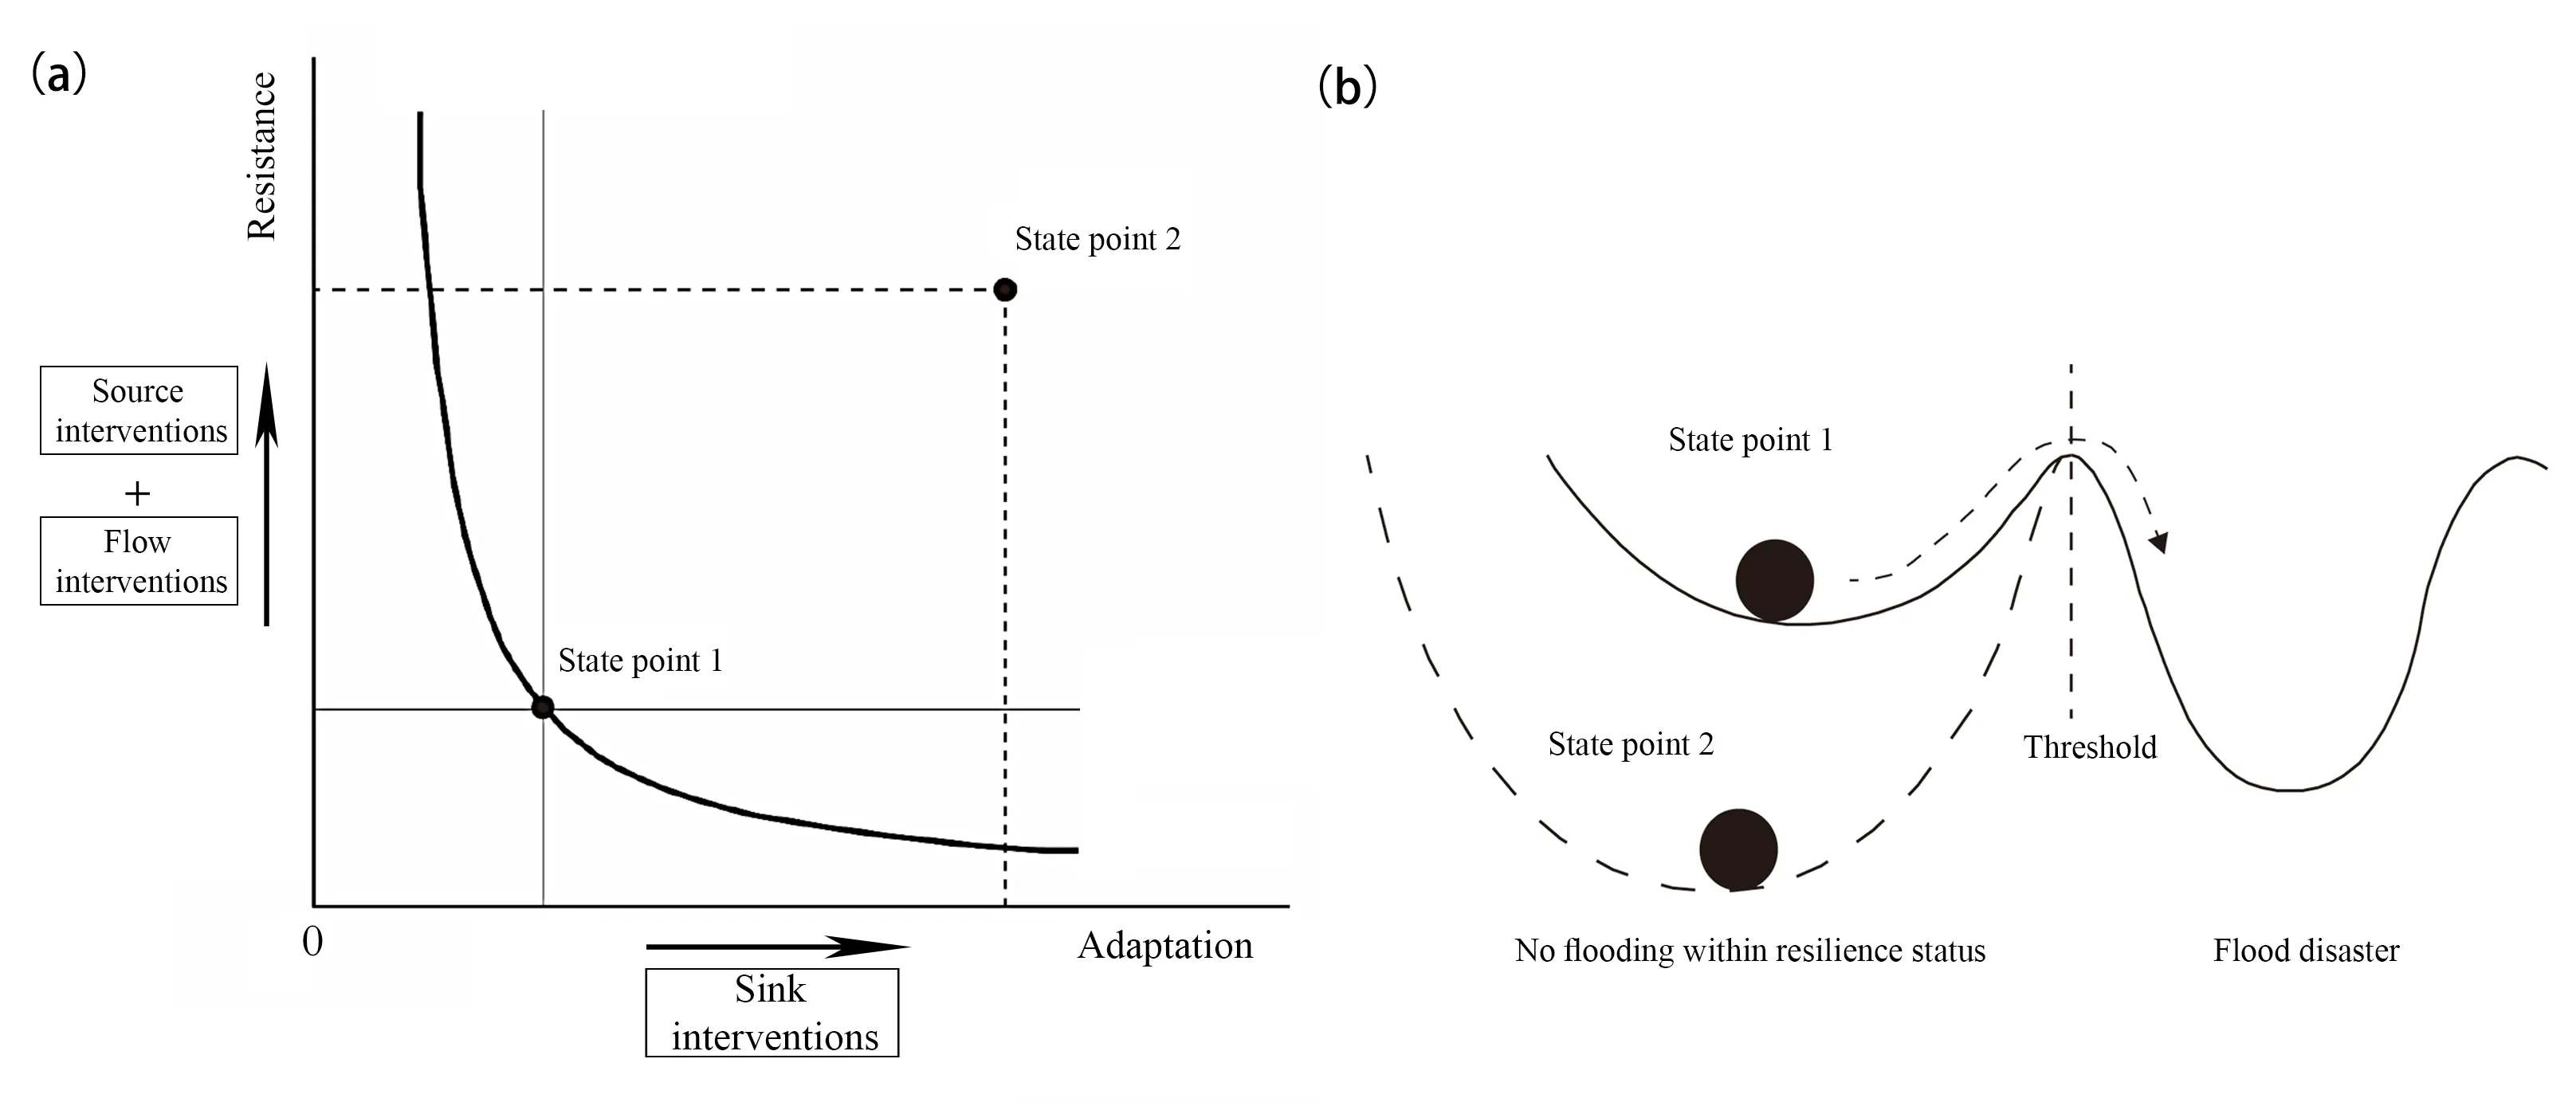
As shown in a, enhancing watershed flood resistance is primarily achieved by strategic modifications of landscape patterns in source and flow areas, while adaptation-based optimization is achieved primarily via sink interventions in vulnerable zones. The system starts with identical WFR values from iso-resilience curves, and moving a state point above this curve signifies successful resilience optimization. This process can be visualized using the “cup-and-ball” model, as shown in b, where post-intervention dynamics stabilize the system (the “ball”) in a deeper, more stable basin (the “cup”), thereby increasing the threshold for catastrophic state transitions and reducing flood risk [
62].
. Optimization framework for WFR: (<b>a</b>) State improvement under different interventions, (<b>b</b>) “Cup-and-ball” model of resilience.
4. Case Study: Optimizing WFR in the Sishui River Basin
4.1. Study Area and Background
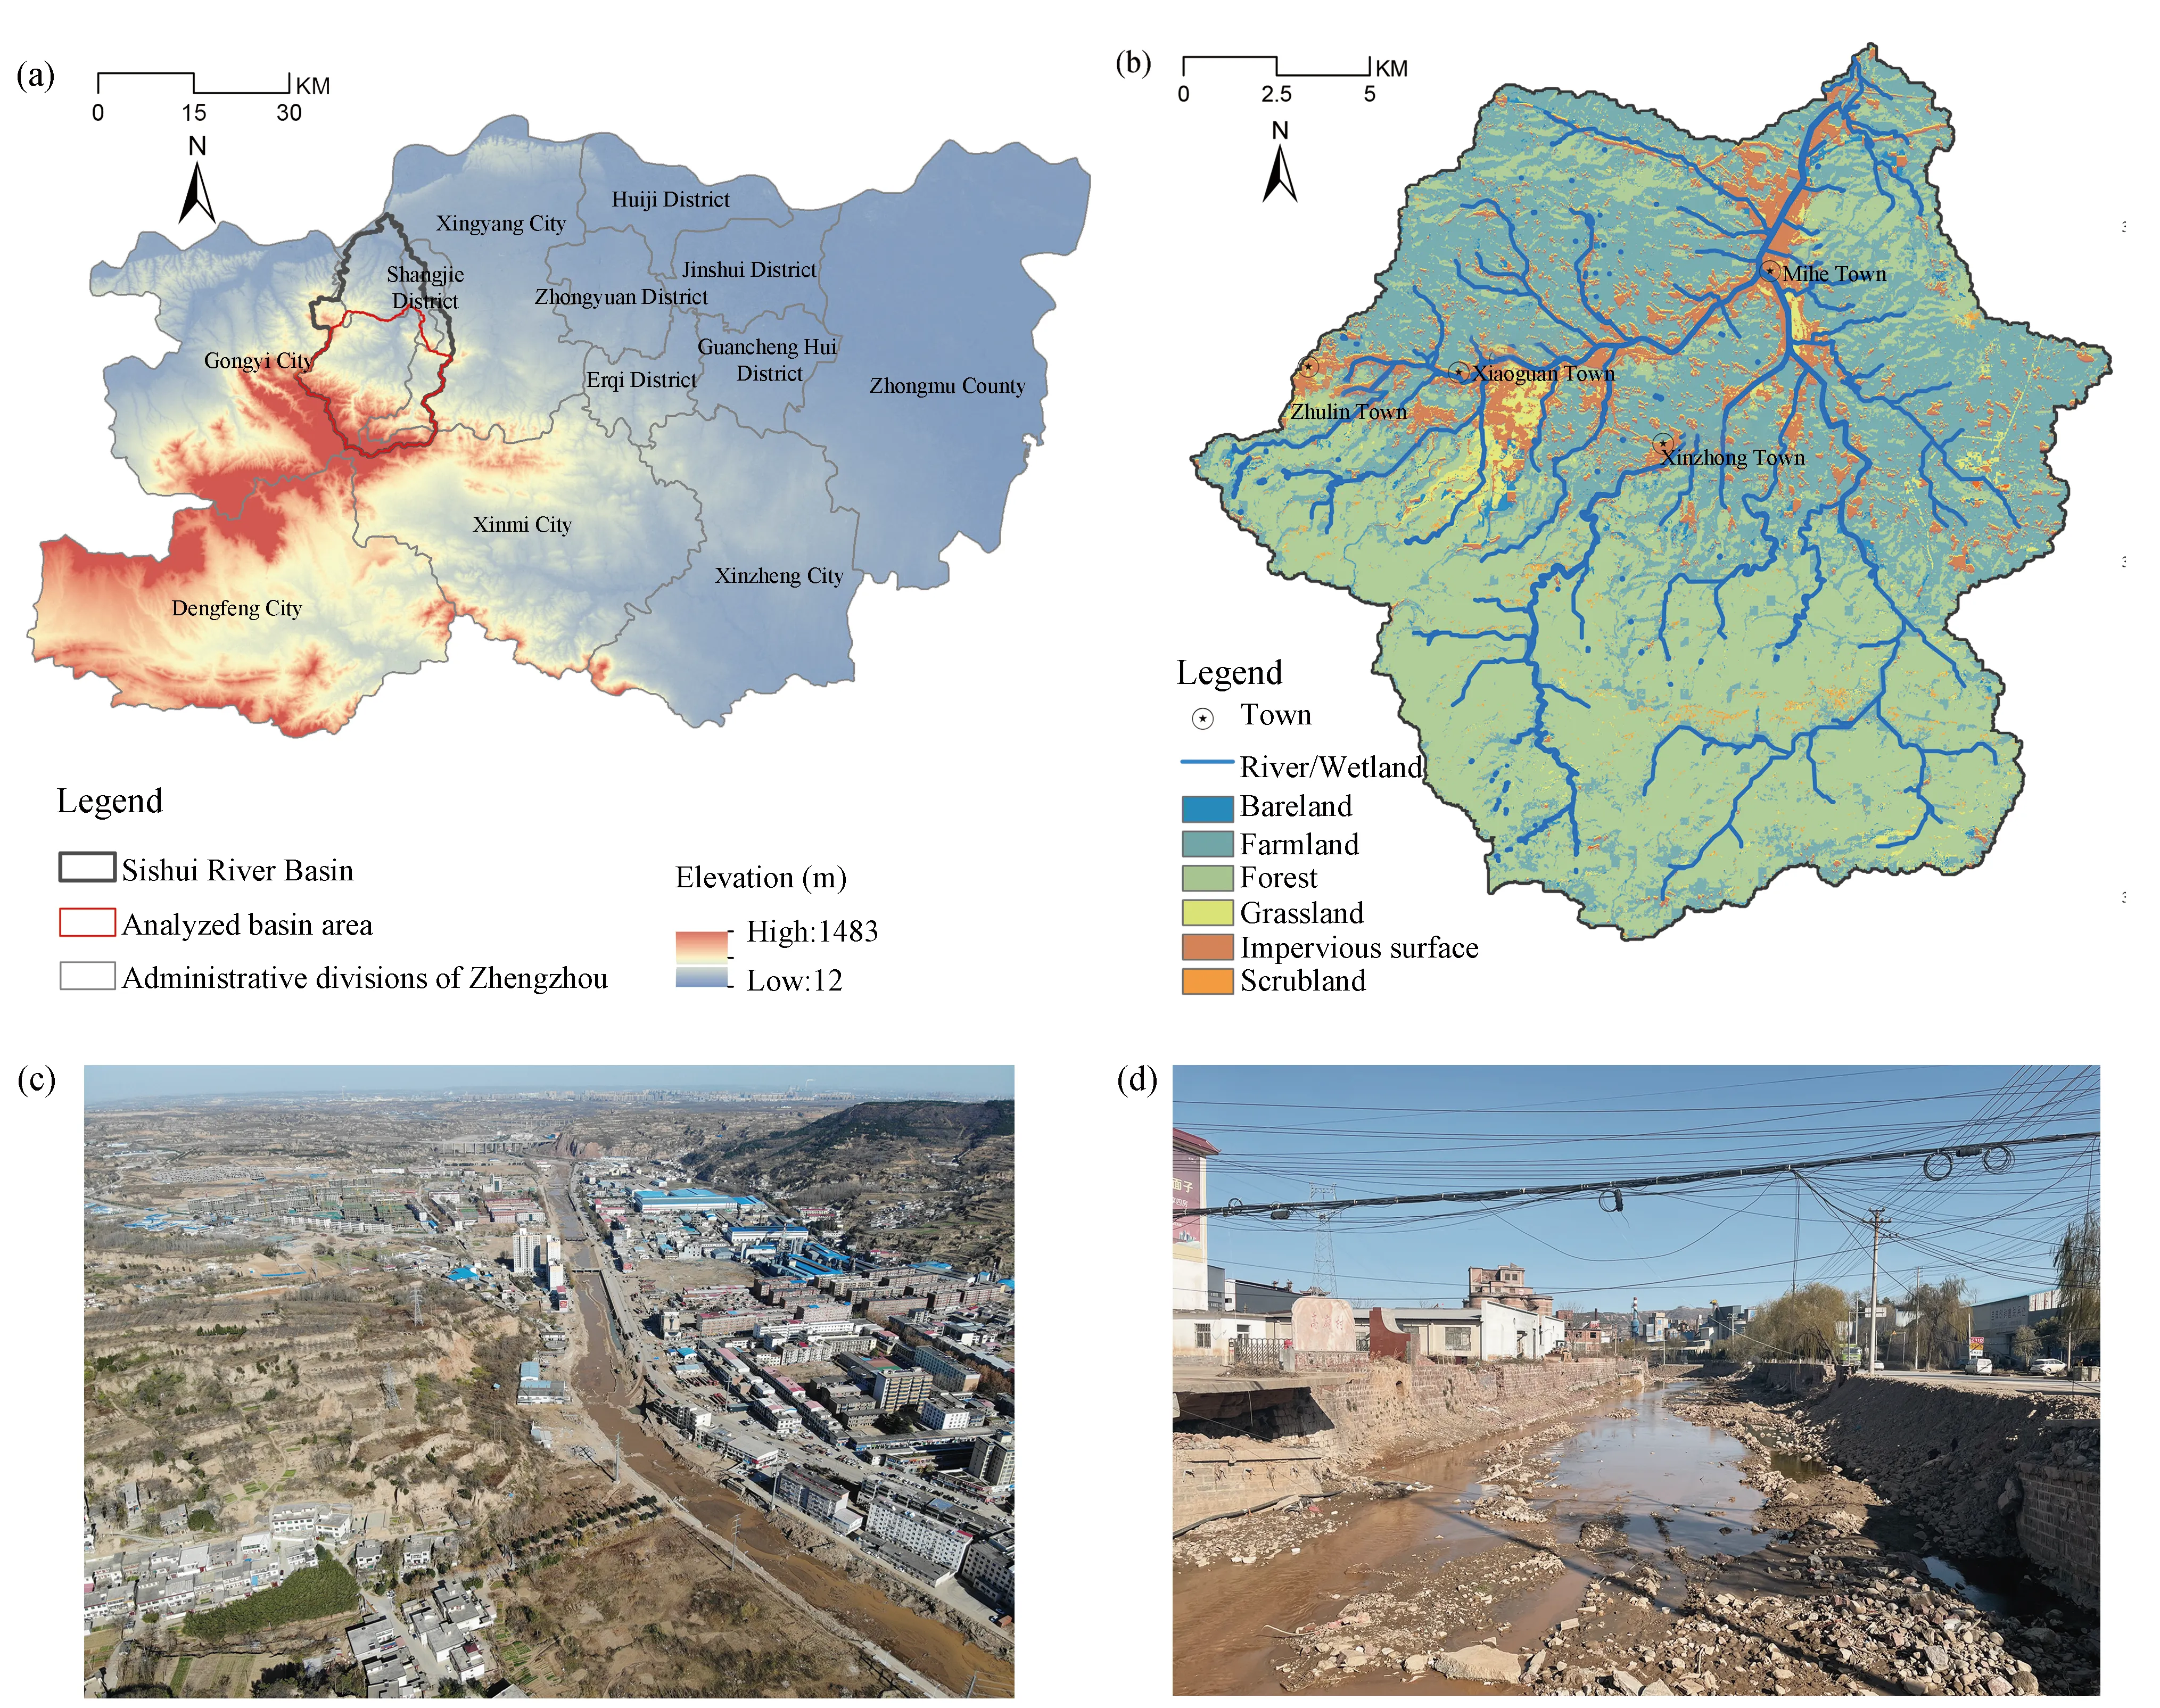
The Sishui River, a major tributary of the Yellow River, traverses Gongyi City, Shangjie District, and Xingyang City in Henan Province (
). The main channel is 46.74 km long, draining a catchment area of 373.28 km
2 [
63], with about 190 km
2 within Gongyi’s jurisdiction. The basin has a typical temperate continental monsoon climate, with most rainfall occurring from July to September. The region is characterized by mountainous terrain and limited alluvial plains, concentrating urban development along river corridors and tributary junctions. The prevalence of collapsible loess soils in mountainous headwater regions, combined with intense rainfall, results in rapid floods that carry large amounts of sediment and rocks, causing severe erosion and damage when flooding occurs in this basin.
. Study area of the Sishui River Basin: (<b>a</b>) Location, (<b>b</b>) Land use, (<b>c</b>) Aerial view of flooding, and (<b>d</b>) Damaged infrastructures.
Mihe Town is located at a critical downstream confluence where the Sishui River joins the Mihe, Fanpo, and Shensi Rivers. During the extreme rainfall event on 20 July 2021, this mountainous region of western Zhengzhou suffered catastrophic flooding, resulting in the destruction of 28 roads and bridges, 406 houses, and extensive damage to drainage, power, gas, and communication facilities [
64]. The post-disaster reconstruction of Mihe Town serves as a case study to quantitatively evaluate the impact of various interventions on WFR in the Sishui River Basin. This implementation provides a practical demonstration of the proposed framework’s effectiveness in integrated watershed management.
4.2. Modeling Approach and Intervention Design
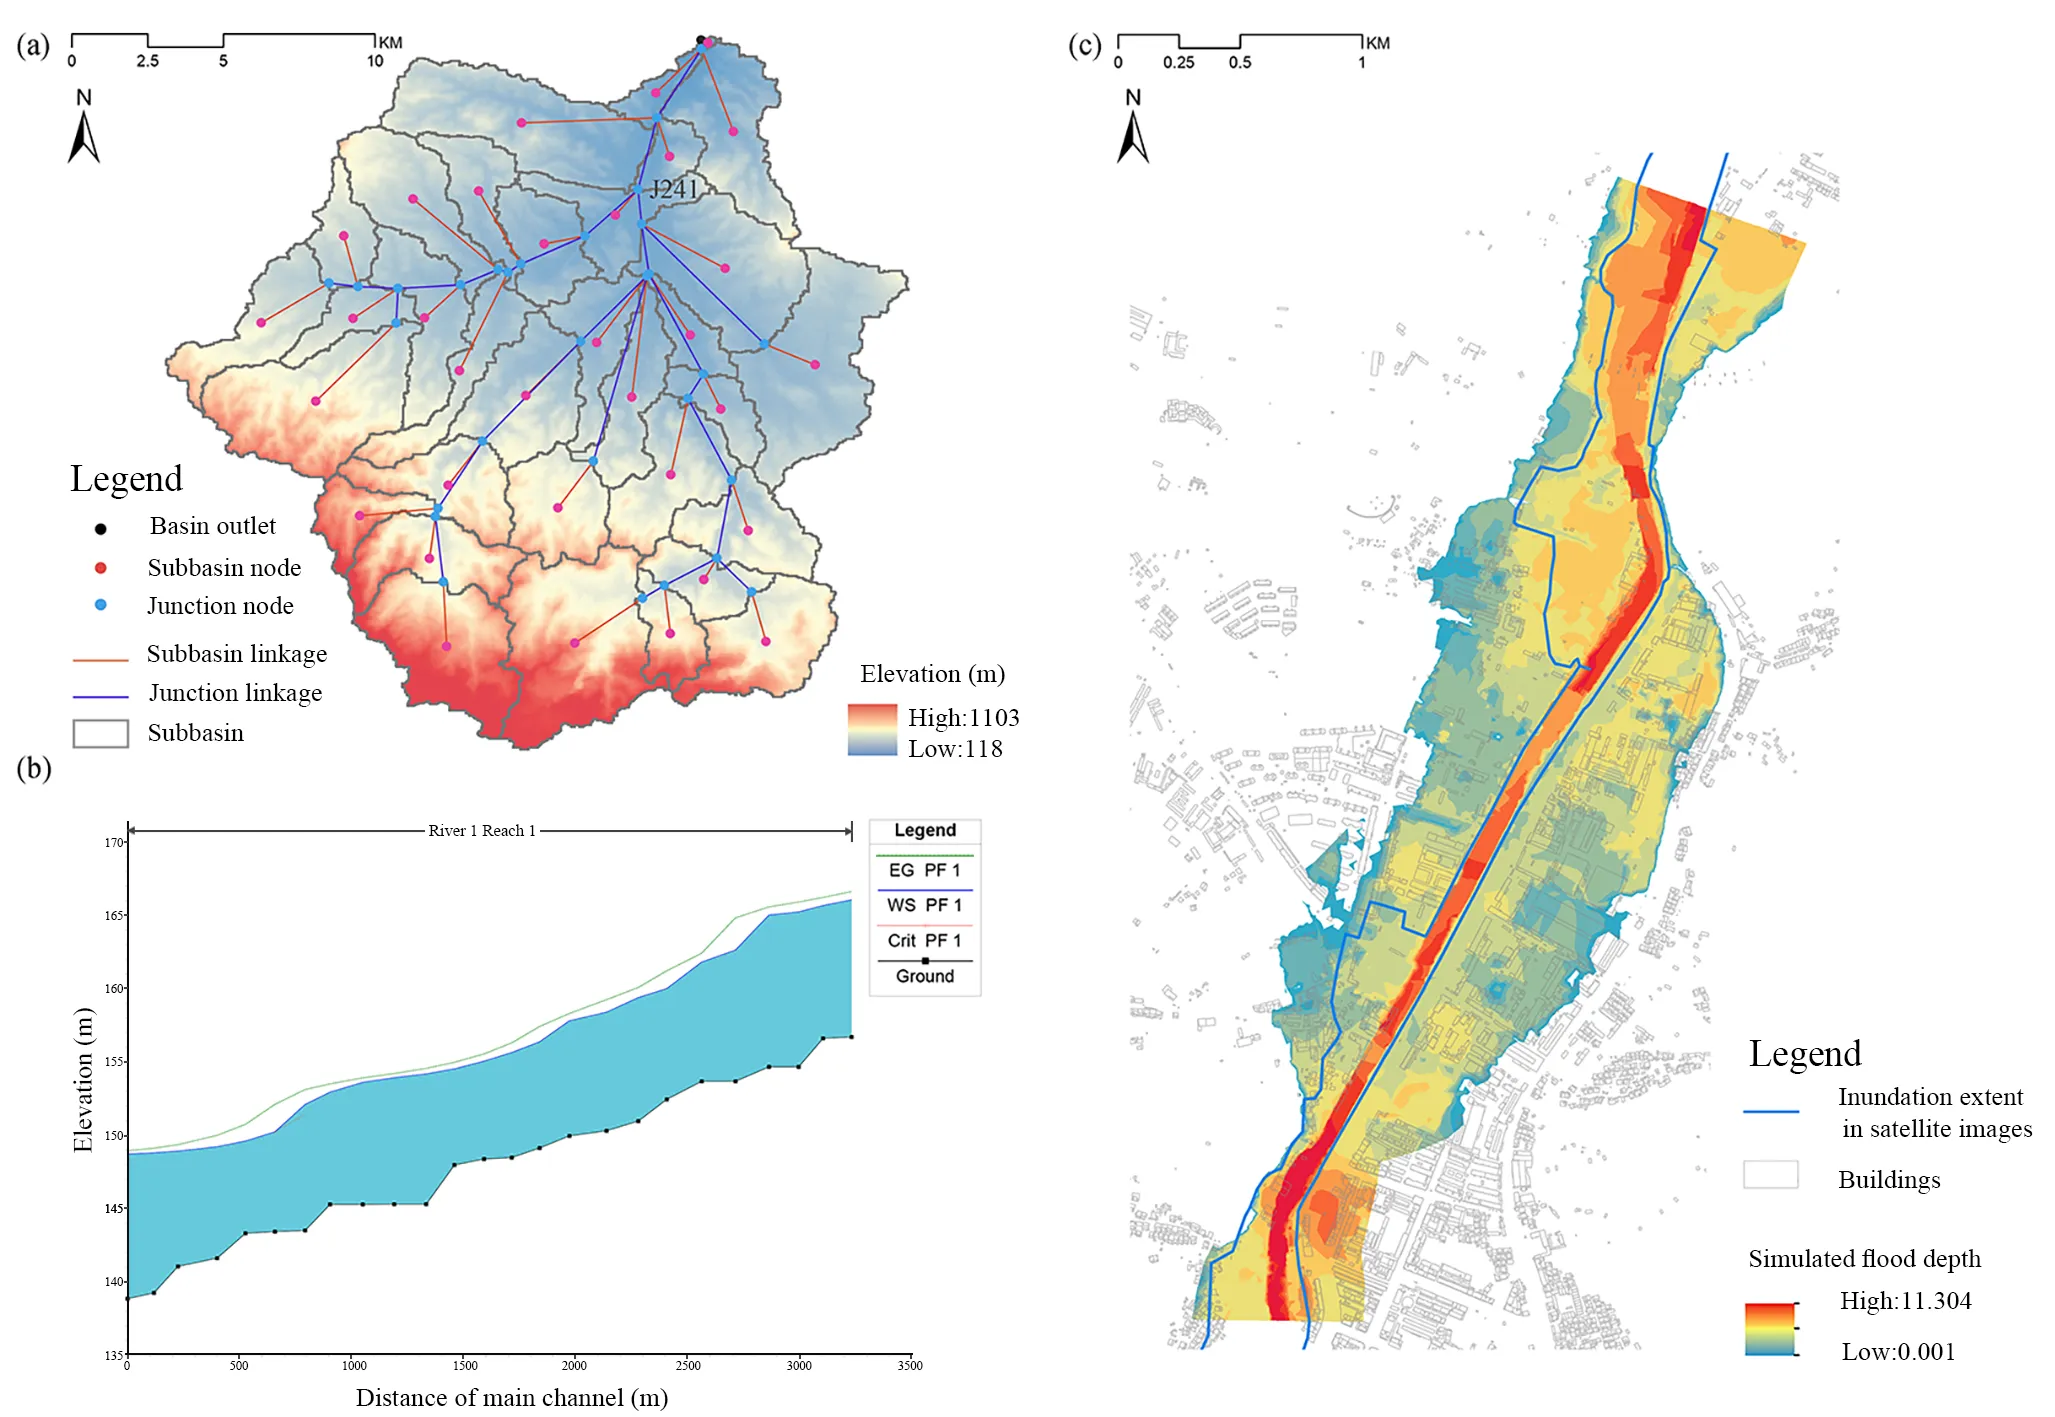
The upstream area of the Sishui River Basin above Mihe town was selected as the site for hydrological modeling, encompassing 33 subbasins delineated by hydrological boundaries. The rainfall-runoff process was simulated using the Soil Conservation Service Curve Number (SCS-CN) method and the SCS unit hydrograph approach to estimate discharge at each subbasin outlet. Flood wave propagation through the river network was modeled using the Muskingum–Cunge channel routing method, resulting in peak discharge hydrographs at the Mihe confluence. A 2-D hydrodynamic flood inundation model was constructed in HEC-RAS, utilizing a high-resolution digital elevation model (DEM) derived from topographic survey data. Model calibration was achieved by comparing simulated inundation extents with observed data from 20 July 2021, Zhengzhou flood (
). To evaluate the effects of WFR interventions, the calibrated model was run with 24-h design storms for 10-, 20-, 50-, and 100-year return periods, based on the historical precipitation records in Zhengzhou (
). Further details on model parameterization, calibration, and hydraulic parameter selection are available in Peng et al. (2022) [
16].
. Flood modeling and calibration process: (<b>a</b>) HEC-HMS model schematic with control point, (<b>b</b>) HEC-RAS water table profile (EG: Energy grade, WS: Water surface, Crit: Critical depth), and (<b>c</b>) Observed (satellite) vs. simulated flood extent (adapted from the reference [
16]).
.
Information about rainfall scenarios.
| Scenario |
Frequency (Year) |
Total Rainfall (mm) |
Duration (h) |
| 1 |
10 |
135.4 |
24 |
| 2 |
20 |
162.6 |
24 |
| 3 |
50 |
198.6 |
24 |
| 4 |
100 |
226.7 |
24 |
Drawing upon established flood risk management concepts, such as the source-pathway-receptor (SPR) model and consequence analysis [
65], a suite of intervention measures was developed within the “source-flow-sink” framework [
16]:
- (1)
-
Source interventions: Expansion of runoff retention capacity in subbasins by constructing small reservoirs and ponds, targeting storage of 15% of runoff volume under the 50-year rainfall condition.
- (2)
-
Flow interventions: Modification of riverbanks (both earthen and hardened) to support vegetated embankments, uniformly increasing Manning’s n to 0.05 to enhance flow resistance.
- (3)
-
Sink interventions: Implementation of flood protection in urban areas based on the “return space to rivers” principle, including widening river channels, relocating buildings from flood-prone zones to create riverine parks, and installing floodable recreational facilities.
These intervention measures can be applied individually or in combination to adjust system parameters within the WFR framework, enabling quantitative assessment of their effectiveness.
4.3. Evaluation of Intervention Effectiveness
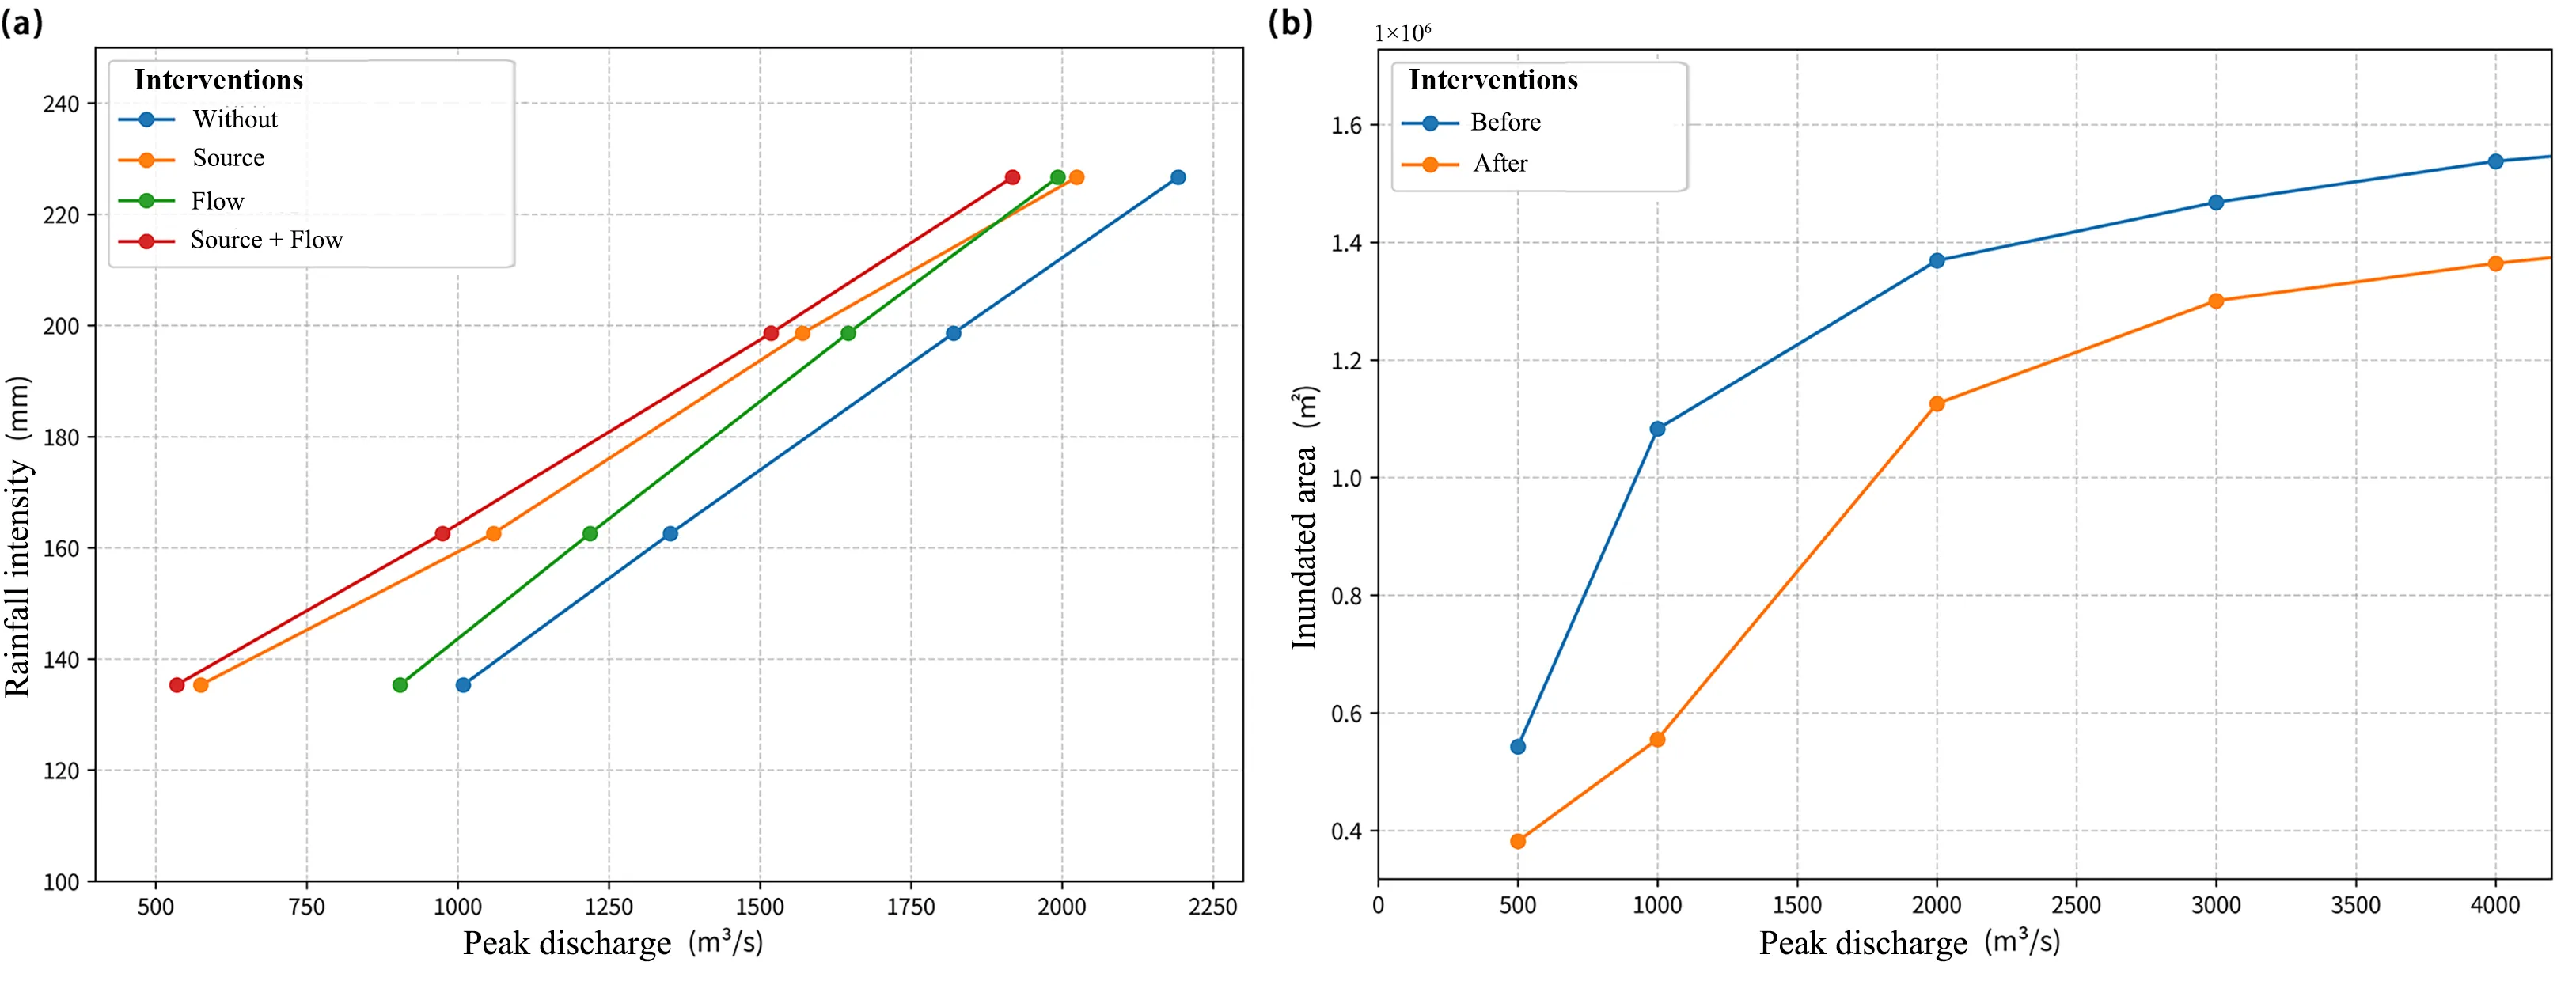
Model simulations were performed for four rainfall scenarios, corresponding to 10-, 20-, 50-, and 100-year return periods. Results indicate that peak discharge increases with rainfall intensity. Among the interventions, source measures generally outperformed flow measures under moderate rainfall, but under extreme (100-year) events, flow interventions became more effective, highlighting the event-dependence of intervention efficiency (
a). For sink interventions, a notable reduction in flood inundation area was observed in the town, especially when peak discharge ranged from 500 to 2000 m
3/s (
b).
. Hydrological response curves for interventions under different rainfall scenarios: (<b>a</b>) Rainfall-flow curves, (<b>b</b>) Flow-loss curves.
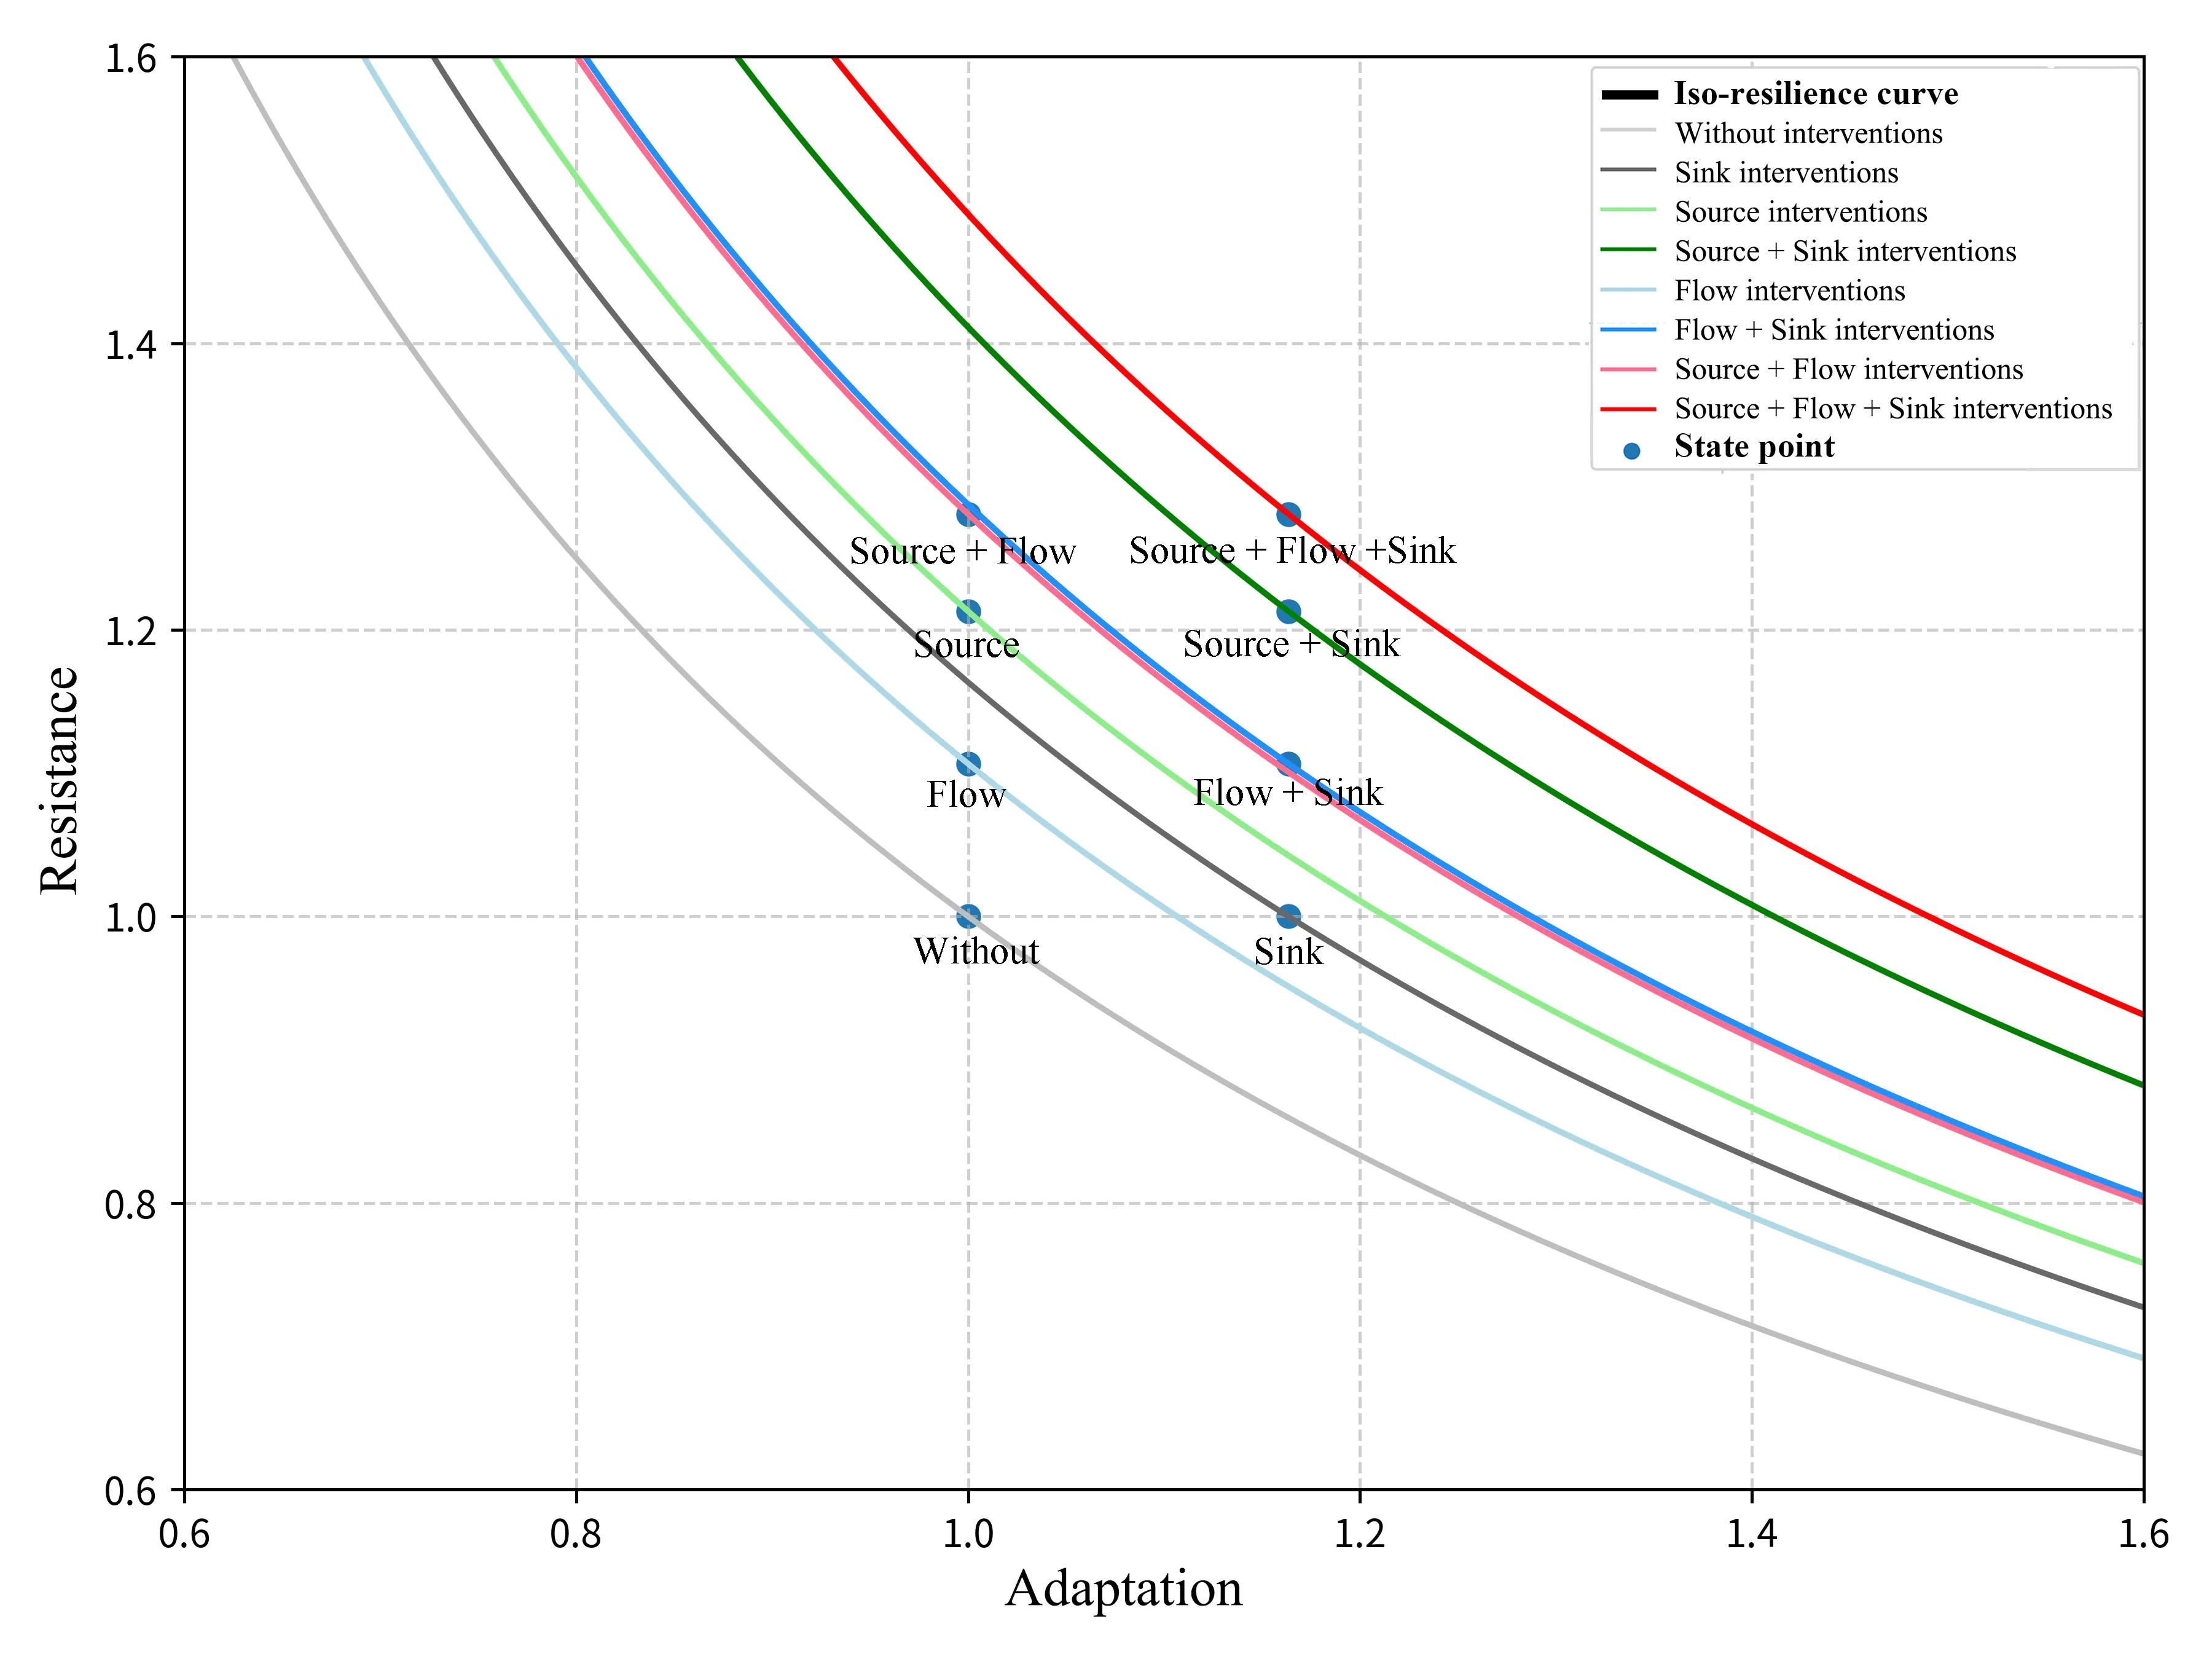
The positions of different intervention strategies in the WFR state space were determined using the corresponding rainfall-flow and flow-loss curves (
). All interventions contributed to improved WFR, but their effectiveness varied. In this case, source interventions were generally more effective than flow interventions, and both were less effective individually than when combined. Sink interventions outperformed flow interventions but were less effective than source interventions. Notably, the combined effect of source and flow interventions was comparable to that of combined flow and sink interventions, suggesting a compensatory relationship among intervention types. For example, increasing upstream storage can yield benefits similar to expanding downstream flood protection. These findings provide a foundation for cost-benefit trade-off analysis in watershed management.
. State points and iso-resilience curves of interventions in WFR state space.
5. Conclusions and Future Work
5.1. Conclusions
Watershed flood resilience (WFR) is a comprehensive attribute reflecting a system’s capacity to resist, adapt to, and recover from flood events. It is expressed through both spatial dimensions, such as flood regulation and adaptation capacities, and nonspatial dimensions, such as socio-economic and institutional factors. This study primarily quantified the spatial dimensions of WFR using process-based curves, establishing a WFR state space. By applying the “source-flow-sink’ framework, this study systematically analyzed how different landscape elements influence WFR. The post-disaster reconstruction of the Shishui River Basin following the “7·20” extreme rainfall event served as a case study, where the implementation of source, flow, and sink interventions demonstrated significant improvements in resilience metrics. These results confirm the operational feasibility and effectiveness of the proposed WFR framework for guiding integrated watershed management and climate adaptation.
5.2. Limitations and Future Work
Despite the demonstrated effectiveness of the proposed framework, several limitations and future directions remain. First, the current study focuses mainly on spatial and process-based metrics, while post-disaster recovery’s socio-economic and institutional dimensions require further quantitative research. Future work should develop robust, practical indicators (e.g., GDP recovery, housing construction rate) for these aspects, and explore alternative, simplified approaches for WFR assessment to enhance applicability.
Second, the current study relies on the availability of high-resolution meteorological and topographic data to calibrate and validate the process-based models, which may be limited or of low quality in less-developed or data-scarce regions. Besides, the modeling approach assumes uniformity in certain parameters (e.g., Manning’s n, soil properties) and may not fully capture local heterogeneity or complex socio-ecological interactions. These can introduce uncertainties in model parameterization, reduce the accuracy of resilience metrics, and constrain the transferability of the framework. Future research should explore the use of remote sensing, citizen science, or data assimilation techniques to address data gaps and develop simplified or proxy-based assessment methods suitable for data-limited contexts.
Third, integrating and optimizing multiple intervention strategies should be systematically evaluated using cost-benefit and multi-criteria analyzes to support decision-making in watershed management and spatial planning. For example, source interventions (e.g., ponds, terraces, check dams) are generally cost-effective for moderate rainfall events and can be implemented incrementally, but their effectiveness diminishes under extreme rainfall due to storage limitations; flow interventions (e.g., river widening, increasing roughness) require more substantial investment and may involve significant land acquisition or ecological trade-offs, yet they become increasingly important for managing peak flows during severe events; sink interventions (e.g., elevating structures, creating floodable parks) often entail higher upfront costs and urban planning adjustments but provide the greatest reduction in flood loss, especially for built-up areas at risk. In future practice, the optimal strategy should be selected based on a combination of cost, expected benefit, and site-specific constraints in a quantitative manner.
Finally, in the context of climate change, resilience should be regarded not only as a safety indicator but also as a guiding principle for the holistic and adaptive optimization of territorial space [
66]. Interdisciplinary integration of watershed hydrology, hydraulic modeling, and spatial planning is essential to advance from traditional flood control to comprehensive territorial resilience.
Acknowledgments
We especially thank Kongjian Yu from Peking university for the insightful conceptual guidance he provided for this study.
Author Contributions
Conceptualization, X.P.; Methodology, X.P.; Software, S.W. (Shipeng Wen); Data Curation, X.P., S.W. (Shipeng Wen), Y.H. and S.W. (Songtao Wu); Writing—Original Draft Preparation, X.P.; Writing—Review & Editing, X.P. and S.W. (Songtao Wu); Visualization, X.P. and S.W. (Shipeng Wen); Supervision, X.P.
Ethics Statement
Not applicable.
Informed Consent Statement
Not applicable.
Data Availability Statement
Data will be made available on request. The data are not publicly available due to privacy.
Funding
This study was financially supported by the Heilongjiang Provincial Postdoctoral Science Foundation (Grant No. LBH-Z23164) and the Natural Science Foundation of Heilongjiang Province (Grant No. LH2024E051).
Declaration of Competing Interest
The authors declare that they have no known competing financial interests or personal relationships that could have appeared to influence the work reported in this paper.
Footnotes
- 1.
-
State space refers to a mathematical or graphical representation of all possible states of a system in systems theory, defined by key variables (such as resistance and adaptation capacities in flood resilience). In this study, the state space is used to visualize and assess the combined effects of different interventions on watershed flood resilience.
- 2.
-
Iso-resilience curve is a conceptual line or contour in a state space diagram along which the overall resilience of a system remains constant, despite changes in its underlying components (such as resistance and adaptation capacities). In the context of watershed flood resilience, points lying on the same iso-resilience curve represent different combinations of system properties that yield the same level of resilience, which helps to visualize trade-offs and optimization paths for resilience improvement.
- 3.
-
“Source-flow-sink” is a conceptual framework derived from landscape ecology, representing the spatial process of material or energy movement from the starting to the ending. Taking the water movement in a watershed as an example, “source” refers to areas where runoff is generated (e.g., headwaters, hillslopes), “flow” denotes the pathways and channels through which water is conveyed, and “sink” indicates zones where water is stored, absorbed, or utilized (e.g., floodplains, wetlands, and urban areas). This framework helps to systematically analyze and manage flood processes across the entire watershed.
References
-
1.
Wasko C, Nathan R, Stein L, O'Shea D. Evidence of shorter more extreme rainfalls and increased flood variability under climate change.
J. Hydrol. 2021,
603, 126994.
[Google Scholar]
-
2.
Blöschl G, Kiss A, Viglione A, Barriendos M, Böhm O, Brázdil R, et al. Current European flood-rich period exceptional compared with past 500 years: 7817.
Nature 2020,
583, 560–566.
[Google Scholar]
-
3.
Sayers PB, Hall JW, Meadowcroft IC. Towards risk-based flood hazard management in the UK.
Civ. Eng. 2002,
150, 36–42.
[Google Scholar]
-
4.
Meng M, Li WZ, Wang SF, Yan J, Nadin V. Governing climate adaptation planning: The integration between water management and spatial planning in the Netherlands.
Urban Plan. Int. 2021,
36, 41–51. (In Chinese)
[Google Scholar]
-
5.
Holling CS, Meffe GK. Command and control and the pathology of natural resource management.
Conserv. Biol. 1996,
10, 328–337.
[Google Scholar]
-
6.
Cheng XT, Liu CJ, Li CZ, Yu Q, Li N. Theoretical framework and application of urban rainstorm flood control in high-density cities.
J. Hydraul. Eng. 2022,
53, 757–768+778. (In Chinese)
[Google Scholar]
-
7.
Barbosa AE, Fernandes JN, David LM. Key issues for sustainable urban stormwater management.
Water Res. 2012,
46, 6787–6798.
[Google Scholar]
-
8.
Fletcher TD, Shuster W, Hunt WF, Ashley R, Butler D, Arthur S, et al. SUDS, LID, BMPs, WSUD and more—The evolution and application of terminology surrounding urban drainage.
Urban Water J. 2014,
12, 525–542.
[Google Scholar]
-
9.
Kravčík M, Pokorný J, Kohutiar J, Kováč M, Tóth E. Water for the Recovery of the Climate-A New Water Paradigm. In Proceedings of the Joint Conference of APLU and ICA, Prague, Czech Republic, 23–26 June 2009.
-
10.
Liao K-H. A theory on urban resilience to floods—a basis for alternative planning practices.
Ecol. Soc. 2012,
17, 48.
[Google Scholar]
-
11.
Li F, Zhang J. A review of the progress in Chinese sponge city programme: Challenges and opportunities for urban stormwater management.
Water Supply 2021,
22, 1638–1651.
[Google Scholar]
-
12.
European Parliament. Directive 2007/60/EC of the European Parliament and of the Council of 23 October 2007 on the Assessment and Management of Flood Risks (Text with EEA Relevance). (2007-06-11). Available online: https://eur-lex.europa.eu/eli/dir/2007/60/oj/eng (accessed on 14 May 2025).
-
13.
FEMA. Risk Mapping, Assessment and Planning (Risk MAP). (2025-03-28). Available online: https://www.fema.gov/flood-maps/tools-resources/risk-map (accessed on 14 May 2025).
-
14.
Wei XW. Establish a “five-guarantee” system for the basin and enhance the “threefold resilience” of urban flood control. China Water Resources News, 2 February 2023, p. 005. (In Chinese)
-
15.
Ministry of Finance, Ministry of Housing and Urban-Rural Development, Ministry of Water Resources. Notice on the Demonstration Work of Systematic Territory-Wide Promotion of Sponge City Construction. (2021-04-26). Available online: http://www.gov.cn/zhengce/zhengceku/2021-04/26/content_5602408.htm (accessed on 30 December 2022). (In Chinese)
-
16.
Peng X, Heng X, Li Q, Li J, Yu K. From sponge cities to sponge watersheds: Enhancing flood resilience in the Sishui River Basin in Zhengzhou, China.
Water 2022,
14, 3084.
[Google Scholar]
-
17.
Wang J, Xue F, Jing R, Lu Q, Huang Y, Sun X, et al. Regenerating sponge city to sponge watershed through an innovative framework for urban water resilience.
Sustainability 2021,
13, 5358. doi:10.3390/su13105358.
[Google Scholar]
-
18.
Wang YT, Hu QF, Su X, Shang SW. Measures to build resilience for flood control in river basin in changing environment.
China Water Resour. 2022,
22, 21–24. (In Chinese)
[Google Scholar]
-
19.
Zhai GF. Resilient planning responses to urban flood disasters in the context of climate change: Key concepts, fundamental ideas, and a comprehensive framework.
Urban Plan. Forum 2024,
1, 29–37. (In Chinese)
[Google Scholar]
-
20.
Yang MX, Huang B, Cui C, Xiao ZP. Review and prospect: Urban disaster resilience.
Urban Plan. Forum 2016,
1, 48–55. (In Chinese)
[Google Scholar]
-
21.
Wilby RL. Resilience viewed through the lens of climate change and water management.
Water 2020,
12, 2510.
[Google Scholar]
-
22.
Fisher L. More than 70 ways to show resilience.
Nature 2015,
518, 35.
[Google Scholar]
-
23.
PUB. Managing Stormwater for Our Future. Available online: https://www.pub.gov.sg/Documents/ManagingStormwater.pdf (accessed on 17 March 2023).
-
24.
Carpenter S, Walker B, Anderies JM, Abel N. From metaphor to measurement: resilience of what to what?
Ecosystems 2001,
4, 765–781.
[Google Scholar]
-
25.
Cai LH. Introduction of hydrological and hydraulic models for “Sponge City”.
Landsc. Archit. 2016,
2, 33–43. (In Chinese)
[Google Scholar]
-
26.
Deng CX, Liu CC, Li ZW. Research path on the resilience of watershed territorial space under the background of ecological restoration.
China Land Sci. 2022,
36, 11–20. (In Chinese)
[Google Scholar]
-
27.
Alexander DE. Resilience and disaster risk reduction: an etymological journey.
Nat. Hazards Earth Syst. Sci. 2013,
13, 2707–2716.
[Google Scholar]
-
28.
Mugume SN, Diao K, Astaraie-Imani M, Fu G, Farmani R, Butler D. Enhancing resilience in urban water systems for future cities.
Water Supply 2015,
15, 1343–1352.
[Google Scholar]
-
29.
Binesh N, Niksokhan MH, Sarang A, Rauch W. Improving resilience of urban drainage system in adaptation to climate change (Case study: Northern Tehran, Iran). In Proceedings of the International Conference on Building Tomorrow’s Society, Fredericton, NB, Canada, 30 September 2022.
-
30.
Shao YW, Xu J. Understanding urban resilience: A conceptual analysis based on integrated international literature review.
Urban Plan. Int. 2015,
30, 48–54. (In Chinese)
[Google Scholar]
-
31.
Folke C. Resilience: the emergence of a perspective for social–ecological systems analyses.
Glob. Environ. Chang. 2006,
16, 253–267.
[Google Scholar]
-
32.
Smit B, Wandel J. Adaptation, adaptive capacity and vulnerability.
Glob. Environ. Chang. 2006,
16, 282–292.
[Google Scholar]
-
33.
Berkes F, Colding J, Folke C. Navigating Social–Ecological Systems: Building Resilience for Complexity and Change; Cambridge University Press: Cambridge, UK, 2003.
-
34.
Li Y, Zhai GF, Gu FM. Review on methods of quantification of urban infrastructure resilience.
Urban Dev. Stud. 2016,
23, 113–122. (In Chinese)
[Google Scholar]
-
35.
Ouyang M, Dueñas-Osorio L, Min X. A three-stage resilience analysis framework for urban infrastructure systems.
Struct. Saf. 2012,
36–37, 23–31.
[Google Scholar]
-
36.
Wang L, Cui S, Li Y, Huang H, Manandhar B, Nitivattananon V, et al. A review of the flood management: From flood control to flood resilience.
Heliyon 2022,
8, e11763.
[Google Scholar]
-
37.
Ambily P, Chithra N, Mohammed Firoz C. A framework for urban pluvial flood resilient spatial planning through blue-green infrastructure.
Int. J. Disaster Risk Reduct. 2024,
103, 104342.
[Google Scholar]
-
38.
Lawson G, Toueir N, Bahl S. Socio-ecological resilience by design for flood-prone waterfront cities: A comparative study of new orleans, usa; brisbane, australia and christchurch, new zealand. In Disaster Risk Reduction for Resilience: Disaster and Social Aspects; Eslamian S, Eslamian F, Eds.; Springer International Publishing: Cham, Switzerland, 2022; pp. 141–175.
-
39.
Lan ZQ, Yue BR, Wang JR. Analysis method and application of spatial mechanism in landscape ecological planning.
J. Xi’an Univ. Archit. Technol. (Nat. Sci. Ed.) 2022,
54, 120–126. (In Chinese)
[Google Scholar]
-
40.
Chen N, Xiang H, Ma B, Li J. Research hotspots and trends of urban stormwater management in China based on resilience theory.
Chin. J. Appl. Ecol. 2022,
33, 3137–3145. (In Chinese)
[Google Scholar]
-
41.
Rana VK, Suryanarayana TMV. Estimation of flood influencing characteristics of watershed and their impact on flooding in data-scarce region.
Ann. GIS 2021,
27, 397–418.
[Google Scholar]
-
42.
Dwarakish GS, Ganasri BP. Impact of land use change on hydrological systems: A review of current modeling approaches.
Cogent Geosci. 2015,
1, 1115691.
[Google Scholar]
-
43.
Pathak S, Ahmad MM. Role of government in flood disaster recovery for SMEs in Pathumthani Province, Thailand.
Nat. Hazards 2018,
93, 957–966.
[Google Scholar]
-
44.
Chan NW, Roy R, Lai CH, Tan ML. Social capital as a vital resource in flood disaster recovery in Malaysia.
Int. J. Water Resour. Dev. 2019,
35, 619–637.
[Google Scholar]
-
45.
Horney J, Dwyer C, Aminto M, Berke P, Smith G. Developing indicators to measure post-disaster community recovery in the United States.
Disasters 2017,
41, 124–149.
[Google Scholar]
-
46.
Lalonde M, Drenkhan F, Rau P, Baiker JR, Buytaert W. Scientific evidence of the hydrological impacts of nature-based solutions at the catchment scale.
WIREs Water 2024,
11, e1744.
[Google Scholar]
-
47.
Xu L, Gober P, Wheater HS, Kajikawa Y. Reframing socio-hydrological research to include a social science perspective.
J. Hydrol. 2018,
563, 76–83.
[Google Scholar]
-
48.
Brown ED, Williams BK. Resilience and resource management.
Environ. Manag. 2015,
56, 1416–1427.
[Google Scholar]
-
49.
Duan YY, Zhai GF, Li WJ. International research progress on measuring urban resilience.
Urban Plan. Int. 2021,
36, 79–85. (In Chinese)
[Google Scholar]
-
50.
Cutter SL. The landscape of disaster resilience indicators in the USA.
Nat. Hazards 2016,
80, 741–758.
[Google Scholar]
-
51.
Shuang Q, Liu HJ, Porse E. Review of the quantitative resilience methods in water distribution networks.
Water 2019,
11, 1189.
[Google Scholar]
-
52.
Cassottana B, Shen L, Tang LC. Modeling the recovery process: A key dimension of resilience.
Reliab. Eng. Syst. Saf. 2019,
190, 106528.
[Google Scholar]
-
53.
Tian RW, Zhao CW, He ZH, Xu ZR. Research review of “source-sink” landscape theory.
Guizhou Sci. 2019,
37, 24–29. (In Chinese)
[Google Scholar]
-
54.
Ma Z, Zhang S, Zhao S. Study on the spatial pattern of migration population in Egypt and its flow field characteristics from the perspective of “source-flow-sink”.
Sustainability 2021,
13, 350.
[Google Scholar]
-
55.
Wang ZF, Chen KX. Spatial and temporal changes of ‘source-sink’ landscapes during stromwater processes in the North Canal Basin, China.
Acta Ecol. Sin. 2019,
39, 5922–5931. (In Chinese)
[Google Scholar]
-
56.
Zhou T, Yang L, Zhao F, Li X, Deng J, Li M, et al. Impacts of source and sink landscape dynamics on runoff and sediment in the source watershed of the Weihe River.
Acta Ecol. Sin. 2022,
42, 58–66. (In Chinese)
[Google Scholar]
-
57.
Yan SJ, Chao YS, Pan H, Zhao JW, Wu LY. Process dynamic analysis and risk assessment of rainfall and flood in Yongchun County Based on the Source-Sink Landscape.
Res. Soil Water Conserv. 2023,
30, 286–292. (In Chinese)
[Google Scholar]
-
58.
Yan QY, Zhang KY. Research on urban stormwater management measures based on “Source-Sink” Theory.
Urban. Archit. 2019,
16, 67–69. (In Chinese)
[Google Scholar]
-
59.
Turner MG, Gardner RH. Landscape Ecology in Theory and Practice: Pattern and Process; Springer: New York, NY, USA, 2015. Available online: https://link.springer.com/10.1007/978-1-4939-2794-4 (accessed on 28 February 2025).
-
60.
Beven KJ. Rainfall-Runoff Modelling: The Primer; John Wiley & Sons, Inc.: Hoboken, NJ, USA, 2011.
-
61.
Hewett CJM, Wilkinson ME, Jonczyk J, Quinn PF. Catchment systems engineering: An holistic approach to catchment management.
WIREs Water 2020,
7, e1417.
[Google Scholar]
-
62.
Ma K, Tang XL, Ren YJ, Ge Y, Deng M. Study on construction strategy of storm water management in hilly land based on resilience theory.
J. Nanjing For. Univ. (Nat. Sci. Ed.) 2018,
42, 139–145. (In Chinese)
[Google Scholar]
-
63.
Gu YZ, Li XG, Wang YS. Comparison of embankment filling schemes for the Sishui River.
Henan Water Resour. South- -North Water Divers. 2016,
5, 88–89. (In Chinese)
[Google Scholar]
-
64.
State Council Disaster Investigation Group. Investigation Report on the “7-20” Extremely Heavy Rainstorm Disaster in Zhengzhou, Henan Province. Available online: https://www.mem.gov.cn/gk/sgcc/tbzdsgdcbg/202201/P020220121639049697767.pdf (accessed on 25 December 2024). (In Chinese)
-
65.
Holdgate MW. A Perspective of Environmental Pollution; Cambridge University Press: Cambridge, UK, 1979.
-
66.
Zeng J, Tian J, Wang QW, Sun KK. Theory of climate resilience, disaster adaptation, and flood mitigation in territorial spatial planning systems: A case study of the Fujian Delta Region.
Sci. Sin. (Technol.) 2023,
53, 1713–1727. (In Chinese)
[Google Scholar]