1. Introduction
Mountains are crucial for global ecological and human systems, providing essential ecosystem services (ES) that support both natural environments and human livelihoods [
1,
2]. Covering about 27% of the Earth’s land surface and home to 15% of the global population, mountains supply 60% to 80% of the world’s freshwater [
3,
4]. They offer vital services, including provisioning, regulating, supporting, and cultural services, all crucial for local and global communities [
5]. These services are vital for agriculture and livelihood for most mountain farmers. However, natural and human activities degrading these services can severely impact both local and downstream agriculture and the livelihoods of the farmers [
6]. Therefore, understanding farmers’ perspectives on the significance, contributions, and trends of ES is essential for effective management in human-dominated mountain watersheds [
7].
Mountains are vital for providing ES essential for both ecological balance and economic benefits [
7,
8]. In developing regions, where economies heavily depend on agriculture, these services are crucial. For instance, in Nepal, farmers rely on water, land productivity, and forest-based tools, all of which are essential for sustainable and resilient farming [
9,
10]. Provisioning services, including freshwater, timber, firewood, fodder, and natural medicine, are essential for producing food, fiber, and other agricultural products [
5,
9,
10]. Healthy ecosystems ensure a reliable supply of clean water for irrigation and maintain soil health, which is vital for agriculture [
5,
11]. Regulating services, such as water purification and natural hazard control, mitigate farming risks by preventing landslides and soil erosion, contributing to land management [
11,
12]. Supporting services like nutrient cycling and habitat provision underpin agricultural systems by ensuring the continuous availability of essential elements like nitrogen and phosphorus for plant growth [
5,
11]. Cultural services add value through agricultural landscapes’ cultural, spiritual, recreational, and ecotourism significance, enhancing social well-being and identity [
5,
7]. Farmers, in turn, act as environmental stewards, providing ES to society. By adopting sustainable practices like agroforestry, agrifood systems produce public benefits, including biodiversity conservation, carbon storage and sequestration, and watershed regulation [
9,
10,
13].
Ecosystem management is shaped by policies and the decisions of farmers. Their activities rely on different ecological patches (such as forests, agricultural lands, and water bodies), and their mismanagement can negatively affect ecosystem functions. These ecological patches and functions are essential for farmers’ well-being, economic success, and environmental sustainability. Therefore, understanding farmers’ perceptions while safeguarding the regional environment has become a critical issue [
14]. Thus, how to improve farmers’ well-being while protecting the regional environment has become an important issue [
14].
Globally, numerous studies have explored the relationship between human well-being and ES. For instance, research in the high Andes of Ecuador examined subjective well-being and perceptions of ES [
15]. In the mountainous regions of China, studies have evaluated the nexus between perceived ES and the well-being of rural residents [
16]. Additionally, research in mountain communities in Portugal has assessed the linkages between human well-being and ES [
17]. However, there is a notable gap in studies focusing specifically on the relationship between ES and farmers’ well-being. In China, some studies have explored the coupling relationship between ES and farmers’ well-being to maintain ecological security and improve the well-being of regional farmers [
7,
14]. Yet, these studies often fail to capture both the importance of ES and farmers’ contributions to managing these services. While much of the existing research documented the role of ES in human well-being, there is a paucity of studies that specifically examine the role of farmers in ES management. Farmers, as primary stakeholders and custodians of the land, possess unique insights into the functioning and value of ES. Their experiences and knowledge are critical for developing sustainable management practices and policies that enhance ecosystem resilience and human well-being. Understanding farmers’ perceptions and experiences can also reveal the challenges and opportunities associated with ES provision, offering valuable lessons for broader environmental and developmental strategies. To address this research gap, our study aimed to explore three key questions: (1) How do farmers rate the perceived importance of and their contribution to ES? (2) Is there a difference between the perceived importance and contribution to ES among farmers? (3) Is there an association between the perceived importance and contribution to ES and the socio-demographic characteristics of farmers? This study advances sustainability science by examining perceptions and trade-offs between human welfare and the environment, facilitating a transition toward sustainability [
18,
19]. It also fills a significant gap in the literature on ES in mountain regions, providing valuable insights for sustainable management practices and policies [
20].
2. Materials and Methods
2.1. Study Watershed
The study was conducted in the Mid-Marsyangdi watershed, located in the Lamjung district within the mountainous region of Nepal. Spanning from 28°10′5′′–28°30′37′′ N to 84°14′03′′–84°37′57′′ E, the watershed covers an area of 678.52 sq. km (). The majority of the watershed falls under the jurisdiction of Marsyangdi Rural Municipality (88.11%), with Besishahar Municipality covering 11.74%, and a smaller portion (0.14%) falling under Dordi and Kwholasothar Rural Municipalities [
21]. The landscape includes High Mountain, Middle Mountain, and Hill areas characterized by sloped terrain covered with vegetation, including trees and grass. Downstream areas have a high population density, while upstream rural areas, where most farmers reside, are sparsely populated. These farmers predominantly cultivate rice, wheat, maize, mustard, millet, potatoes, cardamom, and pulse crops [
21,
22].
Agriculture and livestock farming are the primary economic sectors, providing essential compost for maintaining agricultural productivity. The watershed experiences a diverse range of climates, including subtropical, temperate, cold temperate, alpine, and tundra. Rainfall and temperature records from the Khudi station (1987–2015) indicate a decreasing trend in rainfall and an increasing trend in temperature. Specifically, the mean maximum temperature is rising by 0.004 °C per year, the mean minimum temperature by 0.034 °C per year, and the mean annual rainfall is decreasing by 25.80 mm per year [
21].
The watershed’s resources, such as forests, agricultural lands, and water bodies, provide a variety of ES essential for the well-being and economic growth of local farmers and the national economy. Forests contribute services such as timber, firewood, wild edible foods, and natural medicines. Agricultural lands are critical for food production and providing fodder for livestock. Water bodies play vital roles in supplying drinking water, supporting household chores, generating hydropower, and promoting tourism [
9,
10,
23].
. Map showing the study watershed.
Thirteen ES with their perceived importance were identified through a comprehensive literature review, six focus group discussions (FGDs), twelve interviews with key informants, ten field observations, and the researcher’s own experiences (). These identified ES were categorized into four categories—Provisioning, Regulating, Cultural, and Supporting—following the framework established by the Millennium Ecosystem Assessment [
5]. Subsequently, these 13 ES were incorporated into the development of questionnaires for further study.
.
Major ES and their perceived importance.
| Ecosystem Category |
Ecosystem Services |
Perceived Importance |
| A. Provisioning |
Freshwater |
Water is used for domestic purposes (e.g., drinking, cooking) and agriculture (e.g., irrigation). |
| Timber production |
Used as building material for agricultural tools, house construction, furniture, and other infrastructure. |
| Firewood |
Used for cooking and heating. |
| Wild edible food |
Used for food (nettle leaf, mushroom, air potato, etc.). |
| Fodder for livestock |
Forage for feeding domestic animals. |
| Natural medicines |
Plant species used domestically for medicinal purposes (e.g., Cordyceps sinensis, Delphinium denudatum, Lindera fructicosa, etc.). |
| B. Regulating |
Air quality regulation |
Clean, dust-free, and fresh air from forests and surrounding areas. |
| Water regulation and purification |
Pollutants and sediments free water in the streams/rivers. |
| Natural hazards regulation |
Forests, agroforestry, trees, and shrub barriers help control runoff, soil erosion, floods, riverbank cutting, landslides, and so on. |
| C. Supporting |
Nutrient cycling |
Maintains and enhances soil fertility and supplies nutrients for agricultural productivity. |
| Habitat for wildlife |
Habitat for the wild flora and fauna. |
| D. Cultural |
Recreation and ecotourism |
Additional income through recreation and tourism-related activities such as homestays, rock gardens, eco-trails, selling local products, and promoting local culture and traditions. |
| Spiritual and inspirational |
Landscape beauty, forests, rivers, ponds, and mountains hold sacred and religious significance (e.g., celebrations like Baisak and Janai Purnima at Baraha Pond), providing a sense of peace and spiritual connection. |
2.3. Data Collection
Data were collected through face-to-face surveys using stratified random sampling to ensure diverse representation across socio-demographic categories among farmers. A sample size of 370 respondents was selected based on the item-to-response ratio to ensure robust statistical analysis [
24]. Pre-trained enumerators familiar with the study area conducted the surveys from June to October 2023. Respondents aged 18 and above were invited to participate. The structured questionnaire was used for the survey. First, importance and contribution rankings were conducted for 13 ES on a scale from 1 to 5, along with reasons behind the importance and contribution ratings. The importance scale ranged from very low importance to very high importance, while the contribution scale ranged from very low contribution to very high contribution. Second, the farmer’s perceived positive and negative changes over the last two decades, and the drivers of these changes were captured. Finally, we collected socio-demographic data of the respondents, including gender (
n = 2; male and female), age group (
n = 3; young with 18–39 years, adult with 40–60 years, and old > 60 years), education (
n = 3; illiterate, school level, university level), monthly income in Nepalese rupees (NPR) (
n = 3; low <20,000 NPR, medium with 20,000–60,000 NPR, and high > 60,000 NPR), ethnic group (
n = 2; indigenous and non-indigenous), landholding (
n = 2; <0.5 hectares and ≥0.5 hectares), and household size (
n = 2; small family of <5 members and medium to large family of ≥5 members).
2.4. Data Analysis
All data in this study were analyzed using IBM SPSS Statistics 26. Cronbach’s alpha coefficient (α = 0.83) confirmed the questionnaire’s reliability and internal consistency, validating the data reliability [
25]. Descriptive statistics were used to summarize the socio-demographic characteristics of the respondents, and perceived changes in the ES. The importance and contribution ranking of ES was conducted using Garrett’s ranking technique [
26,
27]. This method involves obtaining the frequency of each rank (from rank 1 to rank 5) for every ES. Percent positions for each rank (1 to 6) were calculated using the
Equation (1):
where $$R_{i j}$$ is the rank given for
ith ES by
jth respondents (
i.e., 1 to 5) and $$N_{j}$$ number of ES ranked by
jth respondents (
i.e., 13).
After calculating the percent positions, the corresponding Garrett values were extracted from the Garrett ranking conversion table. The Garrett mean score was then computed using
Equation (2).
where $$G_{v}$$ is the Garrett value corresponding to percent position, $$I C R_{f}$$ is the important or contribution rank-wise frequency of ES, and $$N$$ is the number of respondents.
Finally, Pearson’s Chi-square test was used to understand the association of socio-demographic characteristics with perceived importance and contribution.
3. Results
3.1. Socio-Demographic Characteristics of the Respondents
A total of 370 respondents were invited to participate in the household survey.
shows the socio-demographic characteristics of the respondents. There were slightly more male respondents (
n = 207, 55.9%) than female respondents (
n = 163, 44.1%). The majority of respondents were adults (
n = 221, 59.7%). Most of the farmers had a school-level education (
n = 238, 64.3%), whereas 20.3% (
n = 75) were illiterate, and 15.4% (
n = 57) had attended university. The majority of respondents had a monthly income of less than 60,000 NPR (Nepalese Rupees) (
n = 363, 98.1%), with a small proportion (
n = 7, 1.9%) earning over 60,000 NPR per month. More than 50.0% (
n = 206) of the respondents were indigenous people, with the majority having land holdings of less than 0.5 hectares (
n = 314, 84.9%). Household size was nearly evenly distributed among the respondents, with small households accounting for 50.3% (
n = 186) and medium to large households making up 49.7% (
n = 184).
.
Socio-demographic characteristics of respondents.
| Characteristics |
Respondents |
|
| Number (n) |
% |
| Gender |
|
|
| Male |
207 |
55.9% |
| Female |
163 |
44.1% |
| Age group (years) |
|
|
| Young (18–39) |
93 |
25.1% |
| Adult (40–60) |
221 |
59.7% |
| Old (>60) |
56 |
15.1% |
| Education |
|
|
| Illiterate |
75 |
20.3% |
| School level |
238 |
64.3% |
| University level |
57 |
15.4% |
| Monthly income (NPR) |
|
|
| Low (<20,000) |
234 |
63.2% |
| Medium (20,000–60,000) |
129 |
34.9% |
| High (>60,000) |
7 |
1.9% |
| Ethnic group |
|
|
| Indigenous |
206 |
55.7% |
| Non-indigenous |
164 |
44.3% |
| Landholdings (hectare) |
|
|
| <0.5 * |
314 |
84.9% |
| ≥0.5 ** |
56 |
15.1% |
| Household size |
|
|
| Small + |
186 |
50.3% |
| Medium to large ++ |
184 |
49.7% |
3.2. Perceived Importance of ES to Farmers
The study findings revealed that regulating ES was perceived as the most important (mean = 81.3, rank I), followed by provisioning ES (mean = 81.0, rank II), supporting ES (mean = 80.7, rank III), and cultural ES (mean = 77.8, rank IV). Water regulation and purification were considered highly important in regulating ES, whereas air quality regulation was deemed less important. Freshwater was perceived as the most important for provisioning ES, while wild edible food was seen as the least important. Nutrient cycling was highly important in supporting ES, and recreation and ecotourism were less important within the cultural ES. Among all 13 ES from four categories, freshwater ES was perceived as the most important (mean = 83.5, rank I), whereas spiritual and inspirational ES were considered the least important (mean = 76.5, rank XIII) (
).
.
Ranking of importance and contribution of ES, with significant difference analysis.
| Ecosystem Services |
Importance |
Contribution |
Paired Sample
t-Test |
Mean
Score |
Rank |
Mean
Score |
Rank |
t-Value |
Sig. (2-Tailed) |
| A. Provisioning |
81.0 |
II |
74.1 |
II |
14.5 |
0.000 |
| Freshwater |
83.5 |
I |
78.9 |
I |
10.7 |
0.000 |
| Timber production |
83.3 |
IV |
78.3 |
III |
15.0 |
0.000 |
| Firewood |
79.9 |
VII |
74.2 |
IV |
22.0 |
0.000 |
| Wild edible food |
78.0 |
XI |
68.3 |
XII |
21.0 |
0.000 |
| Fodder for livestock |
81.7 |
V |
74.1 |
V |
24.3 |
0.000 |
| Natural medicines |
79.6 |
VIII |
70.6 |
X |
36.7 |
0.000 |
| B. Regulating |
81.3 |
I |
71.7 |
III |
15.9 |
0.000 |
| Air quality regulation |
79.6 |
IX |
73.1 |
VII |
30.6 |
0.000 |
| Water regulation and purification |
83.4 |
III |
69.5 |
XI |
19.0 |
0.000 |
| Natural hazards regulation |
81.0 |
VI |
72.5 |
VIII |
33.2 |
0.000 |
| C. Supporting |
80.7 |
III |
75.4 |
I |
9.1 |
0.000 |
| Nutrient cycling |
83.5 |
II |
78.8 |
II |
14.1 |
0.000 |
| Habitat for wildlife |
77.8 |
XII |
72.0 |
IX |
15.5 |
0.000 |
| D. Cultural |
77.8 |
IV |
70.8 |
IV |
14.4 |
0.000 |
| Recreation and ecotourism |
79.1 |
X |
73.2 |
VI |
23.1 |
0.000 |
| Spiritual and inspirational |
76.5 |
XIII |
68.3 |
XIII |
25.7 |
0.000 |
The study demonstrated statistically significant associations between socio-demographic characteristics and the perceived importance rankings of ES (
). Specifically, gender was associated with firewood and air quality regulation; age group with nutrient cycling; education and ethnic group with natural medicine; and landholdings with timber production and fodder for livestock. No associations were found between monthly income and household size. For instance, respondents reported that women spend significantly more time on indoor household chores, such as cooking with firewood, which contributes to indoor air pollution. This highlights women’s higher perceived importance of firewood and air quality regulation ES.
.
Chi-square analysis of the perceived importance of ES across various socio-demographic characteristics.
| Ecosystem Services |
Chi-Square Values |
| 1 |
2 |
3 |
4 |
5 |
6 |
7 |
| A. Provisioning |
| Freshwater |
1.58 |
1.48 |
2.69 |
1.49 |
3.00 |
2.83 |
0.05 |
| Timber production |
0.03 |
1.73 |
5.89 |
2.68 |
1.71 |
11.28 ** |
0.45 |
| Firewood |
7.57 * |
4.89 |
5.93 |
3.72 |
0.83 |
2.72 |
1.07 |
| Wild edible food |
8.18 |
6.87 |
4.34 |
5.23 |
5.69 |
6.97 |
6.97 |
| Fodder for livestock |
0.61 |
6.19 |
1.39 |
5.46 |
4.23 |
14.29 *** |
1.09 |
| Natural medicines |
1.49 |
8.76 |
13.09 * |
1.05 |
6.02 * |
0.62 |
0.00 |
| B. Regulating |
| Air quality regulation |
10.27 ** |
3.44 |
0.61 |
1.68 |
0.34 |
1.60 |
0.38 |
| Water regulation and purification |
0.34 |
0.93 |
2.54 |
0.95 |
0.11 |
0.04 |
1.81 |
| Natural hazards regulation |
0.32 |
4.54 |
0.84 |
2.35 |
6.63 |
1.13 |
0.27 |
| C. Supporting |
| Nutrient cycling |
0.18 |
8.23 * |
4.57 |
5.07 |
0.20 |
2.21 |
4.49 |
| Habitat for wildlife |
0.65 |
8.79 |
6.83 |
5.11 |
0.98 |
6.92 |
2.98 |
| D. Cultural |
| Recreation and ecotourism |
3.58 |
10.51 |
2.64 |
8.92 |
6.12 |
3.48 |
3.64 |
| Spiritual and inspirational |
2.80 |
9.24 |
9.12 |
5.18 |
2.99 |
3.36 |
2.31 |
3.3. Perceived Contributions of Farmers to ES
The analysis of farmer contributions to ES revealed high contributions to supporting ES (mean = 75.4, rank I), followed by provisioning ES (mean = 74.1, rank II), regulating ES (mean = 71.7, rank III), and cultural ES (mean = 70.8, rank IV) (
). Within supporting ES, contributions to nutrient cycling were deemed highest. In provisioning ES, contributions to freshwater were perceived as high, while contributions to wild edible food were low. For regulating ES and cultural ES, air quality regulation and recreation and ecotourism were perceived as highly contributed. Among all 13 ES across the four categories, contributions to freshwater ES were perceived as the highest (mean = 78.9, rank I), whereas spiritual and inspirational ES was considered low (mean = 68.3, rank XIII), similar to their importance ranking (
). 95.7% of farmers perceived a high contribution to freshwater ES, while 34.3% perceived a low contribution to spiritual and inspirational ES, as shown in
.
.
Major ES, contributions and observed changes.
| Ecosystem Services |
Contribution |
Respondent % |
Observed Changes with Positive (+) and Negative (−) Impact |
| A. Provisioning |
| Freshwater |
Conservation and management of forests, agroforestry, improved farming, construction of irrigation channels, protection of water sources and their catchment areas, installation of fences around water/spring sources, improvement or construction of water supply systems, and maintenance of sanitation around water sources. |
95.7 |
Improved water supply, easier access to fetch water, no change in water quantity (+). Soil erosion and landslides are degrading water quality, with few cases of water sources drying up (−). |
| Timber production |
Conservation and management of forests, agroforestry, control open grazing, control forest fires and illegal logging, regulate forest product extraction, landslides treatment, and plantations. |
87.3 |
Increased forest area due to conversion of abandoned agricultural land into forests, denser forests, increased growing stock, reduced dependency on forest resources, and decreased forest fire occurrence (+). Unmanaged haphazard infrastructure development, such as road extensions, degrades the forest area (−). |
| Firewood |
Conservation and management of forests, agroforestry, control open grazing, controlling forest fires, control illegal logging, regulate forest product extraction, landslides treatment, and plantations. |
81.9 |
Increased forest area due to conversion of abandoned agricultural land into forests, denser forests, increased growing stock, reduced dependency on forest resources, and decreased forest fire occurrence (+). Unmanaged haphazard infrastructure development, such as road extensions, degrades the forest area (−). |
| Wild edible food |
Conservation and management of forests, forest guard mobilization for forest patrolling, regulating forest product collection time, and controlling forest fires. |
38.9 |
Decreased reliance on wild edible foods due to easy access to markets and transportation and diversification of income sources (+). Low interest of the farmer in management (−). |
| Fodder for livestock |
Conservation and management of forests, plantation, agroforestry, control open grazing, mitigating forest fires, and regulating forest product collection time. |
85.4 |
Increased supply fodder, soil conservation, and improved soil fertility (+). Deceased animal husbandry practices (−). |
| Natural medicines |
Conservation and management of forests, plantation, Scheduled extraction and harvesting, forest guard mobilization for supervision, control illegal harvesting and irrigation supply. |
48.9 |
Illegal collection reduced, less dependence on wild NTFPs due to commercialized crops like cardamom farming (+). Farmer low interest in management due to livelihood diversification (−). |
| B. Regulating |
| Air quality regulation |
Maintain cleanliness inside homes and around the village, install dustbins in common areas, control forest fires, plantation, use compost manure, and utilize LP gas and improved cooking stoves. |
82.7 |
Gradual decrease in indoor air pollution (+). Increased pollution due to rural road extensions, higher vehicular movement, use of chemical fertilizers in agriculture, and a rise in imported goods, such as plastic-wrapped products (−). |
| Water regulation and purification |
Conservation and management of forests, bamboo and other species plantations, agroforestry, water sources and catchment protection, landslide treatment, embankments, check dams, and sediment trap dams in rivers/streams. |
44.3 |
Increased number of hydropower projects and companies (+). Increased sedimentation due to unplanned infrastructure, inadequate drainage systems, haphazard rural road construction, and unstable roadside slopes, increasing sedimentation and degrading water quality (−). |
| Natural hazards regulation |
Conservation and management of forests, forest fire control, plantation, landslide treatment, embankments, check dams, and sediment trap dams in rivers/streams, safe drainage in irrigation and settlements, terracing, terrace improvement, multi-year cash crops, grass planting in landslide-prone areas (such as millet, cardamom, bamboo, etc.), and hedgerow planting. |
67.3 |
Open and landslide-prone areas were converted to bamboo forests, reducing soil erosion on agricultural land, and some farmland was converted to shrub and forest areas, thereby decreasing natural hazards (+). Extension of rural road network led to increased landslide events and sedimentation (−). |
| C. Supporting |
| Nutrient cycling |
Reduced use of chemical fertilizers through compost manure, agri-lime application, and the introduction of low-water-demanding and multi-year cash crops such as millet, cardamom, bamboo, and broom grass in landslide-prone areas. Terracing, terrace improvement, removal of invasive species, crop rotation, hedgerow planting, and intercropping are also practiced. |
93.0 |
Soil fertility and production have increased due to improved varieties, seed bank establishment, and increased compost manure preparation from green grass and litter resulting from reduced livestock rearing (+). Soil fertility has declined in some areas due to the application of chemical fertilizers (−). |
| Habitat for wildlife |
Conservation and management of forests, rangelands, water source protection, plantations, mobilization of forest guards to control poaching and hunting, and organic farming. |
65.4 |
Increased wildlife habitats and a rise in wildlife populations (+). Instances of haphazard construction and road extensions have degraded some habitats, along with occasional cases of poaching, hunting, and human-wildlife conflict issues (−). |
| D. Cultural |
| Recreation and ecotourism |
Establishment and improvements of homestays and restaurants, recreational places (e.g., development of rock gardens, improvement of eco-trails for trekking, waterfalls, and picnic areas), traditional dance, music and dance, construction of shelter houses, and exploration of new tourist services. |
71.6 |
Tourist flow increased, enhancing local livelihoods through tourism goods and services and introducing local places, culture, and traditions (+). Opening of road access to the Manang district (part of the Annapurna circuit) has reduced the duration of tourist stays in villages (−). |
| Spiritual and inspirational |
Conservation of sacred and religious sites, including forests, rivers, water sources, and scenic beauty. |
34.3 |
Built a sense of connection to nature and traditional beliefs (+). Instances of haphazard construction and road extensions have degraded sacred and religious sites such as forests and some traditional ponds (−). |
The study found that socio-demographic characteristics such as gender, age group, education, ethnic group, and landholdings significantly influenced farmers’ perceptions of their contributions to ES; however, monthly income had no association (
). Notably, gender was particularly linked to natural hazards regulation and recreation and ecotourism. The age group was associated with water regulation and purification, while education was linked to the provision of fodder for livestock. Ethnic group was associated with timber production, water regulation and purification, natural hazards regulation, and habitat for wildlife. Landholdings were associated with fodder for livestock, air quality regulation, and habitat for wildlife. Additionally, household size was linked to wild edible food, recreation and ecotourism. For instance, FGD with indigenous peoples revealed that traditional pastoralism and herding systems are practices with significant socio-economic and ecological importance for these communities. As a result, their dependency on ES is greater than that of other groups. This highlights how socio-economic characteristics shape perceptions and contributions to ES management in the mountain regions of Nepal.
.
Chi-square analysis of the perceived contribution of ES across various socio-demographic characteristics.
| Ecosystem Services |
Chi-Square Values |
| 1 |
2 |
3 |
4 |
5 |
6 |
7 |
| A. Provisioning |
| Freshwater |
2.65 |
5.22 |
1.53 |
3.77 |
1.97 |
2.58 |
1.59 |
| Timber production |
7.36 |
6.36 |
7.67 |
7.24 |
9.31* |
8.13 |
0.79 |
| Firewood |
3.44 |
8.41 |
3.49 |
1.49 |
2.40 |
6.62 |
1.53 |
| Wild edible food |
4.26 |
12.79 |
12.78 |
3.18 |
4.20 |
0.93 |
10.4 * |
| Fodder for livestock |
1.42 |
9.45 |
15.07 ** |
3.260 |
5.57 |
9.82 * |
1.38 |
| Natural medicines |
1.60 |
3.26 |
6.97 |
4.34 |
1.62 ** |
2.22 |
0.59 |
| B. Regulating |
| Air quality regulation |
1.16 |
5.91 |
6.80 |
7.34 |
0.82 |
9.18 * |
2.96 |
| Water regulation and purification |
6.20 |
15.3 * |
4.01 |
12.3 |
19.2 *** |
7.15 |
2.81 |
| Natural hazards regulation |
13.35 ** |
5.07 |
6.12 |
3.24 |
11.7 ** |
1.86 |
1.38 |
| C. Supporting |
| Nutrient cycling |
2.80 |
4.85 |
8.23 |
10.31 |
7.03 |
4.35 |
5.43 |
| Habitat for wildlife |
7.28 |
5.69 |
1.50 |
4.41 |
14.3 ** |
7.62 * |
0.43 |
| D. Cultural |
| Recreation and ecotourism |
12.3 ** |
3.10 |
6.69 |
8.62 |
5.31 |
1.20 |
8.70 * |
| Spiritual and inspirational |
5.73 |
8.14 |
8.13 |
6.37 |
2.88 |
4.33 |
7.25 |
3.4. Comparative Analysis: Importance vs. Contribution of ES
The paired sample
t-test revealed statistically significant differences (
p < 0.001) between farmers’ perceived importance and their actual contributions to ES (
). The mean importance rank score was consistently higher than the mean contribution rank score across all ES and their categories (
,
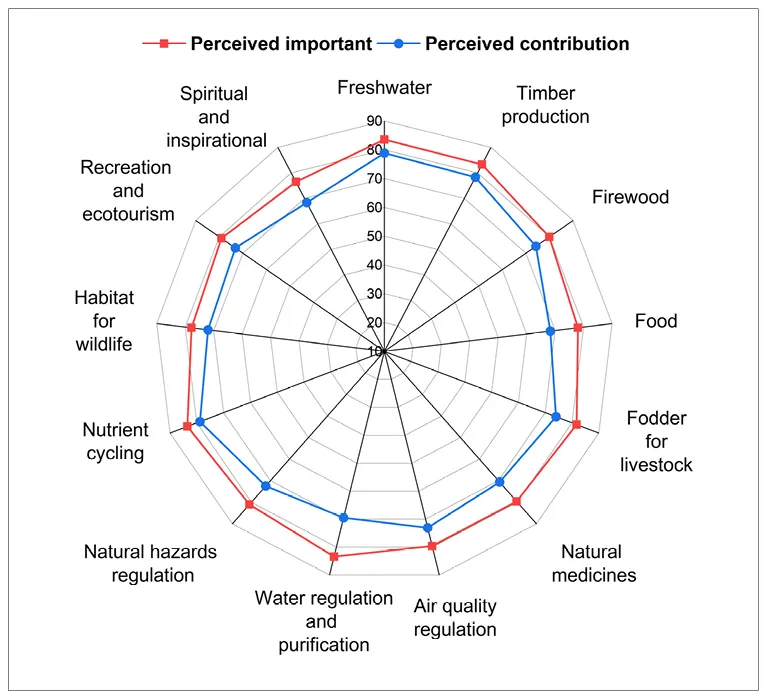
). Gap analysis indicated that regulating ES had the largest gap (mean gap = 9.66), followed by cultural ES (mean gap = 7.02), provisioning ES (mean gap = 6.96), and supporting ES (mean gap = 5.24). Regarding individual ES, freshwater and nutrient cycling ES showed smaller gaps (mean gaps = 4.69 and 4.70, respectively), suggesting better alignment between perceived importance and contributions. In contrast, water regulation and purification and wild edible food ES exhibited the largest gaps (mean gaps = 13.9 and 9.72, respectively), indicating a need for more attention.
. Radar chart of perceived average importance and contribution rank score across different ES by farmers.
Farmers observed changes in the supply of ES across various categories over two decades. Six ES—natural medicines, air quality regulation, water regulation and purification, natural hazards regulation, nutrient cycling, and recreation and ecotourism—were perceived as decreasing. Conversely, five ES—timber production, firewood, wild edible food, fodder for livestock, and habitat for wildlife—showed an increase. Two ES, freshwater and spiritual and inspirational, were perceived as unchanged (
). Regarding the drivers of these changes, farmers identified forest management, land use change, haphazard infrastructure development, rural road extension, diversification of income sources, access to markets and services, and inadequate knowledge of silvicultural practices as significant factors influencing the supply of various ES. Detailed drivers for changes in ES supply are provided in
.
.
ES, trends in availability perceived by the respondents.
| Ecosystem Category |
Overall Trends |
Drivers of Changes |
| A. Provisioning |
|
|
| Freshwater |
No change |
Forest conservation and management, conservation of water sources and their catchments, and strengthening water systems (extraction, storage, and supply). |
| Timber production |
Increasing |
Abandoned land conversion to shrubland and forest areas naturally, plantation, forest management, reduced dependency on forest products, restrictive law enforcement, and the use of alternative construction materials. |
| Firewood |
Increasing |
Plantation, forest management, natural conversion of abandoned land to shrubland and forests, reduced dependency on forest products, restrictive law enforcement, and alternative fuel sources. |
| Wild edible food |
Increasing |
Reduced dependency on wild edible food, increased access to market for a variety of foods, diversified sources of income, and forest management. |
| Fodder for livestock |
Increasing |
Agroforestry, conversion of fallow lands to shrubland and forest areas, forest management, plantation, and reduced animal husbandry practice. |
| Natural medicines |
Decreasing |
Lack of adequate knowledge of silvicultural characteristics and practices for collection and harvesting, illegal collection, and trade. |
| B. Regulating |
|
|
| Air quality regulation |
Decreasing |
Despite increased greenery, air quality is deteriorating due to dust from rural roads, waste burning, forest fires, construction activities, and the use of chemical fertilizers and pesticides. |
| Water regulation and purification |
Decreasing |
Sedimentation in rivers is increased due to unmanaged infrastructure development, riverbank cutting, rural road extension, landslides, and flooding. |
| Natural hazards regulation |
Decreasing |
Changes in rainfall patterns, unmanaged infrastructure development, and the extension of rural roads without proper drainage increase the incidence of floods, landslides, riverbank cutting, soil erosion, and sedimentation. |
| C. Supporting |
|
|
| Nutrient cycling |
Decreasing |
The use of chemical fertilizers and the reduction in livestock husbandry are causing a scarcity of compost manure. Soil erosion due to improper land management and unsustainable agricultural practices reduces productivity. |
| Habitat for wildlife |
Increasing |
Increasing wildlife species, plantation, improved habitat quality and area, forest management, and restrictive law enforcement. |
| D. Cultural |
|
|
| Recreation and ecotourism |
Decreasing |
The opening of the road to Manang has decreased the flow of tourists on the traditional trekking route and reduced the number of days tourists stay in the area. Haphazard development work has degraded tourist attraction points, such as the natural beauty of the landscape, and caused travel discomfort due to dusty and bumpy rural roads. |
| Spiritual and inspirational |
No change |
Community stewardship and conservation of sacred and religious sites, including forests, rivers, and water sources. |
4. Discussion
Our study identified and ranked thirteen ES and farmer’ contributions to them, similar to previous studies. For instance, [
28] identified 25 ES in the Omo Forest Reserve, Nigeria, to understand people’s perceptions and preferences for ES and guide the development of a management plan. Similarly, a study in the Himalayan region of Ladakh, India, identified 22 ES based on the residents’ social preferences for direct and indirect benefits [
29]. This suggests that the identification of ES is likely influenced by farmers’ familiarity, interactions, knowledge, dependency on ES, and socio-demographic characteristics [
28,
29]. Further, our study perceived a disparity between the importance and contribution ranking of ES. However, Similar to previous studies, farmers perceived freshwater and nutrient cycling as highly important in terms of importance and contribution ranking [
29,
30]. Farmers’ dependency on these ES was higher due to their close ties to farming systems, livelihoods, and sources of income. For example, indigenous farming practices such as intercropping, terrace improvement, multi-year cropping, and organic composting (utilizing agricultural residues and leaf litter) were significantly important in managing various ES [
9,
10]. Despite the contribution of these agricultural practices to ES management, they are often overlooked in policy platforms and academic literature [
26,
31]. Additionally, farmers have minimal direct impact on ES, such as spiritual and inspirational values, wild edible food, water regulation and purification, wildlife habitat, natural medicines, and natural hazard regulation due to their limited skills, resources for managing these ES, and the lack of immediate benefits. For instance, previous studies indicated that habitat quality ES was given low priority, suggesting local unawareness of the importance of non-local ES and a weak connection between livelihoods and biodiversity conservation [
26,
32]. Strengthening this connection is vital for sustainable ES management. Investigating the economic potential of non-local ES through financing mechanisms like payment for ES and livelihood support (employment and income-generating activities) could enhance farmers’ recognition and contribution to these services [
26].
The study reported changes in the supply of ES over the past two decades, consistent with findings from previous research [
20,
26,
28]. The results indicated a decreasing supply of several key services, including natural medicines, air quality regulation, water regulation and purification, natural hazard regulation, nutrient cycling, and recreation and ecotourism. For example, [
33] documented a decline in the availability of natural medicines in the Panchase region of Nepal. Similarly, research conducted in Ladakh, India, reported reduced ES such as water retention and regulation, erosion regulation, and flood control [
20]. However, the study also revealed contrasting results with local trends showing increased air quality regulation, nutrient cycling, and recreation and ecotourism 33. Contrasting social perceptions regarding the supply of ES can arise from geographical variability, socioeconomic differences, and levels of environmental awareness [
8,
28]. For example, research in Spain demonstrated that socio-cultural factors and the type of conservation management strategy in place (such as protected and non-protected areas) influence community preferences for ES [
34]. In Nepal, restrictive policies for practicing transhumance herding systems in high-altitude areas overlook the socio-cultural, economic, and ecological nexus to local livelihoods [
35]. This neglect influences community preferences by shaping perceptions of policy effectiveness, resource access, and the sustainability of traditional livelihoods tied to the ecosystem and its services.
Our findings align with previous research indicating increasing trends in timber production, firewood availability, fodder for livestock, and wildlife habitat [
26,
28,
33]. However, the observed increase in wild edible foods contradicts Adhikari et al. (2018), which reported decreasing trends. In Nepal, studies have generally shown that forest management activities, the conversion of abandoned agricultural land into forest and shrubland, and reduced dependency on forest resources have led to increased forest coverage and enhanced ES [
26,
33]. Nonetheless, in local contexts dominated by poor and vulnerable farmers, there may be divergent experiences due to their heavy reliance on timber, firewood, fodder, natural medicines, and food. This situation highlights the different perspectives of farmers, influenced by geographical area and socio-economic conditions [
8,
26]. Similarly, our study found no perceived change in the supply of freshwater and spiritual and inspirational services. This finding is consistent with studies conducted in Nigeria [
28] and Nepal [
36], where the majority of respondents reported no change in the supply of water and spiritual and religious values.
Several studies have identified that socio-demographic characteristics significantly influence people’s perceptions regarding the management of ecosystem resources and services [
8,
28,
34]. Aligning with this, our study showed associations of gender, age group, education, ethnic group, landholdings, and household size with farmers’ perceptions of the importance and contribution to ES. For example, the study by Adeyemi et al. (2022) observed associations between respondents’ perceptions of ES importance and socio-demographic characteristics, including age group, household size, gender, and education level. The association was significant in terms of both the importance and contribution of farmers with provisioning services (e.g., firewood, natural medicine, timber production, fodder for livestock, and wild edible food), regulating services (e.g., natural hazard regulation, water regulation, and purification, air quality regulation, and nutrient cycling), cultural services (e.g., recreation and ecotourism), and supporting services (e.g., habitat for wildlife). This implies the different priorities of the farmers based on socio-demographic characteristics. For example, Indigenous people rely on ES like natural medicines, including
Allium wallichii,
Sichuan pepper,
Paris polyphylla,
Amomum subulatum,
Dactylorhiza hatagirea, and
Cordyceps sinensis. This reliance on non-timber forest products (NTFPs) underscores these communities’ high importance on natural medicine. Similarly, women strongly preferred firewood, air quality regulation, and recreation and ecotourism due to their responsibilities in managing household resources and spending substantial time indoors for cooking and kitchen work [
33]. Women, particularly in rural mountain areas, rely heavily on forests for provisioning services such as firewood, fodder, and medicinal plants, making them key stewards of forest resources despite often being excluded from decision-making. Poorer farmers tend to depend more on forests than wealthier ones, as forests provide essential goods and regulating services that support their livelihoods and buffer against environmental risks. Conversely, most men migrate for employment to support their families, showing less interest in managing ES, such as community forest management [
37]. In addition, many young people, especially those migrating to urban areas, are increasingly disconnected from forests and may not fully recognize their cultural and ecological value. This diminished community interest exacerbates the degradation of ES. Therefore, our study suggests linking ES with community livelihoods and equitable benefit sharing. Study indicates that implementing mechanisms like payments for ecosystem services (PES), developing agroforestry systems, and connecting ES with market demand can enhance community livelihoods, generate revenue, restore forest landscapes, and enhance overall soil fertility and land productivity [
37].
5. Conclusions
This study contributes to ecosystem conservation and management by evaluating farmers’ perspectives on the importance, contribution, and trends of ES. Our findings show a significant difference between these services’ perceived importance and actual contribution, with importance consistently rated higher than contribution across all services. This discrepancy suggests that current efforts to manage ES are insufficient. To address these gaps, developing new technologies, such as early warning systems, and providing government support through subsidies, insurance, and technical assistance is essential. Flexible policy mechanisms are essential to accommodate traditional local practices, such as revising forest management policies in Nepal that currently restrict herding and negatively affect transhumance livelihoods. Additionally, regulatory frameworks for infrastructure development must strictly enforce social and environmental safeguards to ensure sustainable and equitable outcomes. Additionally, enhancing farmers’ access to credit, capital, and risk insurance—along with promoting adaptive farm management practices—is crucial for increasing their contribution to ES. Farmers are highly dependent on provisioning, regulating, and supporting services, such as freshwater, nutrient cycling, water regulation and purification, timber production, fodder for livestock, and natural hazards regulation. Their contributions are notably high in managing freshwater, nutrient cycling, and timber production. Farmers’ practices like forest conservation, agroforestry, inter-cropping, terracing, terrace improvement, multi-year cropping, and organic composting enhance ES. However, significant gaps exist between perceived importance and contribution, especially in water regulation and purification and wild edible food. These findings highlight the need for focused attention and action to address these gaps and critically consider trade-offs. Considering trade-offs ensures that ecosystem management practices are holistic, equitable, and sustainable, benefiting both human populations and the natural environment. The study also highlights that socio-demographic variables influence how farmers perceive the importance and contribution of ES. This suggests that incorporating farmers’ demographic characteristics can help policymakers, managers, and practitioners better understand community-specific needs and design more targeted and effective strategies for the sustainable management of ES. Understanding mountain farmers’ perceptions of ES is crucial for advancing global environmental goals. As multifunctional landscapes, mountains support vital downstream needs. Aligning policies with local priorities enhances ecosystem restoration and fosters sustainable, livelihood-friendly practices. This supports global frameworks like the SDGs, IPBES, and the UNFCCC mountain agenda. The study adds to the limited empirical research on integrating farmers into ES management, though it is limited by its focus on key ES identified by farmers and reliance on perception-based analysis.
Acknowledgments
We extend our sincere gratitude to the local communities and stakeholders who participated in the study and shared their experiences and insights. We also thank Babita Ghale for her support in data collection for this study.
Ethics Statement
Not applicable.
Informed Consent Statement
All participants in this study were informed about its purpose and procedures. Participation was voluntary, and informed consent was obtained prior to data collection. Participants were assured of the confidentiality of the data and information collected.
Data Availability Statement
Data is available upon request from the author.
Funding
No funding was received for this study.
Declaration of Competing Interest
The author declares no competing interests.
References
-
1.
Canedoli C, Rota N, Vogiatzakis IN, Zanchi A, Drius M, Nagendra H, et al. Review of Indicators for Mountain Ecosystem Services: Are the Most Frequently Used Also the Best?
Ecol. Indic. 2024,
166, 112310. doi:10.1016/j.ecolind.2024.112310.
[Google Scholar]
-
2.
Pandey A, Chettri N. International Conference on Mountain Ecosystems: Biodiversity and Adaptations under Climate Change Scenario (22–24 March 2023).
Biodiversity 2023,
24, 112–113. doi:10.1080/14888386.2023.2210130.
[Google Scholar]
-
3.
FAO. Mapping the Vulnerability of Mountain Peoples to Food Insecurity; Food and Agriculture Organization of the United Nations: Rome, Italy, 2015.
-
4.
Romeo R, Grita F, Parisi F, Russo L. Vulnerability of Mountain Peoples to Food Insecurity: Updated Data and Analysis of Drivers; Food and Agriculture Organization of the United Nations: Rome, Italy, 2020. doi:10.4060/cb2409en.
-
5.
MEA. A Report of the Millennium Ecosystem Assessment. Ecosystems and Human Well-Being; Island Press: Washington, DC, USA, 2005.
-
6.
Yang Y. Evolution of Habitat Quality and Association with Land-Use Changes in Mountainous Areas: A Case Study of the Taihang Mountains in Hebei Province, China.
Ecol. Indic. 2021,
129, 107967. doi:10.1016/j.ecolind.2021.107967.
[Google Scholar]
-
7.
Zhou L, Guan D, Sun L, He X, Chen M, Zhang Y, et al. What Is the Relationship between Ecosystem Services and Farmers’ Livelihoods? Based on Measuring the Contribution of Ecosystem Services to Farmers’ Livelihoods.
Front. Ecol. Evol. 2023,
11, 1106167. doi:10.3389/fevo.2023.1106167.
[Google Scholar]
-
8.
Silwal N, Dhungana N, Subedi R, Upadhaya S, Lee CH. Community Perspectives on the Effectiveness of Watershed Management Institutions in the Himalayas.
J. Mt. Sci. 2024,
21, 1119–1139. doi:10.1007/s11629-023-8424-8.
[Google Scholar]
-
9.
Dhungana N. Payments for Ecosystem Experiences and Learnings in Nepal: Hariyo Ban and Small-Scale Farmers.
CARE Food Water Syst. 2019, 1
–27.
Available online: https://www.researchgate.net/publication/343416243_CARE_Food_and_Water_Systems_Payments_for_Ecosystem_Experiences_and_Learnings_in_Nepal_Hariyo_Ban_and_Small-scale_Farmers_Regional_Review_Prepared_by_Nabin_Dhungana_Watershed_Management_and_PES_Special (accessed on 9 May 2024).
[Google Scholar]
-
10.
Das M, Das A, Pandey R. Importance-Performance Analysis of Ecosystem Services in Tribal Communities of the Barind Region, Eastern India.
Ecosyst. Serv. 2022,
55, 101431. doi:10.1016/j.ecoser.2022.101431.
[Google Scholar]
-
11.
Power AG. Ecosystem Services and Agriculture: Tradeoffs and Synergies.
Philos. Trans. R. Soc. B Biol. Sci. 2010,
365, 2959–2971. doi:10.1098/rstb.2010.0143.
[Google Scholar]
-
12.
Reed MS, Allen K, Attlee A, Dougill AJ, Evans KL, Kenter JO, et al. A Place-Based Approach to Payments for Ecosystem Services.
Glob. Environ. Chang. 2017,
43, 92–106. doi:10.1016/j.gloenvcha.2016.12.009.
[Google Scholar]
-
13.
FAO. The State of Food and Agriculture—Revealing the True Cost of Food to Transform Agrifood Systems; Food and Agriculture Organization of the United Nations: Rome, Italy, 2023. doi:10.4060/cc7724en.
-
14.
Zhang P, Li X, Yu Y. Relationship between Ecosystem Services and Farmers’ Well-Being in the Yellow River Wetland Nature Reserve of China.
Ecol. Indic. 2023,
146, 109810. doi:10.1016/j.ecolind.2022.109810.
[Google Scholar]
-
15.
Aguado M, González JA, Bellott K, López-Santiago C, Montes C. Exploring Subjective Well-Being and Ecosystem Services Perception along a Rural–Urban Gradient in the High Andes of Ecuador.
Ecosyst. Serv. 2018,
34, 1–10. doi:10.1016/j.ecoser.2018.09.002.
[Google Scholar]
-
16.
Wang Y, Sun J, Liu C, Liu L. Exploring the Nexus between Perceived Ecosystem Services and Well-Being of Rural Residents in a Mountainous Area, China.
Appl. Geogr. 2024,
164, 103215. doi:10.1016/j.apgeog.2024.103215.
[Google Scholar]
-
17.
Pereira E, Queiroz C, Pereira HM, Vicente L. Ecosystem Services and Human Well-Being: A Participatory Study in a Mountain Community in Portugal.
Ecol. Soc. 2005, 1-23. doi:10.5751/ES-01353-100214.
[Google Scholar]
-
18.
Kates RW. What Kind of a Science Is Sustainability Science?
Proc. Natl. Acad. Sci. USA 2011,
108, 19449–19450. doi:10.1073/pnas.1116097108.
[Google Scholar]
-
19.
PNAS. Sustainability Science. Available online: https://www.pnas.org/sustainability-science (accessed on 9 May 2024).
-
20.
Hussain S, Sharma S, Singh AN. Identification and Prioritisation of Ecosystem Services Based on the Socio-Economic Perspectives of Local People in a Trans-Himalayan Region of Ladakh, India.
Anthropocene 2023,
44, 100404. doi:10.1016/j.ancene.2023.100404.
[Google Scholar]
-
21.
MESMAN; DTMC. Integrated Sub-Watershed Management Plan of Khudi -Marsyangdi Sub-Watershed and Implementation Plan for PES/IES Initiatives in Mid-Marsyangdi Watershed; District Technical Management Committee (DTMC) and Marsyangdi Environmental Services Management Network (MESMAN): Lamjung, Nepal, 2019; pp. 1–101.
-
22.
SOG. District Profile of Lamjung; Statistics Office Gorkha: Gorkha, Nepal, 2017.
-
23.
Mudbhari D, Kansal ML, Kalura P. Impact of Climate Change on Water Availability in Marsyangdi River Basin, Nepal.
Q. J. R. Meteorol. Soc. 2022,
148, 1407–1423. doi:10.1002/qj.4267.
[Google Scholar]
-
24.
Kline RB. Principles and Practice of Structural Equation Modeling, 4th ed.; Guilford Publications: New York, NY, USA, 2016; Volume 1. doi:10.15353/cgjsc.v1i1.3787.
-
25.
Black TR. Doing Quantitative Research in the Social Sciences: An Integrated Approach to Research Design, Measurement and Statistics; Sage: Newcastle upon Tyne, UK, 1999.
-
26.
Aryal K, Maraseni T, Apan A. Preference, Perceived Change, and Professed Relationship among Ecosystem Services in the Himalayas.
J. Environ. Manag. 2023,
344, 118522. doi:10.1016/j.jenvman.2023.118522.
[Google Scholar]
-
27.
Dhanavandan S. Application of Garret Ranking Technique: Practical Approach.
Int. J. Libr. Inf. Stud. 2016,
6, 135–140.
[Google Scholar]
-
28.
Adeyemi O, Chirwa PW, Babalola FD. Assessing Local People’s Perceptions and Preference for Ecosystem Services to Support Management Plan in Omo Biosphere Reserve, Nigeria.
Environ. Dev. 2022,
43, 100738. doi:10.1016/j.envdev.2022.100738.
[Google Scholar]
-
29.
Asegie AM, Giziew A, Ayalew D. Analyzing Constraints of Smallholders’ Chickpea (
Cicer arietinum L.) Production Systems in Gondar Zuria Woreda of Ethiopia Using the Henry Garrett’s Ranking Technique.
Heliyon 2022,
8, e11126. doi:10.1016/j.heliyon.2022.e11126.
[Google Scholar]
-
30.
Tully K, Ryals R. Nutrient Cycling in Agroecosystems: Balancing Food and Environmental Objectives.
Agroecol. Sustain. Food Syst. 2017,
41, 761–798. doi:10.1080/21683565.2017.1336149.
[Google Scholar]
-
31.
Bommarco R, Vico G, Hallin S. Exploiting Ecosystem Services in Agriculture for Increased Food Security.
Glob. Food Sec. 2018,
17, 57–63. doi:10.1016/j.gfs.2018.04.001.
[Google Scholar]
-
32.
Lu N, Liu L, Yu D, Fu B. Navigating Trade-Offs in the Social-Ecological Systems.
Curr. Opin. Environ. Sustain. 2021,
48, 77–84. doi:10.1016/j.cosust.2020.10.014.
[Google Scholar]
-
33.
Adhikari S, Baral H, Nitschke CR. Identification, Prioritization and Mapping of Ecosystem Services in the Panchase Mountain Ecological Region of Western Nepal.
Forests 2018,
9, 554. doi:10.3390/f9090554.
[Google Scholar]
-
34.
Martín-López B, Iniesta-Arandia I, García-Llorente M, Palomo I, Casado-Arzuaga I, Del Amo DG, et al. Uncovering Ecosystem Service Bundles through Social Preferences.
PLoS ONE 2012,
7, e38970. doi:10.1371/journal.pone.0038970.
[Google Scholar]
-
35.
Banjade MR, Paudel NS. Mountains Mobile Pastoralism in Crisis : Challenges , Conflicts and Status of Pasture Tenure in Nepal Mountains.
J. For. Livelihood 2008,
7, 49–57.
[Google Scholar]
-
36.
Paudyal K, Baral H, Burkhard B, Bhandari SP, Keenan RJ. Participatory Assessment and Mapping of Ecosystem Services in a Data-Poor Region: Case Study of Community-Managed Forests in Central Nepal.
Ecosyst. Serv. 2015,
13, 81–92. doi:10.1016/j.ecoser.2015.01.007.
[Google Scholar]
-
37.
Dhungana N, Lee CH, Khadka C, Adhikari S, Pudasaini N, Ghimire P. Evaluating Community Forest User Groups (CFUGs)’ Performance in Managing Community Forests: A Case Study in Central Nepal.
Sustainability 2024,
16, 4471. doi:10.3390/su16114471.
[Google Scholar]