1. Introduction
The global economy’s current growth is in tight connection with the growth of our global waste problem. Not just waste in general, but a wasteful lifestyle is causing hardships to large portions of the global population, e.g., the ever-growing world population is continuously hitting the food security issue [
1]. At the same time, the generation of solid wastes is escalating in tandem with the rapid expansion of our global economy and the global population growth too [
2]. Currently, 64% of global municipal solid waste (MSW) generated is mismanaged, 29% of which is openly burned, 18% ends up in dumpsites, and 17% is scattered [
3]. Just few years ago, we went already past the global municipal waste (MSW) generation rate of 2.0 billion tons annually and 3.40 billion tons are expected to be generated by 2050 [
4] and Forecasts by the World Bank predict a more than 1.5-fold increase in global waste by 2050. This projection underscores the urgency of expanding waste disposal solutions, particularly in areas where landfill expansion is not feasible [
5], also, as we know, the MSW generation forecasts are tied to population growth, which is not showing any sign of being reduced anytime soon. The global population has already surpassed 8.0 billion, currently hovering at 8.24 billion in early 2025, and is increasing rapidly. The population of 9.7 billion is estimated to be reached in 2050 [
6]. The increasing waste generation leads to an increasing need to process these waste elements and adds pressure to find new solutions. Landfilling has been “a solution” for waste processing in many countries, however, it comes with many issues, especially when poorly managed landfills, open burning, and littering are the main ways of waste disposal in low-income countries, where options for high upfront investment waste management systems are not a short-term realistic solution [
3]. Due to landfills, nature is exposed to dangerous waste, like leachate and environmentally damaging organic components [
7]. Landfills are also typically located close to cities [
8] for transportation cost reasons. As cities grow, they move closer and closer towards earlier, more distant landfill areas, negatively affecting people’s daily lives. Even though there are efforts to try to select the landfill location with the best intentions in mind [
9], landfilling does cause environmental problems such as methane and carbon dioxide greenhouse gas releases, bad smells [
10] that impact close communities and landfill leachate [
11] that can ruin nearby soils and cause toxification or pollution of waters, rivers and surrounding lakes, including the groundwater too [
12,
13]. Also, different gas output [
14], potential explosions, and fire hazards [
15] are serious environmental problems in landfills [
16], even though there are some potential measures to reduce these risks [
17].
Given all the overall and well-known problems of simple landfilling waste handling solutions, a lot of developed countries have been steering in the direction of incineration of their municipal solid waste streams. According to [
4], globally, approximately 11% of municipal solid waste is incinerated, whereas in high-income countries, 22% of municipal solid waste is incinerated. There are multiple benefits when replacing landfilling with incineration, especially with energy recovery plants. Incineration plants could save significant space compared to large landfills [
18,
19]. Also, the problems faced at landfills associated with landfill leachate, fires, and explosions could be avoided. Metals could also be collected from the bottom ash after incineration, and the bottom ash could be used as material in road and cement constructions or at least the amount of waste going to landfill can be minimized [
20,
21].
Large quantities of municipal and industrial waste generation is a significant problem that needs to be solved in Russia. According to Jäämeri [
22], approximately 14,000 legal landfills and 60,000 illegal landfills still exist in Russia. Approximately 70 million tons of municipal solid waste (MSW) are generated in Russia in a year, and the amount is increasing. At the moment, 94% of Russian MSW is approximated to be transported directly to landfills without sorting, 4% is recycled, and 2% is incinerated. For comparison, according to European Environment Agency [
23] 48% of European waste was recycled in 2016, and according to [
4], in high-income countries, 39% of waste is sent to landfill, 35% recycled and composted and 22% incinerated. A reform of the Russian waste system started in 2019 as part of the Russian Ecology project, which aims to organize recycling, ban illegal or operating landfills with old technology, and establish waste processing centers and landfills using new technologies [
22]. According to Pääkkönen & Saarto [
24] the area of Leningrad and St. Petersburg creates over two million tons of waste annually. Many landfills are being run down, and new ones are being opened further from cities and villages [
24].
With Waste-to-Energy (WtE) technologies, St. Petersburg and Leningrad waste management could be handled more environmentally friendly. The current waste management system in Russia is based on landfilling, and incineration can be seen as the first step taken towards a circular economy as most of the current waste collection, logistics, and transportation solutions, related to landfilling strategies, can still continue to be used when mobbing towards waste incineration strategy. WtE projects have already been successful in many countries on different continents. According to [
25], a WtE project is economically feasible, reduces pollution, and creates new jobs in Italy. In Indonesia, WtE projects success has been seen to be significantly influenced by strong local government commitment, supported by political, financial and regulatory backing from the national government. For example the Benowo WtE power plant’s development demonstrates that with adequate support, WtE can be a viable solution for managing MSW and generating energy in developing countries [
26]. Also, existing WtE projects across different states highlight successful case studies in India. These include e.g., the Okhla WtE plant in Delhi and the Narela-Bawana plant, which have demonstrated considerable capacity in waste processing and energy generation [
27]. According to [
28], similar study results have also been achieved in Thailand, and with WtE, material recovery could be enhanced. Zhao et al. [
29] stated that in China, due to changes in government support policies, mature technology, and low costs, WtE projects are economically feasible. However, the profitability of WtE projects is highly due to country specific factors such as policies, labor availability, and costs, the composition of the (municipal) waste streams, energy prices in the markets, feasibility of utilization of district heating generation and electricity trading laws and regulations and so on.
This paper aims to propose a model for the economic feasibility assessment of Waste-to-Energy (WtE) incineration of municipal solid waste (MSW) projects in the Russian context, especially in the city of St. Petersburg and Leningrad region cases. The model is based on the project’s cash flows. Net present value (NPV), internal rate of return (IRR), static payback period (SPP), and dynamic payback period (DPP) are key results of the model. A sensitivity analysis of the results is conducted to highlight the most sensitive factors to focus on. The data used in appraisal parameters is based on related academic literature and professional study context sources. The study also concerns other countries, where the waste management system is based on landfilling; however, the parameters used in the appraisal will vary depending on the country.
2. The Model
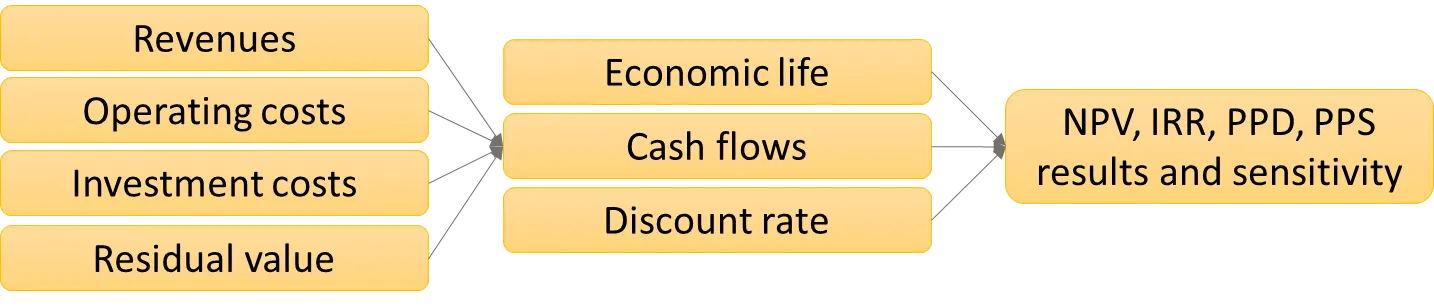
The goal of the model is to measure the profitability of a WtE incineration investment project by inserting parameter inputs. The basic logic of the model is illustrated in . After inputting the parameters, the model presents the economic feasibility of the investment in terms of Net Present Value (NPV), Internal Rate of Return (IRR), Static Payback Period (SPP), and Dynamic Payback Period (DPP) based on cash flows and discount rate. In this particular research process, we have excluded from the investigation the matters of who owns the facility. In the end of the study, the model is used for one parameter sensitivity analysis.
. Basic logic of the WtE investment appraisal model.
The annual cash flows are calculated from the revenues, operating costs, initial investment costs and residual value. Initial investment costs occur in first years, and after that, the revenues and operating costs occur annually until the economic life of the investment is reached. Residual value is considered a percentage of investment costs in the last year of economic life. Cash flows are discounted using a determined discount rate. In the appraisal, the cash flows are inputted as real cash flows (cash flows are fixed, development of costs and revenues are considered in the discount rate). The discount rate used is the real interest rate due to challenges in forecasting price developments and inflation of different factors separately. Taxes are not considered.
Revenues created at WtE facilities are related to products saved from the waste, which typically means the sales of energy in the forms of electricity and heat but can also include sales of sorted materials such as metals [
30]. According to Rogoff & Screve [
31] investment costs of WtE are related to the planning and acquiring of equipment, land, and building of the plant. Operating costs are related to labor, maintenance, utilities, emission testing, ash disposal,
etc. Residual value means the value that can be received from selling the invested assets [
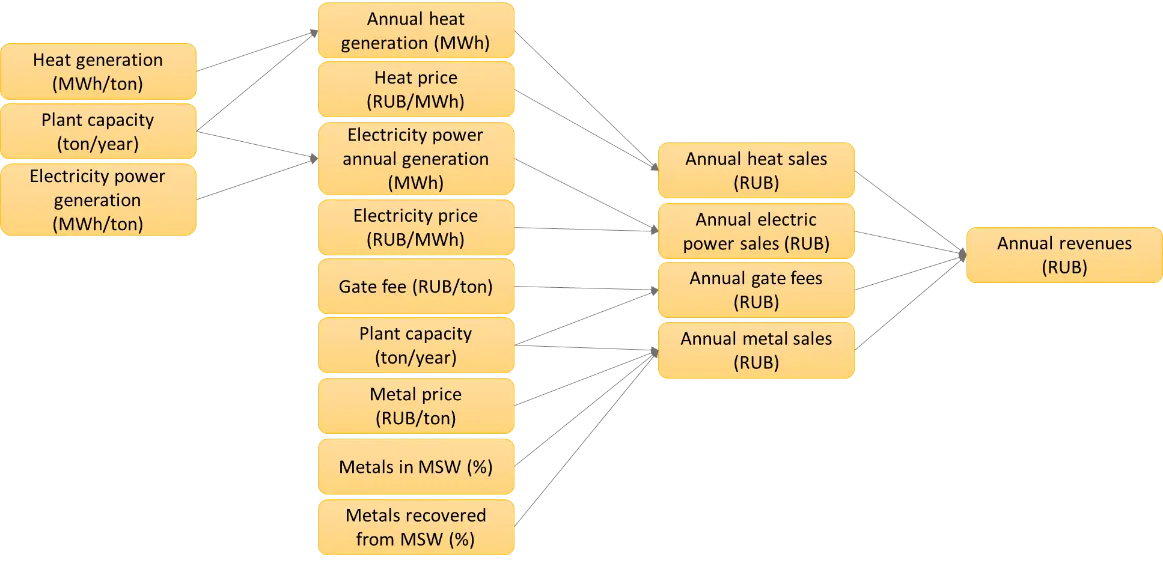
32]. In this model, the revenues consist of sales of electricity power, sales of district heating, gate fees, and sales of recovered metals ().
. Revenue generation of the model.
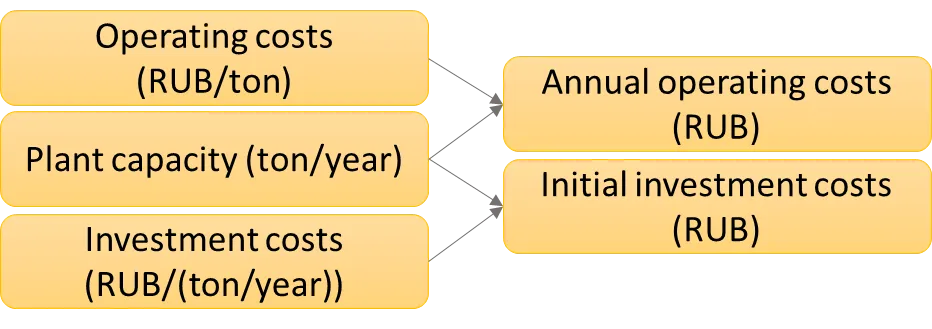
In this model, the costs consist of operating and investment costs (). The operating costs include all operating and maintenance costs without division into individual factors or fixed and variable costs. As with operating costs, the investment cost is not divided into different factors such as building, equipment, and construction work, however, all the investment costs are included.
3. Analysis and Discussion
The data used in this research is collected from articles, reports, and professionals about WtE project appraisals worldwide and from Russia. In , the parameter values used in the appraisal are illustrated. The plant is assumed to be a combined heat and power (CHP) plant. The capacity used in this appraisal is 1.8 million tons/year, which is 90% of 2 million tons/year. In a Russian electricity only producing WtE project for 5 incineration plants with a capacity of 3,350,000 tons/year, an investment cost of 37,881 RUB/(ton/year) was used [
33]. In CHP WtE projects in Finland and Denmark, the investment cost varies from 75,000 to 100,000 RUB/ton when converted to RUB [
34]. However, in studies from Thailand, China, and Italy, the investment costs varied from 15,000 to 40,000 RUB/(ton/year) when converted to RUB [
25,
28,
29]. Equipment is needed for district heating production also, and because of this, a cost of 45,000 RUB/(ton/year) is used in this appraisal. Residual value is expected to be 5% of the initial investment, and working capital is expected to be included in the investment cost and released as part of the residual value. In the Russian project for 5 plants, an operating cost of 768 RUB/ton was used [
33]. In Danish projects, operating costs varied from 4000 RUB/ton to 5700 RUB/ton [
34]. In China, these costs were 2000 RUB/ton and 2500 RUB/ton in Thailand when converted to RUB [
28,
29]. This appraisal assumes that some operating costs may have been left out of the number announced by the project of 5 plants. Due to this, an operating cost of 2000 RUB/ton is used.
.
Parameters used in the appraisal model.
| Parameter |
Variable |
Assumption |
| Capacity |
ton/year |
1,800,000 |
| Initial investment costs per capacity |
RUB/(ton/year) |
45,000 |
| Operating costs per capacity |
RUB/(ton) |
2000 |
| Price of metals |
RUB/ton |
3000 |
| Gate fee price |
RUB/ton |
1800 |
| Price of electricity |
RUB/MWh |
3000 |
| Price of heat |
RUB/MWh |
1300 |
| % of metals |
% |
4.0 |
| Recovery % of metals |
% |
50.0 |
| Electricity generation |
MWh/ton |
0.5 |
| Heat generation |
MWh/ton |
1.4 |
| Economic lifetime of investment |
year |
25 |
| Construction period |
year |
3 |
| Real discount rate |
% |
2.7 |
| Residual value (% of Initial investment) |
% |
5.0 |
According to professionals, gate fees in Russia for MSW vary from 1600 to 2300 RUB/ton. 1800 RUB/ton is used in this appraisal. According to [
35], the electricity tariff for private customers in St. Petersburg varies from 3480 to 4650 RUB/MWh. The selling price of electricity for the WtE plant can be assumed to be lower. In this appraisal, the electricity selling price is assumed to be 3000 RUB/MWh. According to GPTEK [
36] the tariff of heat for private customers in Leningrad varies from 1463 to 1765 RUB/MWh. The selling price of electricity for the WtE plant can be assumed to be lower. In this appraisal, the electricity selling price is assumed to be 1300 RUB/MWh. 50% of the metals in the MSW are expected to be collected from the bottom ash. The percentage of metals in the MSW is expected to be 4%, and the selling price for the metals is expected to be 3000 RUB/ton.
This project assumes a lower heating value (LHV) of 8 MJ/kg, which is the same as in the Voskrosensk project in Russia. In Voskrosensk, the electricity power generation was 0.6 MWh/ton [
37]. With the data available, the electricity generation capability of the WtE plant is assumed to be slightly lower compared to Voskrosensk WtE project because in that project, only electricity was generated and no heat. In Danish, Finnish, and Thai projects, the electricity power generation varied from 0.52 to 0.69 MWh/ton [
28,
34,
38]. A value of 0.53 MWh/ton is used, which requires approximately 24% electricity efficiency when the LHV of MSW is assumed to be 8 MJ/kg. In Finland and Denmark, the heat generation varied from 1.54 to 2.33 MWh/ton [
34,
38]. With a lack of available data on CHP WtE plants in Russia, an assumption of 1.39 MWh/ton is used for district heating generation. 1.39 MWh/ton requires approximately 62.5% heat efficiency when the LHV of MSW is assumed to be 8 MJ/kg. These values seem reasonable as the electricity efficiency typically varies between 20–27% in CHP WtE plants, and heat efficiency typically varies between 60–65% in CHP WtE plants [
39].
Economic lifetimes used in the appraisals of WtE projects in Denmark, China, Italy, and Thailand varied from 20 to 30 years, and construction periods in Denmark and China varied from 2 to 3 years [
25,
28,
29,
34]. An economic lifetime of 25 years is used in this appraisal, and a construction period of 3 years is due to the size of the project. In the appraisal, the cash flows are input as real cash flows (cash flows are fixed, and the development of costs and revenues are considered in the discount rate). The discount rate used is the real interest rate due to challenges in forecasting price developments and inflation of different factors separately. According to data from the World Bank [
40], Russia’s long-term average real interest rate is 5.8%. When considering the years 2011–2020, the average real interest rate in Russia is 2.7%, and when considering the years 2001–2020, the average real interest rate in Russia is 0.6%. 2.7% will be used in the model as the base assumption.
4. Modelling the WTE Project Investment
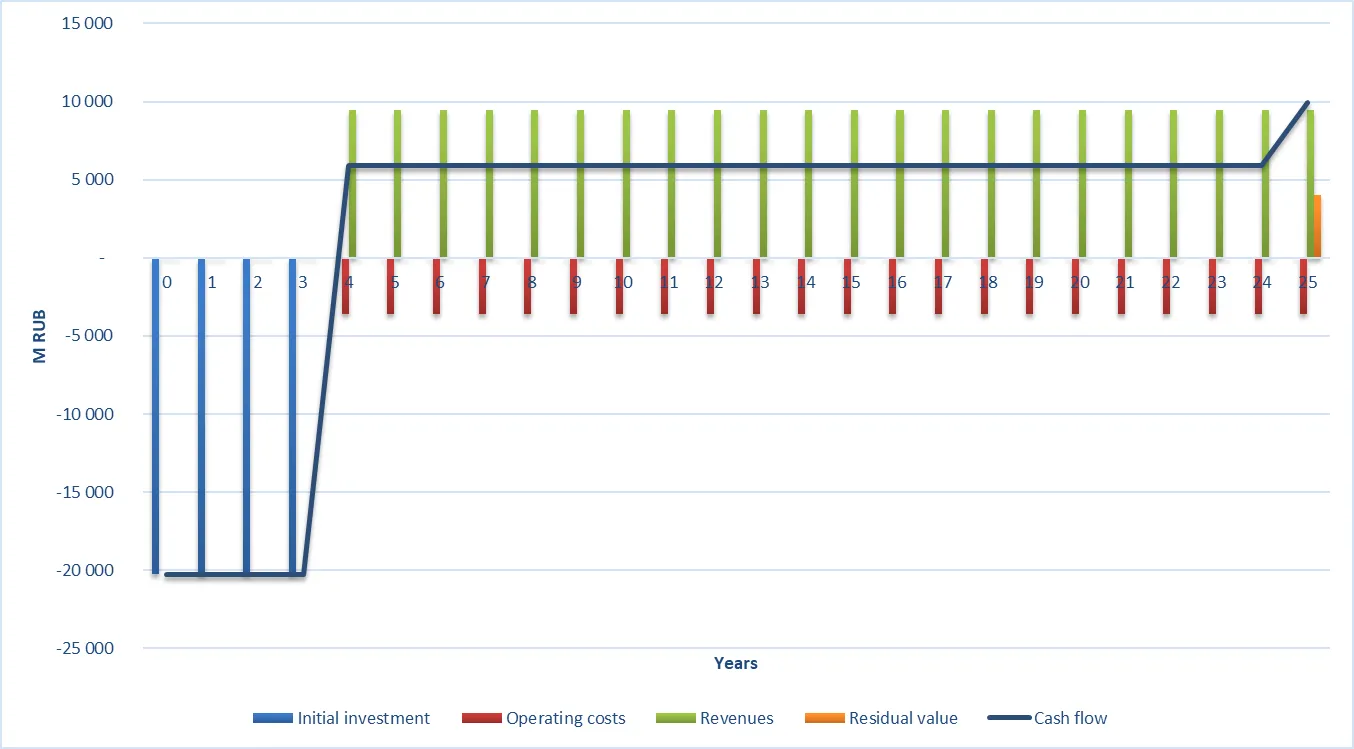
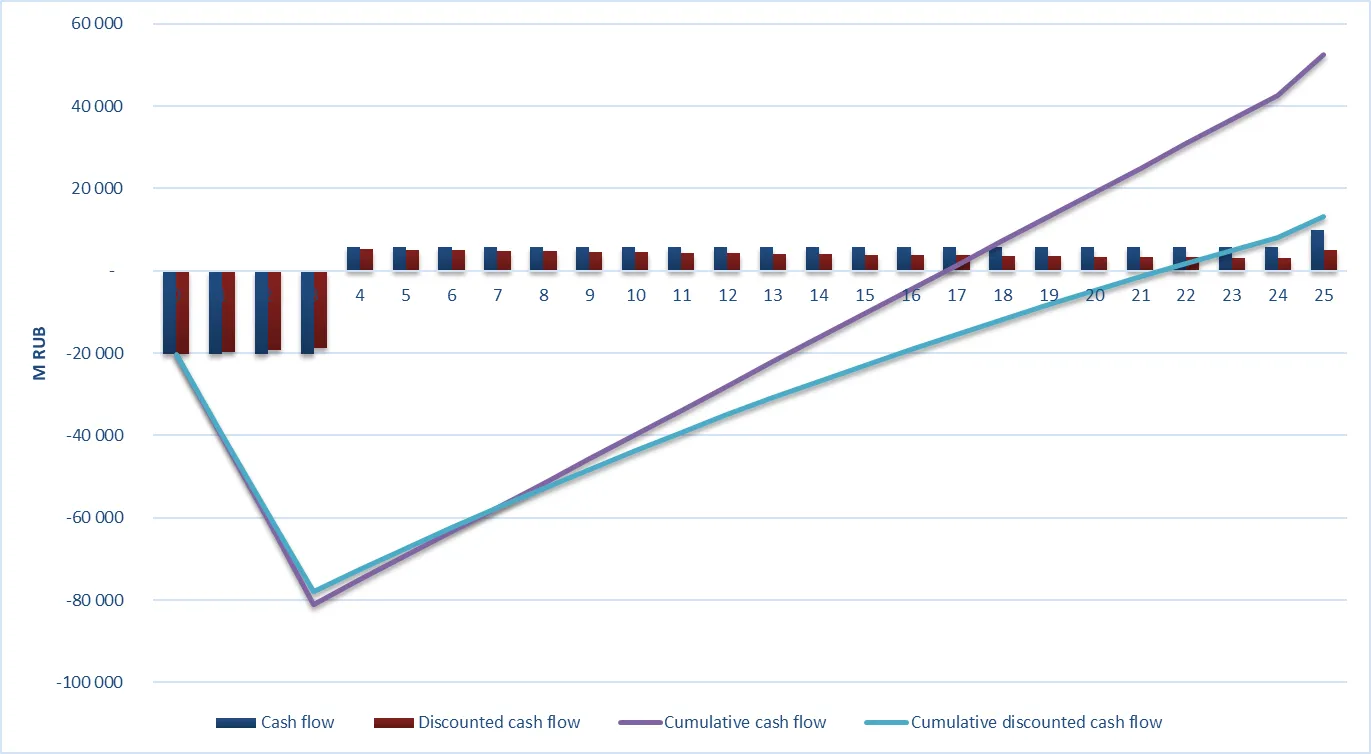
With these assumptions, the initial investment would be 81 billion RUB. This model divides the investment cost equally between the starting time and the end of the first three years. For the first four moments of time, the cash flow of the project would be −20.3 billion RUB each. After the first three years, the annual operating costs and revenues would be constant until the end of the plant’s economic lifetime. Annual revenues would be 9.5 billion RUB (heat 34%, electricity 34%, gate fees 30%, metals 1%), and annual operating costs would be 3.6 billion RUB, resulting in an annual cash flow of 5.9 billion RUB. The residual value of the project would be 4.1 billion RUB. The cash flows are illustrated in and .
. Cash flows of the WtE project.
. Cash flows and discounted cash flows of WtE project.
The assumptions make the WtE project in St. Petersburg and Leningrad profitable, with an NPV of 13.1 billion RUB and an IRR of 4.1% higher than the discount rate used. The SPP of the project is 16.8 years, so the project can be expected to be paid back in 16.8 years if the time value of money is not considered and DPP of the project is 21.4 years and so the project is expected to be paid back in 21.4 years if the time value of money is considered.
5. Model-Related Sensitivity Analysis
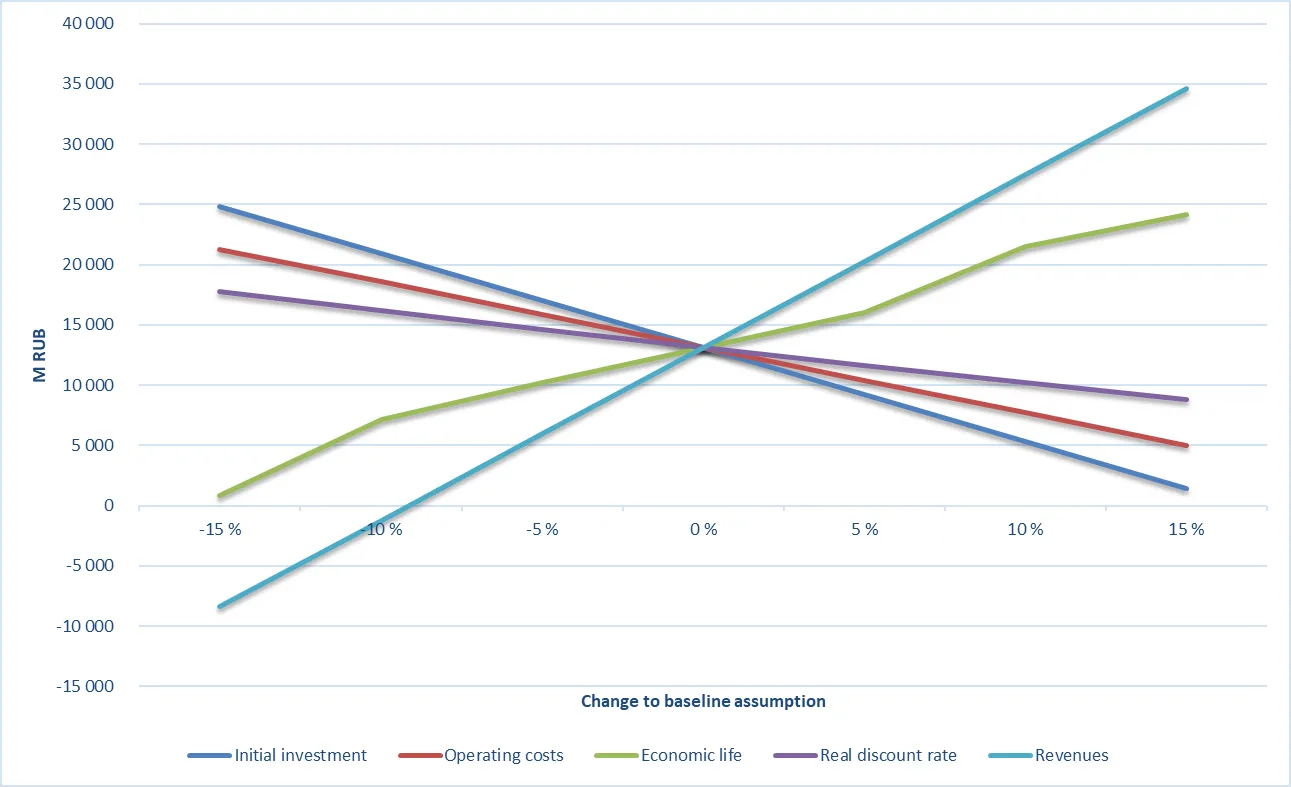
The uncertainty of the results was encountered with one parameter sensitivity analysis of initial investment costs, operating costs, economic life, interest rate, and revenues within −15% to +15% change to the assumptions. In this analysis, each of these parameters was changed individually, as other parameters were at the assumption level. (, ).
. NPV sensitivity analysis (Economic life rounded to full years).
NPV, IRR, and payback periods correlate positively with changes in economic life and revenues. NPV, IRR, and payback periods have a negative relationship with changes in initial investment, operating costs, and discount rate. Also, a change in electricity efficiency, electricity production, electricity price, and electricity revenues all have the same effect on the results. Due to this, only electricity revenues are considered. The effect is the same with heat efficiency, production, price, and revenues. A change in revenues has the highest impact on the results of the investment appraisal, and the project is not economically feasible with NPV below 0 RUB if the revenues are reduced by 9.2%. A 15% decrease/increase in any other parameter does not result in a negative NPV. Some notable factors and their impact on profitability are listed in .
.
NPV, IRR, payback periods sensitivity analysis (Economic life rounded to full years).
| NPV (M RUB) |
−15% |
−10% |
−5% |
0% |
5% |
10% |
15% |
| Initial investment |
24,795 |
20,904 |
17,012 |
13,121 |
9230 |
5338 |
1447 |
| Operating costs |
21,278 |
18,559 |
15,840 |
13,121 |
10,402 |
7683 |
4964 |
| Economic life |
852 |
7152 |
10,176 |
13,121 |
15,987 |
21,493 |
24,137 |
| Real discount rate |
17,805 |
16,203 |
14,643 |
13,121 |
11,638 |
10,192 |
8782 |
| Revenues |
−8368 |
−1205 |
5958 |
13,121 |
20,284 |
27,447 |
34,611 |
| $$\,\,\,\,\,\,$$Electricity |
6587 |
8765 |
10,943 |
13,121 |
15,299 |
17,477 |
19,655 |
| $$\,\,\,\,\,\,$$Gate fees |
5780 |
8227 |
10,674 |
13,121 |
15,568 |
18,015 |
20,462 |
| $$\,\,\,\,\,\,$$Heat |
5751 |
8208 |
10,634 |
13,121 |
15,578 |
18,034 |
20,491 |
| $$\,\,\,\,\,\,$$Metals |
12,876 |
12,958 |
13,039 |
13,121 |
13,203 |
13,284 |
13,366 |
| IRR |
−15% |
−10% |
−5% |
0% |
5% |
10% |
15% |
| Initial investment |
5.6 |
5.0 |
4.5 |
4.1 |
3.6 |
3.2 |
2.9 |
| Operating costs |
4.9 |
4.6 |
4.3 |
4.1 |
3.8 |
3.5 |
3.3 |
| Economic life |
2.8 |
3.5 |
3.8 |
4.1 |
4.3 |
4.7 |
4.9 |
| Revenues |
1.8 |
2.6 |
3.4 |
4.1 |
4.8 |
5.4 |
6.1 |
| $$\,\,\,\,\,\,$$Electricity |
3.4 |
3.6 |
3.9 |
4.1 |
4.3 |
4.5 |
4.7 |
| $$\,\,\,\,\,\,$$Gate fees |
3.3 |
3.6 |
3.8 |
4.1 |
4.3 |
4.6 |
4.8 |
| $$\,\,\,\,\,\,$$Heat |
3.3 |
3.6 |
3.8 |
4.1 |
4.3 |
4.6 |
4.8 |
| $$\,\,\,\,\,\,$$Electricity generation |
3.4 |
3.6 |
3.9 |
4.1 |
4.3 |
4.5 |
4.7 |
| $$\,\,\,\,\,\,$$Heat generation |
3.3 |
3.6 |
3.8 |
4.1 |
4.3 |
4.6 |
4.8 |
| Static Payback Period (SPP) (Years) |
−15% |
−10% |
−5% |
0% |
5% |
10% |
15% |
| Initial investment |
14.7 |
15.4 |
16.1 |
16.8 |
17.5 |
18.1 |
18.8 |
| Operating costs |
15.6 |
16 |
16.4 |
16.8 |
17.2 |
17.7 |
18.2 |
| Economic life |
16.8 |
16.8 |
16.8 |
16.8 |
16.8 |
16.8 |
16.8 |
| Real discount rate |
16.8 |
16.8 |
16.8 |
16.8 |
16.8 |
16.8 |
16.8 |
| Revenues |
21.2 |
19.4 |
18 |
16.8 |
15.7 |
14.9 |
14.1 |
| $$\,\,\,\,\,\,$$Electricity |
17.9 |
17.5 |
17.1 |
16.8 |
16.4 |
16.1 |
15.8 |
| $$\,\,\,\,\,\,$$Gate fees |
18 |
17.6 |
17.2 |
16.8 |
16.4 |
16 |
15.7 |
| $$\,\,\,\,\,\,$$Heat |
18 |
17.6 |
17.2 |
16.8 |
16.4 |
16 |
15.7 |
| $$\,\,\,\,\,\,$$Metals |
16.8 |
16.8 |
16.8 |
16.8 |
16.8 |
16.7 |
16.7 |
| Dynamic Payback Period (DPP) (Years) |
−15% |
−10% |
−5% |
0% |
5% |
10% |
15% |
| Initial investment |
18 |
19.1 |
20.3 |
21.4 |
22.7 |
23.9 |
24.7 |
| Operating costs |
19.5 |
20.1 |
20.7 |
21.4 |
22.2 |
23 |
23.9 |
| Economic life |
20.8 |
21.4 |
21.4 |
21.4 |
21.4 |
21.4 |
21.4 |
| Real discount rate |
20.5 |
20.8 |
21.1 |
21.4 |
21.8 |
22.1 |
22.5 |
| Revenues |
- |
- |
23.6 |
21.4 |
19.7 |
18.3 |
17.1 |
| $$\,\,\,\,\,\,$$Electricity |
23.4 |
22.7 |
22 |
21.4 |
20.9 |
20.3 |
19.8 |
| $$\,\,\,\,\,\,$$Gate fees |
23.7 |
22.9 |
22.1 |
21.4 |
20.8 |
20.2 |
19.7 |
| $$\,\,\,\,\,\,$$Heat |
23.7 |
22.9 |
22.1 |
21.4 |
20.8 |
20.2 |
19.7 |
| $$\,\,\,\,\,\,$$Metals |
21.5 |
21.5 |
21.5 |
21.4 |
21.4 |
21.4 |
21.4 |
.
Factors affecting profitability of WtE incineration.
| Factor |
Impact on Profitability If Increasing |
| Energy efficiency |
Increase |
| Heating value of MSW |
Increase |
| Selling price of heat and electricity |
Increase |
| Gate fee price |
Increase |
| Utilization rate |
Increase |
| Investment costs |
Decrease |
| Operating costs |
Decrease |
| Economic lifetime of investment |
Increase |
6. Sensitivity Analysis for Revenues
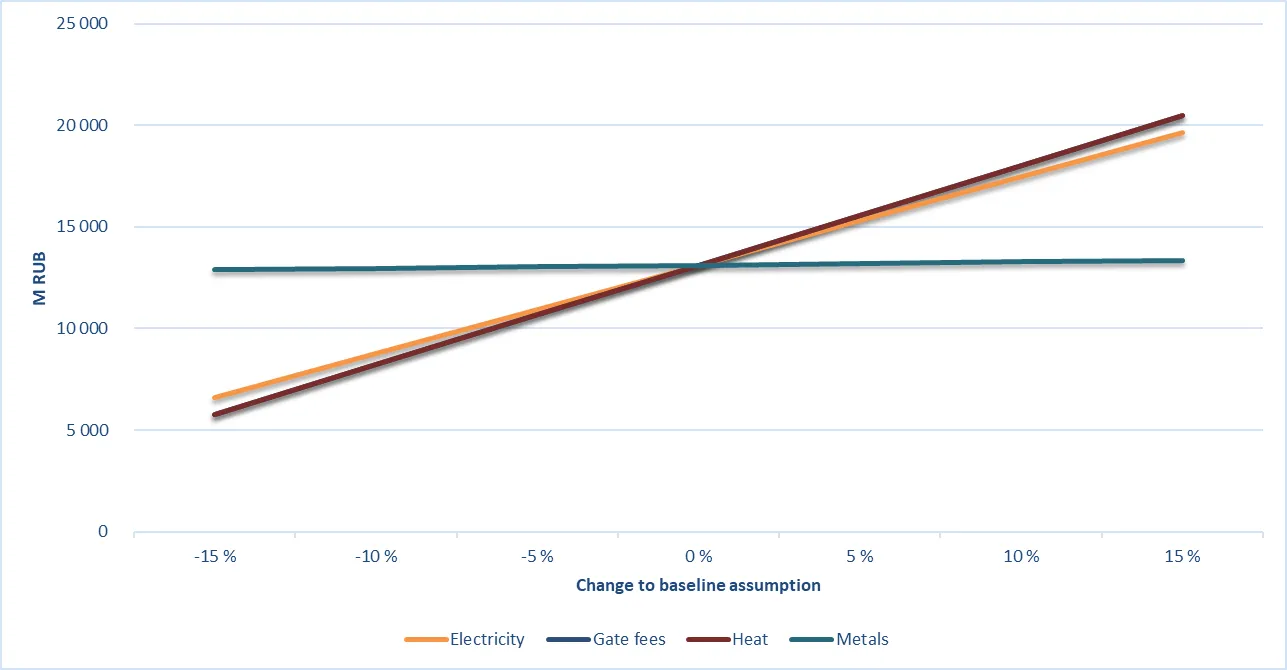
In , the sensitivity of each source of revenue is visualized. Changes in revenues from sales of heat and electricity and revenues from gate fees all have quite a similar impact on the NPV of the project, with heat having the slightly highest impact, gate fees second highest, and electricity third highest. The impact of changes in metals sales is marginal. If customers needed to be attracted to bring MSW to these WtE plants instead of landfills, the gate fees could be lowered from 1800 to 1317 RUB/ton. With 1317 RUB/ton gate fee, the project would still be barely economically feasible with NPV of 0 RUB.
. One parameter NPV sensitivity analysis of revenues.
In sales of energy in the form of electricity, power, and heat, the sensitivity of revenues is due to changes in the MSW waste stream, energy efficiency of the plant, capacity of the plant, and selling prices of electricity and heat. The LHV of MSW has a direct link to energy sales. If the MSW has a lower LHV than expected, less energy can be generated, and vice versa if the MSW has a higher LHV than expected, more energy can be generated. It is also possible that due to changes in consuming habits or waste processing, the composition of MSW can change over time, and so the LHV of MSW can change over time. For example, plastics have high LHV, and if effective recycling of plastics takes place in St. Petersburg and the Leningrad area, the LHV of MSW decreases. However, the portion of food waste in waste streams of St. Petersburg and Leningrad is high [
41,
42]. The LHV of food waste is relatively low and if effective sorting of food waste occurs, the LHV of MSW can be increased.
It must also be considered that if more efficient sorting takes place, and we find ways to educate and put on use the newest technologies like artificial intelligence [
43,
44,
45,
46], Industry 4.0 [
47], resource management trough fleet technologies [
48,
49], waste generation and process related waste reporting capabilities in operations management systems [
50], larger scale Digital Citizen Science sustainability support solutions [
51,
52,
53] and transforming physical assets to digital solutions [
54,
55] and manage operations in larger fleets [
49], the overall amount of MSW generation is going to decrease. This would result in a demand reduction for WtE plant incineration capacity, which could result in lower than desired utilization rates in WtE plants. Lower utilization rates of WtE plants can result in lower profitability and higher environmental impacts, but on the other hand, the change will not happen overnight, and the current plants have their own decommission dates too. But if the waste amounts go down per plant, so will the revenues received from the gate fees. Due to this, the future of MSW waste stream needs to be further analyzed before making decisions of the desired MSW incineration capacity. The investment project could become more profitable if less capacity is needed and the MSW has a higher LHV. The efficiency of the equipment also has a significant impact on the revenues. With lower efficiency, more energy is lost in the process and not recovered for sale. The efficiency of the plant also decreases over time and without proper maintenance, the change can be significant. Here, WtE solution sector should look e.g. high value items preventive maintenance strategies [
56], and select easy and affordable options to be included to waste management sector, to enhance long run financial feasibility of the plants and their related operational activities.
Changes in the selling price of electricity, power, and district heating affect the project’s profitability. In the appraisal, the selling prices are expected to increase at the same pace as inflation. However, it would be possible that the sales of energy from WtE plant would be incentivized and so, the selling prices would be increased to a higher level compared to, for example, energy generated using fossil fuels. However, the prices in the energy markets can decrease or increase due to other factors. Gate fee prices can also increase faster or slower than inflation. If policy changes to incentivize WtE plants are made, these prices might increase, creating higher revenues.
Another uncertainty factor when considering energy sales is the contracts made for the sale of energy. The energy will be created constantly on a WtE plant; if there is no customer for the energy, there will also be no revenues. Long-term contracts, especially for electricity, should be preferred, and customers should be acquired before constructing a WtE project. There are also uncertainties surrounding the sale of metals due to difficulties in finding buyers and the varying quality of the metals. However, the revenues generated from the sale of metals are quite marginal, and in the case of no sales of metals, the project would still be profitable with an NPV of 11.5 billion RUB, an IRR of 3.9%, and an SPP of 17 years and a DPP of 21.9 years. The sales of bottom ashes for construction purposes could also increase revenues slightly or at least reduce operating costs by avoiding landfilling.
7. Electricity Only Generation Case
In case of no heat sales, the project would not be profitable with NPV of −36 billion RUB, IRR of −1.9% and negative payback periods. In this assumption, the plant would be built with the technology to utilize heat production. However, the parameters would have to be slightly altered if the plant were built to generate electricity only. Investment costs can be assumed to be lower due to simpler plant technology; electricity power generation can be better due to only electricity production, and the operating costs can also be lower. The initial investment cost would be changed to 37,900, the electricity power generation would be 0.6, and the operating cost would be 1500. With these changes, the project would still not be profitable with an NPV of −5.0 billion RUB, an IRR of 2.1%, an SPP of 20.5, and a negative DPP. In addition, it is worth mentioning that other resources would have to be used to generate the heat needed in Leningrad and St. Petersburg, which would not be generated in this case from waste.
8. Scenario Analysis of Discount Rate
The discount rate plays a significant role in defining whether an investment project is profitable or not. In the one parameter sensitivity analysis, the discount rate did not significantly affect the project’s profitability as other parameters. However, the variance in the discount rate can be expected to be significantly higher compared to other parameters. As earlier mentioned, three potential real interest rates are 0.6%, 2.7%, and 5.8%. 2.7% was used as the assumption. In this scenario analysis, 0.6% is used as the optimistic assumption, 2.7% is used as the most likely assumption, and 5.8% is used as the pessimistic assumption. With optimistic assumptions, the NPV is as high as 42.7 billion RUB, and DPP would be 17.5 years, whereas with pessimistic assumptions, the project seems to be unprofitable with an NPV of −12.9 billion RUB and a negative DPP. For the project to be economically feasible by reaching 0 NPV with the pessimistic real discount rate of 5.83%, the gate fees would have to be increased to 2495 RUB/ton or the electricity selling price would have to be increased to 4300 RUB/ton or heat selling price would have to be increased to 1800 RUB/ton. Also, some sort of combination of all these three could be arranged.
9. Discussions and Conclusions
It is good to remember that these results are country-specific, and in this special context, a typical development path has been a correlation of an increase in energy costs, when labor costs and the cost of materials and products are also going up. Also, the climate where incineration is done and the re-treatment of the waste to be incinerated, can affect the efficiency of the process, as proper pre-treatment will contribute to the enhancement of operational efficiency in waste-to-energy plants [57]. And further adoption of sustainable waste disposal practices, that would prioritize ecological responsibility and resource utilization should also be considered [58] for enhanced process and ecological efficiencies. So, within that correlative context, one can assume that if a WtE facility were financially feasible in current cost structures and cultural context, it would also have a good chance to stay so in the near future. In relation to financial feasibility, future studies could compare the effect of ownership of the facility on its efficiency, effectivity, and financial feasibility, e.g., governmental facility vs. privately owned one.
Considering the WtE project from the societal point of view, one should consider the positive effect of utilizing WtE plants, the costs of landfilling for society would be decreased due to the decreased need for landfilling altogether. On the appraisal front, landfilling and related costs could be added to the appraisal model on the cost savings side when compared to the current waste management system and the possibility of utilizing WtE solutions. We also suggest that future research add precision to the calculations compared to realized projects (only a handful were in progress in the case country at the study’s time). We also suggest a comparison of the modeled data to the technology provider’s views on specific countries. The calculations would be made as local taxation, import and export customs fees, and technology know-how, which will definitely affect the smaller details of the costs. Finally, the correlation of WtE facility size, the population density, transportation, vehicle & labor costs should be considered too. In long-term planning, the general energy prices and political views on the level of sustainability of waste-to-energy conversion and related scenario analysis and forecasts would be needed too.
Finally, the cultural environment and local populations’ knowledge about the realities of modern WtE facilities [59] have to be taken into account too. It is a general opinion of local academics that near the St. Petersburg city, the local population has, at least in recent history, been against the idea of having WtE plants anywhere near the city, especially their own living regions. This pushback against these facilities is related to a general worry that there will be smells, noise, and other forms of unwanted fumes, particle emissions, etc. Generally speaking, the population expects issues related to burning and handling waste. We suggest continuing to study the phenomena, especially focusing on firsthand information and a wide range of surveys within the general population [60]. Additionally, gender differences [61] in thinking lines and engineering perspectives [62] could be considered to help both find new, novel and more sustainable ways to solve possible shortcomings and to support built educative content fit for all genders to add understanding the importance of staying away from landfilling solutions. Also, the situation has changed a lot with the WtE facilities emissions, in fact, modern emissions limiting structures enhance the heat capture of the facility [63], for distance heating purposes. In short, even if the financial side might look good on a calculation basis, the social, cultural, front-line industrial process automation level development [64] and country specific political matters have to be taken into consideration too.
With the use of real options, the risks of the project could be mitigated. According to Trigeorgis [65] the traditional real options of investments are: the option to defer, the option to stage, the option to abandon, the option to change scale, the option to stop/restart operations, the option to grow and the option to change inputs/outputs. These options should be considered when implementing the WtE plant. For example, the project could be implemented incrementally if the plant is only built partially at first and later, and if successful results are achieved, the rest of the plant will be built. It could be also possible to plan the WtE project for the whole MSW stream of the area but first implement it for only part of the stream. For example, if the most economically feasible option would be to create multiple WtE plants, only one plant could be built first, and in case of successful implementation, the rest of the plants should be built.
In the case of recovered metals, the value of metals was near all-time high numbers and we have seen a drop of 20–30% on some of those valuation values (late summer/early autumn 2022), considering the length of time one plans a WtE facilities, the income received from metal capture should be estimated with care, with a safety buffer for possible long term drop on income received from the material recovery. Luckily, the metal recovery is smaller in proportion on the income streams than either the distance heating or electricity part, or the gate fees.
Ultimately, even when the WtE conversion would be financially feasible, it is more like a necessary evil, better than a landfill, but still not an optimal solution to the global waste problem. In the bigger picture, it will be more important to understand [60] and then try to change the consumption patterns of the local (and global) population, increase the rate of recycling of materials, and update the general population possible role and innovation contributions in sustainability matters [66,67], their awareness about sustainability issues [68] and technology utilization possibilities [47]. Changing the behavior of people can happen in a short period of time, in a limited group and number of people [69], but a large-scale change needs a long time to become reality. Additionally, the change will progress at different rates, in different assets groups [70] which, can affect the profitability of WtE installation, in different countries and living areas. Overall, WtE plant investments offer a lot of potential investment, especially from an environmental point of view. WtE investments seem financially appealing all the way to the range of 40 years or so as payback time. On one hand, society development predictions for this sort of timeframes are challenging, but on the other, the waste handling problem has been a long time with us, and it is definitely best to focus on WtE than landfilling, as long as we do not have even better options to consider too. Landfills have extensive problems, extending to potential poor construction and as such later on in need of monitoring methods against landslides [71]. All in all, we still need to keep our eyes open for other options, like the recent studies considering methanol production from MSW, a waste-to-chemical (WtC) alternative based on circular economy principles, comparing it to waste-to-energy (WtE) methods and landfilling with biogas recovery and incineration [72].
To move forward, within the challenges of municipal solid waste management strategies and implementations and find short-term solutions, one must also look for long-term options. In the context of municipal solid waste management techniques, this would mean looking toward proper waste prevention methods [73,74,75,76] to overall reduce and prevent waste [77,78,79,80,81], reduce waste related insecurities like food insecurity [82] and in general push populations to waste generation minimization directions in the first place. This should be followed by waste minimization, as in many cases waste cannot be outright eliminated from a variety of component manufacturing use and transportation [83,84] & warehousing [85,86] processes or because the waste components do not have any valuable reuse options available for them, but for those that do, should be pushed on minimization direction. This is then to be followed by designing for sustainability and educating proper design thinking [87] methods, and pushing forward recycling and reuse methods, using e.g., biological treatment [88,89], investing to proper environmental monitoring systems [90], considering of artificial intelligences support options for circularity [43], previously discussed incineration, component reutilization, chemical and mechanical recycling, using both physical [91] and algorithm/virtual robotization [92] and so-on as efficiency and effective process improvement tools and then in the end of everything else, consider landfill as absolute last option. In the case of incineration, the biggest concern to be remembered and addressed is the need to properly mitigate and reduce/remove gas emissions coming from the burning process. This includes proper utilization, investment, and maintenance of flue gas treatment technology solutions with options like carbon capture control technologies and pre-treatment of the waste components to reduce the need for post-burn flue gas removal and reduce CO₂ and other pollutants.
All in all, none of the top 10 or so recycling/sustainability focused best of the best/top countries, when we take a look at their wholistic structures in waste processing and management have reached that level in a few years, they have been working decades, taking steps towards more innovative and smarter waste management models [93], to be able to reach their current level. Many countries still have a long path ahead of them, SME companies will need green growth-related success work help [94] and university collaboration [95] for sustainable business models [66,96,97] and municipal investment in and for incineration plants, should still have around 25 years or so of ”life time” ahead of them, but at the same time, we need to aim towards innovative zero-waste technologies higher utilization rates, consider new novel solutions and creative technology [98] options in proper human AI intersection [99], and in general look for ways to include advanced recycling systems, waste-to-energy conversion and side stream utilization solutions, and better use of biodegradable materials [100] and valorization technologies possibilities [101] to future waste management systems.
Author Contributions
Conceptualization, T.K. and A.H.; Methodology, T.V., T.K. and P.A.; Software, A.H.; Validation, T.K. and P.A.; Formal Analysis, T.V.; Investigation, T.P. and T.K.; Resources, T.K. and A.H.; Data Curation, T.V.; Writing—Original Draft Preparation, T.V.; Writing—Review & Editing, T.K. and A.H.; Visualization, T.V.; Supervision, T.K. and A.H.; Project Administration, A.H.; Funding Acquisition, A.H.
Ethics Statement
Not applicable.
Informed Consent Statement
Not applicable.
Data Availability Statement
Not applicable.
Funding
Authors would like to thank the European Neighborhood instrument Cross-border Cooperation (ENI CBC) funded AWARE project under Grant KS1913, for supporting this work. LUT International collaboration project for supporting finalization of the work.
Declaration of Competing Interest
The authors declare that they have no known competing financial interests or personal relationships that could have appeared to influence the work reported in this paper.
References
-
1.
Ghosh A, Kumar A, Biswas G. Exponential population growth and global food security: Challenges and alternatives. In Bioremediation of Emerging Contaminants from Soils; Elsevier: Amsterdam, The Netherlands, 2024; pp. 1–20.
-
2.
Saif S, Razia ET, Khan M, Hatshan MR, Adil SF. A Comprehensive Introduction to Solid Waste Issues. In Waste Derived Carbon Nanomaterials; American Chemical Society: Washington, DC, USA, 2025; Volume 1, pp. 1–16.
-
3.
Gómez-Sanabria A, Kiesewetter G, Klimont Z, Schoepp W, Haberl H. Potential for future reductions of global GHG and air pollutants from circular waste management systems.
Nat. Commun. 2022,
13, 106.
[Google Scholar]
-
4.
Kaza S, Yao L, Bhada-Tata P, Van Woerden F. What a Waste 2.0: A Global Snapshot of Solid Waste Management to 2050; Urban Development; World Bank: Washington, DC, USA, 2018. Available: https://openknowledge.worldbank.org/handle/10986/30317 (accessed on 8 January 2025).
-
5.
Vukovic N, Makogon E. Waste-to-Energy Generation: Complex World Project Analysis.
Sustainability 2024,
16, 3531.
[Google Scholar]
-
6.
United Nations. World Population Prospects 2022: Summary of Results. 2022. Available online: https://www.un.org/development/desa/pd/sites/www.un.org.development.desa.pd/files/wpp2022_summary_of_results.pdf (accessed on 8 January 2025).
-
7.
Abdel-Shafy HI, Ibrahim AM, Al-Sulaiman AM, Okasha RA. Landfill leachate: Sources, nature, organic composition, and treatment: An environmental overview.
Ain. Sham. Eng. J. 2024,
15, 102293.
[Google Scholar]
-
8.
Jokinen J. Roskat sekaisin säkkiin ja säkki metsään - jätteisiin hukkuva Venäjä yrittää luoda kierrätyskulttuuria tyhjästä. Turun Sanomat. 2019. Available online: https://www.ts.fi/uutiset/4727086 (accessed on 22 April 2025).
-
9.
Kuhaneswaran B, Chamanee G, Kumara BTGS. A comprehensive review on the integration of geographic information systems and artificial intelligence for landfill site selection: A systematic mapping perspective.
Waste Manag. Res. 2025,
43, 137–159.
[Google Scholar]
-
10.
Bharti J. Effect of Improper Waste Disposal on Environmental, Physical, and Emotional Well-Being of Human Beings. In Waste Management and Treatment; CRC Press: Boca Raton, FL, USA, 2024; pp. 26–38.
-
11.
Chen H, Xu H, Zhong C, Liu M, Yang L, He J, et al. Treatment of landfill leachate by coagulation: A review.
Sci. Total. Environ. 2024,
912, 169294.
[Google Scholar]
-
12.
Scaglia B, Salati S, Di Gregorio A, Carrera A, Tambone F, Adani F. Short mechanical biological treatment of municipal solid waste allows landfill impact reduction saving waste energy content.
Bioresour. Technol. 2013,
143, 131–138.
[Google Scholar]
-
13.
Dagwar PP, Dutta D. Landfill leachate a potential challenge towards sustainable environmental management.
Sci. Total. Environ. 2024,
926, 171668.
[Google Scholar]
-
14.
Abbasi S, Barzegar V, Alizadeh SS, Asgari A, Gholampour A. The Effects of Health, Safety and Environmental Criteria on the Performance of Landfilling Process: A Comparative AHP and Fuzzy AHP Analysis.
J. Environ. Assess. Policy Manag. 2025,
27, 2450017. doi:10.1142/S1464333224500170.
[Google Scholar]
-
15.
Kiehbadroudinezhad M, Merabet A, Hosseinzadeh-Bandbafha H. Landfill source of greenhouse gas emission In Advances and Technology Development in Greenhouse Gases: Emission, Capture and Conversion; Elsevier: Amsterdam, The Netherlands, 2024; pp. 123–145.
-
16.
Christensen TH, Scharff H, Hjelmar O. Landfilling: concepts and challenges. In Solid Waste Technology and Management, 2nd ed.; Wiley: Chichester, UK, 2011; pp. 683–694.
-
17.
Manjunatha G, Lakshmikanthan P, Chavan D, Baghel DS, Kumar S, Kumar R. Detection and extinguishment approaches for municipal solid waste landfill fires: A mini review.
Waste Manag. Res. 2024,
42, 16–26.
[Google Scholar]
-
18.
Kumar A, Samadder SR. A review on technological options of waste to energy for effective management of municipal solid waste.
Waste Manag. 2017,
69, 407–422.
[Google Scholar]
-
19.
Jamasb T, Nepal R. Issues and options in waste management: A social cost–benefit analysis of waste-to-energy in the UK.
Resour. Conserv. Recycl. 2010,
54, 1341–1352.
[Google Scholar]
-
20.
Meylan G, Spoerri A. Eco-efficiency assessment of options for metal recovery from incineration residues: A conceptual framework.
Waste Manag. 2014,
34, 93–100.
[Google Scholar]
-
21.
Allegrini E, Maresca A, Olsson ME, Holtze MS, Boldrin A, Astrup TF. Quantification of the resource recovery potential of municipal solid waste incineration bottom ashes.
Waste Manag. 2014,
34, 1627–1636.
[Google Scholar]
-
22.
Jäämeri E. Venäjän jätehuoltouudistus. 2022. Available online: https://www.svkk.fi/jatehuoltouudistus/ (accessed on 10 February 2022).
-
23.
European Environment Agency. Waste recycling in Europe. 2021. Available online: https://www.eea.europa.eu/ims/waste-recycling-in-europe (accessed on 2 January 2025).
-
24.
Pääkkönen J, Saarto P. Jäteuudistus Venäjän alueilla—Osa 1: Pietari ja Leningradin alue. 2019. Available online: https://www.svkk.fi/venla-lehti-2/teema/jateuudistus-venajan-alueilla-osa-1-pietari-ja-leningradin-alue/ (accessed on 12 January 2023).
-
25.
Cucchiella F, D’Adamo I, Gastaldi M. Sustainable management of waste-to-energy facilities.
Renew. Sustain. Energy Rev. 2014,
33, 719–728.
[Google Scholar]
-
26.
Mudofir M, Astuti SP, Purnasari N, Sabariyanto S, Yenneti K, Ogan DD. Waste harvesting: lessons learned from the development of waste-to-energy power plants in Indonesia.
Int. J. Energy Sect. Manag. 2025,
ahead-of-print.
[Google Scholar]
-
27.
Sati K, Vats A. Turning Trash into Treasure: The Current Landscape and Future of Waste-to-Energy Initiatives in India.
Int. J. Environ. Agric. Biotechnol. 2024,
9, 125–132.
[Google Scholar]
-
28.
Udomsri S, Martin AR, Fransson TH. Economic assessment and energy model scenarios of municipal solid waste incineration and gas turbine hybrid dual-fueled cycles in Thailand.
Waste Manag. 2010,
30, 1414–1422.
[Google Scholar]
-
29.
Zhao X, Jiang G, Li A, Wang L. Economic analysis of waste-to-energy industry in China.
Waste Manag. 2016,
48, 604–618.
[Google Scholar]
-
30.
Monni S. From landfilling to waste incineration: Implications on GHG emissions of different actors.
Int. J. Greenh. Gas. Cont. 2012,
8, 82–89.
[Google Scholar]
-
31.
Rogoff MJ, Screve F. Waste-to-Energy: Technologies and Project Implementation, 3rd ed.; Elsevier William Andrew: Oxford, UK, 2019; 214p.
-
32.
Götze U, Northcott D, Schuster P. Investment Appraisal Methods and Models, 2nd ed.; Springer: Berlin/Heidelberg, Germany, 2015; 366p.
-
33.
Lomtev A. A Unified Concept for the Management of Municipal Solid Waste (MSW) in St. Petersburg and the Leningrad Region (with Possibility of Separating MSW Flows). Institute of Design, Ecology and Hygiene. 2021. Available online: https://tinyurl.com/UCfMoMSW (accessed on 6 January 2025).
-
34.
Danish Energy Agency. Technology Data, Generation of Electricity and District Heating. 2022. Available online: https://ens.dk/en/our-services/projections-and-models/technology-data/technology-data-generation-electricity-and (accessed on 4 January 2024).
-
35.
Petroelektrosbyt. Electricity Tariffs in St. Petersburg. 2022. Available online: https://petroelektrosbyt.com/tarify/ (accessed on 3 January 2025).
-
36.
GPTEK. Committee on Tariffs and Price Policy of the Leningrad Region. 2021. Available online: https://www.gptek.spb.ru/upload/medialibrary/040/040252c7ad758b857aab11e6a11c3fb5.pdf (accessed on 7 May 2025).
-
37.
Ennova. Plant for Thermal Decontamination of Solid Municipal Waste Capacity at Least 700,000 Tons of MSW per Year (Russia, Moscow Region). PDF report. 2022.
-
38.
Lounavoima. Tietoa laitoksesta, Uudenaikainen ja vähäpäästöinen laitos tuottaa lämpöä koteihin. 2022. Available online: https://www.lounavoima.fi/laitos/ (accessed on 13 May 2022).
-
39.
Hulgaard T, Vehlow J. Incineration: process and technology. In Solid Waste Technology & Management, 2011, 1st ed.; Christensen T, Ed.; Wiley: Chichester, UK, 2010; pp. 363–392.
-
40.
World Bank. Russia Real Interest Rate. YCharts. 2021. Available online: https://ycharts.com/indicators/russia_real_interest_rate (accessed on 24 September 2024).
-
41.
AO DAR/VODGEO. Construction of a Complex for the Processing and Disposal of St. Petersburg Waste in the Lyubanskoye Forestry of the Tosnensky Municipal District of the Leningrad Region. Environmental Impact Assessment. 2010. Available online: http://www.infoeco.ru/assets/images/poligon/233-%D0%9E%D0%92%D0%9E%D0%A1.pdf (accessed on 20 January 2024).
-
42.
Klimchuk D. Composition of MSW. In Proceedings of the Ecology of the Big City, Saint Petersburg, Russia, 23–25 March 2021.
-
43.
Ghoreishi M, Happonen A. New promises AI brings into circular economy accelerated product design: A review on supporting literature.
E3S Web Conf. 2020,
158, 06002. doi:10.1051/e3sconf/202015806002.
[Google Scholar]
-
44.
Ghoreishi M, Happonen A, Pynnönen M. Exploring Industry 4.0 Technologies to Enhance Circularity in Textile Industry: Role of Internet of Things. In Proceedings of the Twenty-First International Working Seminar on Production Economics, Innsbruck, Austria, 24–28 February 2020; pp. 1–16. doi:10.5281/zenodo.3471421.
-
45.
Ghoreishi M, Happonen A. Key enablers for deploying artificial intelligence for circular economy embracing sustainable product design: Three case studies.
AIP Conf. Proc. 2020,
2233, 050008. doi:10.1063/5.0001339.
[Google Scholar]
-
46.
Fan J, Du Y, Siemon D, Happonen A. Designing a Modular University-Based Online Course Framework for Ethical and Efficient Utilization of Generative Artificial Intelligence. In Proceedings of the 58th Hawaii International Conference on System Sciences | 2025, Waikoloa Village, HI, USA, 7–10 January 2025, pp. 80–89. doi:10.24251/hicss.2025.011.
-
47.
Happonen A, Ghoreishi M. A mapping study of the current literature on digitalization and industry 4.0 technologies utilization for sustainability and circular economy in textile industries.
Lect. Notes Netw. Syst. 2022,
217, 697–711. doi:10.1007/978-981-16-2102-4_63.
[Google Scholar]
-
48.
Kärri T, Marttonen-Arola S, Kinnunen S, Ylä-Kujala A, Ali-Marttila M, Ari H, et al. Fleet-Based Industrial Data Symbiosis. In S4Fleet-Service Solutions for Fleet Management, DIMECC Publications Series No. 19, 06/2017, pp. 124–139. Available online: https://www.dimecc.com/wp-content/uploads/2019/06/DIMECC_FINAL_REPORT_19617_S4Fleet_ebook.pdf (accessed on 17 April 2025).
-
49.
Kinnunen S, Happonen A, Marttonen-Arola S, Kärri T. Traditional and extended fleets in literature and practice: definition and untapped potential.
Int. J. Strateg. Eng. Asse. Manag. 2019,
3, 239–261.
[Google Scholar]
-
50.
Happonen A, Minashkina D. State of the art preliminary literature review: Sustainability and waste reporting capabilities in management systems.
E3S Web Conf. 2020,
211, 03014. doi:10.1051/e3sconf/202021103014.
[Google Scholar]
-
51.
Vaddepalli K, Palacin V, Porras J, Happonen A. Taxonomy of Data Quality Metrics in Digital Citizen Science.
Lect. Notes Netw. Syst. 2023,
578, 391–410. doi:10.1007/978-981-19-7660-5_34.
[Google Scholar]
-
52.
Palacin V, Ginnane S, Ferrario MA, Happonen A, Wolff A, Piutunen S, et al. SENSEI: Harnessing Community Wisdom for Local Environmental Monitoring in Finland. In Proceedings of the CHI Conference on Human Factors in Computing Systems, Glagsgow, Scotland, UK, 4–9 May 2019; pp. 1–8. doi:10.1145/3290607.3299047.
-
53.
Palacin V, Gilbert S, Orchard S, Eaton A, Ferrario MA, Happonen A. Drivers of participation in digital citizen science: Case Studies on Järviwiki and safecast.
Citiz. Sci. Theory Pract. 2020,
5, 1–20.
[Google Scholar]
-
54.
Kortelainen H, Happonen A, Kinnunen S-K. Fleet service generation-challenges in corporate asset management. In Lecture Notes in Mechanical Engineering; Springer: Berlin, Germany, 2016; pp. 373–380. doi:10.1007/978-3-319-27064-7_35.
-
55.
Kortelainen H, Happonen A, Hanski J. From Asset Provider to Knowledge Company-Transformation in the Digital Era. In Lecture Notes in Mechanical Engineering; Springer International Publishing: Berlin, Germany, 2019; pp. 333–341. doi:10.1007/978-3-319-95711-1_33.
-
56.
Happonen A, Metso L, Hasheela-Mufeti V, Ali I. Electric Vehicle & Batteries Pre-Emptive Maintenance Service Support: Costs, Sustainability and Material Recycling Perspectives. In Proceedings of the International Conference on Electrical, Computer, Communications and Mechatronics Engineering (ICECCME 2024), Male, Maldives, 4–6 November 2024; pp. 1–7. doi:10.1109/ICECCME62383.2024.10796880.
-
57.
Wang Y, Ma H, Zeng W, Bu Q, Yang X. Influence of moisture content and inlet temperature on the incineration characteristics of municipal solid waste (MSW).
Appl. Ther. Eng. 2025,
258, 124677.
[Google Scholar]
-
58.
Ganguly A, Chattaraj M, Chattaraj S, Mitra D, Ganguly M, Kirtania DK, et al. Employing Technological Innovation for Eco-Friendly Waste Disposal at a Global Scale In AI Technologies for Enhancing Recycling Processes; Mitra D, Choudhury T, Madan A, Chattaraj S, Pellegrini M, Eds.; IGI Global Scientific Publishing: Hershey, PA, USA, 2025; pp. 135–152.
-
59.
Kilpeläinen M, Happonen A. Awareness adds to knowledge. stage of the art waste processing facilities and industrial waste treatment development.
Curr. Approaches Sci. Technol. Res. Vol. 2021,
4, 125–148.
[Google Scholar]
-
60.
Zaikova A, Deviatkin I, Havukainen J, Horttanainen M, Astrup TF, Saunila M, et al. Factors influencing household waste separation behavior: Cases of Russia and Finland.
Recycling 2022,
7, 52.
[Google Scholar]
-
61.
Kovaleva Y, Happonen A, Kindsiko E. Designing Gender-neutral Software Engineering Program. Stereotypes, Social Pressure, and Current Attitudes Based on Recent Studies. In Proceedings of the International Conference on Software Engineering, Workshop: GE2022, Pittsburgh, PA, USA, 20 May 2022; pp. 43–50. doi:10.1145/3524501.3527600.
-
62.
Kovaleva Y, Hyrynsalmi S, Saltan A, Happonen A, Kasurinen J. Becoming an entrepreneur: A study of factors with women from the tech sector.
Inf. Softw. Technol. 2023,
155, 107110.
[Google Scholar]
-
63.
Auvinen H, Santti U, Happonen A. Technologies for Reducing Emissions and Costs in Combined Heat and Power Production.
E3S Web Conf. 2020,
158, 03006. doi:10.1051/e3sconf/202015803006.
[Google Scholar]
-
64.
Abdelsalam A, Happonen A, Kärhä K, Kapitonov A, Porras J. Toward autonomous vehicles and machinery in mill yards of the forest industry: Technologies and proposals for autonomous vehicle operations.
IEEE Access 2022,
10, 88234–88250.
[Google Scholar]
-
65.
Trigeorgis L. Real Options: Managerial Flexibility and Strategy in Resource Allocation; MIT press: Cambridge, MA, USA, 1996.
-
66.
Happonen A, Minashkina D, Nolte A, Medina Angarita MA. Hackathons as a company—University collaboration tool to boost circularity innovations and digitalization enhanced sustainability.
AIP Conf. Proc. 2020,
2233, 050009. doi:10.1063/5.0001883.
[Google Scholar]
-
67.
Happonen A, Wolff A, Palacin V. From Data Literacy to Co-design Environmental Monitoring Innovations and Civic Action.
Lect. Notes Electr. Eng. 2022,
942, 408–418. doi:10.1007/978-981-19-2456-9_42.
[Google Scholar]
-
68.
Happonen A, Laplaza Osta I., Potdar A, García-Alcaraz JL. Financially Feasible and Sustainable-Reviewing Academic Literature on Sustainability Related Investment Studies, 1st ed.; Book Publisher International: Hong Kong, China, 2021; pp. 1–43. doi:10.9734/bpi/mono/978-93-5547-032-4.
-
69.
Santti U, Happonen A, Auvinen H. Digitalization Boosted Recycling: Gamification as an Inspiration for Young Adults to do Enhanced Waste Sorting.
AIP Conf. Proc. 2020,
2233, 050014. doi:10.1063/5.0001547.
[Google Scholar]
-
70.
Ghoreishi M, Happonen A. The Case of Fabric and Textile Industry: The Emerging Role of Digitalization, Internet-of-Things and Industry 4.0 for Circularity.
Lect. Notes Netw. Syst. 2022,
216, 189–200. doi:10.1007/978-981-16-1781-2_18.
[Google Scholar]
-
71.
Johnson MAM, Phang SK, Wong WR, Happonen A. A Novel Quad-Core Double-Steel Optical Fiber Solution for Landslide.
IEEE Access 2025,
13, 55416–55430. doi:10.1109/ACCESS.2025.3555734.
[Google Scholar]
-
72.
Cerqueira CQ, Lora EES, de Souza LLP, Leme MMV, Barros RM, Venturini OJ. Life Cycle Assessment of Methanol Production from Municipal Solid Waste: Environmental Comparison with Landfilling and Incineration.
Resources 2025,
14, 12.
[Google Scholar]
-
73.
Domingo-Morcillo E, Escrig-Olmedo E, Rivera-Lirio JM, Muñoz-Torres MJ. Analyzing the suitability of LCIA methods to foster the most beneficial food loss and waste prevention action in terms of environmental sustainability.
Environ. Impact Assess. Rev. 2024,
107, 107575.
[Google Scholar]
-
74.
Birkmaier A, Imeri A, Reiner G. Improving supply chain planning for perishable food: Data-driven implications for waste prevention.
J. Bus. Econ. 2024,
94, 1–36.
[Google Scholar]
-
75.
Dehkordi MM, Nodeh ZP, Dehkordi KS, Khorjestan RR, Ghaffarzadeh M. Soil, air, and water pollution from mining and industrial activities: Sources of pollution, environmental impacts, and prevention and control methods.
Results Eng. 2024,
23, 102729.
[Google Scholar]
-
76.
Ferriz-Papi JA, Lee A, Alhawamdeh M. Examining the challenges for circular economy implementation in construction and demolition waste management: A comprehensive review using systematic methods.
Buildings 2024,
14, 1237.
[Google Scholar]
-
77.
Oroski FDA. Understanding food surplus: Challenges and strategies for reducing food waste–A mini-review.
Waste Manag. Res. 2025, 0734242X251320878. doi:10.1177/0734242X251320878.
[Google Scholar]
-
78.
Marimuthu S, Saikumar A, Badwaik LS. Food losses and wastage within food supply chain: A critical review of its generation, impact, and conversion techniques.
Waste Dispos. Sustain. Energy 2024,
6, 661–676.
[Google Scholar]
-
79.
Widiwati ITB, Liman SD, Nurprihatin F. The implementation of Lean Six Sigma approach to minimize waste at a food manufacturing industry.
J. Eng. Res. 2024,
13, 611–626. doi:10.1016/j.jer.2024.01.022.
[Google Scholar]
-
80.
Dimitrova K. Waste Reduction–A Factor for Intelligent and Sustainable Growth and Higher Competitiveness.
Int. Sci. J. Inn. 2024,
10, 10–13.
[Google Scholar]
-
81.
Febijanto I, Steven S, Nadirah N, Bahua H, Shoiful A, Dian PD, et al. Municipal Solid Waste (MSW) Reduction through Incineration for Electricity Purposes and Its Environmental Performance: A Case Study in Bantargebang, West Java, Indonesia; Kyushu University: Fukuoka, Japan, 2024.
-
82.
Tamasiga P, Ouassou EH, Onyeaka H, Bakwena M, Happonen A, Molala M. Forecasting disruptions in global food value chains to tackle food insecurity: The role of AI and big data analytics–A bibliometric and scientometric analysis.
J. Agric. Food Res. 2023,
14, 100819.
[Google Scholar]
-
83.
Oubrahim I, Sefiani N, Happonen A. The influence of digital transformation and supply chain integration on overall sustainable supply chain performance: An empirical analysis from manufacturing companies in Morocco.
Energies 2023,
16, 1004.
[Google Scholar]
-
84.
García Alcaraz JL, Díaz Reza JR, Arredondo Soto KC, Hernández Escobedo G, Happonen A, Puig I Vidal R, et al. Effect of green supply chain management practices on environmental performance: Case of Mexican manufacturing companies.
Mathematics 2022,
10, 1877.
[Google Scholar]
-
85.
Minashkina D, Happonen A. Decarbonizing warehousing activities through digitalization and automatization with WMS integration for sustainability supporting operations.
E3S Web Conf. 2020,
158, 03002. doi:10.1051/e3sconf/202015803002.
[Google Scholar]
-
86.
Minashkina D, Happonen A. Warehouse management systems for social and environmental sustainability: A systematic literature review and bibliometric analysis.
Logistics 2023,
7, 40.
[Google Scholar]
-
87.
Palacin-Silva M, Khakurel J, Happonen A, Hynninen T, Porras J. Infusing Design Thinking Into a Software Engineering Capstone Course. In Proceedings of the 30th IEEE Conference on Software Engineering Education and Training (CSEE&T), Savannah, GA, USA, 7–9 November 2017; pp. 212–221. doi:10.1109/CSEET.2017.41.
-
88.
Edo-Alcón N, Gallardo A, Colomer-Mendoza FJ, Lobo A. Efficiency of biological and mechanical-biological treatment plants for MSW: The case of Spain.
Heliyon 2024,
10, e26353.
[Google Scholar]
-
89.
Sarker T, Ethen D, Asha H, Islam S, Ali MR. Transformation of municipal solid waste to biofuel and bio-chemicals–A review.
Int. J. Environ. Sci. Technol. 2025,
22, 3811–3832.
[Google Scholar]
-
90.
Eskelinen T, Räsänen T, Santti U, Happonen A, Kajanus M. Designing a business model for environmental monitoring services using fast MCDS innovation support tools.
Technol. Innov. Manag. Rev. 2017,
7, 36–46.
[Google Scholar]
-
91.
Muda NRS. Design and Build Plastic Waste Processing Robots in Indonesia to Support Sustainable Environmental Management.
Int. J. IJNRSM 2024,
4, 200–209.
[Google Scholar]
-
92.
Ylä-Kujala A, Kedziora D, Metso L, Kärri T, Happonen A, Piotrowicz W. Robotic process automation deployments: a step-by-step method to investment appraisal.
Bus. Proc. Manag. J. 2023,
29, 163–187.
[Google Scholar]
-
93.
Sosunova I, Happonen A, Wolff A, Porras J. Towards a Smarter Waste Management: Developing and Evaluating a Smart Waste Management Decision Support Framework.
Int. J. Soc. Ecol. Sustain. Dev. 2024,
15, 1–36.
[Google Scholar]
-
94.
Tereshchenko E, Happonen A, Porras J, Vaithilingam CA. Green growth, waste management, and environmental impact reduction success cases from small and medium enterprises context: A systematic mapping study.
IEEE Access 2023,
11, 56900–56920.
[Google Scholar]
-
95.
Tereshchenko E, Salmela E, Melkko E, Phang SK, Happonen A. Emerging best strategies and capabilities for university–industry cooperation: opportunities for MSMEs and universities to improve collaboration. A literature review 2000–2023.
J. Innov. Entr. 2024,
13, 28.
[Google Scholar]
-
96.
Happonen A, Santti U, Auvinen H, Räsänen T, Eskelinen T. Digital age business model innovation for sustainability in University Industry Collaboration Model.
E3S Web Conf. 2020,
211, 04005. doi:10.1051/e3sconf/202021104005.
[Google Scholar]
-
97.
Tereshchenko E, Phang SK, Alcaraz JLG, Happonen A. Practice-Based Views on Key Success Elements in University-Industry Collaborative Activities.
Int. J. Knowl. Manag. 2024,
20, 1–25.
[Google Scholar]
-
98.
Sosunova I, Hasheela V, Happonen A. Novel Creative Technologies Decision Support System for Small and Medium Enterprises: Exploring the Potential, Current Findings and Future Research Consideration. In Proceedings of the 2024 IEEE International Conference on Systems, Man, and Cybernetics (SMC), Kuching, Malaysia, 6–10 October 2024; pp. 4901–4907. doi:10.1109/SMC54092.2024.10831174.
-
99.
Usmani UA, Happonen A, Watada J. The Digital Age: Exploring the Intersection of AI/CI and Human Cognition and Social Interactions.
Proc. Comput. Sci. 2024,
239, 1044–1052.
[Google Scholar]
-
100.
Kumar R, Gupta G, Hussain A, Rani A, Thapliyal A, Gunsola D, et al. Pioneering zero-waste technologies utilization and its framework on sustainable management: International, national and state level.
Discov. Appl. Sci. 2025,
7, 224.
[Google Scholar]
-
101.
Nad S, Konar U, Chattaraj S, Ganguly A. Valorization of Feather Waste by Microbial Enzymatic Activity: Bioconversion, Production and Application. In Agro-Waste to Microbe Assisted Value Added Product: Challenges and Future Prospects. Environmental Science and Engineering; Saha SP, Mazumdar D, Roy S, Mathur P, Eds.; Springer: Cham, Switzerland, 2024. doi:10.1007/978-3-031-58025-3_15.