
Soluble Oligomerization Is Involved in Fluorescence of Citrate-Copper Complexes

Soluble Oligomerization Is Involved in Fluorescence of Citrate-Copper Complexes
Jianshu Dong 1,2,3,4,5,6,* Cong Han 7 Jian Li 8 Xinli Ma 8 Piaopiao Zhu 1,2,3,4,5
Received: 05 February 2026 Revised: 18 March 2026 Accepted: 18 June 2026 Published: 07 July 2026

© 2026 The authors. This is an open access article under the Creative Commons Attribution 4.0 International License (https://creativecommons.org/licenses/by/4.0/).
Graphical Abstract
1. Introduction
Copper ion is a physiologically important metal ion, and the need for biological detection and monitoring is constantly there [1,2,3,4,5,6,7,8]. On one hand, copper (Cu) is an essential trace metal that plays critical roles in various biological processes, including oxidative metabolism (in like cytochrome c oxidase) [9], neurotransmitter synthesis, ion homeostasis, connective tissue formation, and in the antioxidant defense system enzymes like superoxide dismutase (SOD) [10,11]. To maintain optimal cellular function, organisms have evolved tightly regulated copper trafficking and storage mechanisms [10]. On the other hand, disruptions in copper homeostasis are implicated in numerous pathological conditions. For example, elevated copper levels have been linked to neurodegenerative disorders such as Alzheimer’s disease and Parkinson’s disease [12], where copper-mediated oxidative stress contributes to neuronal damage. Conversely, copper deficiency can lead to hematological disorders [13], impaired neurodevelopment, and connective tissue abnormalities [14,15,16]. Short term symptoms of Cu deficiency include fragile hair; depigmentation of the skin; muscle weakness (myeloneuropathy); neurologic abnormalities (ataxia, neuropathy); hepatosplenomegaly; osteoporosis; anemia (usually normocytic; sometimes macrocytic and occasionally with microcytic cells) [17], neutropenia, and rarely thrombocytopenia [18].
Given the narrow concentration range at which copper is beneficial versus deleterious, sensitive, specific, and biocompatible precise detection and monitoring of Cu2+ ions in biological matrices is vital [3,5,11,19,20,21]. Reliable quantification of Cu levels in tissues, blood serum, or even at the subcellular level can guide the diagnosis of copper-related diseases, monitor disease progression, and evaluate therapeutic [5,22,23]. Consequently, the development of sensitive, selective, and biocompatible probes and assays for copper ion detection and downstream elimination remains a key focus in water treatment, bioanalytical chemistry, and medicine [8,24,25,26].
A variety of analytical methods have been developed to detect and quantify copper ions in biological and environmental samples. Traditional techniques such as atomic absorption spectroscopy (AAS), inductively coupled plasma mass spectrometry (ICP-MS), X-ray Absorption Spectroscopy (XAS), NMR, and electrochemical assays have provided foundational platforms [27,28,29,30,31,32,33]. However, these methods often require complex sample preparation and expensive instrumentation and are not always amenable to real-time or in situ measurements. Advances in polymeric nanomaterials [4,34], DNAzyme-based sensors [35], and FRET-based (Förster Resonance Energy Transfer) probes have expanded the toolkit available for copper detection [36,37].
Small-molecule-based probes and sensors, particularly those that use fluorescence or colorimetric changes upon binding metal ions, including Cu2+ ions, have gained significant attention for their simplicity, rapid response, and high sensitivity [7,38,39]. The detection, examination, and binding of copper ions by using small molecules are an important issue, both theoretically and practically. Generally, the metal probes were divided into two types, binding- and activity-based fluorescence probes. Common fluorophore scaffolds include 1,8-naphthalimide, 4,4-difluoro-4-bora-3a,4a diaza-s-indacene (BODIPY), cyanine, coumarin [40], fluorescein, Serotonin [25] and rhodamine derivatives, etc. [2,6,22,41]. Meanwhile, the identification process by using fluorescence probes involves various principles such as intramolecular charge transfer (ICT), twisted intramolecular charge transfer (TICT), photoinduced electron transfer (PET), aggregation-induced emission (AIE), excited state intramolecular proton transfer (ESIPT), or fluorescence resonance energy transfer (FRET) [42]. Some of those fluorescent probes are difficult to synthesize, some are not human body friendly, and may be difficult for excretion [2,6,22,43].
Citrate is a tricarboxylate anion, a sort of nutrient naturally present in certain fruits, certainly human body friendly, and can be a kind of chelating agent. Citrate can bind to metal ions, including copper ions (Cu2+, cupric ion), to form stable complexes [27,30,31,44,45,46], which is clinically applied in the formulation of a medicine cuprocitrol. This chelation prevents metal precipitation, and stabilizes its ionic form in solution [46,47]. Although interaction between Cupric ion and citrate and their crystals has been studied before, the fluorescence and molecular mechanism of soluble citrate-copper complex remain elusive. Here, this study examined the fluorescence of soluble citrate-copper complex, which laid the foundation for Cu2+ ion detection in vitro or in vivo, stabilization, excretion, and elimination by using citrate.
2. Results and Discussion
2.1. Fluorescence of Citrate-Cu2+ (Cupric Citrate) Complex
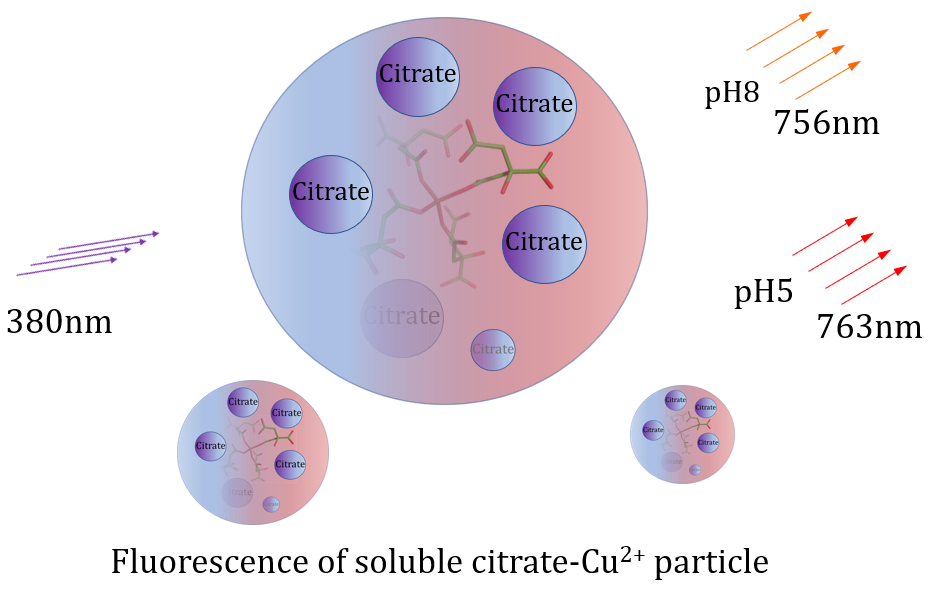
Fluorescence of citrate-Cu2+ (Cupric citrate) complex in aqueous solution was observed at two different pHs, pH5 and pH8, Figure 1. Citrate sodium aqueous solution by itself has weak fluorescence at pH5, pH7, and pH8, and this weak fluorescence was not affected by the presence of EDTA, Figure S1. And the presence of an appropriate amount of Cu2+ ion increased the fluorescence significantly, about eighth fold in intensity, Figure 1. The fluorescence quantum yield Q increased from ∼0.000046 to ∼0.0039 (pH5), from ∼0.000074 to ∼0.0067 (pH8). It must be noted that the final concentration of Cu2+ ion required for the generation of strong fluorescent citrate-Cu2+ complex was different at pH5 and pH8, being 1.2 mM and 8.3 μM, respectively. And the fluorescence peak was at ∼763 nm and ∼756–758 nm for pH5 and pH8, respectively. This relatively strong fluorescence of citrate-Cu2+ complex was depressed by the presence of EDTA. The final concentration of the samples here, if present, were 50 mM citrate and 50 mM citrate plus 5 mM EDTA. Therefore, this observation indicates a kind of chelation-enhanced fluorescence.
Both citrate-Cu2+ complex and free citrate showed fluorescence. This meant that a fraction of citrate ions in aqueous solution was in a structure and state with electrons distributed in a way that was probably partially conjugated. And the presence of copper ion probably stabilized and promoted the conjugation system, thus enhancing fluorescence. Although different in fluorescence intensity at the same citrate concentrations, the emission wavelength was virtually the same for most Cu2+ present and absent samples at both pHs (∼761–762 nm), Figure 1 and Figure S1. Only when fluorescence was strongly enhanced by different specific Cu2+ concentrations at two pHs, did the fluorescence emission peak wavelength value seem to diverge more greatly (∼763 nm and ∼756–758 nm at pH5 and pH8, respectively).
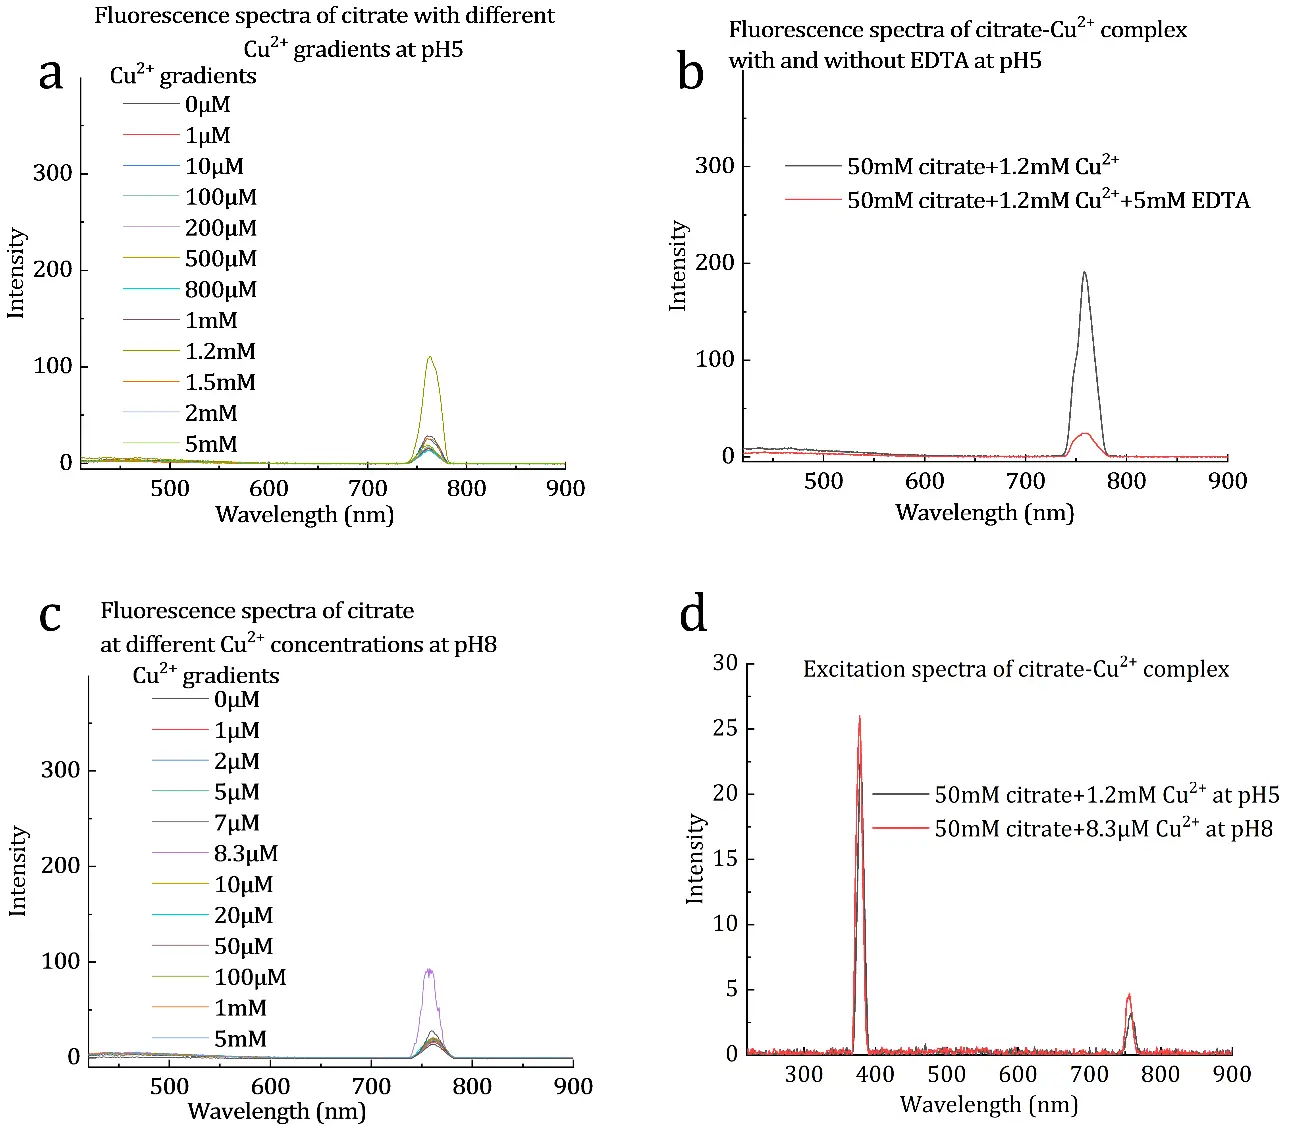
Figure 1. Light Spectrometry of citrate-Cu2+ complex. (a) Fluorescence spectra of citrate-Cu2+ complexes in aqueous solution at pH5. (b) This relatively strong fluorescence was depressed by the presence of EDTA in aqueous solution at pH5. The two samples were 50 mM citrate, pH5, with 1.2 mM Cu2+, and 50 mM citrate, pH5, with 1.2 mM Cu2+ plus 5 mM EDTA of pH5. The fluorescence of citrate-Cu2+-EDTA mixture was at a level similar to that of free citrate, or free citrate plus EDTA, as shown in Figure S1. (c) Fluorescence spectra of citrate-Cu2+ complexes in aqueous solution at pH8. (d) Excitation spectra of citrate-Cu2+ complex. For both pH5 and pH8, the concentration of citrate is 50 mM.
2.2. Fluorescent Citrate-Cu2+ Species Exhibited Distinct Soluble Oligomerization State
To further characterize citrate-Cu2+ complex, particle sizes of samples in aqueous solution were tested at different conditions by using Malvern Panalytical Zetasizer Pro instrument. The particle size of the fluorescent citrate-Cu2+ species, as obtained from dynamic light scattering, was different from that of the citrate-Cu2+ solutions at other ratios; although the particle sizes of the most fluorescent citrate-Cu2+ species at pH5 (Figure 2a) and pH8 (Figure 2b) were not the same either.
The ∼0.2∼0.3 μm particle was probably responsible for the fluorescence of citrate-Cu2+ complexes at pH5 (50 mM citrate with 1.2 mM Cu2+), in the homogeneous solution. Homogeneous complex formed between citrate and Cu2+, as suggested by the regression analysis and curve fitting of the dynamic light scattering result of the complex; there is a good fit between the simulated curve (∼258 nm) and experimental data (Figure S2). And this soluble homogeneously distributed ∼0.2∼0.3 μm particle was the major component detected in the aqueous solution (Figure 2 and Figure S2). The absorption spectra of citrate with various Cu2+ concentrations in aqueous solution were also examined at pH5, pH7, and pH8, Figure S3, which were in agreement with published results.
The core of the fluorescent citrate-Cu2+ complex particle was proposed, Figure S4. Although it’s possible that the hydroxyl group of citrate might be involved in coordination with metal ions, as found in citrate-Ni2+ complex crystal and citrate-Fe2+ complex crystals [48], Figure S4a,b; it’s more likely that the Cu2+ ion was chelated by the carboxylate group of citrate, Figure S4c,d, considering the ratio and characteristics of the interaction.
Charges and polarities affected the formation of fluorescent citrate-Cu2+ complex species, which supported the proposed chelation profile, Figure S4c,d. As the deprotonated carboxylate group was more likely to attract Cu2+ ions based on electrostatic interaction [49], it’s very likely that the depression of deprotonation of citrate might affect the interaction between citrate and Cu2+ ion and thus the formation of fluorescent citrate-Cu2+ complex core. Indeed, with the increase of pH, the required amount of Cu2+ ion decreased to obtain the brightly fluorescent citrate-Cu2+ complex species. Additionally, the presence of ethanol in citrate aqueous solutions disrupted the emergence of sharply elevated fluorescence at any concentration of Cu2+ ions in all the about a hundred samples tested, Figure S5 and Figure S6. Therefore, the polarity of the solutes in the solution system and the protonation and/or dehydration of citrate affected the formation of strongly fluorescent citrate-Cu2+ complex species. So, the strongly fluorescent citrate-Cu2+ species was probably a weakly associated soluble particle originated from citrate oligomers. The coordination of the core of the fluorescent citrate-Cu2+ particle was strongly dependent on the charges of citrate, and the polarity features of the solutes might affect the propagation of the core into the large fluorescent particle.
This observation suggested that citrate could not only be used to detect the presence of Cu2+ ion, to solubilize, stabilize, separate, and isolate Cu2+ ion from aqueous solutions, it may be used for the quantification of Cu2+ ions at certain conditions as well. Citrate has been used to chelate Cu2+ ion and remove it from aqueous solutions through ultrafilter membrane [50,51,52,53], and here, the detailed mechanism behind this separation based on size difference was explicitly indicated. Here, it’s quite clear that the soluble particle size of citrate-Cu2+ complex depends critically on the ratio between these two components. And therefore, the use of citrate for the coordination and elimination of Cu2+ ion can be better tuned for purification and excretion purposes.
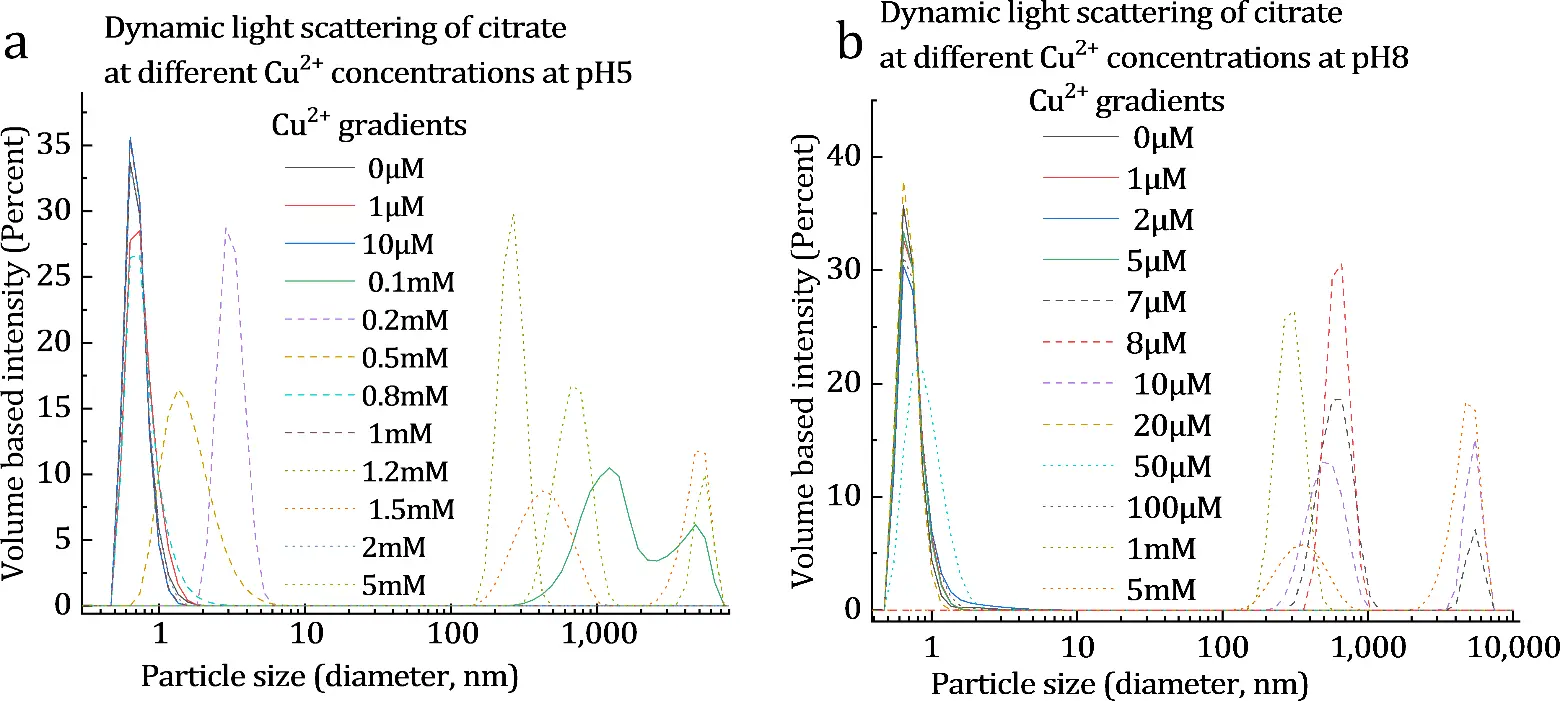
Figure 2. Particle size of free citrate and citrate-Cu2+ complexes. The particle size as obtained from dynamic light scattering, of the strong fluorescent citrate-Cu2+ species formed was different from that of the citrate-Cu2+ solutions observed at other ratios, at both pH5 (a) and pH8 (b).
3. Experimental Procedures, Materials and Methods
UV-Vis spectroscopy, fluorescence spectroscopy, and particle size analysis were employed to study the influence of varying copper ion concentrations and pH on the citrate solution system’s optical properties and nanostructure.
3.1. Light Spectrophotometry (Fluorescence Spectrometry and UV-Vis Spectrometry) of Citrate-Cu2+ Solution
Fluorescence spectrometry was tested by using an RF-5301PC fluorescence spectrometer from the Shimadzu company (Kyoto, Japan). UV-Vis spectrometry was tested by using a UV-2600 UV-Vis spectrophotometer from Shimadzu (Kyoto, Japan). Fluorescence spectrometry was collected by using LabSolutions RF software (V2.04). UV-Vis spectra were collected using Shimadzu LabSolutions UV-Vis software (UV Prob v2.70). Light spectrometry was carried out at ambient temperature.
3.1.1. UV-Vis Light Spectrometry
UV-Vis absorption spectra of citrate-copper complex at various conditions were tested by using a buffer system of 50 mM sodium citrate (pH 5, 7, 8), 0.15 M NaCl, with copper ion gradient of 0 μM, 1 μM, 10 μM, 100 μM, 1 mM, 10 mM. The final concentration of sodium citrate in the system was 50 mM. The scanning range was set to 200–800 nm. The corresponding empty buffer (without copper) was used as a reference, respectively, Table S1.
3.1.2. Fluorescence Spectrometry
For fluorescence spectrometry of sodium citrate at various copper ion concentrations, the slit width was set to EX: 10 nm, and EM: 5 nm. The excitation wavelength was set to 380 nm, and the scanning speed was set to slow. The fluorescence spectrometry of citrate-copper complex was examined at two different pHs, pH5 and pH8. The aqueous buffer solution used for fluorescence at pH 5 was 50 mM citrate pH5, 0.15 M NaCl with copper ion gradients of: 0 μM, 1 μM, 10 μM, 100 μM, 200 μM, 800 μM, 1.0 mM, 1.2 mM, 1.5 mM, 2.0 mM, 5.0 mM; The aqueous buffer solution used for fluorescence at pH 8 was 50 mM citrate pH8, 0.15 M NaCl with copper ion gradients of: 0 μM, 1 μM, 2 μM, 5 μM, 7 μM, 8.3 μM, 10 μM, 20 μM, 50 μM, 100 μM, 1.0 mM, 5.0 mM. Table S2. And then fluorescence spectra of citrate aqueous solutions in the presence of 10 mM Cu2+ ions, Figure S7.
To verify the specific role of copper ions, and to confirm the specificity of copper ions, pH-matched EDTA (5 mM final concentration, if present) was introduced into the sodium citrate-copper solution (pH 5.0/7.0/8.0), and fluorescence spectra were recorded. The detailed experimental methodology is outlined below. To obtain the excitation spectra, the most fluorescent citrate-copper samples were selected (with copper ion concentration listed as follows, pH 5.0, 1.2 mM; pH 8.0, 8.3 μM). The excitation spectra were obtained via setting the examined characteristic emission wavelength at 758 nm (pH 5.0), and 756 nm (pH 8.0), respectively. The excitation wavelength was found to be mainly at 380 nm. These samples were selected, citrate solution without copper ion sample (0 μM) and the two most fluorescent citrate-copper samples (pH 5.0, 1.2 mM; pH 8.0, 8.3 μM), for the addition of pH-matched EDTA (final concentration 5 mM). Then, the fluorescence spectroscopy was performed, and EDTA significantly decreased the fluorescence of these two citrate-copper samples (pH 5.0, 1.2 mM; pH 8.0, 8.3 μM). For citrate solution without copper ion samples (0 μM), the addition of EDTA did not extinguish the fluorescence, in fact with little change, Figure S1.
3.2. Solvated Particle Size Examination
Particle sizes of samples in aqueous solution were tested at different conditions by using the Malvern Panalytical Zetasizer Pro instrument (Malvern Panalytical Ltd., Grovewood Road, Enigma Business Park, Malvern, Worcestershire, WR14 1XZ, UK). The sample volume was about 1 mL. The software used for data collection was ZS XPLORER–4.2.0.
Prepare solution systems with a final concentration of sodium citrate of 50 mM (pH 5.0, or 8.0) in 0.15 M NaCl, with a final concentration gradient of copper sulfate (0–5 mM). After equilibration at 4 °C, 1 mL of the sample (with 50 mM sodium citrate, pH 5.0 or pH 8.0 and copper ion gradient in 0.15 M NaCl) was analyzed at ambient pressure, with ultrapure water as the reference. Measurements were conducted in ascending order of copper ion concentration, sequentially assessing the pH 5.0 groups (0 μM, 1 μM, 10 μM, 100 μM, 200 μM, 500 μM, 800 μM, 1.0 mM, 1.2 mM, 1.5 mM, 2.0 mM, 5.0 mM) and then the pH 8.0 groups (0 μM, 1 μM, 2 μM, 5 μM, 7 μM, 8 μM, 10 μM, 20 μM, 50 μM, 100 μM, 1.0 mM, 5.0 mM). The dynamic light scattering experiment was carried out in batch runs, and the sample chamber temperature was set at 4 °C. Table S3.
3.3. Fluorescence Spectrum of Sodium Citrate-Copper-Ethanol System
Fluorescence spectrometry was employed to investigate the effect of varying concentrations of copper ion (Cu2+) and ethanol (EtOH) on the fluorescence characteristics of citrate. Sometimes, ethanol decreases the solubility of metal ions in aqueous solution and promotes the interaction with ligands [54,55,56,57,58,59,60]. Prepare solutions with sodium citrate at a final concentration of 50 mM in 0.15 M NaCl system. Different concentration gradients of ethanol (1%, 2%, 5%, 10%, 20% w/v) and copper ions were established, and tests were conducted under two pH conditions (pH 5.0 and pH 8.0).
Fluorescence spectrometry was tested by using an RF-5301PC fluorescence spectrometer from the Shimadzu company (Kyoto, Japan). Fluorescence spectrometry was collected by using LabSolutions RF software (V2.04). Light spectrometry was carried out at ambient temperature.
For fluorescence spectrometry of sodium citrate at various copper ion concentrations, the slit width was set to EX: 10 nm, and EM: 5 nm. The excitation wavelength was set to 380 nm, and the scanning speed was set to fast. The aqueous solution used for fluorescence was 50 mM sodium citrate, 0.15 M NaCl and different concentration gradients of ethanol (1%, 2%, 5%, 10%, 20% w/v). The Cu2+ ion gradient at pH 5.0 was set as follows, 0 μM, 1 μM, 10 μM, 100 μM, 200 μM, 500 μM, 800 μM, 1.0 mM, 1.2 mM, 1.5 mM, 2.0 mM, 5.0 mM; The Cu2+ ion gradient at pH 8 was set as follows, 0 μM, 1 μM, 2 μM, 5 μM, 7 μM, 8 μM, 10 μM, 20 μM, 50 μM, 100 μM, 1.0 mM, 5.0 mM.
3.4. Examination of Fluorescence Quantum Yield
A reference fluorescent protein with known quantum yield (mRuby, QY = 0.35), was chosen as a quantum yield standard to calibrate the quantum yield of Sodium citrate and copper complex under two pH conditions (pH 5 and pH 8).
Using a fluorescence spectrophotometer, the fluorescence emission spectra of both the target sample (Sodium citrate and copper) and reference protein (mRuby) were recorded with identical parameters (slit widths: excitation 10 nm, emission 5 nm; scan range covering the full emission peak of the target sample: 220–900 nm). Peak areas of the two most fluorescent samples were obtained through integration by using Origin software (Origin Student Version/Learning Edition, version number Origin2021, denoted as FSodium citrate and copper and FR). It was found that FSodium citrate and copper ≈ 3858 (pH5), FSodium citrate and copper ≈ 1769 (pH8), FmRuby ≈ 21,302. Data Processing and Quantum Yield Calculation was based on the function below,
| ```latex\mathrm{\Phi_{\text{sodium citrate and copper}} = \Phi_R \times \left(F_{\text{sodium citrate and copper}}/F_R\right) \times \left(A_R/A_{\text{sodium citrate and copper}}\right) \times \left({n^2}_{\text{sodium citrate and copper}}/{n^2}_R\right)}``` |
The quantum yield of the sample is obtained by using the reference protein’s quantum yield (ΦR) and the ratio of their absorbance at the excitation wavelength and the integrated emission peak areas. The absorbance at the excitation wavelength and the emission peak area for both the sample and reference protein are used to determine the quantum yield of the sample relative to the reference. FSodium citrate and copper/FmRuby = 0.18115 (pH5), FSodium citrate and copper/FmRuby = 0.08308 (pH8), AmRuby/ASodium citrate and copper = 0.06122 (pH5), AmRuby/ASodium citrate and copper = 0.23077 (pH8), then the intensified fluorescence QSodium citrate and copper ≈ 0.0039 (pH5), QSodium citrate and copper ≈ 0.0067 (pH8). And the fluorescence Q ≈ 0.000046 (pH5, 10 mM Cu2+), Q ≈ 0.000074 (pH8, 10 mM Cu2+).
Fluorescence spectrometry was tested by using an RF-5301PC fluorescence spectrometer from the Shimadzu company (Kyoto, Japan). Fluorescence spectrometry was collected by using LabSolutions RF software (V2.04). Light spectrometry was carried out at ambient temperature. Performed by Piaopiao Zhu in 2025.
Chemical reagents used in this work are summarized below. Sodium citrate, West Asia Chemical Co., Ltd. (Xiya reagent, Qingdao, China), Lot number, Y28617. Copper Sulfate, Tianjin Damao Chemical Reagent Factory (Tianjin, China), Lot number, 20210504. Ethylenediaminetetraacetic Acid Disodium Salt (EDTA-2Na), West Asia Chemical Co., Ltd. (Xiya reagent, Shandong, China), Lot number, B3127. Ethanol, Tianjin Zhiyuan Chemical Reagent Co, Ltd. (Tianjin, China), Lot number, 20241201.
Supplementary Materials
The following supporting information can be found at: https://www.sciepublish.com/article/pii/1104, Figure S1: Citrate sodium aqueous solution by itself has weak fluorescence, Figure 1, and this weak fluorescence was not affected by the presence of EDTA. Experimental conditions, 50 mM citrate at pH5, pH7, and pH8, plus 5 mM pH matched EDTA. This spectrophotometry was performed in the same batch run with that of Figure 1. For free citrate (50 mM), it was shown in Figure 1a,c. Figure S2: Dynamic light scattering result of the citrate-Cu2+ complex, the regression analysis and curve fitting showed good fit between the simulated curve and experimental data, which suggested homogeneous composition in the examined sample. Figure S3: Absorption spectra of citrate-Cu2+ complexes in aqueous solution at pH5, pH7, and pH8. Figure S4: The proposed core of the citrate-Cu2+ particle. Figure S5: The fluorescence spectra of citrate aqueous solutions in the presence of ethanol at various concentrations of Cu2+ ions. Figure S6: The fluorescence spectra of citrate aqueous solutions in the presence of ethanol at various concentrations of Cu2+ ions. Figure S7: The fluorescence spectra of citrate aqueous solutions in the presence of 10 mM Cu2+ ions. Table S1: SUV-Vis spectra of copper at various concentrations in sodium citrate. Table S2. Fluorescence spectra of copper at various concentrations in sodium citrate. Table S3. Dynamic light scattering of citrate at different.
Statement of the Use of Generative AI and AI-Assisted Technologies in the Writing Process
During the preparation of this manuscript, the authors used DeepSeek-V3.1 and bohrium AI4S in order to summarize the biological role of copper, to summarize analytical methods to detect and quantify copper ions in samples, to summarize copper probes and sensors, and to collect related references. After using these tools/services, the authors reviewed and edited the content as needed and take full responsibility for the content of the published article.
Acknowledgments
This project was supported by National Natural Science Foundation of China (grant number 31900913) to J.D., and the Key Scientific Research Program for Universities of Higher Education in Henan Province, grant number, 24A350017. Thanks to the help from other members of the group who have assisted with this project. Thanks to all those who have helped with this project. The assistance of the TTP Labtech Mosquito Crystal machine of Zhengzhou university, with asset number 1735810S, is acknowledged here, if it’s applicable. Thanks to the support from centre of advanced analysis and gene sequencing of Zhengzhou university. Thanks to the support from the National Supercomputing Centre in Zhengzhou. Thanks to the support from the Postgraduate Education Reform Research Project of Zhengzhou university in 2025 (grant number YJSJY2025156).
Author Contributions
J.D. designed and supervised the project. J.D. designed and P.Z. carried out UV-vis & fluorescence spectroscopy characterization. J.D. wrote and revised the manuscript, C.H, J.L, X.M and P.Z. commented on the manuscript. All authors discussed and agreed on all major versions, including the published version, of the manuscript.
Ethics Statement
Not applicable.
Informed Consent Statement
Not applicable.
Data Availability Statement
All data supporting the findings of this study are available within the paper or its Supplementary Materials, and are also available from the authors upon reasonable request. Newly created materials are available from the authors upon reasonable request. Correspondence and requests for materials etc. should be addressed to J.D.
Funding
This research was funded by National Natural Science Foundation of China, grant number 31900913, and the Key Scientific Research Program for Universities of Higher Education in Henan Province, grant number, 24A350017.
Declaration of Competing Interest
The authors declare that they have no known competing financial interests or personal relationships that could have appeared to influence the work reported in this paper.
References
- Wang Y, Wu M, Yu S, Jiang C. Semi-quantitative and visual assay of copper ions by fluorescent test paper constructed with dual-emission carbon dots. RSC Adv. 2018, 8, 12708–12713. DOI:10.1039/C8RA00917A [Google Scholar]
- Li L, Wang J, Xu S, Li C, Dong B. Recent Progress in Fluorescent Probes for Metal Ion Detection. Front. Chem. 2022, 10, 875241. DOI:10.3389/fchem.2022.875241 [Google Scholar]
- Ramdass A, Sathish V, Babu E, Velayudham M, Thanasekaran P, Rajagopal S. Recent developments on optical and electrochemical sensing of copper(II) ion based on transition metal complexes. Coord. Chem. Rev. 2017, 343, 278–307. DOI:10.1016/j.ccr.2017.06.002 [Google Scholar]
- Alghamdi SA, Fagieh TM, Bakhsh EM, Akhtar K, Khan SB, Bahaidarah EA. Efficient sensor based on CeCo3O6 nanocomposite for the electrochemical detection of cadmium and copper ions. Phys. E Low-Dimens. Syst. Nanostructures 2024, 159, 115913. DOI:10.1016/j.physe.2024.115913 [Google Scholar]
- Zheng X, Cheng W, Ji C, Zhang J, Yin M. Detection of metal ions in biological systems: A review. Rev. Anal. Chem. 2020, 39, 231–246. DOI:10.1515/revac-2020-0118 [Google Scholar]
- Gerdan Z, Saylan Y, Denizli A. Recent Advances of Optical Sensors for Copper Ion Detection. Micromachines 2022, 13, 1298. DOI:10.3390/mi13081298 [Google Scholar]
- Geetha M, Sadasivuni KK, Al-Ejji M, Sivadas N, Bhattacharyya B, Musthafa FN, et al. Design and Development of Inexpensive Paper-Based Chemosensors for Detection of Divalent Copper. J. Fluoresc. 2023, 33, 2327–2338. DOI:10.1007/s10895-023-03220-4 [Google Scholar]
- Obeidat YM. A Solid-State Nafion-Coated Screen-Printed Electrochemical Sensor for Ultrasensitive and Rapid Detection of Copper Ions in Water. Processes 2025, 13, 2178. DOI:10.3390/pr13072178 [Google Scholar]
- Klotz LO, Weser U. Biological chemistry of copper compounds. In Copper and Zinc in Inflammatory and Degenerative Diseases; Springer: Dordrecht, The Netherlands, 1998; pp. 19–46. DOI:10.1007/978-94-011-3963-2_3 [Google Scholar]
- Zhu Z, McKendry R, Chavez CL. Signaling in Copper Ion Homeostasis. In Cell and Molecular Response to Stress; Elsevier: Amsterdam, The Netherlands, 2000; pp. 293–300. DOI:10.1016/S1568-1254(00)80022-4 [Google Scholar]
- Verwilst P, Sunwoo K, Kim JS. The role of copper ions in pathophysiology and fluorescent sensors for the detection thereof. Chem. Commun. 2015, 51, 5556–5571. DOI:10.1039/C4CC10366A [Google Scholar]
- Wiloch MZ, Linfield S, Baran N, Nogala W, Jönsson-Niedziółka M. Redox behaviour of Cu-Aβ(4-16) complexes related to Alzheimer’s Disease. Electrochim. Acta 2024, 485, 144089. DOI:10.1016/j.electacta.2024.144089 [Google Scholar]
- Karri S, Doshi V. Hematological Abnormalities in Copper Deficiency. Blood 2007, 110, 2677–2677. DOI:10.1182/blood.V110.11.2677.2677 [Google Scholar]
- Altarelli M, Ben‐Hamouda N, Schneider A, Berger MM. Copper Deficiency: Causes, Manifestations, and Treatment. Nutr. Clin. Pract. 2019, 34, 504–513. DOI:10.1002/ncp.10328 [Google Scholar]
- Kumar N. Copper Deficiency Myelopathy (Human Swayback). Mayo Clin. Proc. 2006, 81, 1371–1384. DOI:10.4065/81.10.1371 [Google Scholar]
- Halfdanarson TR, Kumar N, Li C, Phyliky RL, Hogan WJ. Hematological manifestations of copper deficiency: A retrospective review. Eur. J. Haematol. 2008, 80, 523–531. DOI:10.1111/j.1600-0609.2008.01050.x [Google Scholar]
- Myint ZW, Oo TH, Thein KZ, Tun AM, Saeed H. Copper deficiency anemia: review article. Ann. Hematol. 2018, 97, 1527–1534. DOI:10.1007/s00277-018-3407-5 [Google Scholar]
- Tosco A, Fontanella B, Danise R, Cicatiello L, Grober OMV, Ravo M, et al. Molecular bases of copper and iron deficiency-associated dyslipidemia: A microarray analysis of the rat intestinal transcriptome. Genes Nutr. 2010, 5, 1–8. DOI:10.1007/s12263-009-0153-2 [Google Scholar]
- Duan X, Zhao Z, Zhang Z, Wei W, Bu Z, Yan M, et al. Development of the electrochemical sensor based on magnetic fluid for the detection of copper ions in food. Electrochim. Acta 2025, 538, 146973. DOI:10.1016/j.electacta.2025.146973 [Google Scholar]
- Huang JW, Chen CH. Detecting copper ions in aqueous solutions through interfacial potential modulation in liquid crystal-based sensors. Microchem. J. 2025, 215, 114174. DOI:10.1016/j.microc.2025.114174 [Google Scholar]
- Jin M, Lee S, Lim SB, Lee M, Park J, Jung H, et al. Sulfur‐Doped Carbon Dots as a Highly Selective and Sensitive Fluorescent Probe for Copper Ion Detection in Biological Systems. Small 2025, 21, 2410765. DOI:10.1002/smll.202410765 [Google Scholar]
- Li Z, Hou JT, Wang S, Zhu L, He X, Shen J. Recent advances of luminescent sensors for iron and copper: Platforms, mechanisms, and bio-applications. Coord. Chem. Rev. 2022, 469, 214695. DOI:10.1016/j.ccr.2022.214695 [Google Scholar]
- Wang X, Hao J, Lin P, Li X, Li S, Wang J, et al. Design of Histidine Sequence‐Associated Tripeptide Sequences for Recognition of Copper Ions and Their Application to Live Cells. Luminescence 2025, 40, e70095. DOI:10.1002/bio.70095 [Google Scholar]
- Maponya TC, Makgopa K, Somo TR, Modibane KD. Highlighting the Importance of Characterization Techniques Employed in Adsorption Using Metal–Organic Frameworks for Water Treatment. Polymers 2022, 14, 3613. DOI:10.3390/polym14173613 [Google Scholar]
- Lettieri M, Scarano S, Caponi L, Bertolini A, Saba A, Palladino P, et al. Serotonin-Derived Fluorophore: A Novel Fluorescent Biomaterial for Copper Detection in Urine. Sensors 2023, 23, 3030. DOI:10.3390/s23063030 [Google Scholar]
- Zhong L, Chen Y, Gan X, Jiang S, Lin Y, Li Q, et al. Simultaneous ratiometric fluorescence determination and removal of copper ions by a magnetic nanocomposite. Sci. Rep. 2025, 15, 27009. DOI:10.1038/s41598-025-12639-7 [Google Scholar]
- Bertoli AC, Carvalho R, Freitas MP, Ramalho TC, Mancini DT, Oliveira MC, et al. Structural determination of Cu and Fe–Citrate complexes: Theoretical investigation and analysis by ESI-MS. J. Inorg. Biochem. 2015, 144, 31–37. DOI:10.1016/j.jinorgbio.2014.12.008 [Google Scholar]
- Luo HW, Lin ZQ, Sheng GP. Spectroscopic characterization of the complexes between Fe/Mn and natural organic matters by electron paramagnetic resonance and synchrotron-based techniques. Ecotoxicology 2015, 24, 2207–2212. DOI:10.1007/s10646-015-1551-4 [Google Scholar]
- Bhuiya S, Chowdhury S, Haque L, Das S. Spectroscopic, photophysical and theoretical insight into the chelation properties of fisetin with copper (II) in aqueous buffered solutions for calf thymus DNA binding. Int. J. Biol. Macromol. 2018, 120, 1156–1169. DOI:10.1016/j.ijbiomac.2018.08.162 [Google Scholar]
- Mastropaolo D, Powers DA, Potenza JA, Schugar HJ. Crystal structure and magnetic properties of copper citrate dihydrate, Cu2C6H4O7·2H2O. Inorg. Chem. 1976, 15, 1444–1449. DOI:10.1021/ic50160a038 [Google Scholar]
- Palčić A, Halasz I, Bronić J. Crystal structure of copper(II) citrate monohydrate solved from a mixture powder X-ray diffraction pattern. Powder Diffr. 2014, 29, 28–32. DOI:10.1017/S0885715613001267 [Google Scholar]
- Shin J, Lim MH, Han J. NMR spectroscopic investigations of transition metal complexes in organometallic and bioinorganic chemistry. Bull. Korean Chem. Soc. 2024, 45, 593–613. DOI:10.1002/bkcs.12853 [Google Scholar]
- Victor-Lovelace TW, Miller LM. The development and use of metal-based probes for X-ray fluorescence microscopy. Metallomics 2022, 14, mfac093. DOI:10.1093/mtomcs/mfac093 [Google Scholar]
- Sarkar S, Chatti M, Adusumalli VNKB, Mahalingam V. Highly Selective and Sensitive Detection of Cu2+ Ions Using Ce(III)/Tb(III)-Doped SrF2 Nanocrystals as Fluorescent Probe. ACS Appl. Mater. Interfaces 2015, 7, 25702–25708. DOI:10.1021/acsami.5b06730 [Google Scholar]
- Xiang Y, Lu Y. DNA as Sensors and Imaging Agents for Metal Ions. Inorg. Chem. 2014, 53, 1925–1942. DOI:10.1021/ic4019103 [Google Scholar]
- Ramos‐Torres KM, Kolemen S, Chang CJ. Thioether Coordination Chemistry for Molecular Imaging of Copper in Biological Systems. Isr. J. Chem. 2016, 56, 724–737. DOI:10.1002/ijch.201600023 [Google Scholar]
- Zou X, Zeng Z, Zhao B, Yue Y, Xu Z, Zhang Y, et al. Thermally Activated Delayed Fluorescent Polymer Dots for Electrochemiluminescent Sensing of Cu2+ Ions. ACS Appl. Polym. Mater. 2023, 5, 10116–10126. DOI:10.1021/acsapm.3c01961 [Google Scholar]
- Sk S, Sarkar T, Majumder A, Sarkar C, Bera M. Exceptionally water-soluble [CuII2] complexes for investigating monosaccharide-metal ion interactions. J. Mol. Struct. 2023, 1294, 136343. DOI:10.1016/j.molstruc.2023.136343 [Google Scholar]
- Ma Y, Wang S, Sun W, Zhou L, Deng Y, Zhao Q. Nitrogen‐Doped Carbon Dots Prepared via Microchannel Method for Visual Detection of Copper Ions. Luminescence 2025, 40, e70113. DOI:10.1002/bio.70113 [Google Scholar]
- Li K, Huang Y, Sun Y, Zhang Y, Zhang Y, Ren B, et al. A hydroxyl coumarin-chalcone-based fluorescent probe for sensing copper ions in plant and living cells. J. Photochem. Photobiol. B Biol. 2025, 270, 113218. DOI:10.1016/j.jphotobiol.2025.113218 [Google Scholar]
- Jiang X, Zhao Z, Liao Y, Tang C, Tremblay PL, Zhang T. A recyclable colorimetric sensor made of waste cotton fabric for the detection of copper ions. Cellulose 2022, 29, 5103–5115. DOI:10.1007/s10570-022-04572-z [Google Scholar]
- Adachi T, Mazurenko I, Mano N, Kitazumi Y, Kataoka K, Kano K, et al. Kinetic and thermodynamic analysis of Cu2+-dependent reductive inactivation in direct electron transfer-type bioelectrocatalysis by copper efflux oxidase. Electrochim. Acta 2022, 429, 140987. DOI:10.1016/j.electacta.2022.140987 [Google Scholar]
- Sivakumar R, Lee NY. Paper-Based Fluorescence Chemosensors for Metal Ion Detection in Biological and Environmental Samples. BioChip J. 2021, 15, 216–232. DOI:10.1007/s13206-021-00026-z [Google Scholar]
- Parry RW, DuBois FW. Citrate Complexes of Copper in Acid Solutions. J. Am. Chem. Soc. 1952, 74, 3749–3753. DOI:10.1021/ja01135a010 [Google Scholar]
- Kotsakis N, Raptopoulou CP, Tangoulis V, Terzis A, Giapintzakis J, Jakusch T, et al. Correlations of Synthetic, Spectroscopic, Structural, and Speciation Studies in the Biologically Relevant Cobalt(II)−Citrate System: The Tale of the First Aqueous Dinuclear Cobalt(II)−Citrate Complex. Inorg. Chem. 2003, 42, 22–31. DOI:10.1021/ic011272l [Google Scholar]
- Yahia ZH, Robin C, Hasan H. Cu2+-Citrate Dimer Complexes in Aqueous Solutions. J. Basic Appl. Sci. 2015, 11, 583–589. DOI:10.6000/1927-5129.2015.11.78 [Google Scholar]
- Wang P, Yao K, Fu J, Chang Y, Li B, Xu K. Novel fluorescent probes for relay detection copper/citrate ion and application in cell imaging. Spectrochim. Acta Part A Mol. Biomol. Spectrosc. 2019, 211, 9–17. DOI:10.1016/j.saa.2018.11.038 [Google Scholar]
- Strouse J, Layten SW, Strouse CE. Structural studies of transition metal complexes of triionized and tetraionized citrate. Models for the coordination of the citrate ion to transition metal ions in solution and at the active site of aconitase. J. Am. Chem. Soc. 1977, 99, 562–572. DOI:10.1021/ja00444a041 [Google Scholar]
- Khoma RE, Bіenkovska TS, Osadchiy LT, Ishkov YV. Citric Acid–Sodium Citrate–Water Solutions Acid-Base and Electrochemical Behavior. Bull. Odessa Natl. Univ. Chem. 2023, 28, 33–42. DOI:10.18524/2304-0947.2023.2(85).286600 [Google Scholar]
- Maketon W, Ogden KL. Synergistic effects of citric acid and polyethyleneimine to remove copper from aqueous solutions. Chemosphere 2009, 75, 206–211. DOI:10.1016/j.chemosphere.2008.12.005 [Google Scholar]
- Zhu B, Fan T, Zhang D. Adsorption of copper ions from aqueous solution by citric acid modified soybean straw. J. Hazard. Mater. 2008, 153, 300–308. DOI:10.1016/j.jhazmat.2007.08.050 [Google Scholar]
- Boonrattanakij N, Puangsuwan S, Vilando AC, Lu MC. Influence of coexisting EDTA, citrate, and chloride ions on the recovery of copper and cobalt from simulated wastewater using fluidized-bed homogeneous granulation process. Process Saf. Environ. Prot. 2023, 172, 83–96. DOI:10.1016/j.psep.2023.02.009 [Google Scholar]
- Chen JP, Wu S, Chong KH. Surface modification of a granular activated carbon by citric acid for enhancement of copper adsorption. Carbon 2003, 41, 1979–1986. DOI:10.1016/S0008-6223(03)00197-0 [Google Scholar]
- Molchanov AS, Ledenkov SF. Effect of a water-ethanol solvent on the stability of copper(II) complexes with L-tyrosine. Russ. J. Gen. Chem. 2010, 80, 219–222. DOI:10.1134/S1070363210020040 [Google Scholar]
- Grazhdan KV, Gushchina AS, Dushina SV, Sharnin VA, Kuranova NN, Ekimovskaya AA. Effect of water—Ethanol solvent on the stability of copper(ii) coordination compound with the nicotinate ion. Russ. Chem. Bull. 2015, 64, 2597–2600. DOI:10.1007/s11172-015-1195-9 [Google Scholar]
- Kuranova NN, Gushchina AS, Grazhdan KV, Dushina SV, Sharnin VA. Stability of copper(II) complexes with nicotinate ion in water solutions of ethanol and dimethyl sulfoxide. Russ. J. Inorg. Chem. 2016, 61, 1616–1619. DOI:10.1134/S003602361612010X [Google Scholar]
- Yu C, Wu S, Huang Z, Zhao Y, Zeng Z, Xue W. Water/ethanol complexation induced solubility variation of hexaquocobalt(II) bis (p-toluenesulfonate) and hexaquonickel(II) bis (p-toluenesulfonate). J. Mol. Liq. 2016, 224, 139–145. DOI:10.1016/j.molliq.2016.09.094 [Google Scholar]
- Pirhayati FH, Shayanfar A, Fathi-Azarbayjani A, Martinez F, Sajedi-Amin S, Jouyban A. Thermodynamic solubility and density of sildenafil citrate in ethanol and water mixtures: Measurement and correlation at various temperatures. J. Mol. Liq. 2017, 225, 631–635. DOI:10.1016/j.molliq.2016.11.055 [Google Scholar]
- Isaeva VA, Kipyatkov KA, Gamov GA, Sharnin VA. Composition and Stability of Copper(II) Complexes with [2.2.2]Cryptand in Aqueous and Aqueous Ethanol Solutions. Russ. J. Phys. Chem. 2021, 95, 968–973. DOI:10.1134/S0036024421050162 [Google Scholar]
- Bao K, Wang M, Zheng Y, Wang P, Yang L, Jin Y, et al. Construction of low dielectric aqueous electrolyte with ethanol for highly stable Zn anode. Nano Energy 2024, 120, 109089. DOI:10.1016/j.nanoen.2023.109089 [Google Scholar]