Leaching Characteristics of Spent Carbon Anode in Alkaline System: Thermodynamics, Kinetics, Ion Forms, and Phase Transformation

Leaching Characteristics of Spent Carbon Anode in Alkaline System: Thermodynamics, Kinetics, Ion Forms, and Phase Transformation
Yonghong Qin 1,2,3,* Xiaodi Niu 2,3 Xianglin Li 2,3 Yujiao Liu 2,3 Zihe Pan 2,3 Jianming Gao 2,3 Yanxia Guo 2,3 Xinran Zhu 1,4,*
Received: 08 May 2026 Revised: 13 May 2026 Accepted: 22 May 2026 Published: 09 June 2026

© 2026 The authors. This is an open access article under the Creative Commons Attribution 4.0 International License (https://creativecommons.org/licenses/by/4.0/).
Graphical Abstract
1. Introduction
Lithium resources are essential energy materials and strategic resources for human beings. With the rapid development of the new energy industry, lithium demand shows explosive growth [1,2,3]. China’s aluminium electrolysis industry and the increasing demand for aluminium products result in abundant low and medium-grade lithium-bearing bauxites for the preparation of industrial-grade alumina. Lithium-containing bauxite is continuously transported to the electrolyte system during the production process [4]. Meanwhile, some kind of lithium-containing fluoride and other salts are usually added to improve current efficiency and reduce energy consumption in aluminium electrolysis production. Lithium-containing aluminium electrolytic slag (1–2.7% lithium) is produced with the addition of lithium-containing fluoride salts. China’s electrolytic aluminium production of 41.59 million t in 2023, equivalent to lithium 4159~11,229 t [5,6]. It will be conducive to alleviating the new energy industry’s supply pressure on lithium by reasonably recycling lithium resources. These waste aluminium electrolytes are mainly discharged by piling or landfilling. The stacking of spent electrolytes not only occupies the functional space of aluminium electrolysis enterprises but also contains a large amount of fluoride, including soluble sodium fluoride (NaF), cryolite (Na3AlF6), and insoluble CaF2 [7,8,9]. These fluorides may also leach into the ground with rainwater and cause environmental pollution, which also leads to the waste of many lithium resources in lithium-containing aluminium electrolytes [5,6]. Therefore, the extraction of lithium from SCA can not only solve the problem of slag treatment but also achieve the resourceful use of lithium. However, lithium in aluminium electrolysis slag exists in the form of lithium cryolite (Na2LiAlF6). Since Na2LiAlF6 has similar properties to cryolite (Na3AlF6), it is difficult to extract lithium from aluminium electrolysis slag [10].
Existing research is mostly focused on acid leaching and calcination processes, and the thermodynamic-kinetic coupling study and the phase evolution mechanism of NaOH direct alkali leaching remain insufficient. Among them, Wu et al. [11] developed a process to extract lithium from spent lithium-containing aluminium electrolytes. Through HNO3-Al(NO3)3 leaching, leachate neutralisation, and lithium carbonate precipitation, the leaching rate of lithium reached 88.0% at leaching time of 6 h, a leaching temperature of 80 °C, and a corresponding Al/F molar ratio of 1:6. Lithium is separated by precipitation to obtain Li2CO3 with a purity of 98.8%. The purity of lithium carbonate is high, but the leaching time is too long, which is not conducive to the whole production process. Tang et al. [12] proposed a process of “sulphuric acid roasting-roasting water leaching-aluminium precipitation-lithium precipitation” for the treatment of spent aluminium electrolyte, and the lithium leaching rate was 87.55% under the optimal sulphated roasting conditions. Battery-grade cubic LiF was prepared from Li2SO4 solution by evaporation-concentration-frozen crystallisation-lithium fluoride precipitation process, but the process is long, and the high roasting temperature and energy consumption in the pretreatment process are not conducive to practical production. Lv et al. [13] used sodium phosphate precipitation and wet conversion methods to recover lithium from low-concentration waste streams with high-efficiency enrichment. The precipitation rate of lithium reached 94.32%. The lithium phosphate precipitation method achieved a high lithium recovery efficiency. Although acid leaching can significantly improve the lithium leaching rate, the loss rate of lithium is higher during aluminium precipitation of the lithium-containing leach solution. The subsequent pH regulation process of acid leaching will use a large number of alkali reagents, increasing the expense of the production process, which is not conducive to subsequent production [14]. Acid leaching of fluoride-rich SCA generates toxic hydrogen fluoride gas, which causes poses serious health risks to operators. Acid leaching dissolves most elements (Al, Na, F, Li) simultaneously, resulting in a complex leachate composition that requires extensive downstream separation processes and high reagent consumption for neutralization [15]. The need for corrosion-resistant equipment, neutralization agents, and complex purification steps significantly increases the overall process cost. Valuable fluorine resources are not effectively recovered and are often converted into insoluble fluorides that require further treatment [16]. Large amounts of neutralization sludge are generated, creating additional solid waste disposal challenges [17,18].
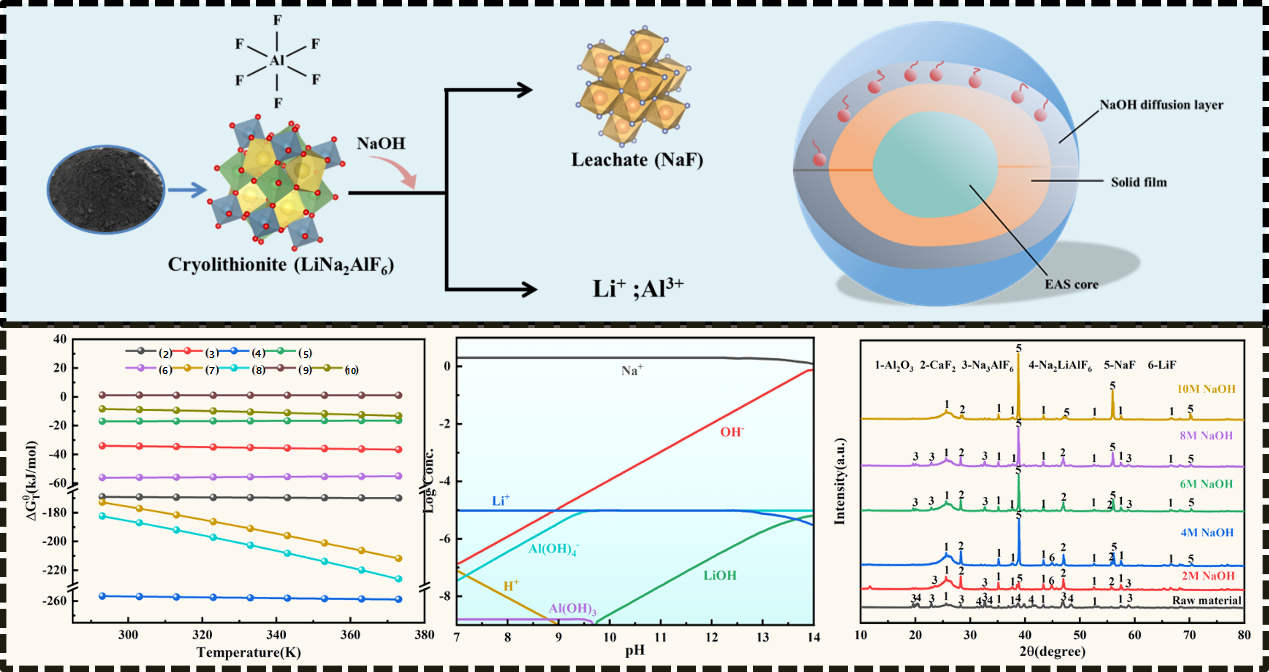
In summary, the recovery of lithium from SCA has attracted the attention of numerous researchers. However, current studies have focused on acid leaching and factors affecting Li+ dissolution, while the physical phase transition and leaching mechanism of Li+ are not yet clear. Therefore, this study proposes a research method for direct alkaline leaching of SCA, focusing on the thermodynamics and leaching kinetics, and the morphology of lithium presence under alkaline conditions was analysed using the E–pH diagram of Li–H2O. The physical phase transition of lithium during the leaching process was analysed via XRD. In the process of alkaline leaching of SCA, cryolite (Na3AlF6)/lithium cryolite (Na2LiAlF6) decomposition reaction occurs in sodium hydroxide solution to generate sodium aluminate, and sodium aluminate is precisely one of the raw materials for the preparation of cryolite, so alkaline leaching of SCA not only enriches lithium but also can achieve the cycle regeneration of cryolite, alkaline leaching of SCA has great significance to the high efficiency recovery of lithium and cryolite.
2. Experiment
2.1. Materials and Reagents
The SCA raw material was obtained from an electrolytic aluminium plant in Xing County, Lüliang, Shanxi, China. After crushing, grinding, sieving, and mixing, the slag powder was sieved through a 0.074 mm sieve and stored in self-sealing bags as raw material for experiments. The main element contents, physical phase composition, and microstructure of the raw materials are shown in Figure 1. Figure 1a suggests the main physical phase composition of the SCA, including cryolite (Na3AlF6), lithium cryolite (Na2LiAlF6), alumina (Al2O3), calcium fluoride (CaF2), and carbon (C). Figure 1b displays that the main elemental contents of SCA were Li (1.43%), Na (25.4%), Al (15.5%), Ca (1.34%), F (43.89%) and C (7.99%), of which the contents of Li, Al, Na and Ca were determined by inductively coupled plasma emission spectrometry (ICP-OES), and the contents of fluorine and carbon were determined by X-ray fluorescence spectrometer (XRF). The energy spectrum analysis of the SCA in Figure 1c indicates that carbon and cryolite/lithium cryolite are intertwined in the slag. The presence and distribution states of the elements C, O, Al, Na, and Ca were detected, where the analyses by scanning electron microscope and X-ray diffractometer were consistent. Sodium hydroxide (NaOH) used in the experiment was analytically pure from Aladdin Chemical Reagent Co. (Shanghai, China) and H2O was pure water.
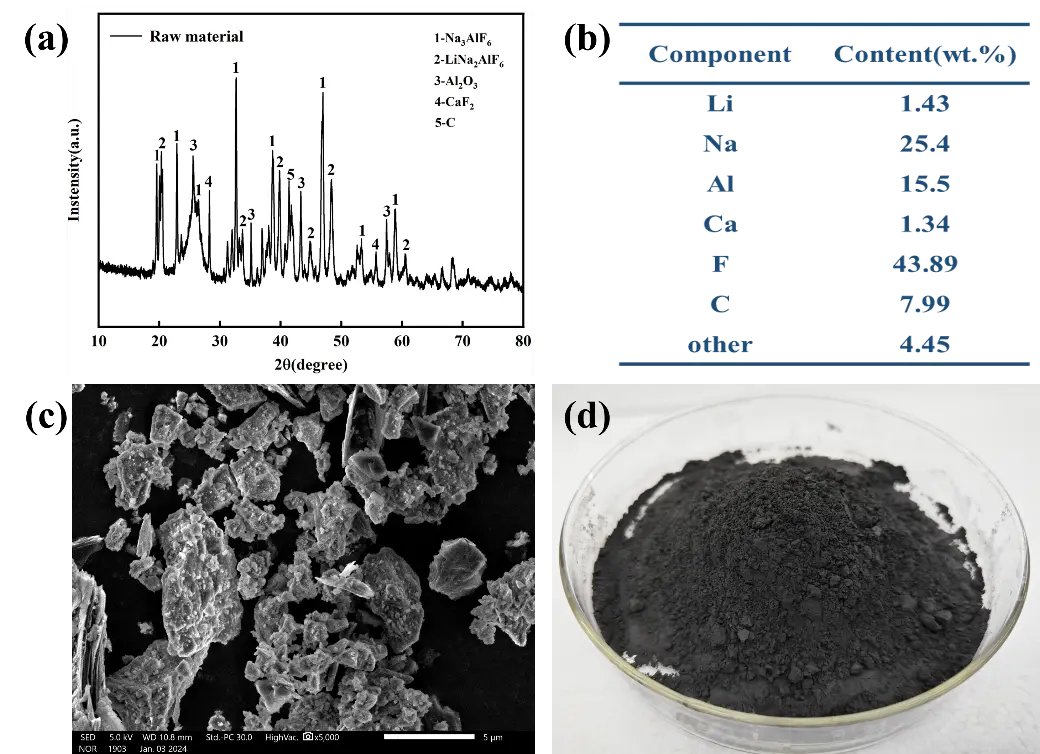
Figure 1. Characterisation of the SCA raw material: (a) X-ray diffractogram; (b) elemental analysis; (c) scanning electron microscop analysis; (d) SCA raw material image.
2.2. Analysis of the Leaching Mechanism
2.2.1. Leaching Thermodynamics
Thermodynamics focuses on the likelihood, direction, and limits of chemical reactions under certain conditions. The possible chemical reactions during the leaching process were substituted into the HSC 6.0 thermodynamic software for thermodynamic analysis, and the Gibbs free energy of each reaction formula at different temperatures was calculated as a means of determining whether or not the reaction could proceed spontaneously at the experimental temperature.
2.2.2. Leaching Kinetics
To study the leaching kinetics of slag, leaching experiments were carried out using different concentrations of sodium hydroxide solutions at various temperatures, with different liquid-solid ratios and stirring speeds. Leaching experiments were carried out in an oil bath equipped with magnetic stirring and a temperature control system, with a reflux condenser tube used to maintain the solution volume. Firstly, NaOH solution was added to a 1000 mL three-neck flask and heated to a set temperature. Then, raw SCA (50 g) was added to the flask, and stirring of the solid-liquid mixture was started using an electric stirrer and continued for 2 h. 1 mL of leachate was quickly removed at selected time intervals and then diluted in 10 mL volumetric flasks. Solid-liquid separation was achieved by filtration using a Buchner funnel after 2 h, and the leach residue was washed three times with hot water. The volume was measured and recorded. Since all the experiments were carried out at a liquid-solid ratio of 10 mL/g, the concentration of the leaching agent was considered to be constant during the leaching process. The Li+ concentration of each removed solution diluted was analysed by ICP-OES. The leaching residue was dried in an oven at 105 °C for subsequent analyses of physical phase composition and microstructure. The leaching rate of the target elements was calculated using Equation (1):
|
```latexE=\frac{{C}_{i}×{V}_{i}}{{m}_{i}×{W}_{i}}×100%``` |
(1) |
where E is the leaching rate (%), Ci is the content of target element i in the leachate (mg/L), Vi is the volume of leachate (L), mi is the mass of raw material (g), and Wi is the weight percentage of target element i in raw material (%).
2.3. Characterisation Methods
The physical composition of the raw material and the leaching residue was determined using a Hitachi D/MAX-2200 X-ray diffractometer (Rigaku Corporation, Tokyo, Japan) at a scanning angle of 10–80°. Solid samples of raw materials and leaching residues were digested with an EIGOS UP microwave digestion system (Milestone, Srl Bergamo, Italy). The content of metal ions (Li, Al, Na, Ca) in the samples was determined using an Agilent 5800 Inductively Coupled Plasma Emission Spectrometer (Agilent Technologies, Inc., Santa Clara, CA, USA) where the diluent was 1% HNO3. The fluorine and carbon contents in the solid samples were determined by an X-ray fluorescence spectrometer (XRF) type S8 from Bruker Corporation (Karlsruhe, Germany). The microscopic morphology of the raw materials was determined by SEM-EDS (JSM-IT500HR, JEOL Ltd., Tokyo, Japan) at a voltage of 10 KV, a current of 50 nA, and a magnification of 6000 times.
3. Results and Discussion
3.1. Leaching Thermodynamic Analysis
The chemical reactions of the aluminium electrolysis slag during alkaline leaching are shown in Equation (2), Equation (3), Equation (4), Equation (5), Equation (6), Equation (7), Equation (8), Equation (9) and Equation (10). During alkali leaching, Na3AlF6, Al2O3, LiF, and other substances react with NaOH to form soluble ions. In addition, the potential E–pH is the two most important parameters reflecting the thermodynamic properties of the metal-water system. Theoretically, according to the E–pH diagram, the stable or equilibrium state of any element or compound exists in the region where its potential and the corresponding pH of the solution lie. The E–pH diagrams of the Al–Na–H2O system and Li–H2O system were plotted using HSC6.0 software. The possible reactions of various physical phases with NaOH during alkaline leaching of SCA are as follows:
|
```latex\mathrm{Na_3AlF_6+4NaOH=NaAl(OH)_4+6NaF}``` |
(2) |
|
```latex\mathrm{Al_2O_3+2NaOH=2NaAlO_2+H_2O}``` |
(3) |
|
```latex\mathrm{AlF_{3}+4NaOH=NaAl(OH)_{4}+3NaF}``` |
(4) |
|
```latex\mathrm{LiF+NaOH=LiOH+NaF}``` |
(5) |
|
```latex\mathrm{CaF}_{2}+2\mathrm{NaOH}=\mathrm{Ca}(\mathrm{OH})_{2}+2\mathrm{NaF}``` |
(6) |
|
```latex\mathrm{Al}^{3+}+3\mathrm{OH}^-=\mathrm{Al}(\mathrm{OH})_3``` |
(7) |
|
```latex\mathrm{Al}^{3+}+4\mathrm{OH}^-=\mathrm{Al}(\mathrm{OH})_4^-``` |
(8) |
|
```latex\mathrm{Al(OH)}_4^-=\mathrm{AlO}_2^-+2\mathrm{H}_2\mathrm{O}``` |
(9) |
|
```latex\mathrm{Al(OH)}_3+\mathrm{OH}^-=\mathrm{AlO}_2^-+2\mathrm{H}_2\mathrm{O}``` |
(10) |
Based on the temperature (293–373 K), the standard Gibbs free energy ∆G and logK were obtained for the temperatures corresponding to the individual equations, as shown in Table 1 and Table 2. The plot of temperature versus ∆GθT and logK for each reaction in the leaching process of SCA was obtained by Origin software 2022 (Figure 2).
Table 1. Values of ∆GθT for chemical reaction Equation (2), Equation (3), Equation (4), Equation (5), Equation (6), Equation (7), Equation (8), Equation (9) and Equation (10) at different temperatures.
|
Reaction Equation |
∆GθT kJ/mol |
||||||||
|---|---|---|---|---|---|---|---|---|---|
|
293 K |
303 K |
313 K |
323 K |
333 K |
343 K |
353 K |
363 K |
373 K |
|
|
(2) |
−169.058 |
−169.214 |
−169.355 |
−169.482 |
−169.594 |
−169.690 |
−169.771 |
−169.836 |
−169.885 |
|
(3) |
−34.010 |
−34.319 |
−34.636 |
−34.960 |
−35.290 |
−35.624 |
−35.961 |
−36.302 |
−36.644 |
|
(4) |
−256.551 |
−256.887 |
−257.209 |
−257.517 |
−257.810 |
−258.087 |
−258.349 |
−258.596 |
−258.827 |
|
(5) |
−16.990 |
−16.930 |
−16.867 |
−16.802 |
−16.735 |
−16.667 |
−16.596 |
−16.524 |
−16.450 |
|
(6) |
−56.133 |
−56.018 |
−55.901 |
−55.782 |
−55.660 |
−55.535 |
−55.407 |
−55.277 |
−55.144 |
|
(7) |
−172.857 |
−177.139 |
−181.614 |
−186.264 |
−191.076 |
−196.041 |
−201.158 |
−206.423 |
−211.839 |
|
(8) |
−182.428 |
−187.140 |
−192.093 |
−197.265 |
−202.644 |
−208.220 |
−213.989 |
−219.947 |
−226.097 |
|
(9) |
1.110 |
1.098 |
1.084 |
1.070 |
1.059 |
1.053 |
1.053 |
1.061 |
1.078 |
|
(10) |
−8.460 |
−8.903 |
−9.395 |
−9.932 |
−10.510 |
−11.126 |
−11.778 |
−12.463 |
−13.180 |
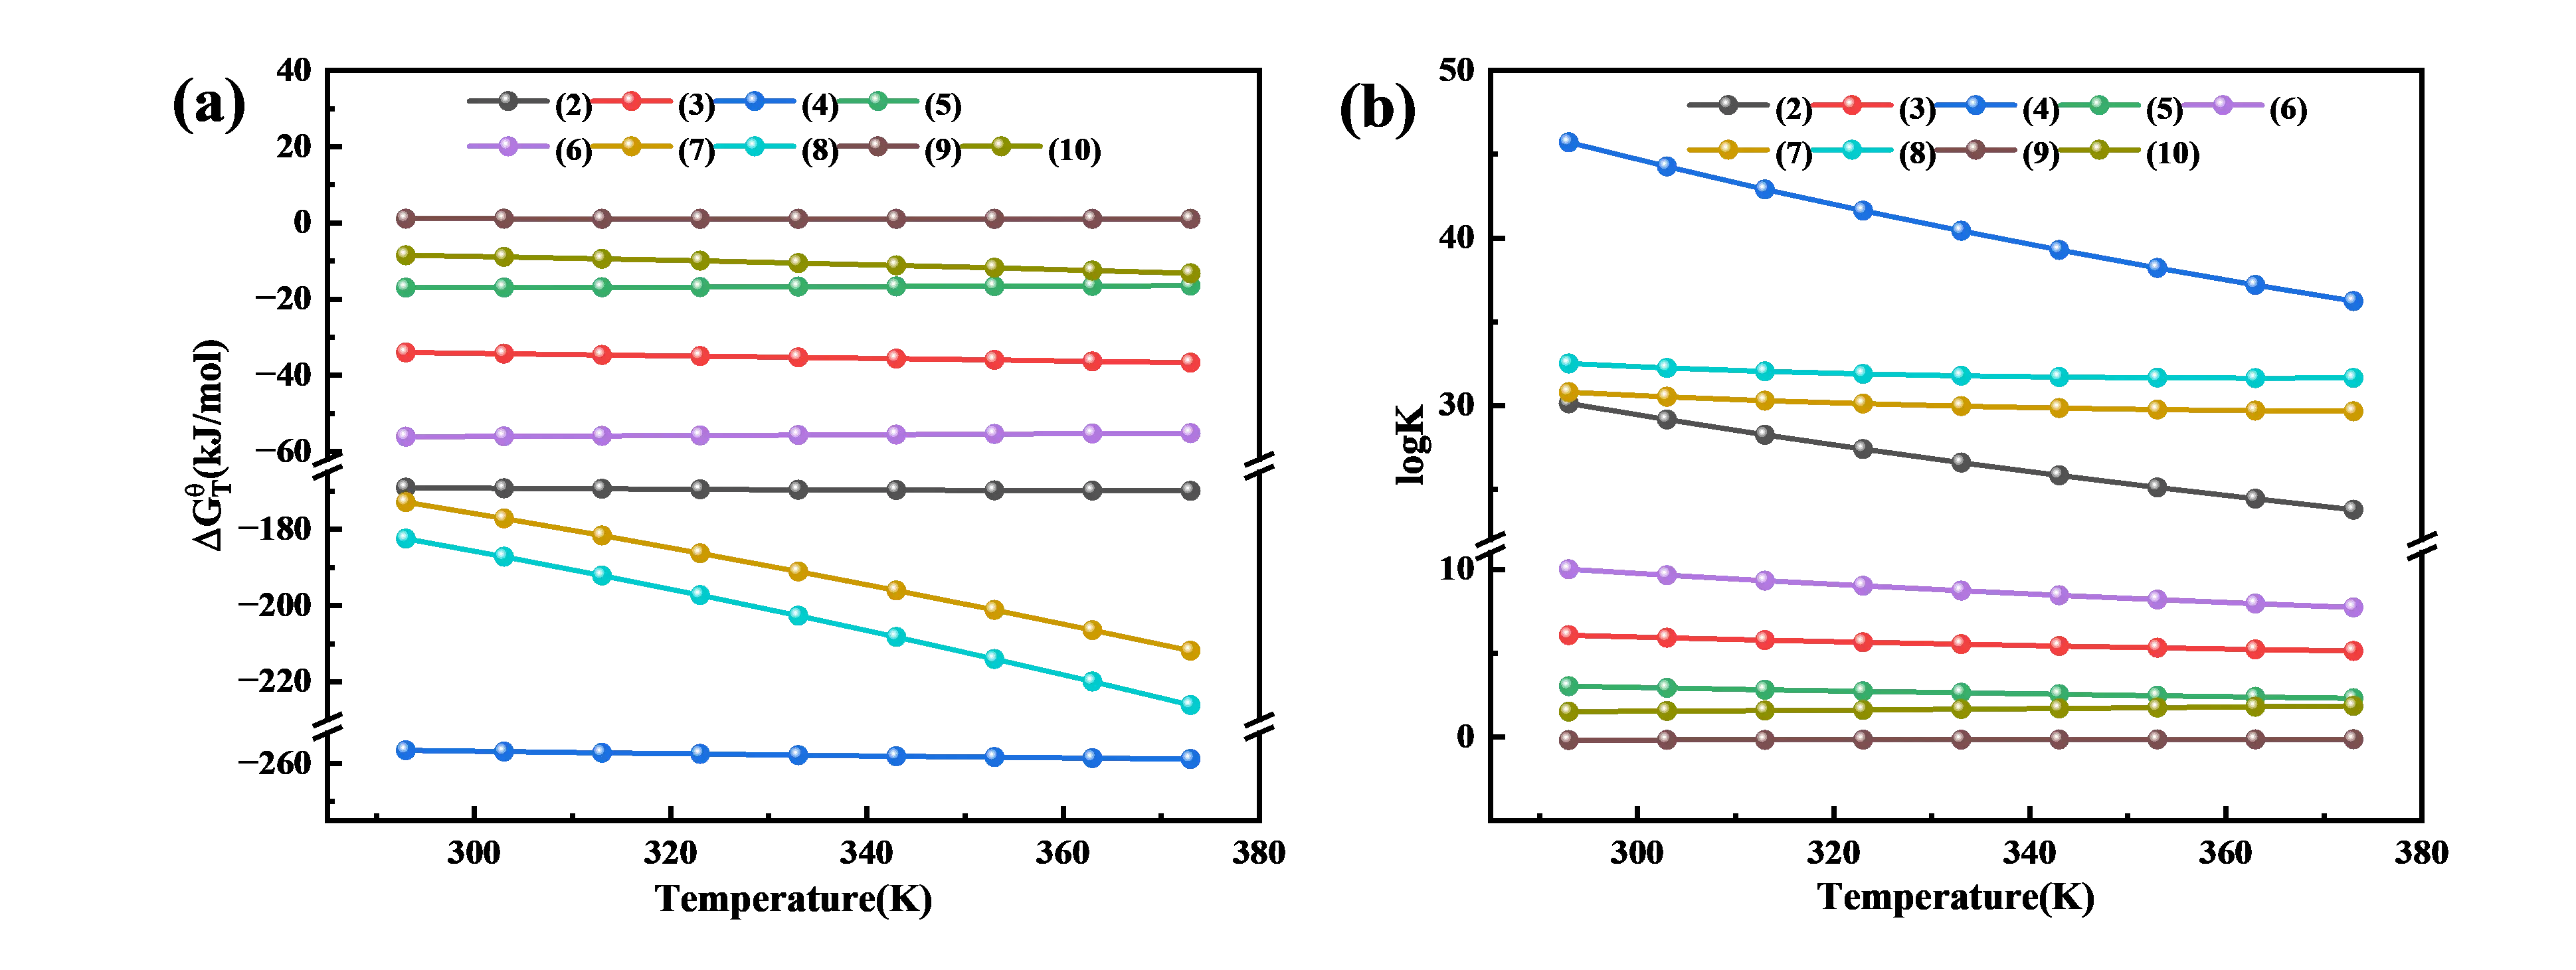
Figure 2. Plot of ∆GθT-T for chemical reaction Equation (2), Equation (3), Equation (4), Equation (5), Equation (6), Equation (7), Equation (8), Equation (9) and Equation (10) at different temperatures. (a) ∆GθT-T (Equation (2), Equation (3), Equation (4), Equation (5), Equation (6), Equation (7), Equation (8), Equation (9) and Equation (10)); (b) logK-T (Equation (2), Equation (3), Equation (4), Equation (5), Equation (6), Equation (7), Equation (8), Equation (9) and Equation (10)).
Table 1 and Table 2 suggest the thermodynamic calculations of possible chemical reactions in the alkaline leach solution in the experimental temperature range (293~373 K), which correspond to Figure 2a,b. Thermodynamic calculations for the reaction of Na3AlF6 in NaOH solution were carried out to obtain the Gibbs free energy and equilibrium constant for the reaction. The Gibbs free energy for the reaction between Na3AlF6 and NaOH is less than 0 over the range of 20–100 °C, indicating that Na3AlF6 can react with NaOH at the experimental temperature. However, as the temperature increases, the logKa value for the reaction of Na3AlF6 with NaOH gradually decreases, indicating that excessive high a temperature is not favourable for Na3AlF6 dissolution [19]. Meanwhile, the reaction ∆G of sodium fluoride (AlF3) with NaOH gradually increases, and the reaction of Al3+ with OH− generated in the solution dominates. Combined with the E–pH diagram of the Al–Na–H2O system in Figure 3a, it was found that at pH 7–10.2, Al3+ first reacts with OH− to form Al(OH)3, and with the gradual increase in OH− concentration, Al(OH)3 dissolves again and Al3+ exists in the form of Al(OH)4− when the solution pH is 10.2–14 [20]. Despite the lack of thermodynamic data for lithium cryolite, Han et al. [21] used DFT calculations to determine the generation energies of Na3AlF6, LiNa2AlF6(Fm3m)/Na2LiAlF6(P21/c), and the results suggest that lithium cryolite is more chemically stable. In addition, LiNa2AlF6(Fm3m)/Na2LiAlF6(P21/c) can be considered as a product of Li atoms replacing Na atoms in Na3AlF6. Lithium cryolite has a similar chemical composition, space groups and lattice constants to Na3AlF6, suggesting that lithium cryolite may have similar physicochemical properties to Na3AlF6 (Figure 3). Thus, it is confirmed by the Li+ already present in the alkaline leach solution that lithium cryolite can also react with NaOH. Combined with the E–pH diagram of the Li–H2O system in Figure 4b, it can be concluded that lithium exists in the system as LiOH when the alkaline leach solution pH is 7–12 [22,23], and lithium exists in the form of Li+ at pH of 12–14. Therefore, alkali immersion dissolves cryolite/lithium cryolite to produce Li+ at the experimental temperature. Thermodynamic calculations of the reaction of LiF in alkaline solutions show that ΔG for the reaction of LiF with sodium hydroxide is also negative in the experimental temperature range, indicating that alkaline immersion can also dissolve LiF. In addition, the reaction of Al2O3 with sodium hydroxide has a negative ∆G in the range of 20–100 °C, indicating that alkaline immersion dissolves Al2O3 to produce NaAl(OH)4 [24]. Al2O3 reacts with NaOH to form NaAl(OH)4, which consumes a significant amount of OH− ions and increases solution viscosity. CaF2 reacts with NaOH to form Ca(OH)2, which may coat the surface of unreacted particles and hinder mass transfer. SiO2 impurities react with NaOH to form sodium silicate, which can form colloidal precipitates and complicate solid-liquid separation.
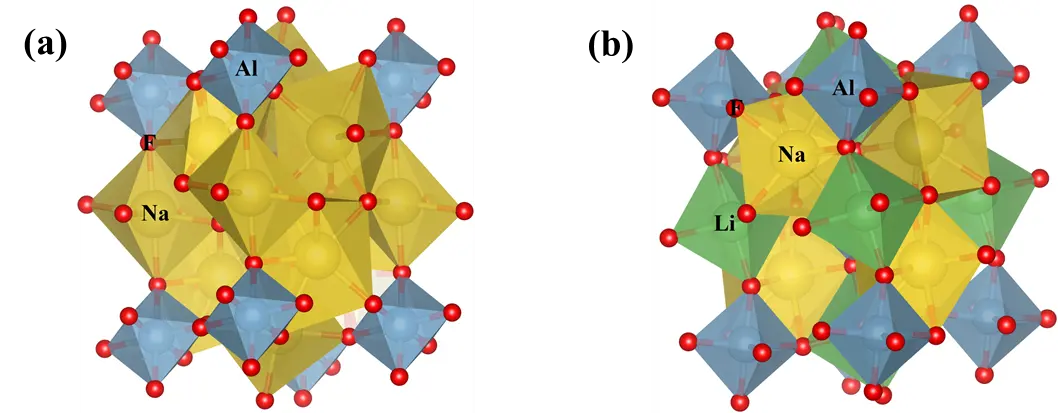
Table 2. Equilibrium constants logKa for chemical Formulas (2) to (10) at different temperatures.
|
Reaction Equation |
Equilibrium Constant logKa |
||||||||
|---|---|---|---|---|---|---|---|---|---|
|
293 K |
303 K |
313 K |
323 K |
333 K |
343 K |
353 K |
363 K |
373 K |
|
|
(2) |
30.126 |
29.159 |
28.251 |
27.398 |
26.593 |
25.833 |
25.113 |
24.431 |
23.783 |
|
(3) |
6.060 |
5.914 |
5.778 |
5.652 |
5.534 |
5.423 |
5.319 |
5.222 |
5.130 |
|
(4) |
45.717 |
44.267 |
42.907 |
41.629 |
40.425 |
39.290 |
38.216 |
37.199 |
36.234 |
|
(5) |
3.028 |
2.917 |
2.814 |
2.716 |
2.624 |
2.537 |
2.455 |
2.377 |
2.303 |
|
(6) |
10.003 |
9.653 |
9.325 |
9.017 |
8.728 |
8.454 |
8.196 |
7.952 |
7.720 |
|
(7) |
30.803 |
30.525 |
30.296 |
30.111 |
29.961 |
29.844 |
29.756 |
29.694 |
29.656 |
|
(8) |
32.508 |
32.248 |
32.045 |
31.889 |
31.775 |
31.698 |
31.654 |
31.639 |
31.652 |
|
(9) |
−0.198 |
−0.189 |
−0.181 |
−0.173 |
−0.166 |
−0.160 |
−0.156 |
−0.153 |
−0.151 |
|
(10) |
1.508 |
1.534 |
1.567 |
1.606 |
1.648 |
1.694 |
1.742 |
1.793 |
1.845 |
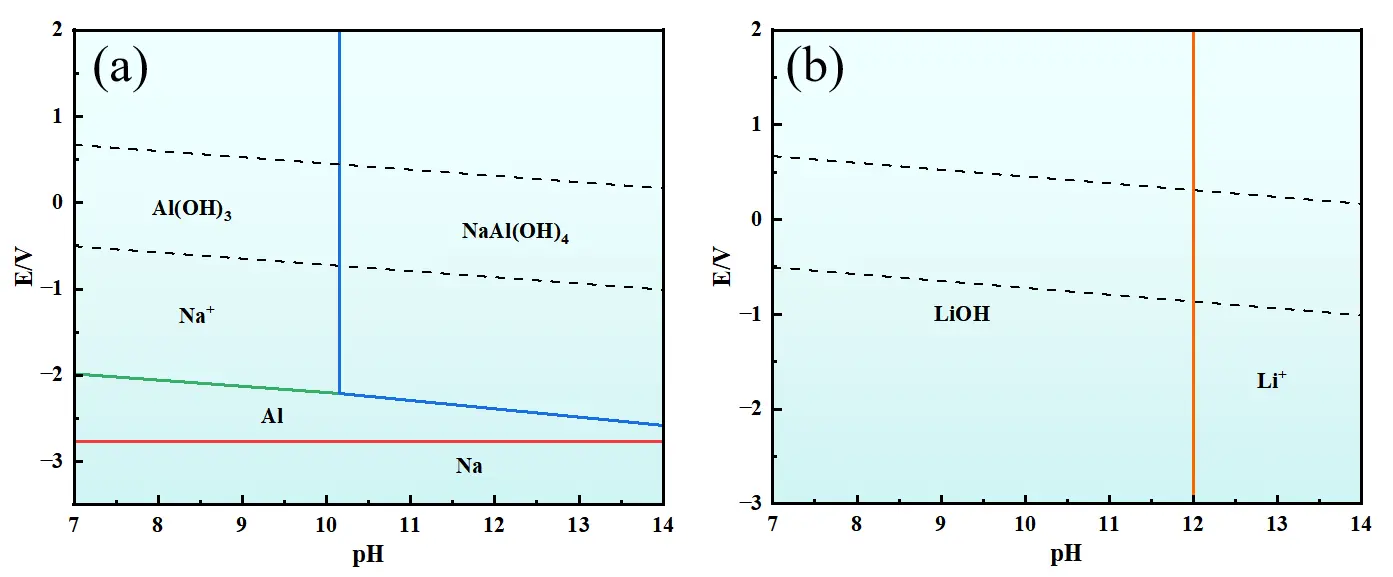
3.2. Modelling of Ion Presence Patterns in the Alkaline System
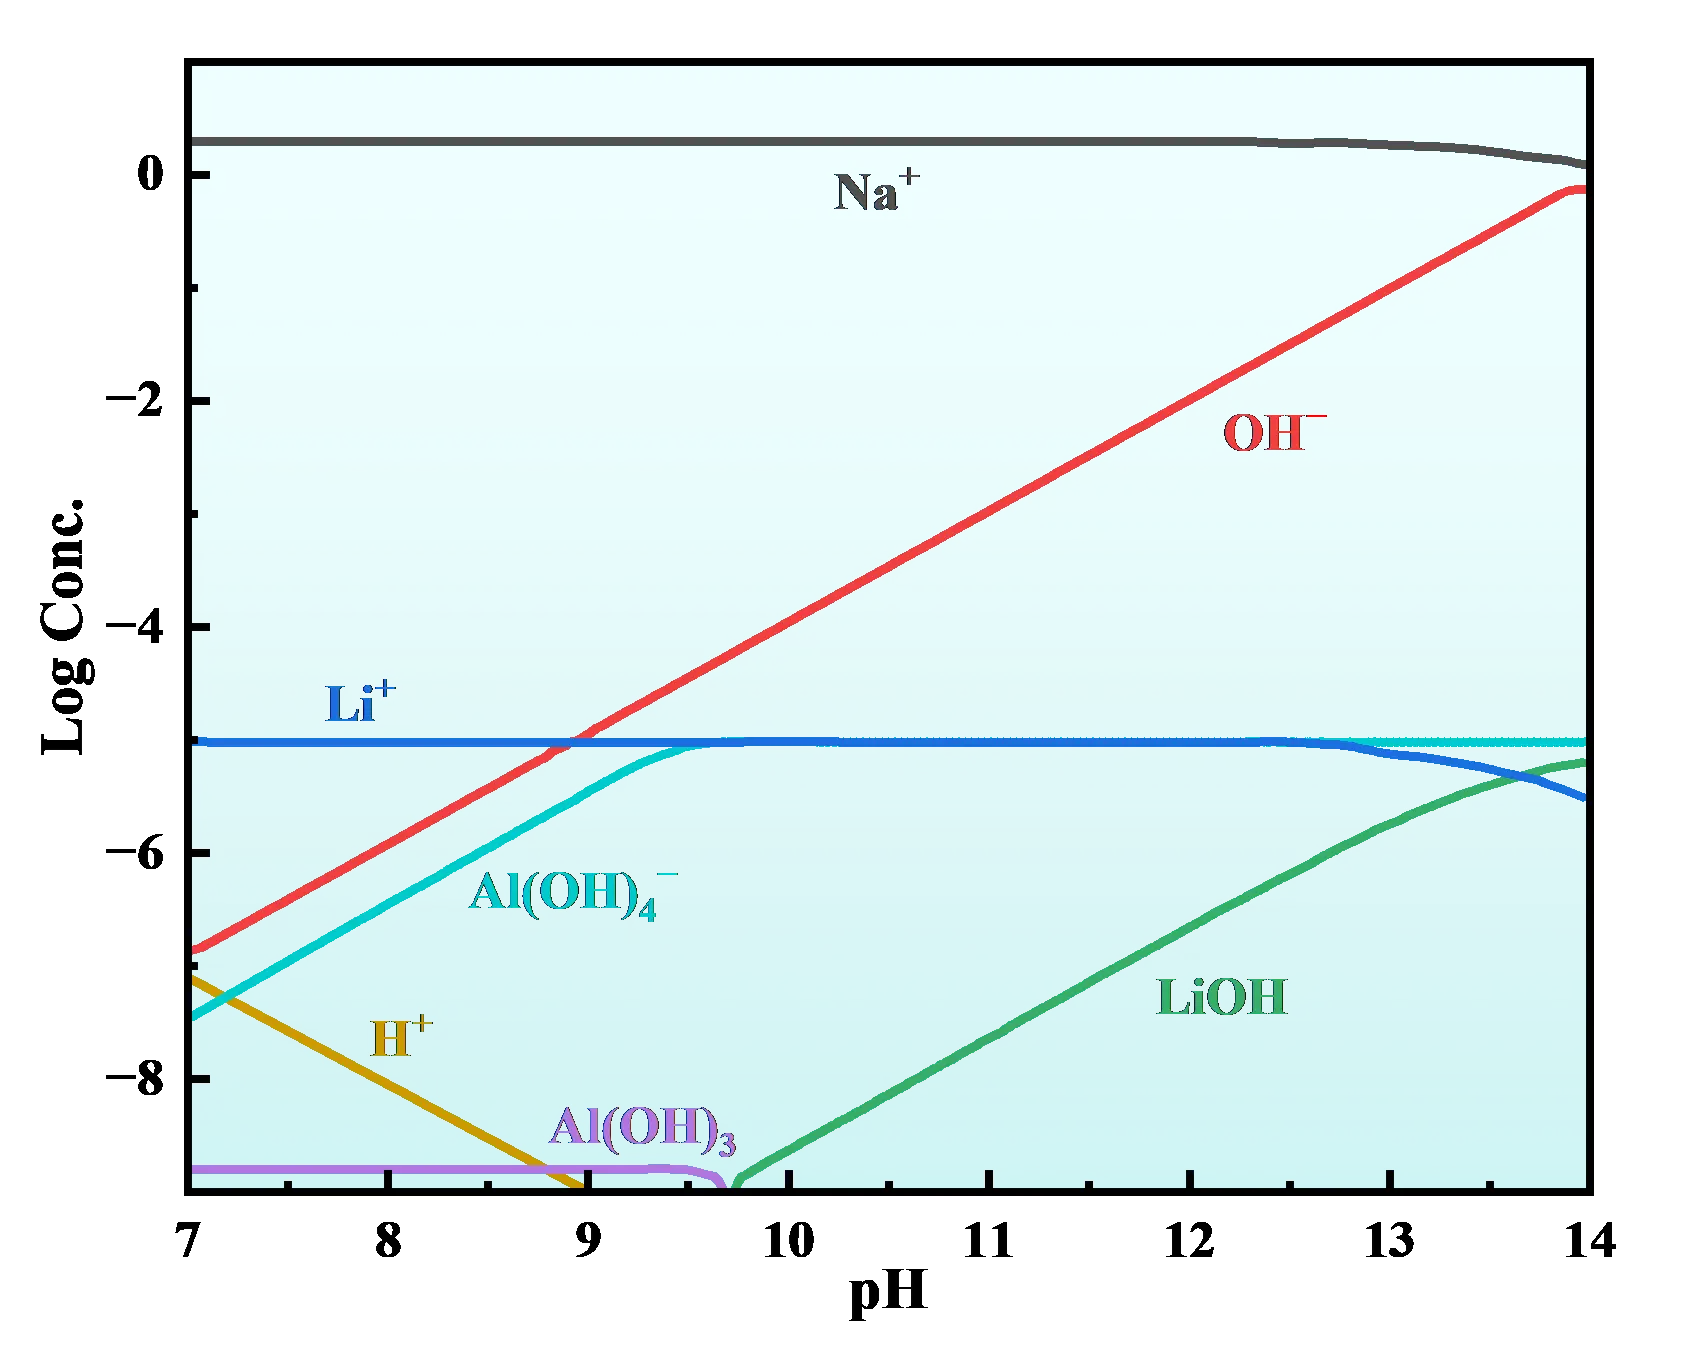
The distribution of various metal cations in the SCA alkaline leach solution was simulated using Medusa as shown in Figure 5. From the figure, it can be seen that Al3+ forms Al(OH)3 complexes with OH− in solution when the pH of the solution is in the range of 7–9.7. The Al(OH)3 complex disappears at a pH around 9.7. With the gradual increase of OH− in the solution, Al(OH)3 will react with OH− to form Al(OH)4−, and thus Al(OH)4− in the solution will gradually increase and then basically remain in a stable state. As the pH of the solution increases, there should be a corresponding increase in free Na+ in the solution. However, as the concentration of NaOH increases, a new substance, sodium fluoride (NaF), appears in the leaching slag, and the peak intensity gradually becomes larger. Thus, the leaching process consumes Na+ in solution, so the Na+ in solution maintains a steady state with a gradual increase in pH. When the pH is in the range of 9.7–14, Li+ and OH− rapidly form the complex LiOH, and the remaining Li+ exists in the free state.
4. Discussion
4.1. Alkali Leaching Kinetics
4.1.1. Modelling of Leaching Kinetics
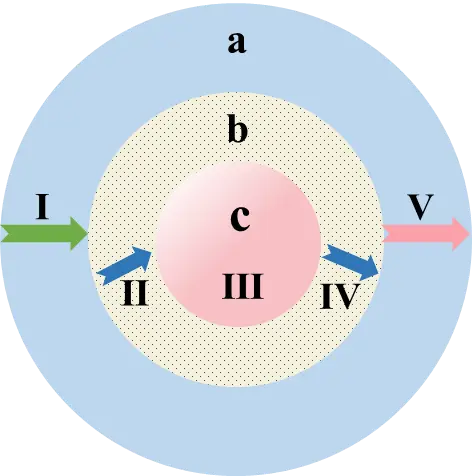
Kinetic studies can determine the effect of various factors on the reaction rate and the control steps for a given reaction process, so that targeted measures can be taken to enhance the reaction process and increase the reaction rate and productivity [25]. SCA alkaline leaching is essentially a liquid-solid reaction because the particle size of SCA is less than 200 mesh, which can be approximated as fine, dense spherical particles, and SCA alkaline leaching remains after the solid leaching residue. Therefore, the alkali leaching reaction kinetic process can be described by the unreacted nucleus contraction model [26,27,28], which is widely used in the field of hydrometallurgy for the dissolution kinetics of solid-liquid two-phase systems [29,30,31]. The schematic diagram of the leaching process is shown in Figure 6. It mainly consists of five processes from (I) to (V) below, where a, b, and c represent the main body of the liquid phase, the solid film generated after the reaction, and the unreacted nucleus of the SCA, respectively.
- I.
-
The diffusion of the leaching agent in the liquid phase from the solution to the surface of SCA particles is external.
- II.
-
The diffusion of leachate ions diffused to the surface of aluminium slag particles to the nucleus of aluminium slag through the solid film on the surface of residue particles is internal diffusion.
- III.
-
The leachate ions react chemically with the unreacted waste residue at the reaction interface, and this process is a chemical reaction.
- IV.
-
The reaction of insoluble products thickens the solid film, and the diffusion of soluble products through the solid film to the boundary layer is internal.
- V.
-
The diffusion of products generated by the reaction from the surface of the slag particles into the leaching solution is called external diffusion.
Among them, mineral particle size is the key factor to improve the leaching rate in the internal diffusion control process; the surface reaction control process, leaching temperature, and leaching agent concentration are the key factors to improve the leaching rate; the mixing diffusion control process, stirring intensity, temperature, and leaching agent concentration have a certain effect on the leaching rate. The specific control equations are as follows:
Kinetic equations for external diffusion control:
|
```latex1-{\left(1-x\right)}^{2/3}={k}_{e}t``` |
(11) |
Kinetic equations for the control of interfacial chemical reactions:
|
```latex1-{\left(1-x\right)}^{1/3}={k}_{e}t``` |
(12) |
Internal diffusion-controlled kinetic equations:
|
```latex1-2x/3-{\left(1-x\right)}^{2/3}={k}_{e}t``` |
(13) |
Mixed diffusion controlled kinetic equations:
|
```latex\mathrm{l}\mathrm{n}\left(1-x\right)/3+{\left(1-x\right)}^{-1/3}-1={k}_{e}t``` |
(14) |
where: x is the Li+ leaching rate (%); ke denotes the reaction rate constant for the different control steps described above.
4.1.2. Kinetics of Li+ at Different Leaching Temperatures
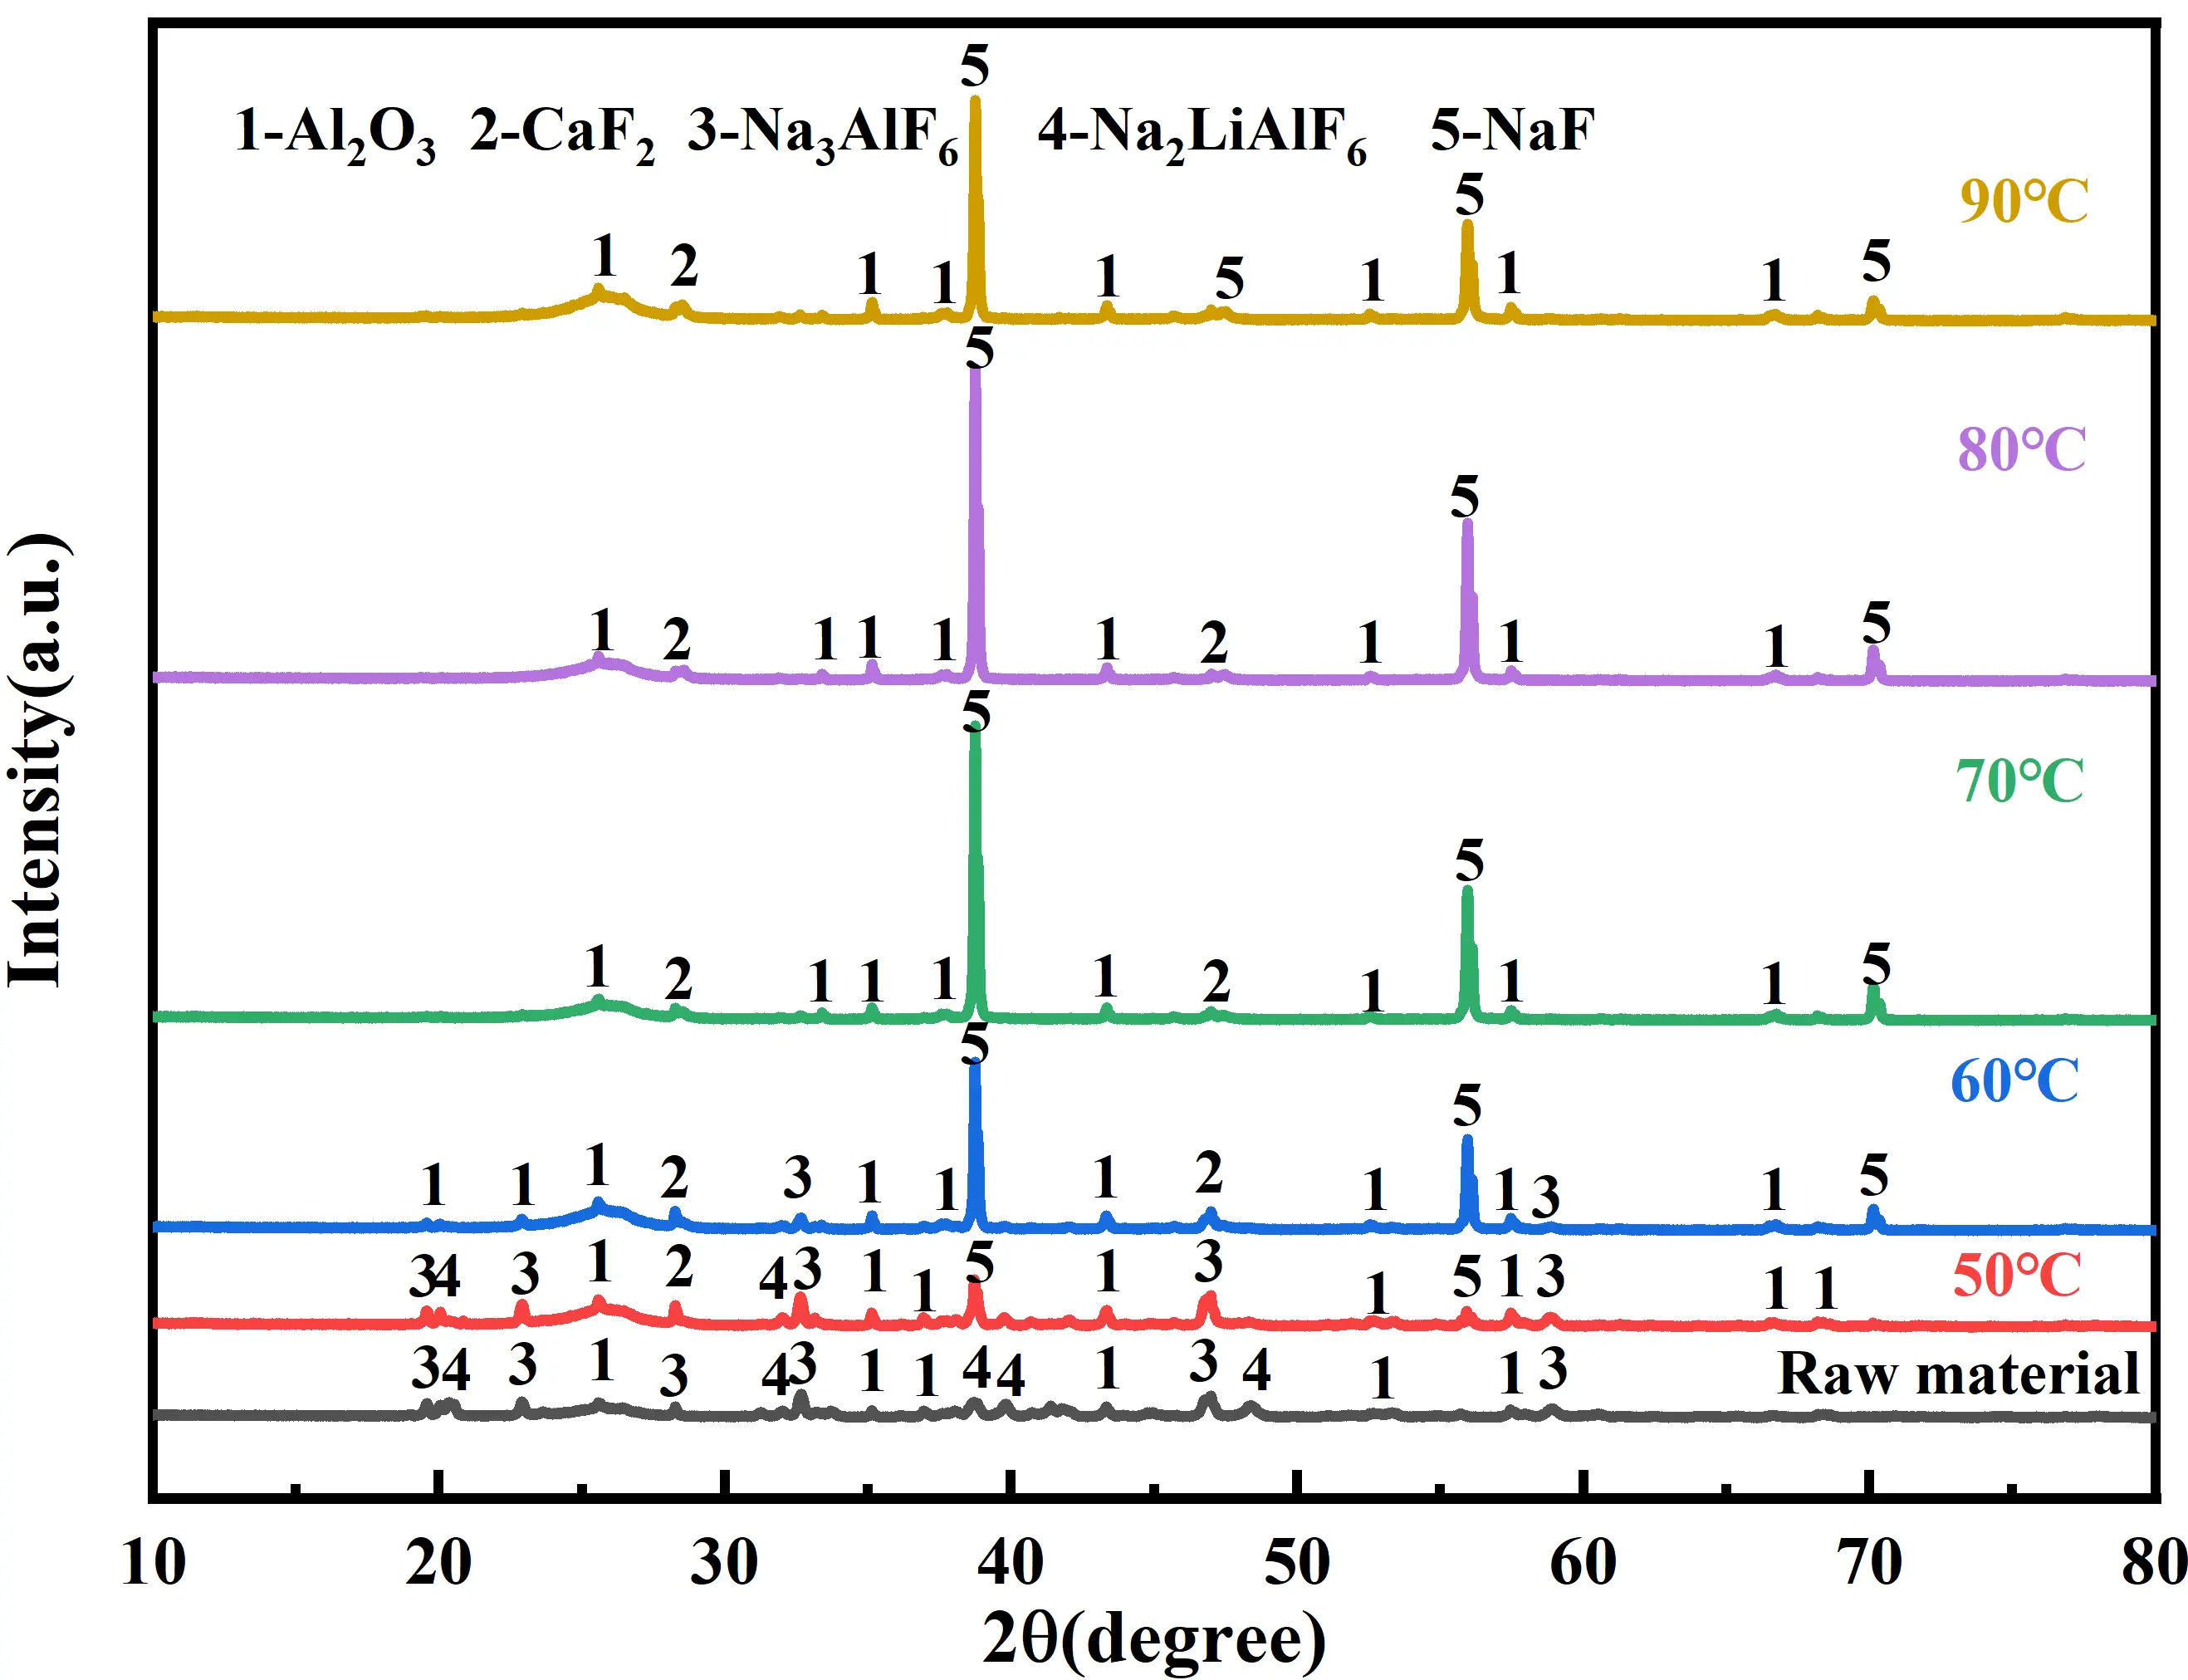
Under the experimental conditions of initial NaOH concentration of 10 mol/L, stirring speed of 500 rpm, and leaching liquid-solid ratio of 10:1, the variation rule of Li+ leaching rate with reaction time at different temperatures was investigated, as shown in Figure 7. As can be seen from Figure 7, increasing the temperature has a significant promotion effect on Li+ leaching at a certain leaching time. This is confirmed by the XRD patterns of the leaching residue at different reaction temperatures, where the diffraction peaks of cryolite/lithium cryolite are present in the leaching residue at the low temperature of 50 °C, and the lithium leaching rate is low. With increasing reaction temperature, molecular thermal motion intensified, the number of slag molecules participating in the reaction increased, the diffraction peak intensities of cryolite/lithium cryolite in the leaching residue weakened, and the leaching rate of lithium increased significantly to about 89%. Increasing temperature accelerates both the main lithium leaching reaction and the side reactions. However, the main reaction has a higher apparent activation energy, so it is more sensitive to temperature changes. Therefore, appropriately increasing temperature (up to 90 °C) preferentially enhances the lithium leaching rate while minimizing the relative impact of side reactions. This suggests that increasing the reaction temperature facilitates the efficient dissociation of cryolite/lithium cryolite from SCA. The main lithium leaching reaction (decomposition of Na2LiAlF6) has a higher apparent activation energy compared to side reactions involving Al2O3 and CaF2. This means increasing temperature preferentially accelerates the lithium leaching reaction. At temperatures below 70 °C, the main reaction proceeds slowly, resulting in low lithium extraction efficiency. At temperatures above 90 °C, side reactions become increasingly dominant, consuming excessive NaOH, increasing solution viscosity, and forming Ca(OH)2 and sodium silicate precipitates that coat unreacted particle surfaces and hinder mass transfer. Excessive temperature (>95 °C) causes partial evaporation of the leaching solution, leading to local supersaturation and premature precipitation of sodium fluoride salts. Therefore, 90 °C represents the optimal balance point where lithium leaching is maximized while side reactions are minimized.
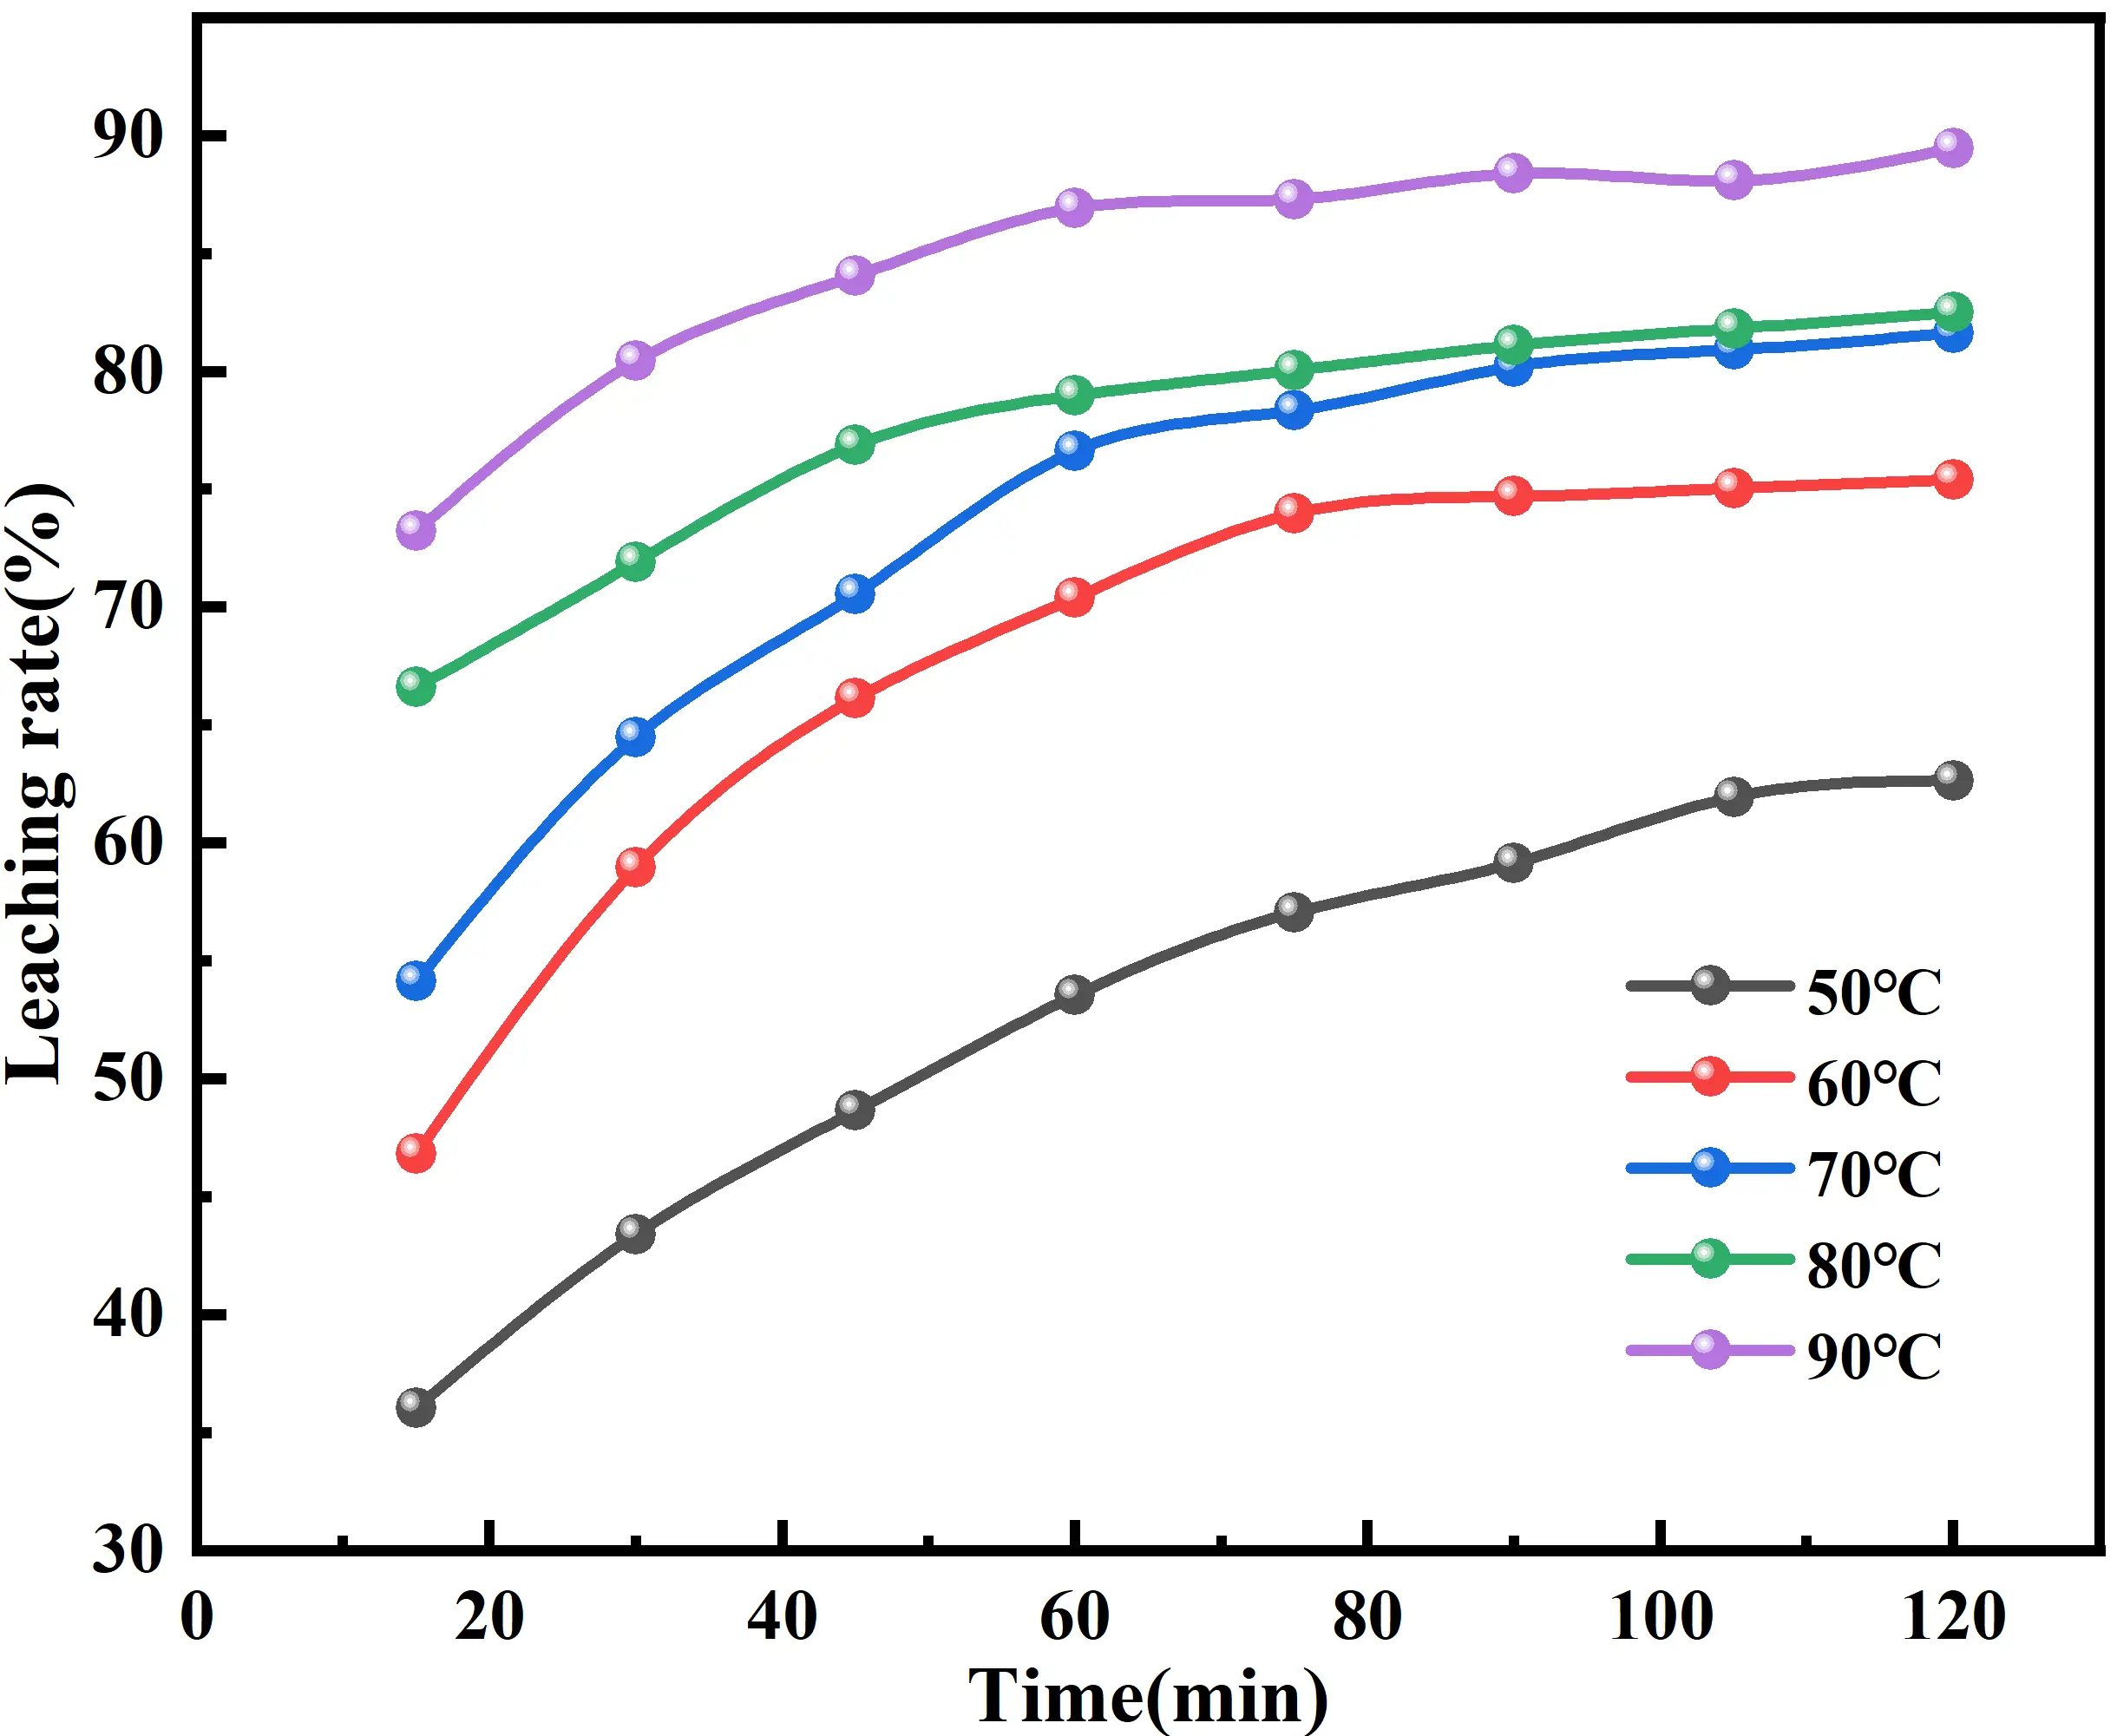
The rapid increase of Li+ leaching rate in 0–75 min, and the increasing trend of Li+ concentration slows down after 75 min, which is due to the chemical reaction between the liquid and solid phases tending to equilibrate with the increase of reaction time, thus Li+ can reach the leaching kinetic equilibrium in 75 min. Extending reaction time beyond 2 h does not significantly improve lithium recovery but increases the extent of side reactions, particularly the dissolution of silica and alumina impurities. This leads to higher reagent consumption, more complex leachate composition, and increased energy costs. The 2-h reaction time selected in this study thus provides the optimal trade-off between leaching efficiency, reagent utilization, and process economics. Therefore, the data of Li+ leaching rate with reaction time at different temperatures before 75 min were selected for kinetic fitting, and substituted into four kinetic equations, linear fitting was carried out with Origin software (Figure 7).
From Figure 8 and Table 3, it can be seen that when the leaching temperature is 50 °C, the fitting effect of the four rate control models is poor, in which the correlation coefficients R2 of the chemical reaction control equation and the external diffusion control equation are less than 0.95, and the mixed diffusion control model has the best fitting effect. Overall, the correlation coefficient R2 of the hybrid control model is larger than that of the diffusion control and chemical reaction control. Therefore, the chemical reaction and diffusion control together govern the whole process of cryolite/lithium cryolite alkali leaching of Li+. This is consistent with the findings of Chen et al. [32]. This could be the reason why carbon and cryolite/lithium cryolite in SCA are embedded in each other and form a mixture [33]. Thus, it was determined that the leaching of Li+ from SCA in NaOH solution is mainly controlled by mixed diffusion, both by diffusion and chemical reactions, indicating that the leaching temperature has a large influence on the whole process of alkali leaching of Li+.
Table 3. Leaching kinetic parameters of four rate control models at different temperatures.
|
Temperature (℃) |
External Diffusion Control 1 − (1 − x)2/3 |
Chemical Reaction Control 1 − (1 − x)1/3 |
Internal Diffusion Control 1 − 2/3x − (1 − x)2/3 |
Mixed Control ln(1 − x)/3 + (1 − x)−1/3 − 1 |
||||
|---|---|---|---|---|---|---|---|---|
|
k1 |
R2 |
k2 |
R2 |
k3 |
R2 |
k4 |
R2 |
|
|
50 |
0.00184 |
0.93290 |
0.00111 |
0.93719 |
0.000318 |
0.95137 |
0.000284 |
0.96070 |
|
60 |
0.00257 |
0.98290 |
0.00170 |
0.98708 |
0.000623 |
0.99296 |
0.000732 |
0.99305 |
|
70 |
0.00299 |
0.97553 |
0.00212 |
0.98289 |
0.000876 |
0.99098 |
0.00128 |
0.99931 |
|
80 |
0.00376 |
0.97128 |
0.00292 |
0.98073 |
0.001320 |
0.98618 |
0.00258 |
0.99297 |
|
90 |
0.00385 |
0.96336 |
0.00325 |
0.97792 |
0.00155 |
0.98330 |
0.00402 |
0.97477 |
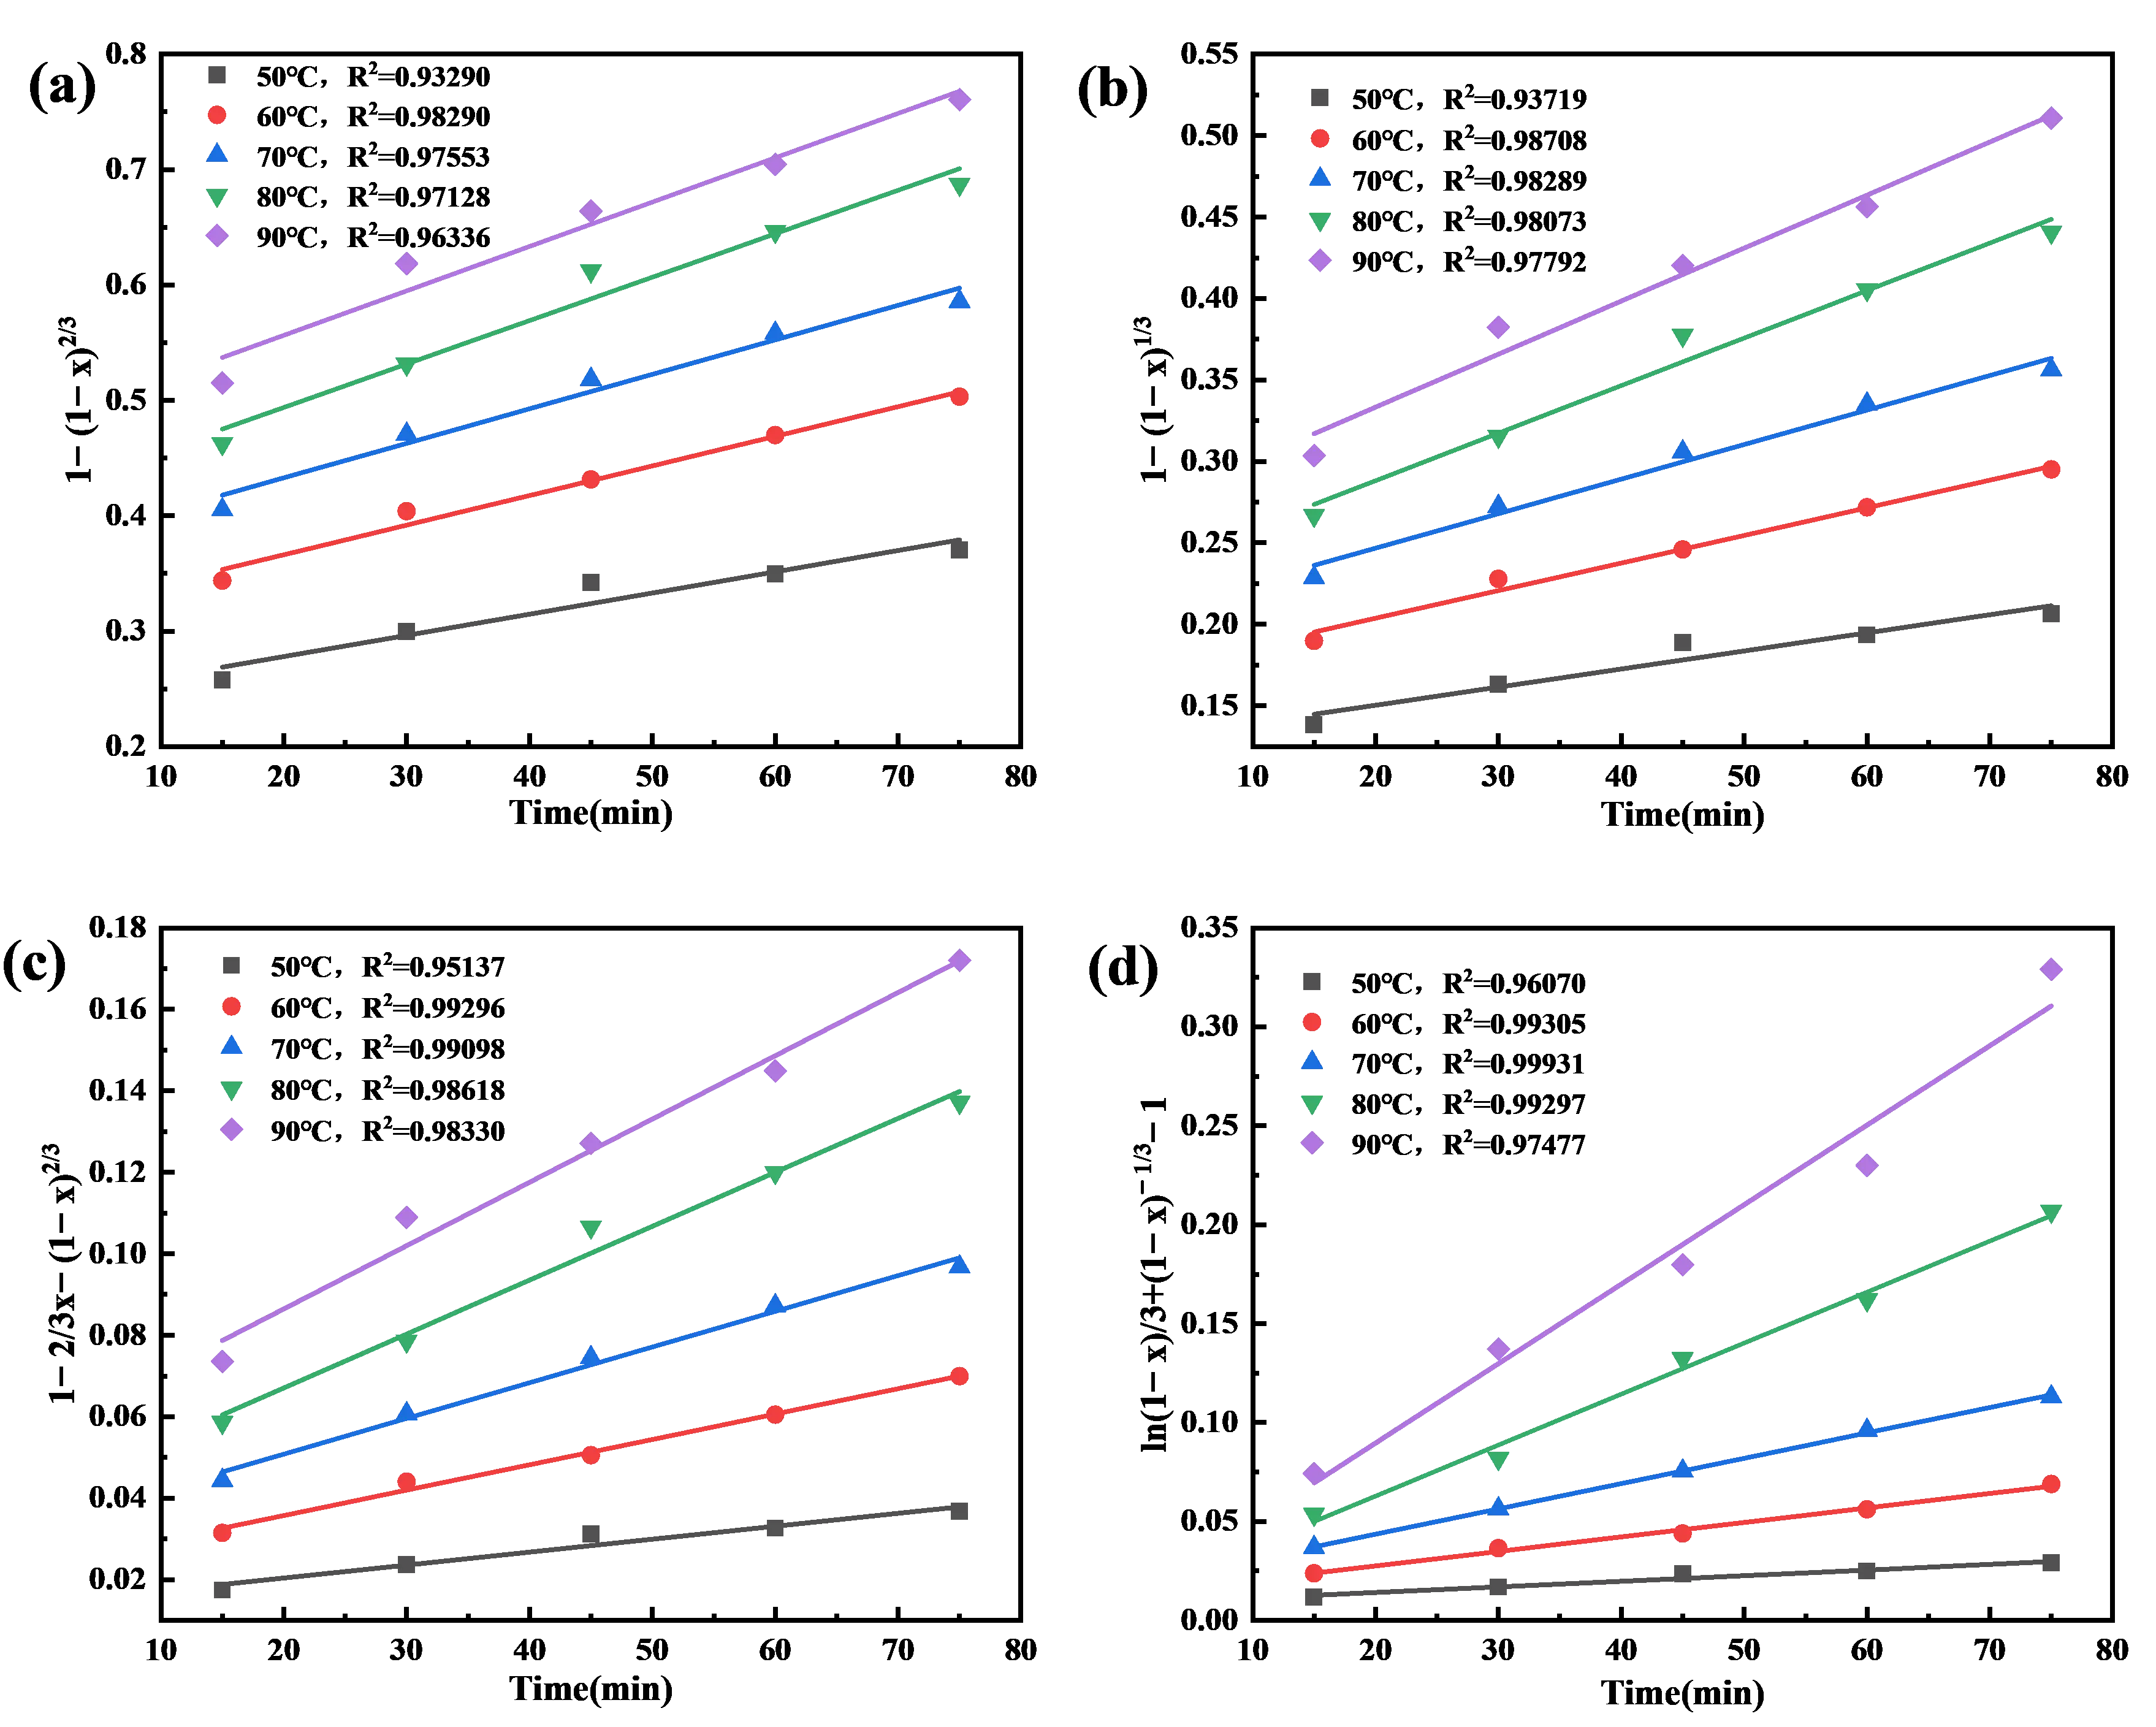
Figure 8. Plots of (a) external diffusion, (b) chemical reaction, (c) internal diffusion (d) mixing control model at different leaching temperatures.
To further elucidate the leaching phenomena, the above leaching data were substituted into the Arrhenius equation to determine the apparent activation energy (Ea) of the reaction at different leaching temperatures. According to the Arrhenius equation [34,35]:
|
```latexk=Aexp\left[-\frac{E}{RT}\right]``` |
(15) |
where: k is the reaction rate constant; A is the frequency factor; E is the apparent activation energy; R is the molar gas constant (R = 8.314 J/(mol·K)); T is the reaction temperature.
Taking logarithms on both sides of the above equation yields:
|
```latexlnk=-\frac{E}{RT}+lnA``` |
(16) |
The slope of the resulting fitted straight line was converted to give the apparent activation energy of the reaction process. Based on the data in Table 3, the results are plotted as lnk against 1/T and are shown in Figure 8.
As can be seen from Figure 9, the correlation coefficient R2 of the hybrid diffusion control model is 0.991, which is the most significant correlation and consistent with the above results. The apparent activation energies of the four models were calculated based on the relevant data in Table 4 as Ea external = 18.25 kJ/mol, Ea chemical = 26.35 kJ/mol, Ea internal = 38.46 kJ/mol, and Ea mixed = 64.15 kJ/mol, respectively. Leaching kinetics is usually considered as the leaching rate control step when the apparent activation energy is greater than 40 kJ/mol, and the chemical modelling of the interfacial reaction is controlled [36,37]. However, the activation energies of the four rate-control models for alkaline leaching of Li+ from SCA at different temperatures are higher than those described in the literature, which may be because the leaching rate of electrolytic aluminium residue leaching reaction is mainly controlled by the chemical reaction in the initial stage of the leaching reaction. The product layer becomes more and more, and the surface of the slag particles will form a passivated layer, which hampers lithium solubilisation, and thus leads to high activation energies of the leaching system.

Figure 9. Linear fit of lnk versus 1/T at different temperatures. (a) external diffusion control; (b) chemical reaction control; (c) internal diffusion control; (d) mixed diffusion control.
Table 4. Values of k and R2 for the rate control models.
|
Rate Control Modelling |
Slope k |
Correlation Coefficient R2 |
|---|---|---|
|
external diffusion |
−2.19453 |
0.94635 |
|
Chemical reaction control |
−3.16974 |
0.97520 |
|
Internal diffusion control |
−4.62603 |
0.96709 |
|
Mixed control |
−7.71582 |
0.99100 |
Combining the fit of the Li+ leaching rate with reaction time to the four kinetic equations at different temperatures shows that the correlation coefficient, R2, is closest to 1 for the mixed diffusion control. It is indicated that Li+ leaching from SCA is mainly controlled by mixing diffusion at a certain NaOH concentration and liquid-solid ratio. This also confirms that increasing the reaction temperature to a certain extent is indeed favourable to the leaching reaction and the leaching efficiency.
4.1.3. Kinetics of Li+ at Different Leaching Concentrations
Under the leaching temperature of 90 °C, stirring speed of 500 rpm, and leaching liquid-solid ratio of 10:1, the variation rule of Li+ leaching rate with reaction time at different temperatures was investigated, and the results are shown in Figure 10. At a certain leaching time, the leaching rate of Li+ was maintained at a low level up to 51.34% when the NaOH concentration was 2/4 mol/L. There was a significant increase in the leaching rate of lithium when the NaOH concentration was 6/8/10 mol/L. Therefore, NaOH concentration is an important factor affecting the leaching rate of Li+, which gradually increases with NaOH concentration. When the NaOH concentration was 10 mol/L, the leaching time was 2 h, and the leaching temperature was 90 °C, the leaching rate of Li+ could reach 89.46%. Excess Na+ in solution can gradually replace lithium in lithium cryolite, and the increase in Li+ can be attributed to highly alkaline conditions [23,38]. At pH < 14.5 (≤4 mol/L NaOH), the system cannot provide sufficient OH− to break the strong Al–F bonds in cryolite, and free F− combines with Li+ to form insoluble LiF precipitates. At pH 14.5–14.9 (4–6 mol/L NaOH), aluminum-containing phases gradually dissolve into soluble [Al(OH)4]− ions, and lithium extraction efficiency increases rapidly from 42% to 89%. At pH > 14.9 (>6 mol/L NaOH), excess OH− completely decomposes all lithium-bearing phases, but also increases the dissolution of impurity elements such as Si and Fe.
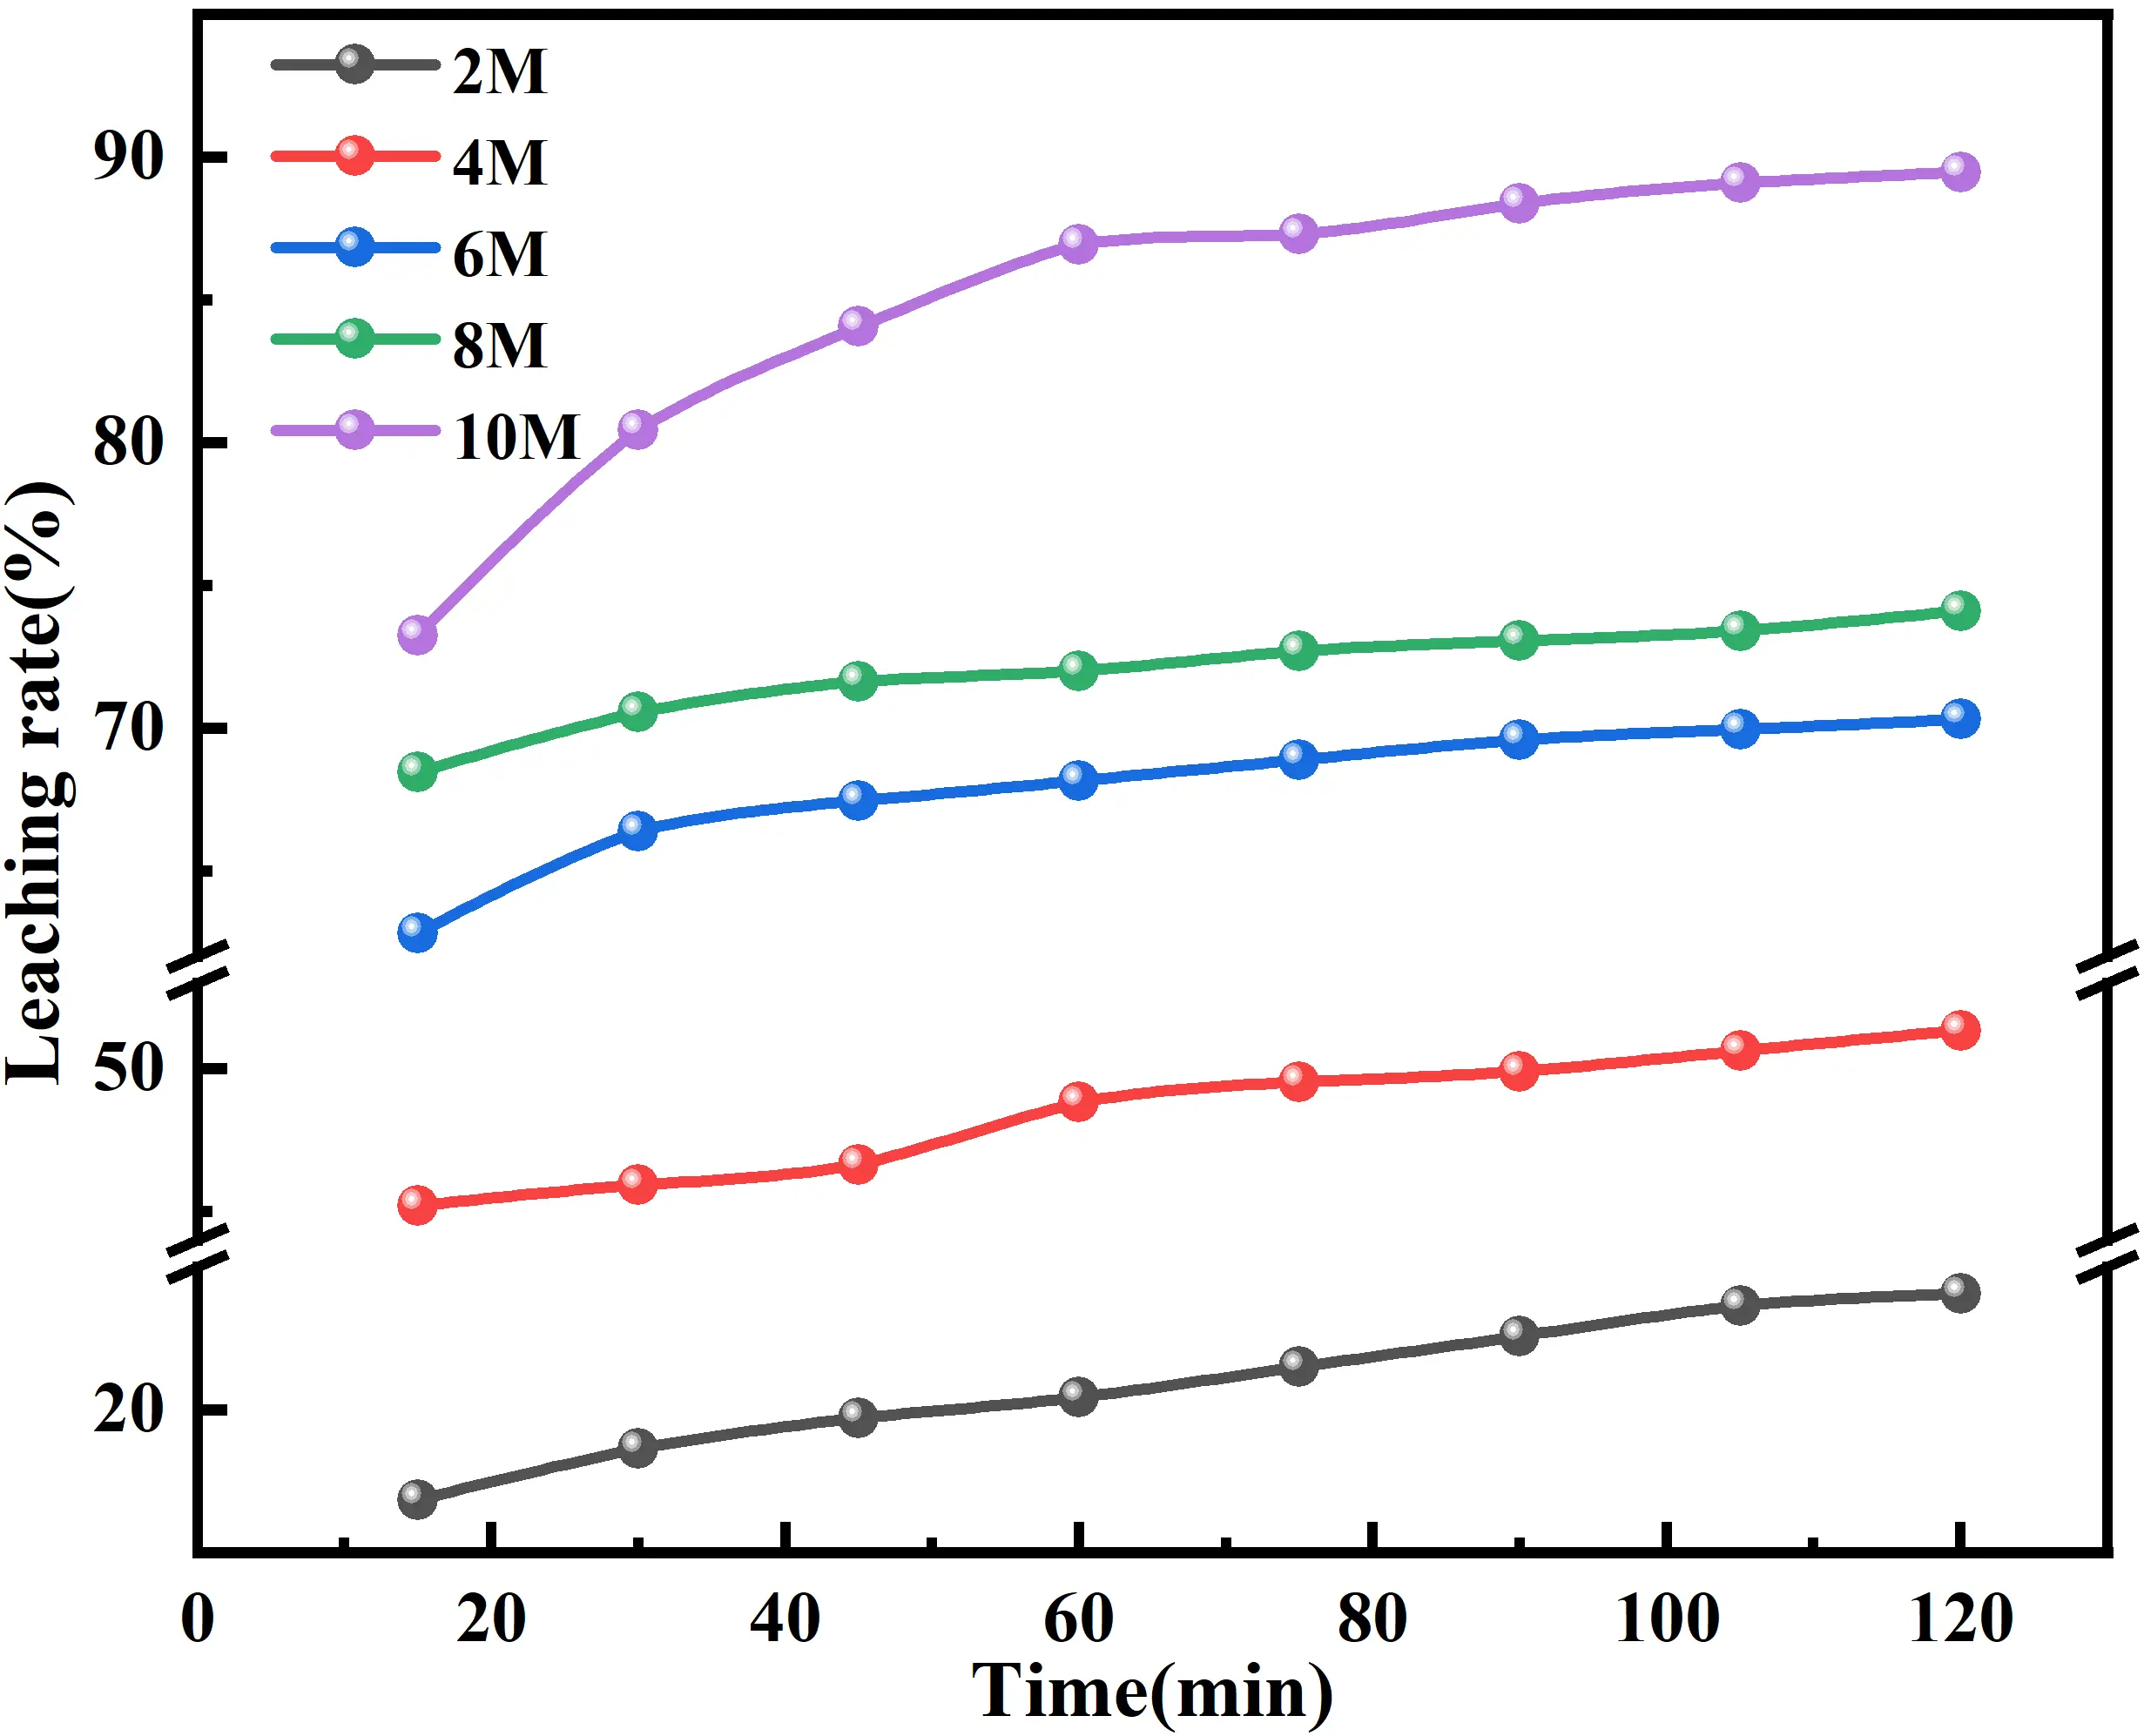
The Li+ leaching rate increased faster in 0–75 min, and the upward trend slowed down after 75 min, which was because, with the increase of NaOH concentration, the amount of NaOH per unit volume gradually increased, which increased the contact chance between NaOH and slag, and then affected the leaching kinetic equilibrium of Li+ so that the leaching rate of Li+ increased. The Li+ reached the leaching kinetic equilibrium at the late stage of the reaction, so the leaching rate gradually stabilised. Meanwhile, from the XRD patterns of the leaching residue at different NaOH concentrations, it can be seen that the intensity of the diffraction peaks of the cryolite/lithium cryolite phases in the leaching residue gradually weakened with the increase of the NaOH concentration, and the diffraction peaks disappeared when the concentration of NaOH was 10 mol/L, which further indicated that the increase of the concentration of NaOH could effectively promote the decomposition of cryolite/lithium cryolite. High ionic strength reduces the activity coefficient of Li+ and F− ions, shifting the LiF dissolution-precipitation equilibrium to the left and slightly decreasing lithium solubility. Increased ionic strength compresses the electric double layer around fine particles, reducing electrostatic repulsion and promoting particle aggregation. At ionic strength >8 mol/L, the viscosity of the leaching solution increases significantly, which slows down the settling velocity of fine precipitates and deteriorates solid-liquid separation performance. The data of the change rule of Li+ leaching rate with reaction time at different NaOH concentrations before 75 min were selected for kinetic fitting, and substituted into four kinetic equations, linear fitting was carried out by Origin software, and the fitting results are shown in Figure 11.
The fitting results in Figure 11 show that the correlation coefficient R2 for the hybrid control model is greater than the correlation coefficient R2 for the diffusion control and chemical reaction control. This process has the most significant correlation with the kinetic equation for mixing diffusion. The slopes of the straight lines fitted to the four rate control models with time at different NaOH concentrations were used to obtain the corresponding k values at different NaOH concentrations, as shown in Table 5.
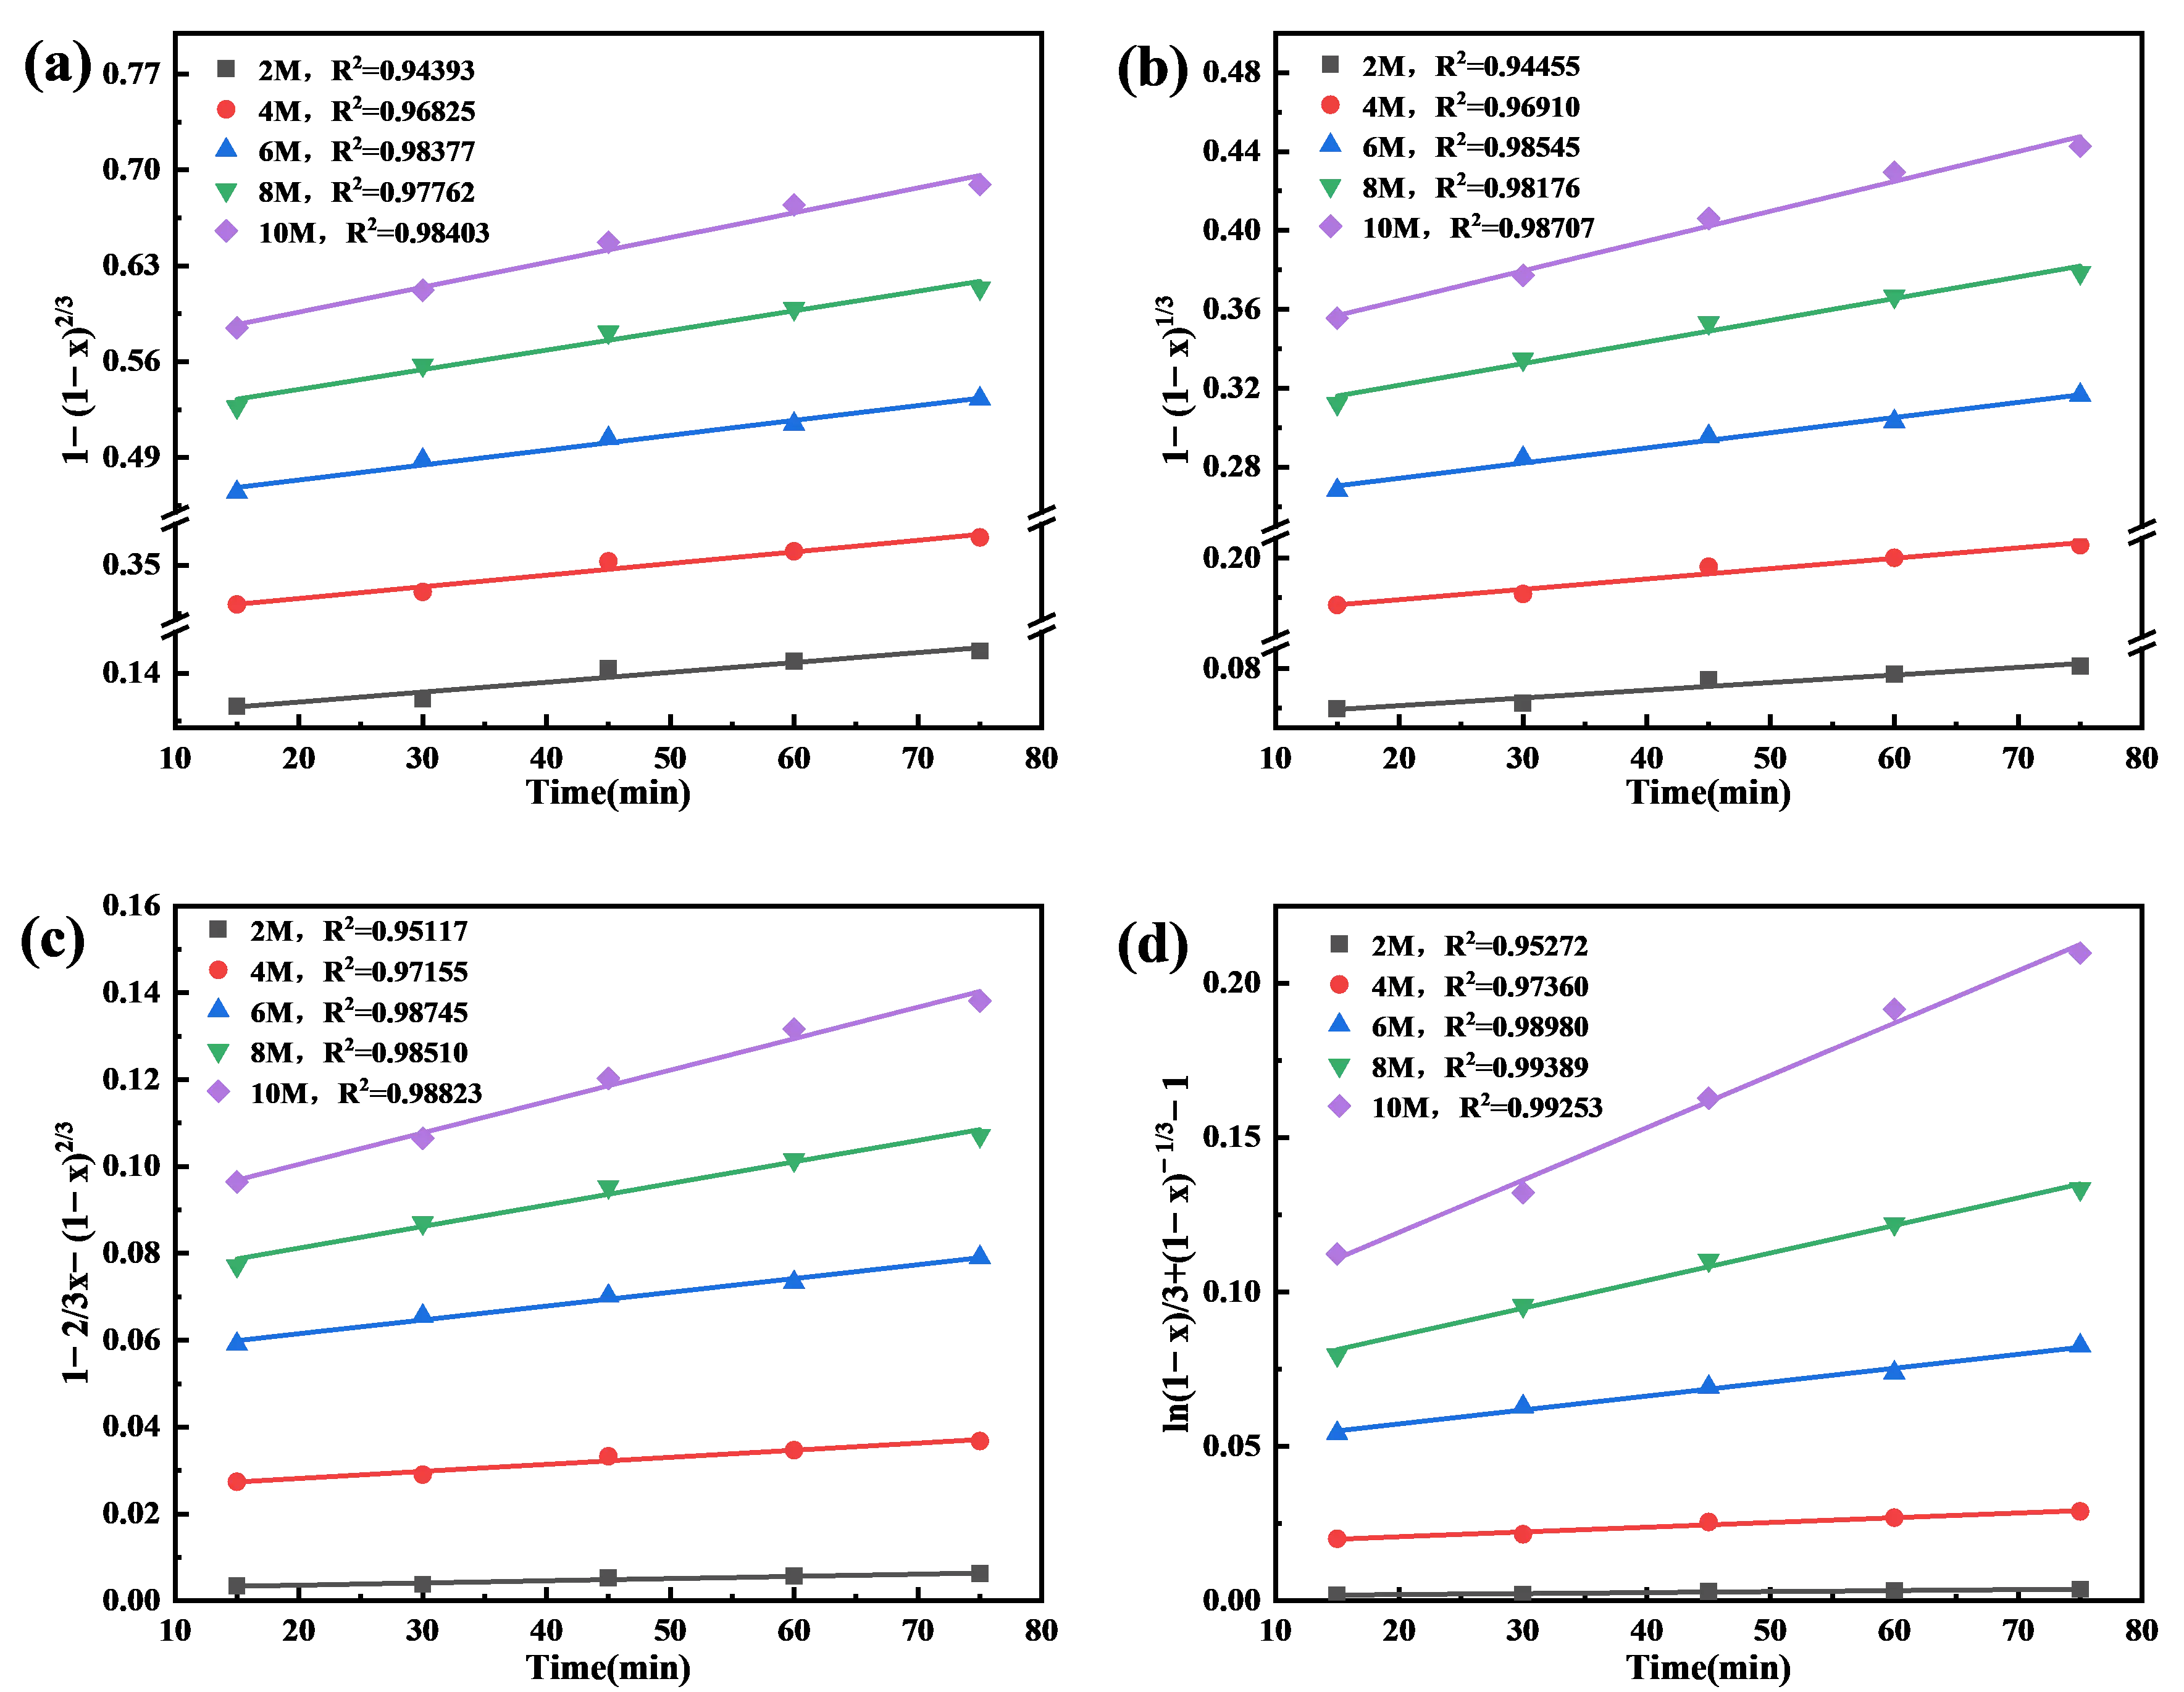
Figure 11. Plot of (a) external diffusion, (b) chemical reaction, (c) internal diffusion (d) mixing control model at different NaOH concentrations versus t.
Table 5. k values of four rate control models at different NaOH concentrations.
|
Rate Control Modelling |
Slope k |
Correlation Coefficient R2 |
|---|---|---|
|
external diffusion |
0.56201 |
0.91073 |
|
Chemical reaction control |
0.83501 |
0.94180 |
|
Internal diffusion control |
1.64724 |
0.99984 |
|
Mixed control |
2.46586 |
0.99871 |
The data in Table 5 were fitted by lnk and lnC to obtain a curve of lnk versus lnC, as shown in Figure 12.

Figure 12. Linear fit of lnk to lnC for four rate control models with different NaOH concentrations. (a) external diffusion control; (b) chemical reaction control; (c) internal diffusion control; (d) mixed diffusion control.
From Figure 11, the linear correlation coefficient R2 = 0.99871 of the mixing diffusion control models indicated that the correlation is significant. According to the slope of its linear equation can be obtained NaOH leaching lithium extraction of the number of reaction stages is 2.47. The number of reaction stages is an important indicator of the effect of NaOH concentration on the Li+ leaching rate, and the larger the number of reaction stages, the higher the concentration of leaching agent required for the leaching reaction. This is consistent with the results of the effect of different NaOH concentrations on the leaching rate of Li+, indicating that increasing the NaOH concentration has a significant effect on the leaching rate of Li+.
4.2. Physical Phase Transformation During Leaching
During the experiment, it was observed that the solid-liquid separation of leaching became difficult when the alkali concentration increased, and it was guessed that there might be the generation of new substances in the leaching process, which led to the difficulty of the leaching process. Therefore, XRD analyses were carried out on the leaching residues under the conditions of different alkali concentrations and different leaching temperatures.
As shown in Figure 13, the diffraction peaks of Na3AlF6/Na2LiAlF6 gradually became weaker or even disappeared with the gradual increase of NaOH concentration. The diffraction peaks of Na3AlF6/Na2LiAlF6 basically disappeared when the concentration of NaOH was 10 mol/L, and the diffraction peaks of LiF appeared when the concentration of NaOH was 2/4 mol/L. At low NaOH concentrations (2–4 mol/L), the OH− dosage is insufficient to decompose lithium-bearing cryolite phases fully. The released free F− ions combine with Li+ in the system to form insoluble lithium fluoride (LiF) precipitates, leading to distinct LiF diffraction peaks in the XRD patterns of the leaching residues. In contrast, at high NaOH concentrations, sufficient OH− promotes the complete dissolution of Li-containing phases and LiF into the alkaline solution, so the LiF peaks disappear. Therefore, it was inferred that the original low leaching rate of Li+ at the low concentration might be due to the limited structural disruption of Na3AlF6/Na2LiAlF6 and the presence of LiF. With the gradual increase of NaOH concentration, LiF and Na3AlF6/Na2LiAlF6 gradually dissolved and diffraction peaks of sodium fluoride (NaF) began to appear [39]. The intensity of its diffraction peaks gradually increased with increasing alkali concentration. When the concentration of NaOH gradually becomes larger, the aqueous solution gradually begins to be saturated. As the reaction with the raw material occurs, a large number of fine amorphous fluoride precipitates and hydrated sodium aluminate-containing micro-gels into the solution. Besides, the viscosity of highly concentrated NaOH solution becomes higher, thus increasing the difficulty of solid-liquid separation.
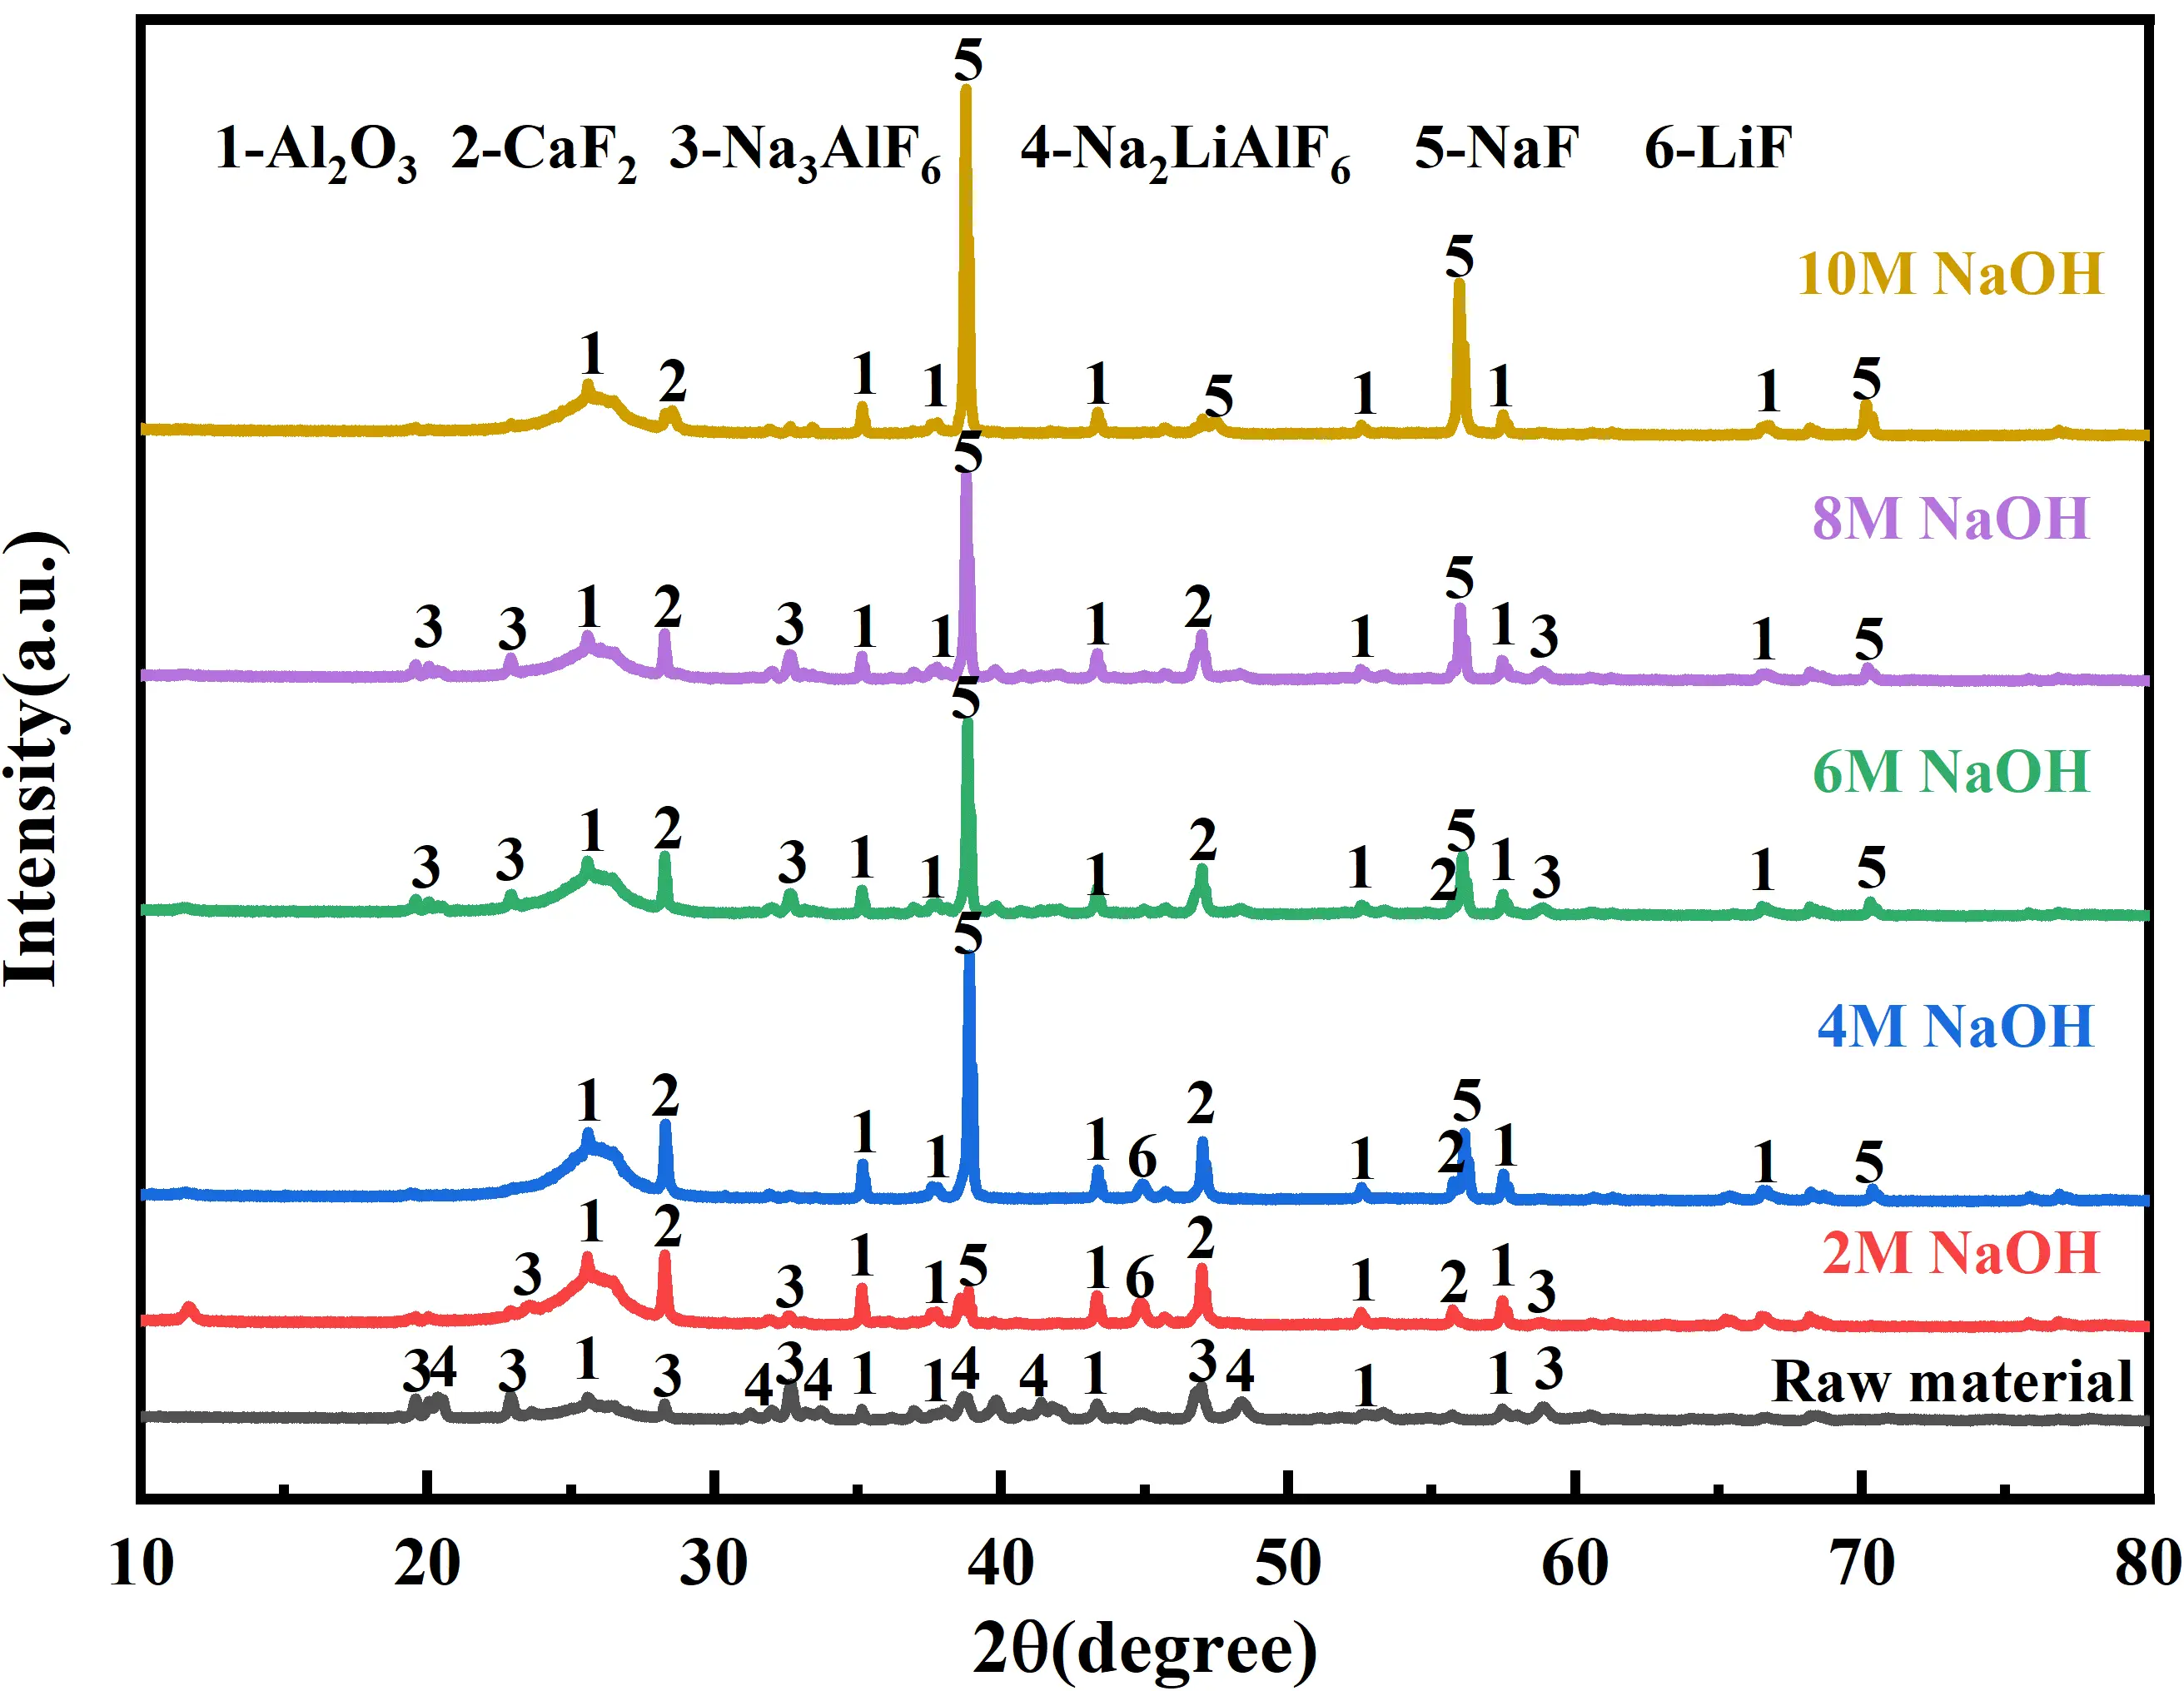
Figure 14 shows that when the leaching temperature is 50 and 60 °C, the structure of most of the phases in the slag is not destroyed, and the intensity of the diffraction peaks of Na3AlF6/Na2LiAlF6 in the leaching residue gradually weakened to disappear with the increase of the leaching temperature, indicating that the increase of the temperature is conducive to the destruction of the structure of Na3AlF6/Na2LiAlF6, and the diffraction peaks of sodium fluoride (NaF) in the system gradually strengthened with the increase of the leaching temperature. The diffraction peak of sodium fluoride (NaF) in the system was also gradually enhanced with the increase in leaching temperature. Combined with thermodynamic calculations for the reaction of cryolite in NaOH, ∆G < 0 for the reaction of Na3AlF6, LiF, etc., with NaOH at the experimental temperatures suggests that alkali immersion dissolves Na3AlF6/Na2LiAlF6 and releases soluble ions.
4.3. SEM-EDS Analysis of Leaching Sludge
The leaching slag at different NaOH concentrations was analysed for micro-morphology and EDS (Figure 15a–d). The SEM images of the raw materials are shown in Figure 1c. The SEM images of the feedstock show that cryolite/lithium cryolite has a dense, massive structure (Figure 1c). The elements Na, Al, and F are observed in the EDS maps of both Figure 1c and Figure 15, which are due to the presence of cryolite/lithium cryolite. SEM images of the feedstock show that cryolite/lithium cryolite has a dense, massive structure (Figure 1c). The elemental O observed in both the feedstock and the leaching slag is due to the presence of Al2O3. This is consistent with Mao and Zhang, who found that carbon slag mainly comprises cryolite, lithium cryolite, and graphite[33]. With increasing NaOH concentration, the cryolite/lithium cryolite structure dissociates, and C is dispersed in the leaching slag. With increasing NaOH concentration, strong OH− promotes the decomposition and leaching of Al-bearing phases into soluble tetrahydroxyaluminate ions ([Al(OH)4]−), resulting in continuous loss of Al element from solid residues. Excess Na+ from high-concentration NaOH is adsorbed onto the surface of leaching residues or incorporated into newly formed sodium-rich fluoride precipitates. The solid-phase Na content increases while solid-phase Al decreases, jointly raising the Na/Al atomic ratio in residues. The leaching slag SEM images were enlarged by 6000 times to gain a deeper understanding of the morphological changes during the phase transition of cryolite. After leaching at 4 mol/L NaOH leaching concentration, the layered structure of cryolite can be observed (Figure 15b). As the NaOH concentration continued to increase, the cryolite/lithium cryolite structure continued to decompose, and the release of Na+, Al3+, Li+, etc. made the leached slag structure looser. At low NaOH concentrations (2–4 mol/L), leached residues retain the original dense, blocky particle morphology with smooth surfaces. Only sporadic, tiny pores appear, indicating weak corrosion from alkali leaching, and the particle structure remains intact. At medium NaOH concentrations (4–6 mol/L): Severe alkali corrosion occurs on particle surfaces, forming obvious etched pits and microcracks; some large particles break into smaller fragments. At high NaOH concentrations (>6 mol/L): Intense alkaline dissolution destroys the original compact structure. Particles are significantly refined with abundant interconnected porous structures, and loose flocculent amorphous precipitates cover particle surfaces, leading to a highly porous and fragmented residue morphology.
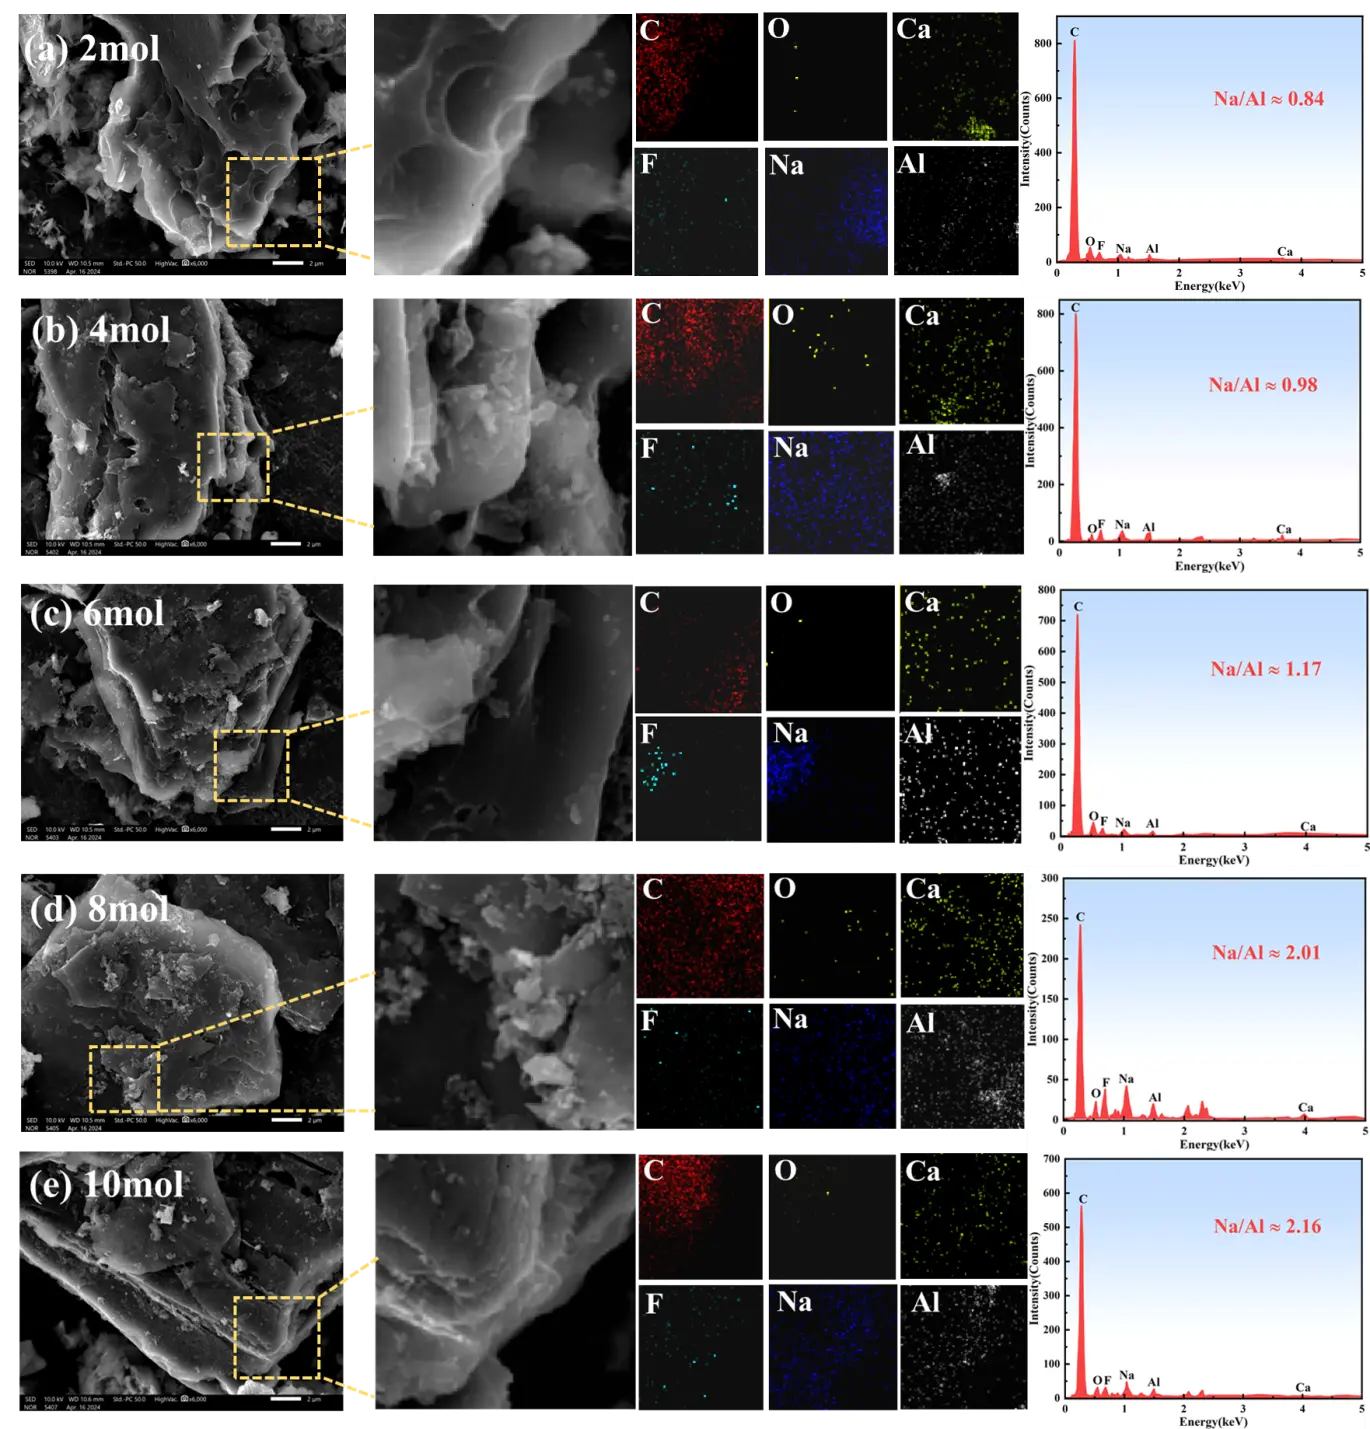
Figure 15. SEM-EDS analyses of leaching slags at different NaOH concentrations. (a) 2 mol; (b) 4 mol; (c) 6 mol; (d) 8 mol; (e) 10 mol.
Under the effect of turbulent agitation, C and cryolite/lithium cryolite minerals are successively stripped, and the lamellar structure of leaching slag becomes obvious [40]. From the EDS analysis, it was concluded that the Na/Al ratio gradually becomes larger with the increase of leaching agent concentration. This is due to the increase in Na+ in the solution resulting from Na+ supplied by the leaching agent, and to the formation of NaF from Na+ and F− in the residue, consistent with the XRD results in Figure 13. Although Li could not be detected by SEM-EDS, this was a great help in analysing the whole alkaline leaching process.
4.4. Evaluation of Alkaline Leaching Process
The direct alkaline leaching process using NaOH proposed in this study exhibits significant environmental friendliness compared with conventional acid leaching and roasting processes. During traditional acid leaching, fluorides in SCA react with strong acids, generating highly toxic hydrogen fluoride gas. In contrast, fluoride ions combine with sodium ions to form stable sodium fluoride precipitates during alkaline leaching, resulting in zero toxic gas emissions. Meanwhile, alkaline leaching avoids atmospheric pollutants such as fluorine-containing dust, sulfur dioxide, and nitrogen oxides produced by roasting processes. Acid leaching generates substantial amounts of neutralization sludge, which remains classified as hazardous waste due to its high concentrations of fluorides and heavy metals and requires secure landfill disposal. In the leaching residue obtained in this study, fluorine exists in the stable forms of CaF2 and NaF, whose toxic leaching concentrations are far below the limit values specified in hazardous waste identification standards. The alkaline leaching process achieves the directional conversion of fluorine and aluminum resources: the leachate can be regenerated into cryolite via simple carbonization or acidification treatment, which can be directly recycled back to aluminum electrolytic cells.
In this study, a lithium leaching rate of 89.46% was achieved at 90 °C under atmospheric pressure within 2 h, which is significantly superior to conventional processes. The alkaline leaching process eliminates the need for high-pressure equipment and high-temperature roasting furnaces, shortening the process flow by more than 50% and significantly reducing operational complexity. Alkaline leaching demonstrates high selectivity for lithium: while lithium, aluminum, and fluorine are dissolved, most impurities, such as carbon, calcium, and silicon, remain in the leaching residue. This results in a relatively simple leachate composition, facilitating subsequent lithium separation and purification. Notably, the aluminum-containing alkaline solution generated by this process can be directly integrated into existing cryolite regeneration production lines in aluminum electrolysis plants without large-scale new construction, greatly lowering the technical threshold and investment risk for industrial application.
The alkaline leaching process has low capital investment as it does not require high-temperature roasting furnaces, high-pressure reactors, or complex tail gas treatment systems. The fixed asset investment is only 30–40% of that for roasting processes and 50–60% of that for acid leaching processes. The main reagent consumption of this process is NaOH. Although NaOH has a relatively high price, acid leaching processes require large amounts of acid (e.g., 1.5 tons of nitric acid per ton of SCA) and neutralizing alkali (e.g., 2.0 tons of NaOH per ton of SCA), resulting in higher total reagent costs than alkaline leaching. Furthermore, the alkaline leaching process can recover approximately 0.6–0.7 tons of cryolite per ton of SCA, and this by-product revenue can offset about 50% of the operating costs.
Despite the remarkable advantages of the alkaline leaching process, several critical issues remain to be addressed:
The use of 10 mol/L NaOH solution leads to relatively high reagent costs. This limitation can be addressed in future studies by developing low-concentration alkaline leaching coupled with enhanced leaching technologies, such as ultrasound assistance and mechanical activation, to reduce alkali consumption. The high concentration of aluminum in the leachate adversely affects the precipitation efficiency of lithium. Therefore, efficient lithium-aluminum separation technologies, including selective extraction and membrane separation, need to be further developed. The fine NaF microcrystals formed during the leaching process tend to cause difficult solid-liquid separation. It is necessary to optimize the crystallization conditions to promote the growth of NaF crystals and improve the solid-liquid separation performance.
5. Conclusions
This study describes an environmentally friendly process based on the efficient leaching of lithium from SCA using NaOH as a leaching agent. Thermodynamic calculations confirmed that cryolite (Na3AlF6) and lithium fluoride (LiF) can react with NaOH to release Li+ during alkaline leaching. The E–pH diagrams revealed that the dissociated Al3+ would first form an Al(OH)3 complex and then continue to react with OH− to form Al(OH)4−, while lithium has two existing forms of Li+ and LiOH. The kinetics of alkali leaching of Li+ from residue demonstrated that the rate of Li+ leaching was by the ‘unreacted shrinking nucleus model’, and that the leaching process was controlled by mixing and diffusion. It was concluded that NaOH concentration and leaching temperature are the key factors governing the effectiveness of Li+ leaching. Increasing the concentration of NaOH and increasing the temperature of the reaction system are both favourable for the leaching of Li+. At a NaOH concentration of 10 mol/L and a leaching temperature of 90 °C, the leaching rate of lithium can reach 89.46%. This conclusion is confirmed by the results of the alkali leaching kinetics. Excess Na+ in the system, combined with F− is involved in the generation of the new physical phase sodium fluoride (NaF). The whole alkaline system also facilitates the subsequent repair and regeneration of cryolite. SEM-EDS reveals that NaOH promotes the breaking of Na–Al–F bonds and thus the release of Li+ into the leaching solution. In this study, efficient lithium leaching from SCA was achieved under milder conditions, avoiding the excessive process length associated with acid leaching and roasting, and the environmental harm caused by the exhaust gases produced. It provides a new channel for the efficient leaching of lithium.
The approach demonstrated in this work provides a general methodology for recovering lithium from various fluoride-containing wastes, including spent pot liners, aluminum dross, and lithium-ion battery recycling residues. Future research should focus on developing low-concentration alkaline leaching technologies to reduce reagent consumption and optimizing lithium-aluminum separation processes to obtain high-purity lithium products. The proposed route realizes efficient recovery of secondary lithium resources from SCA and directional transformation of fluorine containing impurities into regenerated cryolite, which synchronously accomplishes resource recycling, solid waste reduction and high value added by product preparation. However, high NaOH consumption increases operational costs; the deep separation efficiency of lithium and fluoride in alkaline leachate needs further improvement; complex impurity components in real industrial spent carbon anode slag may affect leaching stability. It needs to explore precise regeneration and purification technology of cryolite and achieve synergistic recovery of multiple valuable elements from electrolytic aluminum solid waste.
Author Contributions
Conceptualization, Y.Q. and J.G.; Methodology, Y.Q.; Investigation, Z.P. and X.Z.; Writing—Original Draft Preparation, X.N. and Y.L.; Writing—Review & Editing, X.N. and X.L.; Project administration, Y.Q. and Y.G.
Ethics Statement
Not applicable.
Informed Consent Statement
Not applicable.
Data Availability Statement
The raw/processed data required to reproduce these findings cannot be shared at this time as the data also forms part of an ongoing study.
Funding
The authors gratefully acknowledge for the work funded by Open Foundation of State Key Laboratory of Mineral Processing (BGRIMM-KJSKL-2026-21), National Natural Science Foundation of China Joint Fund Key Project (U25A20369), and the Shanxi Province Science Foundation for Youths (202303021212021).
Declaration of Competing Interest
No conflict of interest exits in the submission of this manuscript, and manuscript is approved by all authors for publication. I would like to declare on behalf of my co-authors that the work described was original research that has not been published previously, and not under consideration for publication elsewhere, in whole or in part. All the authors listed have approved the manuscript that is enclosed.
References
-
An JW, Kang DJ, Tran KT, Kim MJ, Lim T, Tran T. Recovery of lithium from Uyuni salar brine. Hydrometallurgy 2012, 117–118, 64–70. DOI:10.1016/j.hydromet.2012.02.008 [Google Scholar]
-
Braga PFA, França SCA, Gonçalves CC, Ferraz PFV, Neumann R. Extraction of lithium from a montebrasite concentrate: Applied mineralogy, pyro- and hydrometallurgy. Hydrometallurgy 2020, 191, 105249. DOI:10.1016/j.hydromet.2020.105249 [Google Scholar]
-
Chen W, Li X, Chen L, Zhou G, Lu Q, Huang Y, et al. Tailoring hydrophobic deep eutectic solvent for selective lithium recovery from the mother liquor of Li2CO3. Chem. Eng. J. 2021, 420, 127648. DOI:10.1016/j.cej.2020.127648 [Google Scholar]
-
Sverdrup HU, Ragnarsdottir KV, Koca D. Aluminium for the future: Modelling the global production, market supply, demand, price and long term development of the global reserves. Resour. Conserv. Recycl. 2015, 103, 139–154. DOI:10.1016/j.resconrec.2015.06.008 [Google Scholar]
-
Qin YH, Chen C, Yang ZY, Guo YX, Cheng FQ, Gao JM. Sources, hazards, and resource utilization of electrolytic aluminum slag: A review. Powder Technol. 2026, 468, 121662. DOI:10.1016/j.powtec.2025.121662 [Google Scholar]
-
Qin YH, Niu XD, Li XL, Liu YJ, Gao JM, Pan ZH, et al. Alkaline leaching lithium from spent carbon anode and coupling of extraction carbonization for cryolite regeneration. Green Chem. Technol. 2026, 3, 10005. DOI:10.70322/gct.2026.10005 [Google Scholar]
-
Gil A, Korili SA. Management and valorization of aluminum saline slags: Current status and future trends. Chem. Eng. J. 2016, 289, 74–84. DOI:10.1016/j.cej.2015.12.069 [Google Scholar]
-
Hu K, Reed D, Robshaw TJ, Smith RM, Ogden MD. Characterisation of aluminium black dross before and after stepwise salt-phase dissolution in non-aqueous solvents. J. Hazard. Mater. 2021, 401, 123351. DOI:10.1016/j.jhazmat.2020.123351 [Google Scholar]
-
Wan B, Li W, Sun W, Liu F, Chen B, Xu S, et al. Synthesis of cryolite (Na3AlF6) from secondary aluminum dross generated in the aluminum recycling process. Materials 2020, 13, 3871. DOI:10.3390/ma13173871 [Google Scholar]
-
Wu S, Tao W, Zheng Y, Ge H, He J, Yang Y, et al. A novel approach for lithium recovery from waste lithium-containing aluminum electrolyte by a roasting-leaching process. Waste Manag. 2021, 134, 89–99. DOI:10.1016/j.wasman.2021.08.011 [Google Scholar]
-
Wu S, Tao W, Zheng Y, Yang Y, Yu J, Cui J, et al. Novel process for the extraction of lithium carbonate from spent lithium-containing aluminum electrolytes by leaching with aluminum nitrate and nitric acid. Hydrometallurgy 2020, 198, 105505. DOI:10.1016/j.hydromet.2020.105505 [Google Scholar]
-
Tang C, Wang J, Yang S, Zhang X, Li S, Lai Y, et al. Efficient extraction and recovery of lithium from waste aluminum cryolite electrolyte. Resour. Conserv. Recycl. 2023, 197, 107070. DOI:10.1016/j.resconrec.2023.107070 [Google Scholar]
-
Lv Y, Ma B, Liu Y, Wang C, Chen Y. A sustainable method for lithium recovery from waste liquids: Thermodynamic analysis and application. J. Environ. Chem. Eng. 2024, 12, 111814. DOI:10.1016/j.jece.2023.111814 [Google Scholar]
-
Wang W, Chen W, Liu H. Hydrometallurgical preparation of lithium carbonate from lithium-rich electrolyte. Hydrometallurgy 2019, 185, 88–92. DOI:10.1016/j.hydromet.2019.02.013 [Google Scholar]
-
Chen BS, Xiong JR, Xu XY, Xia HY, Yang WZ, Zhang LB. Study on the recovery process of fluorine/sodium and carbon resources in the residual anode of electrolytic aluminum by ultrasonic synergistic alkali leaching. Chem. Eng. Process. Process Intensif. 2026, 219, 110651. DOI:10.1016/j.cep.2025.110651 [Google Scholar]
-
Liu ZB, He ZK, Liu BQ, Tao WJ, Yang JX, Li JM, et al. Mechanochemical treatment and valorization of hazardous fluorine from aluminum electrolyte in spent carbon anodes. J. Environ. Chem. Eng. 2025, 13, 117988. DOI:10.1016/j.jece.2025.117988 [Google Scholar]
-
Zheng ZC, Tang YS, Yang YB, Wu JX, Jiang GS, Xue Y, et al. A review on the recycling of aluminum electrolytic spent cathode carbon: Detoxification mechanisms, recovery processes, and environmental assessment. Sep. Purif. Technol. 2025, 378, 134697. DOI:10.1016/j.seppur.2025.134697 [Google Scholar]
-
Ma LT, Cui Y, Lin Y. Aluminum smelting residue upcycling via targeted fluoride extraction and alkaline driven cryolite synthesis. Process Saf. Environ. Prot. 2025, 201, 107511. DOI:10.1016/j.psep.2025.107511 [Google Scholar]
-
Gao Q, Guo Q, Li Y, Ren B, Fu M, Li H, et al. Innovative technology for defluorination of secondary aluminum dross by alkali leaching. Miner. Eng. 2021, 172, 107134. DOI:10.1016/j.mineng.2021.107134 [Google Scholar]
-
Le VG, Vo TDH, Nguyen BS, Vu CT, Shih YJ, Huang YH. Recovery of iron(II) and aluminum(III) from acid mine drainage by sequential selective precipitation and fluidized bed homogeneous crystallization (FBHC). J. Taiwan Inst. Chem. Eng. 2020, 115, 135–143. DOI:10.1016/j.jtice.2020.10.007 [Google Scholar]
-
Han Z, Wu Y, Hao P, Tan X, Wei M, Lv X. Efficient lithium recovery from lithium-containing spent aluminium electrolyte via NaF fluorination roasting and Al2(SO4)3 leaching. J. Environ. Chem. Eng. 2023, 11, 110948. DOI:10.1016/j.jece.2023.110948 [Google Scholar]
-
Stephan EF, Miller PD. Solubility of Lithium Hydroxide in Water and Vapor Pressure of Solutions above 220° F. J. Chem. Eng. Data 1962, 7, 501–505. DOI:10.1021/je60015a018 [Google Scholar]
-
Wang WY, Yen CH, Lin JL, Xu RB. Recovery of high-purity metallic cobalt from lithium nickel manganese cobalt oxide (NMC)-type Li-ion battery. J. Mater. Cycles Waste Manag. 2019, 21, 300–307. DOI:10.1007/s10163-018-0790-x [Google Scholar]
-
He L, Shi L, Huang Q, Hayat W, Shang Z, Ma T, et al. Extraction of alumina from aluminum dross by a non-hazardous alkaline sintering process: Dissolution kinetics of alumina and silica from calcined materials. Sci. Total Environ. 2021, 777, 146123. DOI:10.1016/j.scitotenv.2021.146123 [Google Scholar]
-
Hien-Dinh TT, Luong VT, Gieré R, Tran T. Extraction of lithium from lepidolite via iron sulphide roasting and water leaching. Hydrometallurgy 2015, 153, 154–159. DOI:10.1016/j.hydromet.2015.03.002 [Google Scholar]
-
Tang S, Zhang M, Guo M. A Novel Deep-Eutectic Solvent with Strong Coordination Ability and Low Viscosity for Efficient Extraction of Valuable Metals from Spent Lithium-Ion Batteries. ACS Sustain. Chem. Eng. 2022, 10, 975–985. DOI:10.1021/acssuschemeng.1c06902 [Google Scholar]
-
Wang K, Hu T, Shi P, Min Y, Wu J, Xu Q. Efficient Recovery of Value Metals from Spent Lithium-Ion Batteries by Combining Deep Eutectic Solvents and Coextraction. ACS Sustain. Chem. Eng. 2022, 10, 1149–1159. DOI:10.1021/acssuschemeng.1c06381 [Google Scholar]
-
Yin X, Wang S, Liu R, Liu X, Liu P, Yang Y. New and facile recovery strategy for silver, copper, and nickel from waste silver contacts using polyiodide ionic liquids. AIChE J. 2024, 70, e18427. DOI:10.1002/aic.18427 [Google Scholar]
-
Cao R, Jia Z, Zhang Z, Zhang Y, Banthia N. Leaching kinetics and reactivity evaluation of ferronickel slag in alkaline conditions. Cem. Concr. Res. 2020, 137, 106202. DOI:10.1016/j.cemconres.2020.106202 [Google Scholar]
-
Lin M, Liu YY, Lei SM, Ye Z, Pei ZY, Li B. High-efficiency extraction of Al from coal-series kaolinite and its kinetics by calcination and pressure acid leaching. Appl. Clay Sci. 2018, 161, 215–224. DOI:10.1016/j.clay.2018.04.031 [Google Scholar]
-
Long P, Wang G, Zhang C, Yang Y, Cao X, Shi Z. Kinetics model for leaching of ion-adsorption type rare earth ores. J. Rare Earths 2020, 38, 1354–1360. DOI:10.1016/j.jre.2019.11.011 [Google Scholar]
-
Chen X, Cao L, Kang D, Li J, Zhou T, Ma H. Recovery of valuable metals from mixed types of spent lithium ion batteries, Part II: Selective extraction of lithium. Waste Manag. 2018, 80, 198–210. DOI:10.1016/j.wasman.2018.09.013 [Google Scholar]
-
Mao S, Zhang Q. Occurrence State of Carbon and Electrolyte in Anode Carbon Residue from Electrolytic Aluminum. Frontiers in Materials 2021, 8, 719563. DOI:10.3389/fmats.2021.719563 [Google Scholar]
-
Chen LJ, Huang LQ, Yuan LC, Tian L. Kinetic studies of rubidium extraction from muscovite using chlorination roasting-water leaching process. Gongcheng Kexue Xuebao/Chin. J. Eng. 2018, 40, 808–814. DOI:10.13374/j.issn2095-9389.2018.07.006 [Google Scholar]
-
Zhang X, Tan X, Li C, Yi Y, Liu W, Zhang L. Energy-efficient and simultaneous extraction of lithium, rubidium and cesium from lepidolite concentrate via sulfuric acid baking and water leaching. Hydrometallurgy 2019, 185, 244–249. DOI:10.1016/j.hydromet.2019.02.011 [Google Scholar]
-
Baba AA, Ibrahim AS, Bale RB, Adekola FA, Alabi AGF. Purification of a Nigerian talc ore by acid leaching. Appl. Clay Sci. 2015, 114, 476–483. DOI:10.1016/j.clay.2015.06.031 [Google Scholar]
-
Tan Q, Deng C, Li J. Effects of mechanical activation on the kinetics of terbium leaching from waste phosphors using hydrochloric acid. J. Rare Earths 2017, 35, 398–405. DOI:10.1016/S1002-0721(17)60925-6 [Google Scholar]
-
Billy E, Joulié M, Laucournet R, Boulineau A, De Vito E, Meyer D. Dissolution Mechanisms of LiNi1/3Mn1/3Co1/3O2 Positive Electrode Material from Lithium-Ion Batteries in Acid Solution. ACS Appl. Mater. Interfaces 2018, 10, 16424–16435. DOI:10.1021/acsami.8b01352 [Google Scholar]
-
Reynolds JG, Belsher JD. A Review of Sodium Fluoride Solubility in Water. J. Chem. Eng. Data 2017, 62, 1743–1748. DOI:10.1021/acs.jced.7b00089 [Google Scholar]
-
Cui L, Wang W, Chao X, Gao J, Cheng F. Efficient lithium recovery from electrolytic aluminum slag via an environmentally friendly process: Leaching behavior and mechanism. J. Clean. Prod. 2024, 439, 140800. DOI:10.1016/j.jclepro.2024.140800 [Google Scholar]