Contemporary Multimodality Imaging Evaluation in Native Aortic Stenosis

Contemporary Multimodality Imaging Evaluation in Native Aortic Stenosis
Aro Daniela Arockiam 1 Karim Hoyek 1 Elio Haroun 1 Vaidehi Mendpara 1 Anoop Gurram 1 Yuichiro Okushi 1 Rajah Judah Rajendran 1 Ankit Agrawal 1 Joseph El Roumi 1 Anghous Feeney 2 Tom Kai Ming Wang 1,*
Received: 09 September 2025 Revised: 20 October 2025 Accepted: 26 November 2025 Published: 19 December 2025

© 2025 The authors. This is an open access article under the Creative Commons Attribution 4.0 International License (https://creativecommons.org/licenses/by/4.0/).
1. Introduction
Aortic stenosis (AS) is the most common primary valvular heart disease in developed countries, especially elderly patients, with a rising global burden due to aging populations. It is characterized by progressive narrowing of the aortic valve orifice, most often due to calcific degeneration of a trileaflet valve or congenital abnormalities such as bicuspid aortic valve. These changes impose a pressure overload on the left ventricle, resulting in concentric hypertrophy and diastolic dysfunction, with eventual risk of systolic impairment [1,2]. The disease progresses from a prolonged asymptomatic phase to symptomatic stages marked by shortness of breath/heart failure, angina, and dizziness/syncope—events that significantly worsen prognosis if left untreated. Echocardiography remains the cornerstone first-line modality to diagnose AS, however advancements in multimodality imaging—including computed tomography (CT), cardiac magnetic resonance (CMR), and stress imaging—have complimentary roles to evaluate valve anatomy, quantify severity, risk-stratify patients and guide valve interventions [3]. Timely recognition and accurate assessment with multimodality imaging are critical to guiding both surgical aortic valve replacement (SAVR) and transcatheter aortic valve replacement (TAVR), which are pillars in management [2]. This review highlights the clinical presentation, multimodality imaging evaluation and guidance of valvular interventions to inform patient management and improve clinical outcomes.
2. Etiologies and Pathophysiology
Aortic stenosis (AS) is primarily caused by degenerative, congenital, and rheumatic processes. The degeneration of the valve is thought to be influenced by mechanical stress, oxidative stress, endothelial dysfunction, inflammation, and valve cusp bleeding [4,5,6]. Over time, the aortic valve undergoes thickening, fibrosis, and calcification, progressing to degenerative AS. Some but not all research reports suggest that factors common to those promoting arteriosclerosis, including hyperlipidemia, hypertension, and smoking, contribute to the progression of AS [7]. Furthermore, while statins are effective in preventing atherosclerotic cardiovascular disease, several studies have reported that they cannot prevent the progression of AS [8]. As the valve leaflets become sclerotic and the aortic valve area narrows, the left ventricle (LV) experiences increased afterload during systole. Chronic elevation of LV afterload leads to LV hypertrophy, fibrosis, and diastolic dysfunction, ultimately causing LV remodeling and systolic dysfunction, which results in hemodynamic failure [9]. Congenital AS is most often caused by bicuspid aortic valves. Bicuspid aortic valve leads to less efficient distribution and concentration of mechanical forces within the valve, and often leads to AS and sometimes aortic regurgitation decades earlier than in those with tricuspid aortic valves [10]. The cumulative lifetime risk of progressing to more than moderate AS or aortic regurgitation (AR) in patients with bicuspid aortic valves is notably high, approximately 60% by age 70 and 80% by age 90 [11]. Rheumatic AS has become rare in the United States and the Western world due to effective treatment of rheumatic fever, but it is still common in developing countries and worldwide [12].
3. Clinical Presentation
Native AS often remains asymptomatic until significant outflow obstruction develops, at which point the classic triad of exertional dyspnea, angina, and syncope appears and carries a bad prognostic significance. Dyspnea is the most common presenting symptom and is caused by left ventricular (LV) hypertrophy and rising filling pressures. Angina may occur without coronary artery disease due to the increased myocardial oxygen demand and impaired subendocardial perfusion. Exertional syncope results from fixed cardiac output and activity-induced vasodilation. Older patients frequently have atypical or more subtle symptoms, which may lead to delayed diagnosis, while the onset of heart failure signs (orthopnea, edema…) signals advanced disease and poor survival without intervention. Even mild symptom onset in severe AS markedly increases the risk of sudden cardiac death, highlighting the need for urgent evaluation and valve replacement, often guided by objective functional testing and multimodality imaging [1,2]. Physical examination typically reveals a harsh systolic ejection murmur radiating to the carotids, pulsus parvus et tardus, reduced pulse pressure, and a sustained apical impulse, while absence of A2 suggests critical stenosis [13]. ECG often shows LV hypertrophy with lateral strain and may demonstrate atrial fibrillation or conduction disease in advanced stages, and although nondiagnostic, it reflects chronic pressure overload [14]. Biomarkers such as BNP and NT-proBNP correlate with LV wall stress and adverse prognosis and may identify subclinical dysfunction, while routine laboratories support overall risk stratification and procedural planning [15]. Additional lab tests are used to assess overall cardiac risk and pre-procedural status. These include renal function markers (e.g., serum creatinine, eGFR), hemoglobin, and electrolytes. Troponin levels may be modestly elevated in severe AS, reflecting myocardial strain. Inflammatory markers such as CRP are not routinely used but may be elevated in degenerative valve disease [16].
4. Echocardiography
Transthoracic echocardiography (TTE) is the essential first-line imaging modality for diagnosing, grading, and monitoring aortic stenosis (AS). It is non-invasive, widely accessible, and provides both anatomical and hemodynamic data, which are fundamental for determining the severity of AS and guiding patient management. Through detailed imaging of the aortic valve and assessment of blood flow, TTE helps clinicians understand the pathophysiological changes caused by the stenosis, such as left ventricular (LV) hypertrophy, compensatory remodeling, and alterations in flow dynamics. As the primary imaging modality for this condition, TTE enables the clinician to visualize valve morphology, measure transvalvular velocities, and estimate key parameters like valve area, all of which help guide therapeutic decisions, including the timing of interventions such as valve replacement [1,2] (Table 1).
Table 1. Modalities for the assessment of aortic stenosis.
|
Test |
Strength |
Limitation |
|---|---|---|
|
TTE |
Widely available and non-invasive. Evaluate valve morphology and mobility, cause and severity of AS and its consequences. Identify concurrent VHD. Assessment of hemodynamic severity. Measurement of LV size and systolic function. |
Limitations of the acoustic windows. Flow-dependence. Inter-observer variability. Limited tissue evaluation. Hypertension may interfere with the assessment of AS severity. May overestimate the transvalvular pressure gradient in a patient with a small ascending aorta. Low-flow, low-gradient AS and severe LV dysfunction can underestimate valve disease severity |
|
TEE |
Higher spatial resolution. Useful in patients with poor transthoracic windows. Useful before TAVI to evaluate the aortic annulus and ascending aorta. Accurate LVOT measurement. |
Semi-invasive test. Requires specialized equipment and personnel. Not useful in uncooperative patients and esophageal disease. Limited hemodynamic assessment. |
|
Exercise testing |
Confirm if a patient with severe AS is truly asymptomatic. Can be combined with echo for dynamic assessment. |
Low negative predictive value if used alone in older patients. Limited specificity. Harm in patients with symptomatic severe AS. Variable protocols and effort dependent. |
|
Dobutamine Stress Echocardiography |
Distinguish true vs pseudo-severe AS. Define severity and assess contractile reserve (Stage D2 AS). |
Not safe in patients with symptomatic severe AS. Does not replicate the hemodynamics of exercise. Low negative predictive value if used alone in older patients. Results dependent on LV flow reserve (absent in ~30%). Operator and protocol dependent. |
|
CT-AVC |
Provides an anatomical, flow-independent, reproducible, and quantitative measurement of valvular calcium. Prediction and tracking of disease progression. Helpful when a dobutamine stress test is not feasible or inconclusive (Stages D2 and D3 AS). |
Ionizing radiation. The unenhanced scan technique provides limited anatomical information. Fibrotic valve thickening cannot be assessed. May underestimate the severity in young women with bicuspid AV and Asians Difficulty differentiating AV Calcium from other structures. No direct hemodynamic data |
|
CCT |
Visualization of AV and cardiac chambers throughout the cardiac cycle. Anatomy and morphology of AV and surrounding structures. High spatial resolution. Simple and reproducible. |
Ionizing radiation. No hemodynamics studies. Availability and cost. Motion artefacts in patients with a fast heart rate. |
|
CMR |
No ionizing radiation. Assess myocardial fibrosis. Evaluate the AV anatomy and motion. Dynamic blood flow quantification. Gold standard for LV function, mass, thickness, and volume assessment. Particular value in patients with multi-valvular involvement. Evaluation of associated cardiac amyloidosis. Reproducibility. |
Length of scan. Patient tolerance. Limited availability and high cost. Lower temporal resolution than echo or CT. Non optimal measurement of anatomic AVA. Underestimation of velocities and gradients. |
|
PET/CT |
Anatomic and functional information. Assess increased calcification activity. Excellent repeatability. Prediction of disease progression and need for AV replacement. |
Differences depending on the PET tracer used. High cost and radiation. Limited histologic validation and small studies. |
|
Cardiac Catheterization |
Gold-standard for AVA calculation (Gorlin). Pressure measurements. Hemodynamic reserve testing. Clarifies discordant findings. |
Invasive procedure. Contrast and radiation. Requires specialized equipment and personnel. Errors of AVA in low flow states. |
TTE and TEE, transthoracic and transesophageal echocardiography; AS, aortic stenosis; VHD, valvular heart disease; LV, left ventricle; TAVI, transcatheter aortic valve implantation; LVOT, left ventricle outflow tract; CT-AVC, computed-tomography aortic valve calcium scoring; AV, aortic valve; CCT, cardiac computed tomography; CMR, cardiac magnetic resonance; AVA, aortic valve area; PET/CT, positron emission tomography and computed tomography.
4.1. Qualitative Morphological Assessment
The first step in evaluating aortic stenosis using TTE involves a qualitative assessment of the valve’s morphology. Two-dimensional (2D) echocardiography provides high-resolution images that allow for the assessment of the aortic valve’s structure and function. The important features of aortic stenosis include thickening and calcification of the valve leaflets, particularly at the base and the commissures. These structural changes are indicative of chronic disease and often correlate with the severity of stenosis. A restricted systolic opening of the valve leaflets is another main finding in AS. This reduction in valve motion is a result of the accumulation of calcified deposits or fibrosis, which stiffen the leaflets and impair their ability to open fully during systole. BAVs can appear as eccentric or fused leaflets, often with an asymmetric opening. The presence of BAV significantly increases the likelihood of developing aortic stenosis at a younger age, making it crucial to monitor for signs of valve calcification and restriction, along with concomitant aortic regurgitation. Morphological assessment provides valuable information about the structure of the valve. It may assist in diagnosing the etiology of AS, particularly in distinguishing between degenerative and congenital forms of the disease; however, AS severity requires confirmation by quantitative parameters in addition to qualitative parameters [17].
4.2. Doppler Hemodynamics and Velocity Assessment
Once the valve morphology has been assessed, Doppler echocardiography is used to evaluate the hemodynamic severity of the stenosis. Doppler techniques, including color, continuous-wave and pulsed wave Doppler, are crucial to use in combination to assess transvalvular flow velocities and pressure gradients, which provide a direct assessment of the stenosis severity (Figure 1). Color Doppler often aliases, indicating high velocities when AS is significant. A key hemodynamic parameter measured is the peak transaortic velocity (Vmax). This measurement is taken from multiple acoustic windows to ensure that the ultrasound beam is aligned parallel to the direction of blood flow, for which the Pedoff probe can be used as an adjunct. Peak velocity of ≥4.0 m/s signifies severe AS. The mean transvalvular pressure gradient is back calculated from the mean gradient using the Bernoulli equation (ΔP = 4V2). This gradient represents the difference in pressure across the aortic valve and is another essential measure in grading AS. A mean gradient ≥40 mmHg supports the diagnosis of severe AS. The pressure gradient provides insight into the degree of resistance to blood flow through the stenotic valve, which ultimately impacts cardiac output and left ventricular function [18] (Table 2).
Table 2. Echocardiographic parameters in aortic stenosis.
|
Severe AS Cutoff |
Strength |
Limitation |
|
|---|---|---|---|
|
AS jet velocity |
>4.0 m/s |
Strongest predictor of clinical outcome. Direct measurement. |
Flow dependent. Correct measurement. Requires specific alignment. |
|
Mean pressure gradient |
>40 mmHg |
Averaged from the velocity curve. Units comparable to invasive measurements. More reproducible than peak velocity. |
Flow dependent. Dependent on accurate velocity data. Pressure recovery phenomenon. |
|
Continuity equation AVA |
<1.0 cm2 |
Relatively flow independent. Feasible in nearly all patients. Hemodynamic effective orifice area. |
Requires LVOT diameter and flow velocity data and aortic velocity. Error prone. |
|
Simplified continuity equation AVA |
<1.0 cm2 |
Uses more easily measured velocities. |
Decreased accuracy if atypical velocity curves. |
|
AVA index |
<0.6 cm2/m2 |
Increased specificity in low BSA (especially women). Increased sensitivity in high BSA (especially men). |
Not valid for the obese. Flow dependent. Less extensive data than for AVA. |
|
Velocity ratio |
<0.25 |
Doppler only method. Less variability than the continuity equation. No need to measure LVOT size. No geometric assumptions. |
Limited longitudinal data. No information on SV. Flow dependent. |
|
Planimetry of anatomic valve area |
<1.0 cm2 |
No Doppler information needed. |
Flow contraction. Flow dependent. Difficult with severe valve calcification. Low reproducibility. |
|
Energy loss index |
<0.5–0.6 cm2/m2 |
Theoretically closer to the true hemodynamic burden caused by AS. Relevant in patients with an aortic diameter < 3 cm. |
Complex and prone to errors. Most patients with AS have an aortic diameter > 3 cm. Flow dependent. |
|
Recovered pressure gradient |
Closer to the true hemodynamic burden caused by AS. |
No prospective studies showing a real advantage. |
|
|
Global longitudinal strain |
GLS ≥ −15/−14.7% |
Early detection of subclinical LV dysfunction. Prognostic marker. Reproducibility. |
Preload and afterload dependence. Software variability. Image quality dependency. No direct valve assessment. |
|
LV % Stroke Work Loss |
>25% |
Easy to measure. Correlation to AVA. |
Flow dependent. Limited longitudinal data. |
|
Valvulo-arterial impedance |
>5 mmHg/mL/m2 |
Information integration on arterial bead to the hemodynamic burden of AS. |
Only the steady flow is considered. No longitudinal prospective studies are available. |
|
Aortic valve resistance |
>280 dynes/s/cm5 |
Flow dependence. Unrealistic mathematic modeling of dynamics. |
|
|
Projected valve area at normal flow rate |
>1.0 cm2 |
Accounts for the changes in flow during DSE in low flow low gradient AS. Improved interpretation of AVA changes. |
Clinical impact? The outcome of low flow AS more related to LV contractility reserve. |
Recommendation for clinical application: appropriate in all patients (yellow), reasonable when additional information is needed in selected patients (green), not recommended for clinical use (blue). AS, aortic stenosis; AVA, aortic valve area; LVOT, left ventricle outflow tract; BSA, body surface area; SV, stroke volume; LV, left ventricle; DSE, Dobutamine stress echocardiogram.
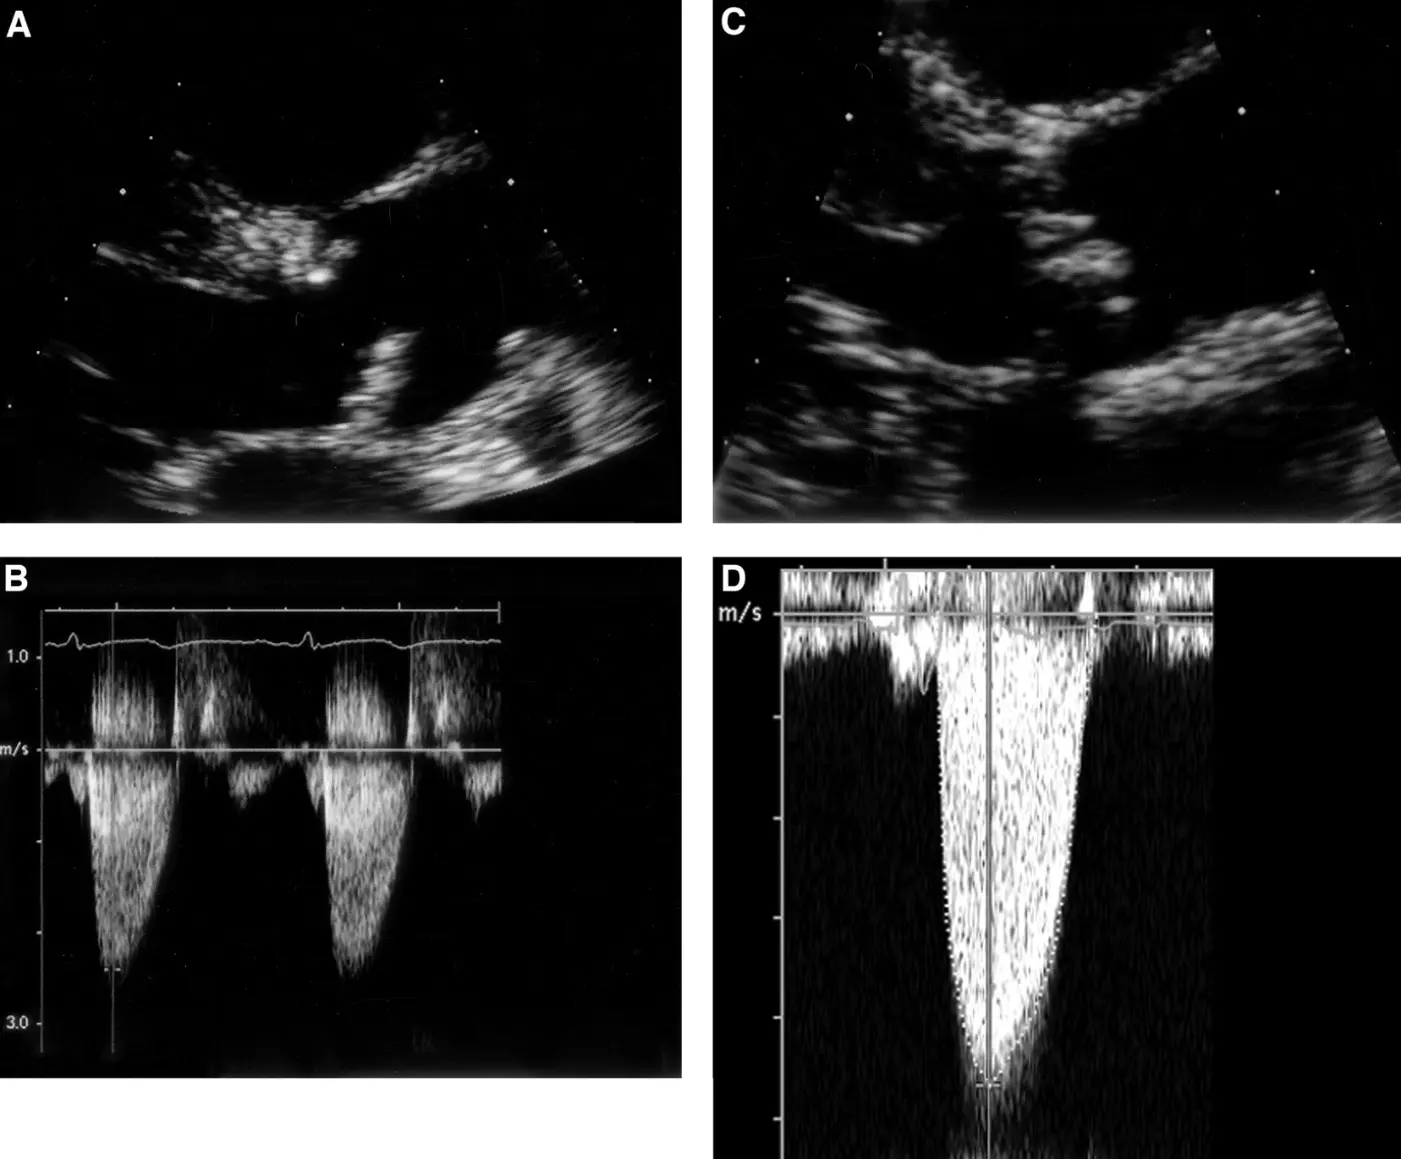
Figure 1. Echocardiographic images of aortic sclerosis (A,B) and severe aortic stenosis (C,D). Continuous wave Doppler signal from both subjects was taken from an apical window. 2D image of sclerotic aortic valve (A) shows focal leaflet thickening with mild leaflet restriction of noncoronary cusp during systole. Overall, jet velocity is minimally increased at 2.4 m/s. In contrast, aortic cusps of the severely stenotic valve are thickened and calcified, with severely restricted leaflet motion during systole (C). This corresponds to a jet velocity of 4.7 m/s (D) [19].
4.3. Aortic Valve Area (AVA) Estimation
Aortic valve area (AVA) measures the valve’s ability to facilitate blood flow. The AVA can be estimated using several methods, with the continuity equation being the most used approach. The continuity equation is given by: AVA = CSA LVOT × VTI LVOT/VTI AV. In this equation, the cross-sectional area of the left ventricular outflow tract (CSA LVOT) is calculated from the LVOT diameter, and the velocity-time integral (VTI) of the LVOT and the aortic valve (VTI AV) using Doppler echocardiography. A small AVA, particularly one less than or equal to 1.0 cm2, is one of the criteria for severe AS. The continuity equation provides a functional assessment of valve area, and it is highly reliable for quantifying the severity of stenosis in most patients. Each parameter in the calculation contributes to the error of this measurement, with the most significant LVOT diameter (which is squared to obtain CSA LVOT). VTI of the LVOT and aortic valve may be replaced by peak velocity or mean velocity of the LVOT and aortic valve in the continuity equation. However, in cases where 2D imaging is inadequate, anatomical measurements of the valve orifice may be attempted using planimetry. While 2D TTE is generally the preferred method for estimating AVA, three-dimensional imaging techniques such as transesophageal echocardiography (TEE) or computed tomography (CT) provide more precise measurements and are particularly useful for detailed anatomical assessments. These techniques allow for more accurate visualization of the true orifice of the valve with the use of multi-planar reconstruction, especially in cases where 2D imaging is limited due to poor acoustic windows or complex valve anatomy [20]. Three-dimensional echocardiography allows for en face imaging of the aortic valve, which is particularly helpful in procedural planning and in cases with complex valve anatomies [2] (Table 2).
4.4. Dimensionless Index (DI) or Velocity Ratio
In some cases, particularly when anatomical data are challenging to obtain or when the LVOT diameter is difficult to measure, the Dimensionless Index (DI), or velocity ratio, can be used for assessing severity. The DI is calculated by dividing the velocity-time integral of the LVOT by the VTI of the aortic valve. A DI ≤ 0.25 is strongly suggestive of severe AS, and this parameter can be particularly useful in cases where technical limitations prevent accurate measurement of other parameters. The DI does not require direct measurement of the LVOT diameter, making it especially valuable in challenging cases or when assessing patients with suboptimal imaging conditions [21].
4.5. Integrated Approach to Grading Severity
To accurately grade the severity of aortic stenosis, an integrated approach combining multiple parameters is essential in accordance with guidelines [1,2]. This approach includes an assessment of valve morphology, peak velocity, mean pressure gradient, AVA, DI, left ventricular ejection fraction (LVEF) and stroke volume indexed (SVi). Reduced LVEF is important to identify because its presence, especially if due to AS supports proceeding with valvular intervention, even if the patient is asymptomatic. An integrated assessment helps resolve discrepancies that may arise when individual parameters provide conflicting information [1].
4.6. Carotid Arteries Assessment
In patients with AS, carotid ultrasonography offers valuable supplementary information and can be included in multimodality risk assessment. In addition to identifying carotid plaque and measuring stenosis, which can forecast concurrent coronary atherosclerosis and direct the treatment of ASCVD worldwide, carotid imaging assesses vascular stiffness, a factor that is frequently overlooked but contributes to negative outcomes. Early research supported the use of carotid disease burden as a non-invasive indicator of systemic atherosclerosis by showing a correlation between it and the severity of AS and the chance of significant coronary artery disease [22]. More recent data support that Doppler-derived vascular stiffness indices such as resistive index (RI) and pulsatility index (PI) have prognostic value: elevated RI (OR 1.25, 95% CI 1.13–1.37) and PI (OR 1.21, 95% CI 1.10–1.34) are associated with worsening heart failure and major adverse cardiac and cerebral events (MACCE) in patients with AS [23]. These emphasize the potential of carotid ultrasonography not only for identifying concomitant atherosclerotic disease but also for refining risk stratification by capturing systemic vascular remodeling that accelerates symptomatic deterioration in AS.
5. Transesophageal Echocardiography
Transesophageal echocardiography (TEE) is a valuable complementary imaging modality which aids both qualitative and quantitative assessments of native AS by providing high-resolution, real-time data. TEE contributes essential diagnostic information to guide clinical decision-making [1,24]. By offering superior spatial resolution compared to TTE, it enables detailed visualization of valve calcification, morphology, and commissural integrity [25]. In clinical settings, TEE is particularly useful during preoperative evaluations, especially in patients scheduled for procedures such as aortic valve replacement or repair, where a precise anatomical understanding of the valve complex is essential.
Quantitative evaluation of aortic stenosis using TEE incorporates Doppler-derived measurements. Two major components of this assessment include transaortic velocities and the calculation of AVA using the continuity equation. The double-envelope (DE) technique allows for simultaneous acquisition of velocities in the left ventricular outflow tract (LVOT) and across the aortic valve (AV), thereby reducing beat-to-beat variability. A prospective study in a cohort of 75 surgical patients validated the DE/TEE method by comparing the intraoperative AVA measurements with preoperative assessments derived by both the Gorlin equation (G/CATH) and TTE using the traditional continuity equation (C/TTE). DE/TEE was successfully performed in 97% of patients, demonstrating its applicability in most clinical scenarios. The DE/TEE method showed excellent concordance with G/CATH (mean bias of 0.02 cm2) and with C/TTE (mean bias of −0.05 cm2), indicating the accuracy of the continuity equation when applied via TEE. By acquiring simultaneous velocity measurements from two different cardiac regions, the DE/TEE method minimizes errors associated with beat-to-beat variation in stroke volume [24]. This underscores that the functional assessment of AVA by the continuity equation using DE/TEE is both feasible and reliable in the intraoperative setting.
For an anatomical determination of the aortic valve area, planimetry involves direct tracing of the aortic orifice. TEE provides high spatial resolution images that facilitate the accurate identification of the valve edges. However, the feasibility and accuracy of planimetry by TEE (PL/TEE) have been noted to be inferior compared to Doppler-based methods, with its use successful in only 76% of patients, highlighting the challenges associated with obtaining optimal imaging planes consistently. Its agreement with preoperative measurements was less robust than that of the DE/TEE method. The mean bias for AVA using PL/TEE was −0.07 cm2 compared with G/CATH and −0.13 cm2 compared with C/TTE, suggesting a potential underestimation of the AVA. While planimetry remains an important anatomical tool, its application should be considered complementary to Doppler-based techniques.
Advancements in three-dimensional (3D) transesophageal echocardiography have further refined the assessment of aortic stenosis by overcoming some limitations of 2D imaging. 3D TEE provides a volumetric dataset that allows for optimal cross-sectional imaging of the aortic valve, thereby enhancing the accuracy of anatomical measurements without being restricted to a single imaging plane. This helps in accurately determining the minimal orifice area without the risk of overestimation resulting from suboptimal cut-plane selection. 3D TEE has also demonstrated a reduction in image acquisition time, along with reduced dependence on the operator’s ability to select an optimal imaging plane, a critical factor in the reliability of planimetric AVA measurements. The geometric AVA measured by 3D techniques was consistently found to be smaller and more accurate than that measured via 2D TEE [26]. These findings confirm that 3D imaging significantly improves the diagnostic performance of TEE when estimating the anatomical dimensions of the aortic valve; however, 3D TEE measurements are smaller, on average, than CT measurements [27]. Comparative analysis between TEE, transthoracic echocardiography (TTE), and cardiac catheterization (G/CATH) is crucial for contextualizing the clinical utility of TEE in AS assessment. TEE provides superior image resolution compared to TTE, although it may overestimate transaortic gradients and velocities. TEE is favored in situations requiring detailed anatomical assessments. The DE/TEE technique has shown excellent agreement with G/CATH values, with minimal mean bias, thereby establishing TEE as a viable non-invasive alternative for intraoperative and preoperative evaluations (Table 1 and Table 3).
Table 3. Guideline indications and recommendations for imaging in AS.
|
Test |
Indication |
Guideline Reference |
|---|---|---|
|
TTE |
Initial diagnosis, quantification, LV function, wall thickness, and follow-up. |
Class I in ACC/AHA and ESC guidelines. |
|
TEE |
TTE images are suboptimal or discordant with the clinical presentation. Procedural planning before TAVI (detailed valve morphology). |
Recommended if TTE is non-diagnostic or discordant (ASE). |
|
Cardiac Catheterization |
Discrepancy between clinical and echo results. Measurement of Stage D3 AS severity. |
Only if the non-invasive evaluation is inconclusive. |
|
CMR |
Inadequate TTE. |
If echo and/or CT are inadequate. |
|
TAVI planning (contraindications to CT) |
||
|
Second line when unable to assess LVOT, AV and aorta due to poor acoustic windows and when CT is contraindicated. |
||
|
Third line imaging technique to assess AS severity after echo and CT. |
||
|
Assess myocardial fibrosis. |
||
|
Measurement of Stage D3 AS severity. |
Class IIa-IIb in HAVEC guidelines. |
|
|
Cardiac amyloidosis suspicion. |
||
|
Exercise testing |
Confirm the absence of symptoms and study physiological changes with exercise in Stage C1 AS patients. |
Class I in HAVEC guidelines. |
|
Assess symptoms and valve hemodynamics in Stage C2 AS. |
||
|
Unmask the objective occurrence of symptoms in patients who claim to be asymptomatic. |
Class IIa in HAVEC guidelines. |
|
|
Dobutamine stress test |
Define severity and assess contractile reserve in Stage D2 AS. |
Class I in ACC/AHA and ESC guidelines. |
|
Distinguish between severe and pseudo-severe Stage D3 AS. |
Class IIa in HAVEC guidelines. |
|
|
CCT |
Distinction between severe and pseudo-severe Stage D3 AS. |
Class I in HAVEC guidelines. |
|
Distinction between severe and pseudo-severe Stage D2 AS with no flow reserve. |
Class IIa in HAVEC guidelines. |
|
|
Procedural planning before TAVI |
||
|
CT-AVC |
Further define severity in AS (Stages D2 and D3), especially if the Dobutamine stress test is inconclusive. |
Recommended by ESC and AHA/ACC to clarify AS severity when discordant echocardiographic assessments remain inconclusive. |
|
Further direct clinical management of patients with discordant echocardiographic grading. |
||
|
Prediction and tracking of disease progression. |
||
|
PET/CT |
Prognostic implications in Stage C1 AS. Prediction and tracking of disease progression. Investigational applications. |
Class IIb in HAVEC guidelines. |
ACC, American College of Cardiology; AHA, American Heart Association; ESC, European Society of Cardiology; HAVEC, Viewpoint of the Heart Valve Clinic International Database; ASE, American Society of Echocardiography; TTE and TEE, transthoracic and transesophageal echocardiography; AS, aortic stenosis; LV, left ventricle; TAVI, transcatheter aortic valve implantation; LVOT, left ventricle outflow tract; CT-AVC, computed-tomography aortic valve calcium scoring; AV, aortic valve; CCT, cardiac computed tomography; CMR, cardiac magnetic resonance; PET/CT, positron emission tomography and computed tomography.
6. Classification of Low-Gradient Aortic Stenosis
An important scenario with discrepant findings is the low-gradient severe AS scenario, whereby although AVA is <1.0 cm2, mean gradient and peak velocity across the aortic valve are <40 mmHg and <4.0 m/s, respectively. LVEF and SVi are important in this setting to classify as classification low-flow low-gradient AS (when LVEF < 50% and SVi < 35 mL/m2), paradoxical low-flow low-gradient AS (LVEF ≥ 50% but SVi < 35 mL/m2), and normal flow low-gradient AS (LVEF ≥ 50%, SVi ≥ 35 mL/m2) [28]. In these settings, further evaluation with dobutamine stress echocardiography and/or gated non-contrast computed tomography to quantify aortic valve calcium score is indicated. Furthermore, serial surveillance of AS parameters by TTE is important, as a rapid increase may also support proceeding with aortic valve intervention [1,2].
Low-gradient severe AS is a complex and heterogeneous condition that can arise in the setting of either reduced or preserved LV function. In patients with low flow, low gradient AS and impaired LV systolic function (ejection fraction < 40%), the central challenge lies in differentiating true severe AS from pseudo-severe AS. True severe AS occurs when valve obstruction is the primary driver, with the small fixed AVA (≤1.0 cm2) leading to increased afterload, reduced stroke volume, and secondary LV dysfunction [29,30]. By contrast, pseudo-severe AS is primarily due to underlying myocardial disease, where reduced contractility limits valve opening, giving the false impression of severe obstruction. Both present with similar hemodynamic findings at rest, but treatment implications differ significantly. Patients with true severe AS derive substantial benefit from valve replacement, while those with pseudo-severe AS do not. Accurate classification is therefore essential, as prognosis and therapeutic strategies diverge sharply between the two groups. The Truly or Pseudo-Severe Aortic Stenosis (TOPAS) study further refined this distinction by introducing the projected AVA at standardized flow, with values <1.0 cm2 indicating true severe disease [31].
Another important subgroup is paradoxical low-flow, low-gradient AS in patients with preserved LV ejection fraction. This form of AS is characterized by reduced stroke volume index (<35 mL/m2) despite normal systolic function, and is closely associated with concentric LV remodelling, a small ventricular cavity, impaired filling, increased arterial load, and the presence of myocardial fibrosis [32]. These structural and functional abnormalities lead to reduced forward flow and diminished transvalvular gradients, creating diagnostic uncertainty when the valve area is ≤1.0 cm2. In this group, reliance on conventional Doppler indices alone may underestimate disease severity, so adjunctive hemodynamic measures are often required. Valvulo-arterial impedance (ZVA), which integrates valvular and arterial load, provides insight into global LV afterload, with values >4.5 mmHg/mL/m2 suggesting severe disease [33]. Similarly, the energy loss index (ELI), which accounts for pressure recovery in the ascending aorta, offers a refined estimate of net hemodynamic burden, with values <0.6 cm2/m2 indicating severe AS [34]. These additional parameters are particularly valuable in borderline or discordant cases, helping to identify patients with true hemodynamically significant disease who are most likely to benefit from aortic valve intervention.
7. Exercise Stress Echocardiography
Exercise stress echocardiography is mainly utilized in evaluating patients with asymptomatic severe AS with preserved ejection fraction. In this scenario, other modalities like TTE have already identified severe AS; however, there are no strong indications for valvular intervention because the patient has no symptoms and LVEF normal [1,2]. Sometimes patients don’t report symptoms because they are sedentary and do not undertake regular strenuous exercises, especially elderly patients. Exercise stress echocardiography can firstly evaluate exercise capacity in terms of exercise time, depending on protocol and metabolic equivalents, and monitor these over time for deterioration, along with the development of symptoms and abnormal ECG changes. It can also assess the hemodynamic response to exercise blood pressure, where blood pressure and heart rate are expected to increase. Furthermore, left ventricle contractile function, which does not accentuate with exercise (unchanged or deteriorates), can be present in worsening aortic stenosis and myocardial damage. Patients who develop pulmonary hypertension (systolic pulmonary artery pressure >60 mmHg) during exercise have demonstrated poorer survival rates [35]. Impaired exercise capacity, abnormal hemodynamic response (especially if a fall in blood pressure with exercise) and contractile reserve are also supporting indications for asymptomatic AS to proceed with valve intervention [1,2] (Table 1 and Table 3).
8. Dobutamine Stress Echocardiography
Dobutamine stress echocardiography is recommended for patients with low-flow, low-gradient AS, with a class IIa recommendation and a level of evidence B, provided it is performed in specialized centers with experience in pharmacological stress testing. It is most useful in the setting of low-gradient aortic stenosis (AVA < 1.0 cm2) and mean gradient >40 mmHg but with low flow (ie either classical or paradoxical low-gradient AS). In classical low-flow low-gradient AS where LVEF is also <50%, DSE can assess for contractile reserve (if there is ≥20% increase in SVi with moderate dobutamine dose), and at this level, whether the mean gradient across the aortic valve exceeds 40 mmHg while AVA stays below 1.0 cm2—if yes, then confirms severe AS, and if not, likely moderate AS [1] (Table 1 and Table 3).
9. Cardiac Computed Tomography (CT)
Cardiac computed tomography (CT) has become an essential tool in the evaluation of native aortic stenosis (AS), offering critical insights that complement and often enhance traditional echocardiography. One of its key applications is aortic valve calcium scoring, where the Agatston method is used on non contrast, electrocardiogram (ECG)-gated scans to quantify the extent of calcification (Figure 2). Thresholds of >1300 Agatston units (AU) in women and >2000 AU in men are typically used to define severe AS [36,37]. This approach is particularly valuable when echocardiographic findings, such as aortic valve area (AVA) and pressure gradients, are discordant. In such cases, CT calcium scoring has demonstrated good diagnostic performance, with a sensitivity of 82% and specificity of 78% for detecting severe AS [37,38]. Moreover, higher calcium scores are strongly associated with disease progression and worse outcomes, with a hazard ratio of 2.11 for mortality [36,38].
CT also plays a pivotal role in anatomical assessment through contrast-enhanced CT angiography (CTA). Direct planimetric measurement of the AVA at the leaflet tips during systole often yields slightly larger values compared to echocardiographic estimates, largely due to more accurate assessment of the left ventricular outflow tract (LVOT) area. On average, CT-derived AVA measurements are about 0.6 cm2 larger than those obtained by echocardiography. A hybrid approach that combining CT-derived LVOT area with Doppler velocities improves correlation with disease severity (r = 0.88) compared with echocardiography alone (r = 0.65). This method is especially useful in patients with bicuspid aortic valves, where CT can better define valve morphology and detect associated aortic abnormalities [39].
In the context of transcatheter aortic valve replacement (TAVR) planning, CTA is indispensable. It provides detailed information on aortic annular dimensions (mean diameter, perimeter), coronary ostial height, aortic root anatomy, and valve sizing [37,39]. ECG-gated CTA acquisitions (typically at 120 kV and 0.35–0.5 s rotation times) are tailored to capture systolic dimensions, which are essential for accurate valve selection. Protocols usually extend from the thoracic outlet to the proximal thighs to comprehensively evaluate access vessels [39]. Beyond calcification, CT also allows for assessment of fibrocalcific leaflet thickening, capturing fibrotic changes that are more prevalent in women and younger patients, an important feature that calcium scoring alone may miss [36]. CT is also critical for evaluating chest anatomy before cardiac surgery, thoracoabdominal aorta dimensions and pathology (for example, aortic root or ascending aortic aneurysm would favor surgery over TAVR to concomitantly treat aortic disease), peripheral vascular access, especially iliofemoral and carotid/subclavian arteries, and coronary heart disease.
Despite its strengths, CT is not without limitations. Compared to echocardiography, it involves higher radiation exposure and often requires heart rate control to optimize image quality during gated studies. Nonetheless, the comprehensive anatomical and functional information it provides, including calcification burden, valve anatomy, and TAVR planning parameters, makes cardiac CT a cornerstone in the modern evaluation of aortic stenosis, particularly in complex cases where echocardiographic findings are inconclusive (Table 1 and Table 3).
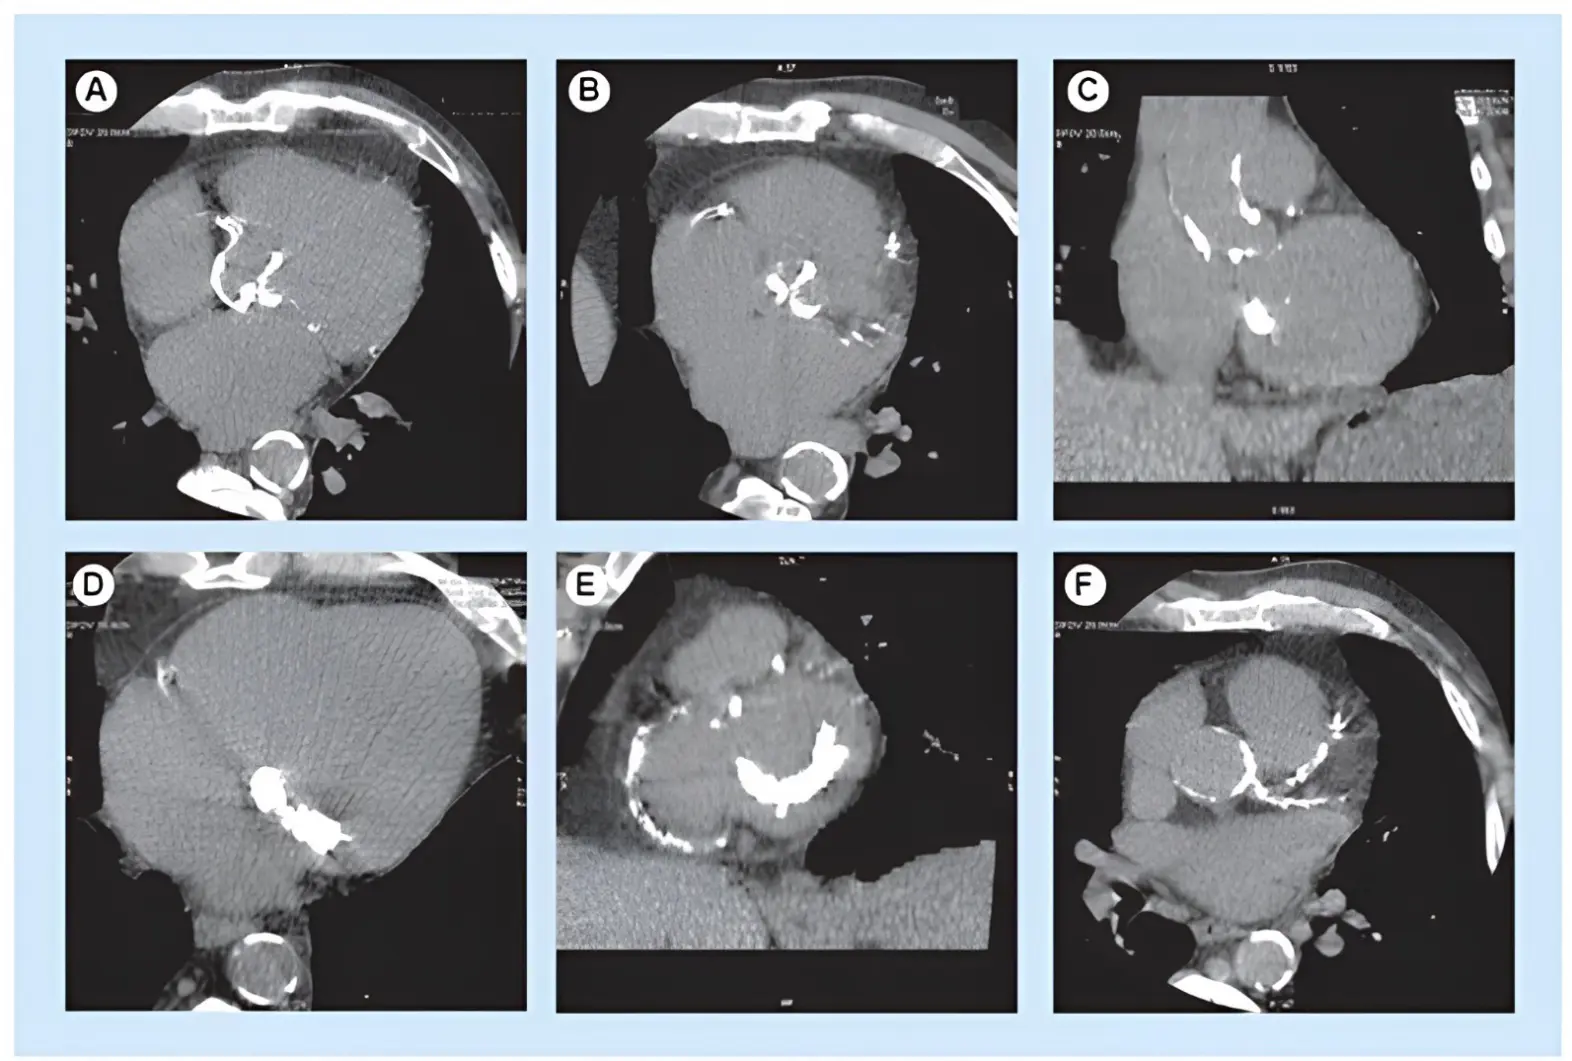
Figure 2. Non-enhanced CT of severe aortic valve calcification. Heavy aortic valve calcification burden seen in (A) the axial and (B) reformatted plane of the aortic valve, associated with (C) severe thoracic aorta, (D,E) mitral valve and (E,F) coronary artery calcifications.
10. Cardiac Magnetic Resonance (CMR)
CMR offers a robust, radiation-free, and highly reproducible imaging modality that complements echocardiography in the assessment of aortic stenosis (AS), particularly in cases where echocardiographic findings are inconclusive. In addition to its utility in valve assessment, CMR is currently the gold standard for non-invasive myocardial tissue characterization, supporting a growing myocardial-centered approach to valvular heart disease evaluation and management [40].
CMR enables detailed visualization of aortic valve morphology through high spatial and temporal resolution, providing excellent contrast between blood and valve leaflets. Cine imaging using balanced steady-state free precession (bSSFP) sequences allows accurate evaluation of valve structure, leaflet number, and bicuspid morphology [41]. Kupfahl et al. found that among CMR, TTE, and transoesophageal echocardiography, CMR planimetry had the highest sensitivity and specificity when validated against cardiac catheterization. However, anatomical planimetry has limitations in cases where the AVA falls between 1.0 and 1.5 cm2, due to inherent differences between the anatomical area (assessed by planimetry) and the functional area (derived from flow-based techniques). Moreover, arrhythmias and the comparatively lower temporal resolution of CMR may hinder the precise identification of the smallest AVA during the cardiac cycle [42].
Velocity-encoded phase-contrast CMR (PC-CMR) allows for direct quantification of blood flow across the aortic valve. Using the continuity equation, AVA can be estimated by integrating peak flow velocities at the valve and the left ventricular outflow tract (LVOT), along with planimetric measurements of LVOT area [43], offering an advantage over echocardiography, which assumes a circular LVOT geometry. Alternatively, pressure gradients across the stenotic valve can be estimated using the Bernoulli equation. 2D PC-CMR has shown good agreement with echocardiography for pressure gradient assessment and provides detailed flow data, including peak velocity, forward and regurgitant flow [44]. However, limitations such as velocity aliasing, misalignment of the imaging plane, suboptimal temporal resolution, and post-processing artifacts can affect accuracy [45]. To address these issues, 4D flow CMR has emerged as a powerful tool, capturing three-dimensional velocity fields across the cardiac cycle. Unlike 2D methods, 4D flow does not require alignment perpendicular to the flow jet, facilitating detection of the highest velocity and offering superior assessment of peak-flow velocity and global hemodynamics [46]. In subsets of patients with discordant echocardiographic findings, 4D flow CMR has demonstrated high diagnostic accuracy [47]. Several studies have also shown that 4D flow CMR offers excellent spatial and temporal reproducibility and yields superior measurements of peak aortic valve velocities and blood flow parameters compared to 2D PC-CMR [48]. Nonetheless, this technique is limited by long acquisition times, large data storage requirements, respiratory motion artifacts, and the need for advanced software for data analysis [46].
Beyond diagnostic evaluation, CMR-derived tissue characterization carries major prognostic value in AS. Late gadolinium enhancement (LGE) identifies focal replacement (often midwall) fibrosis (Figure 3), an irreversible injury pattern, whose presence independently predicts mortality beyond valve severity and LVEF; in a multicenter cohort, midwall LGE remained an independent predictor of all-cause death and added incremental risk-stratification value [49]. Quantitative T1-mapping indices of diffuse interstitial fibrosis (native T1 and extracellular volume fraction, ECV) capture earlier myocardial disease; in an international multicenter JACC study, higher ECV showed stepwise increases in mortality across tertiles and was independently associated with all-cause mortality after adjustment for age, sex, LVEF, and LGE [50]. Together, LGE (presence/extent) and elevated ECV provide complementary, incremental prognostic information beyond conventional hemodynamic indices, inform timing of intervention, and help anticipate reverse remodeling after AVR.
CMR is also valuable for evaluating the aortic root and annular dimensions, particularly in patients being considered for TAVR. It provides high-resolution three-dimensional images without exposing patients to ionizing radiation or nephrotoxic contrast agents. Although contrast-enhanced computed tomography (CCT) is commonly used due to its excellent spatial resolution, rapid acquisition time, and detailed 3D reconstructions, CMR offers an attractive alternative, especially in patients with chronic kidney disease. Studies have demonstrated good agreement between CMR and computed tomography for aortic root measurements, supporting its use in preprocedural planning and prosthesis sizing [2].
Myocardial remodeling is a critical determinant of outcomes in AS, and CMR is the reference standard for chamber size and function quantification [51]. CMR is uniquely positioned to characterize myocardial fibrosis and can detect both focal replacement fibrosis and diffuse interstitial fibrosis-findings that have been histopathologically confirmed in patients with AS- through LGE and T1 mapping techniques, respectively [49]. LGE imaging detects focal fibrosis, which reflects irreversible myocardial injury and correlates with adverse outcomes. Several studies have shown that the presence of myocardial scar, regardless of pattern, is independently associated with increased mortality post-valve replacement. For instance, the large multicenter study by Musa et al. involving 674 patients demonstrated a two-fold increase in all-cause mortality in patients with LGE-detected fibrosis [51]. T1 mapping and extracellular volume (ECV) quantification allow assessment of diffuse fibrosis, often preceding visible scarring. Elevated native T1 and ECV values have been linked to poor prognosis, even in the absence of LGE [52]. These metrics may identify early stages of myocardial decompensation, where timely intervention could potentially reverse adverse remodeling. Hwang et al. showed that native T1 values improved post-valve replacement, aligning with reductions in LV mass and functional recovery, while persistently elevated T1 values were associated with worse outcomes [53]. ECV has also emerged as a strong predictor of prognosis, often outperforming LGE [52]. Chin et al. highlighted a stepwise increase in mortality risk from normal myocardium to diffuse, then focal fibrosis, supporting the potential utility of CMR-based myocardial assessment for risk stratification [54]. While the definitive role of these markers in guiding the timing of intervention remains under investigation, current evidence supports their use in asymptomatic severe AS cases who do not fulfill the guideline recommended criteria for intervention and for symptomatic patients proved to have nonsevere or moderate AS to obtain a better understanding of the AS related cardiac damage (Table 1 and Table 3).
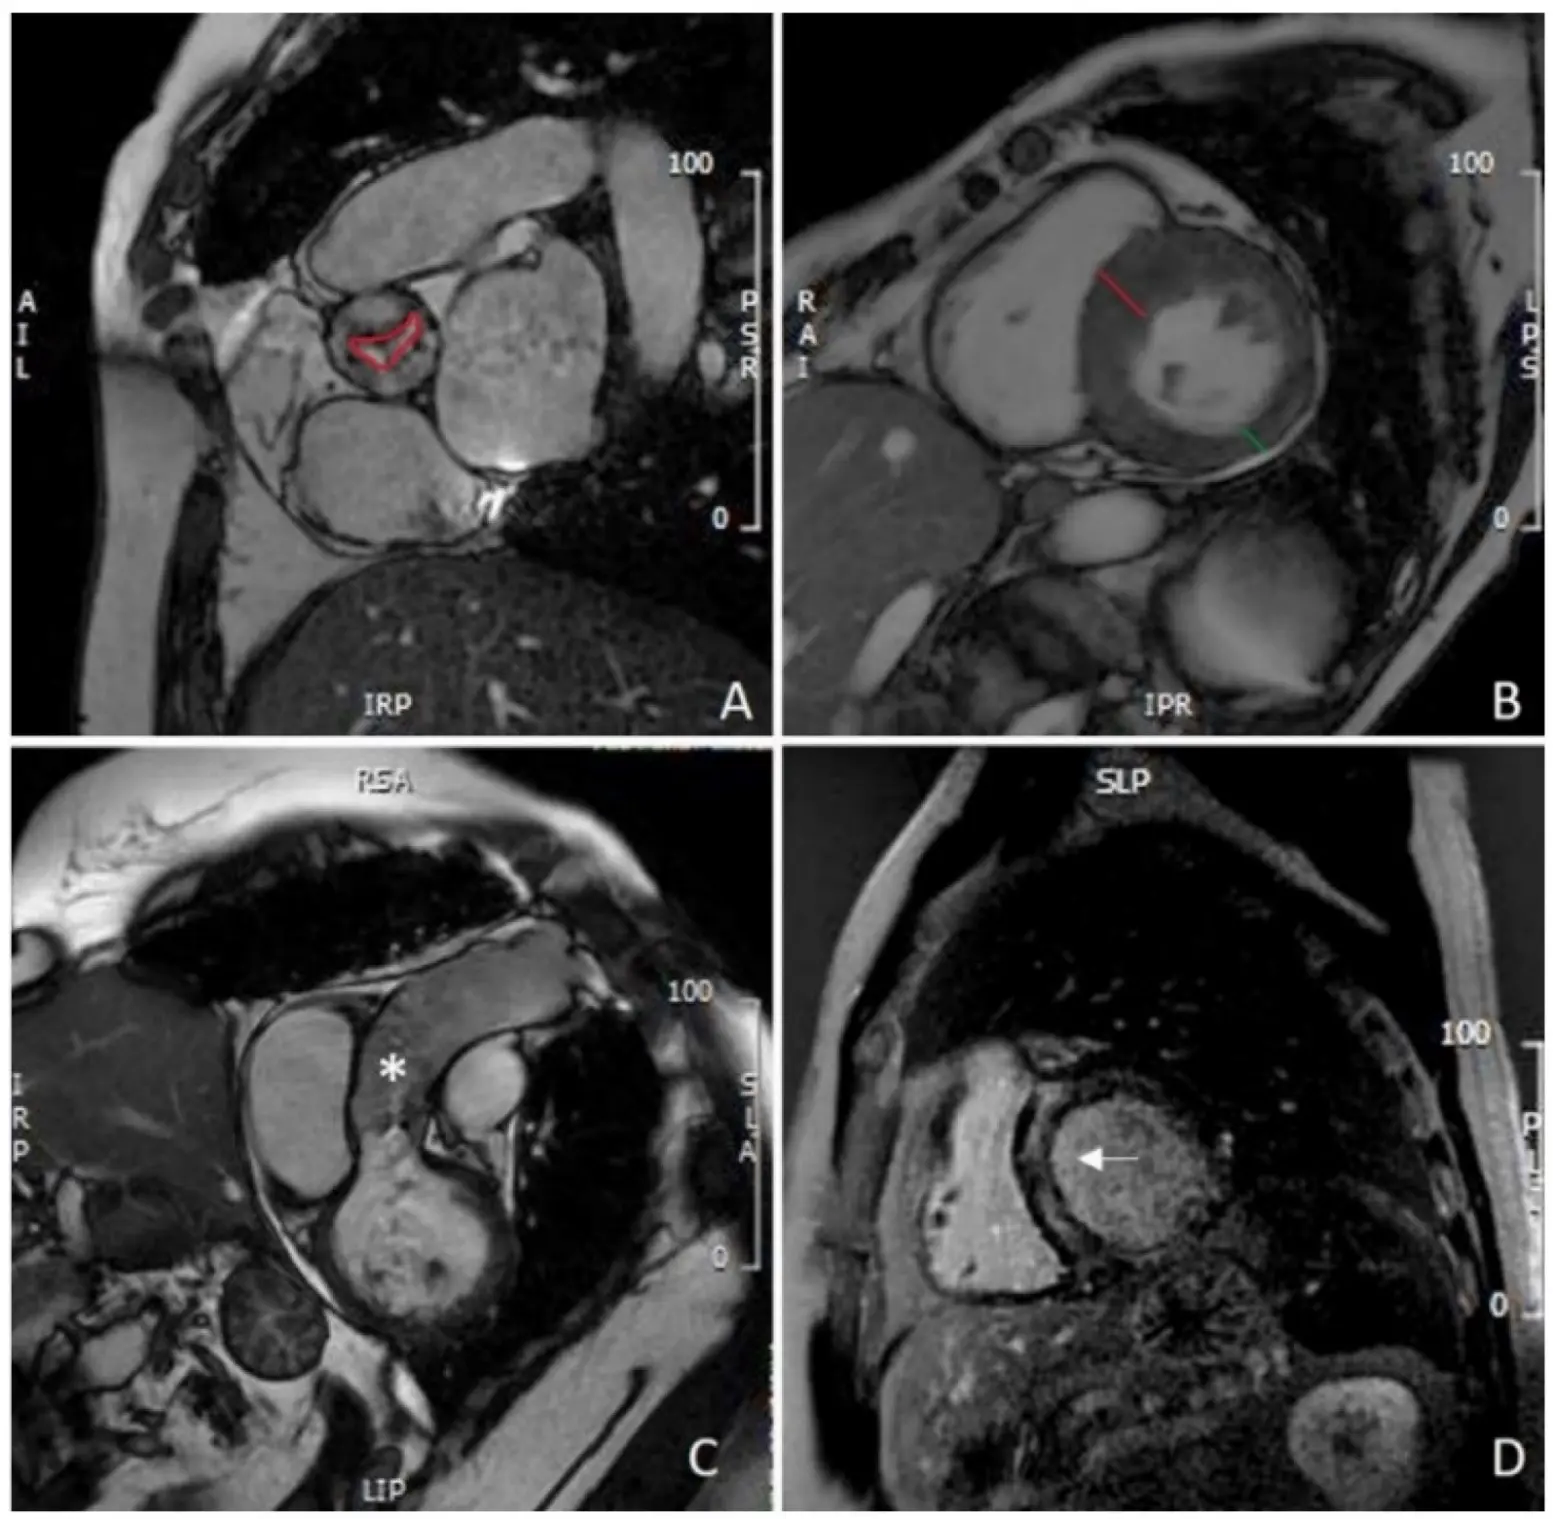
Figure 3. CMR evaluation of aortic stenosis: (A) planimetry of aortic valve (red line); (B) measurement of IVS (red line) and PW thickening (green line), showing asymmetric hypertrophy of the IVS; (C) assessment of thoracic aorta (asterisk); (D) mid-wall LGE of the IVS (white arrow). CMR: cardiovascular magnetic resonance; IVS: interventricular septum; PW: left ventricle posterolateral wall; LGE: late gadolinium enhancement.
11. Positron Emission Tomography
Positron emission tomography (PET), particularly when combined with computed tomography (CT), offers valuable insights into inflammation and calcification processes in cardiovascular diseases. Hybrid imaging with PET/CT and PET/MR integrates anatomical (CT/MR) and molecular (PET) techniques for comprehensive assessment of aortic stenosis. PET evaluates disease activity, complementing structural imaging. Two tracers are prominent: 18F-FDG, a marker of inflammation reflecting macrophage activity (r = 0.85 with histologic CD68 staining), and 18F-fluoride, which targets developing microcalcification distinct from CT-detected macrocalcification [55].
PET/CT and PET/MRI are emerging as vital tools in the comprehensive evaluation of Aortic Stenosis (AS), combining anatomical imaging with molecular insights. While CT and MRI provide detailed views of the aortic valve and myocardium, PET utilizes tracers like 18F-fluorodeoxyglucose (18F-FDG) and 18F-sodium fluoride (18F-NaF) to highlight active inflammation and calcification. 18F-FDG detects inflammation by targeting glucose-dependent macrophages in inflamed tissues, although its diagnostic value in AS is limited due to physiological uptake in the myocardium and poor specificity. In contrast, 18F-NaF is highly effective in detecting valve calcification, correlating closely with AS severity and progression. Its ability to identify early microcalcifications aids in early diagnosis and predicting adverse outcomes. PET/MRI offers superior tissue characterization and reduced radiation exposure compared to PET/CT, but its clinical use in AS is hindered by high costs, limited availability, and technical challenges. Further development is needed to enhance its clinical applicability in AS assessment [56] (Table 1 and Table 3).
11.1. 18F-FDG PET/CT in Aortic Stenosis
The use of 18F-FDG PET/CT in aortic stenosis (AS) has been explored in several studies (Figure 4), with initial work by Marincheva-Sancheva in 2011 showing increased valvular uptake in AS patients compared to controls, particularly in mild and moderate stages. This study found a significant correlation between increased uptake and disease progression, with patients having high 18F-FDG uptake more likely to experience progression of AS [57]. Subsequent studies confirmed the feasibility and reproducibility of PET/CT imaging in AS, with 18F-NaF demonstrating a stronger correlation to AS severity than 18F-FDG [58]. A prospective study showed that 18F-NaF uptake was highest in severe AS cases, and both 18F-NaF and 18F-FDG predicted disease progression and adverse outcomes, with both being independent predictors of cardiovascular events and aortic valve replacement (AVR) [59]. Further research has identified potential therapeutic targets, such as lipoprotein(a) (Lp(a)) and oxidized phospholipids (OxPL), with higher 18F-NaF uptake in patients with elevated Lp(a), suggesting that targeting these pathways may slow AS progression [60]. Additionally, 18F-NaF PET/CT has shown promise in evaluating bioprosthetic valve degeneration, correlating well with histological changes and predicting valve dysfunction [61]. Ongoing trials, such as SALTIRE 2, are using 18F-NaF to assess the impact of therapies like denosumab and alendronate on valvular calcification. While CT calcium scoring provides similar predictive value, advancements in PET/CT technology may improve its clinical utility, particularly for bioprosthetic valves.
In a cohort of asymptomatic patients with calcific aortic stenosis (AS), PET/CT imaging demonstrated that valvular 18F-NaF uptake was associated with AS severity in tricuspid aortic valve (TAV) patients and selectively in women with bicuspid aortic valve (BAV). In contrast, 18F-FDG uptake showed no consistent relationship with disease severity in either group. On follow-up, higher 18F-NaF activity and baseline valve velocity predicted AS progression in TAV, whereas in BAV, age and valve velocity were the strongest predictors. These findings highlight 18F-NaF PET/CT as a promising tool for assessing disease activity and progression in TAV, with limited prognostic value for 18F-FDG [61].
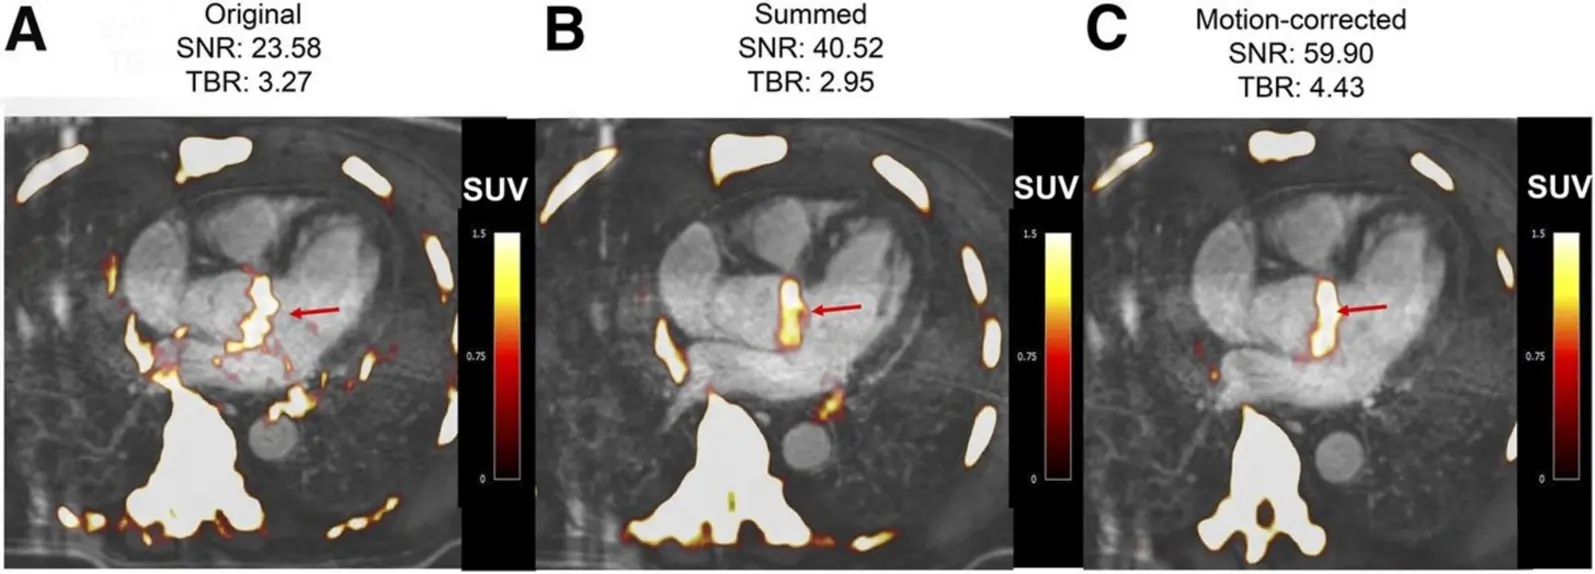
Figure 4. Fused 18F-fluoride PET/contrast-enhanced MR angiograms of aortic valve of 60-y-old man with aortic stenosis. Shown are original diastolic gate (A), summed image (B), and motion-corrected image (C) with focal 18F-fluoride uptake (arrows).
11.2. PET/MR in Aortic Stenosis
PET/MR is an emerging imaging technique that combines high-resolution MRI with sensitive PET molecular imaging, offering advantages such as superior tissue characterization, motion correction, and reduced radiation exposure. However, its clinical adoption remains limited due to the high cost and technical challenges, particularly in cardiac applications. Notably, PET/MR employs a different method for attenuation correction, based on proton density, with some limitations in cardiac studies due to motion artifacts and mis-segmentation. Despite these challenges, PET/MR has shown promise in assessing aortic stenosis, with early studies by Doris et al. demonstrating increased 18F-fluoride uptake and improved signal-to-noise ratios in the aortic valve region [62]. Additionally, PET/MR has been used to assess myocardial infarction and inflammatory heart diseases like sarcoidosis, myocarditis, and endocarditis, as well as to differentiate subtypes of cardiac amyloid [63]. The technique has particular promise for assessing chronic conditions like bicuspid aortic valve disease, given its reduced radiation exposure, which is important for younger patients. PET/MR is being explored as a tool in trials like BASIK2 to evaluate the effect of vitamin K2 on valvular calcification in patients with bicuspid aortic valve disease [64]. Furthermore, a validation study comparing PET/CT and PET/MR in coronary artery disease and aortic stenosis is underway to determine if PET/MR can provide comparable results to PET/CT. Ongoing studies may establish PET/MR’s role in enhancing our understanding of the temporal relationship between inflammation, fibrosis, and calcification in aortic stenosis.
12. Challenges and Future Perspectives
A number of methods are being developed to improve the management of patients with native AS. These methods focus mainly on three areas: initial diagnosis and screening, understanding the underlying pathophysiology, and assessing the valve. The development of handheld echo and even smartphone-associated probes, which can be associated with Artificial Intelligence (AI), can help primary care physicians and even the patients themselves in the screening of AS. Some AI software is being developed to detect AS on the ECG [65]. In addition, some markers are being developed to identify various stages in the pathophysiology of AS. By identifying these stages, novel therapies, including medications and interventions treatments can be developed to improve AS management [4]. The follow-up of people with AS is routinely done by TTE. With the development of therapies that target valve calcification and fibrosis, contrast CT assessment may be considered to study the effectiveness of these therapies, especially in phase 2 of clinical trials [66].
An increase in the use of AI is happening not only in the diagnosis, as stated earlier, but also in the management of AS. It has high accuracy in the analysis of echo parameters, resolving discrepancies in the assessment of the severity of AS; AI models have been trained to estimate AVA without relying on error-prone LVOT measurements. It can also reduce treatment initiation, misdiagnoses, and healthcare costs. Machine learning tools also help predict the progression of mild-to-moderate AS, optimizing follow-up timing and reducing unnecessary echocardiograms. Additionally, it can classify patients into risk groups and predict their outcome and prognosis in a way that can be better than traditional predicting methods [67].
Although PET/CT imaging faces several limitations, including radiation exposure, high costs, limited accessibility, and susceptibility to motion artifacts that compromise resolution in small cardiac structures such as coronary arteries and valve leaflets [68], it has increasingly demonstrated promise in the evaluation of valvular heart disease, particularly through 18F-NaF tracers. Early work established that 18F-NaF uptake strongly correlates with disease severity in AVS, distinguishing patients with active calcification from those without calcium deposits, and aligning with both echocardiographic markers of dysfunction and histological evidence of active mineralization [69]. More recent studies have confirmed its prognostic value, showing that higher 18F-NaF uptake predicts progression of aortic and mitral valve calcification, future deterioration in hemodynamics, and eventual need for valve replacement [70], with particularly strong associations observed in individuals with elevated lipoprotein(a) (Lp(a)) and oxidized phospholipid levels [71].
Some new evidence shows that Lp(a), due to its high concentration of OxPL, contributes to calcific AS. OxPL promote microcalcification, inflammation, and osteogenic differentiation of the valve cells. There is a consistent association between high Lp(a) levels and greater 18F-NaF PET uptake, and with faster hemodynamic progression of AS. Genetic studies support even further that Lp(a) is a genetic driver of AS and not simply a marker of disease progression. Even though no therapy with valve-specific benefits has been approved, novel antisense and siRNA-based Lp(a)-lowering agents have been shown to achieve 80–95% reductions in circulating Lp(a) which makes these agents promising candidates for future trials. With this, Lp(a) testing may help in risk stratification of patients, especially younger ones or those with rapidly progressive disease, and could help guide selection of targeted therapies aimed at slowing disease progression [60]. Importantly, 18F-NaF PET/CT has also been shown to identify early bioprosthetic valve degeneration before changes in valve function occur [72], providing a non-invasive method for surveillance of both surgical and transcatheter prostheses. Sex- and phenotype-specific differences have also emerged, with uptake predicting progression in tricuspid valve disease, especially in women, but not consistently in bicuspid AVS [61], highlighting the need for further stratified analyses. Beyond risk prediction, the modality is now being incorporated into interventional trials. Although the SALTIRE II study found no benefit of osteoporosis drugs on slowing calcific progression [73], and the BASIK2 trial of vitamin K2 is ongoing [64], these investigations demonstrate the growing role of 18F-NaF PET/CT as both a surrogate marker of therapeutic response and a potential endpoint for drug development. Together, these findings suggest that despite its practical constraints, 18F-NaF PET/CT holds substantial promise as a future tool for early detection, risk stratification, and therapeutic monitoring in calcific valvular heart disease, offering a precision medicine approach that could transform clinical management once effective disease-modifying therapies emerge.
13. Conclusions
Native aortic stenosis is a progressive valvular disease with significant clinical consequences if left untreated. Timely and accurate assessment is critical for identifying disease severity, guiding intervention, and improving patient outcomes. While echocardiography remains the first-line modality, integrating advanced imaging techniques—such as computed tomography and cardiac magnetic resonance—offers complementary insights into valve anatomy, calcification, left ventricular remodeling, and myocardial fibrosis. These modalities enhance the diagnostic precision of AS and its phenotypes, including discordant and low-flow, low-gradient or discordant cases, and help optimize the timing of valve intervention. A multimodality imaging approach allows for a more comprehensive evaluation of the complex pathophysiology of AS and facilitates individualized patient care. As imaging technology continues to evolve, future research should focus on standardizing imaging criteria, validating novel imaging biomarkers, and integrating artificial intelligence tools to support clinical decision-making. Incorporating multimodal imaging into routine clinical practice represents a pivotal step in the contemporary management of patients with native aortic stenosis to improve their clinical outcomes.
Author Contributions
Conceptualization T.K.M.W. and A.D.A., Original draft preparation A.D.A., K.H., E.H., A.A., writing A.D.A., K.H., A.A., A.G., V.M., R.J.R., Y.O., J.E.R., A.F., visualization J.E.R., K.H., supervision T.K.M.W.
Ethics Statement
Not applicable.
Informed Consent Statement
Not applicable.
Data Availability Statement
Not applicable.
Funding
This article received no funding.
Declaration of Competing Interest
The authors declare that they have no known competing financial interests or personal relationships that could have appeared to influence the work reported in this paper.
References
-
Otto CM, Nishimura RA, Bonow RO, Carabello BA, Erwin JP III, Gentile F, et al. 2020 ACC/AHA Guideline for the Management of Patients With Valvular Heart Disease: Executive Summary: A Report of the American College of Cardiology/American Heart Association Joint Committee on Clinical Practice Guidelines. J. Am. Coll. Cardiol. 2021, 77, 450–500. doi:10.1161/CIR.0000000000000932. [Google Scholar]
-
Praz F, Borger MA, Lanz J, Marin-Cuartas M, Abreu A, Adamo M, et al. 2025 ESC/EACTS Guidelines for the management of valvular heart disease: Developed by the task force for the management of valvular heart disease of the European Society of Cardiology (ESC) and the European Association for Cardio-Thoracic Surgery (EACTS). Eur. Heart J. 2025, 46, 4635–4736. doi:10.1093/eurheartj/ehaf194. [Google Scholar]
-
Besir B, Kapadia S. The role of multimodality imaging in aortic valve assessment: A review. J. Heart Valve Soc. 2024, 1, 30494826241296390. doi:10.1177/30494826241296390. [Google Scholar]
-
Dweck MR, Loganath K, Bing R, Treibel TA, McCann GP, Newby DE, et al. Multi-modality imaging in aortic stenosis: An EACVI clinical consensus document. Eur. Heart J.-Cardiovasc. Imaging 2023, 24, 1430–1443. doi:10.1093/ehjci/jead153. [Google Scholar]
-
Towler DA. Molecular and cellular aspects of calcific aortic valve disease. Circ. Res. 2013, 113, 198–208. doi:10.1161/CIRCRESAHA.113.300155. [Google Scholar]
-
Akahori H, Tsujino T, Naito Y, Matsumoto M, Lee-Kawabata M, Ohyanagi M, et al. Intraleaflet haemorrhage is associated with rapid progression of degenerative aortic valve stenosis. Eur. Heart J. 2010, 32, 888–896. doi:10.1093/eurheartj/ehq479. [Google Scholar]
-
Abdul-Rahman T, Lizano-Jubert I, Garg N, Talukder S, Lopez PP, Awuah WA, et al. The common pathobiology between coronary artery disease and calcific aortic stenosis: Evidence and clinical implications. Prog. Cardiovasc. Dis. 2023, 79, 89–99. doi:10.1016/j.pcad.2023.06.002. [Google Scholar]
-
Zhao Y, Nicoll R, He YH, Henein MY. The effect of statins on valve function and calcification in aortic stenosis: A meta-analysis. Atherosclerosis 2016, 246, 318–324. doi:10.1016/j.atherosclerosis.2016.01.023. [Google Scholar]
-
Mengi S, Januzzi JLJ, Cavalcante JL, Avvedimento M, Galhardo A, Bernier M, et al. Aortic Stenosis, Heart Failure, and Aortic Valve Replacement. JAMA Cardiol. 2024, 9, 1159–1168. doi:10.1001/jamacardio.2024.3486. [Google Scholar]
-
Michelena HI, Prakash SK, Della Corte A, Bissell MM, Anavekar N, Mathieu P, et al. Bicuspid aortic valve: Identifying knowledge gaps and rising to the challenge from the International Bicuspid Aortic Valve Consortium (BAVCon). Circulation 2014, 129, 2691–2704. doi:10.1161/CIRCULATIONAHA.113.007851. [Google Scholar]
-
Yang LT, Ye Z, Wajih Ullah M, Maleszewski JJ, Scott CG, Padang R, et al. Bicuspid aortic valve: Long-term morbidity and mortality. Eur. Heart J. 2023, 44, 4549–4562. doi:10.1093/eurheartj/ehad477. [Google Scholar]
-
Watkins DA, Johnson CO, Colquhoun SM, Karthikeyan G, Beaton A, Bukhman G, et al. Global, Regional, and National Burden of Rheumatic Heart Disease, 1990–2015. N. Engl. J. Med. 2017, 377, 713–722. doi:10.1056/NEJMoa1603693. [Google Scholar]
-
Carabello BA, Paulus WJ. Aortic stenosis. Lancet 2009, 373, 956–966. doi:10.1016/S0140-6736(09)60211-7. [Google Scholar]
-
Hancock EW, Deal BJ, Mirvis DM, Okin P, Kligfield P, Gettes LS, et al. AHA/ACCF/HRS recommendations for the standardization and interpretation of the electrocardiogram: Part V: Electrocardiogram changes associated with cardiac chamber hypertrophy: A scientific statement from the American Heart Association Electrocardiograph. J. Am. Coll. Cardiol. 2009, 53, 992–1002. doi:10.1016/j.jacc.2008.12.015. [Google Scholar]
-
Cavalcante PN, Kanhouche G, Rosa VEE, Campos CM, Lopes MP, Lopes MAAADM, et al. B-type natriuretic peptide and N-terminal Pro-B-type natriuretic peptide in severe aortic stenosis: A comprehensive literature review. Front. Cardiovasc. Med. 2023, 10, 1182530. doi:10.3389/fcvm.2023.1182530. [Google Scholar]
-
Small A, Kiss D, Giri J, Anwaruddin S, Siddiqi H, Guerraty M, et al. Biomarkers of Calcific Aortic Valve Disease. Arterioscler. Thromb. Vasc. Biol. 2017, 37, 623–632. doi:10.1161/ATVBAHA.116.308615. [Google Scholar]
-
ASE’s Comprehensive Echocardiography—ClinicalKey. Available online: https://www.clinicalkey.com/#!/browse/book/3-s2.0-C20160019678 (accessed on 7 July 2025). [Google Scholar]
-
Armstrong WF, Ryan T. Feigenbaum’s Echocardiography, 8th ed.; Lippincott Williams & Wilkins: Philadelphia, PA, USA, 2019; p. 771. [Google Scholar]
-
Freeman RV, Otto CM. Spectrum of Calcific Aortic Valve Disease. Circulation 2005, 111, 3316–3326. doi:10.1161/CIRCULATIONAHA.104.486738. [Google Scholar]
-
Oh JK, Kane GC, Seward JB, Tajik AJ. The Echo Manual, 4e. Lippincott Williams & Wilkins, a Wolters Kluwer Business. 2019. Available online: https://cardiology.lwwhealthlibrary.com/book.aspx?bookid=3037§ionid=0 (accessed on 7 July 2025). [Google Scholar]
-
Textbook of Clinical Echocardiography—ClinicalKey. Available online: https://www.clinicalkey.com/#!/browse/book/3-s2.0-C20160001997 (accessed on 7 July 2025). [Google Scholar]
-
Kablak-Ziembicka A, Przewlocki T, Tracz W, Podolec P, Stopa I, Kostkiewicz M, et al. Prognostic Value of Carotid Intima-Media Thickness in Detection of Coronary Atherosclerosis in Patients With Calcified Aortic Valve Stenosis. J. Ultrasound Med. 2005, 24, 461–467. doi:10.7863/jum.2005.24.4.461. [Google Scholar]
-
Baran J, Kleczyński P, Niewiara Ł, Podolec J, Badacz R, Gackowski A, et al. Importance of Increased Arterial Resistance in Risk Prediction in Patients with Cardiovascular Risk Factors and Degenerative Aortic Stenosis. J. Clin. Med. 2021, 10, 2109. doi:10.3390/jcm10102109. [Google Scholar]
-
Maslow AD, Mashikian J, Haering JM, Heindel S, Douglas P, Levine R. Transesophageal echocardiographic evaluation of native aortic valve area: Utility of the double-envelope technique. J. Cardiothorac. Vasc. Anesth. 2001, 15, 293–299. doi:10.1053/jcan.2001.23272. [Google Scholar]
-
Yousry M, Rickenlund A, Petrini J, Jenner J, Liska J, Eriksson P, et al. Aortic valve type and calcification as assessed by transthoracic and transoesophageal echocardiography. Clin. Physiol. Funct. Imaging 2014, 35, 306–313. doi:10.1111/cpf.12166. [Google Scholar]
-
Furukawa A, Abe Y, Tanaka C, Ito K, Tabuchi I, Osawa K, et al. Comparison of two-dimensional and real-time three-dimensional transesophageal echocardiography in the assessment of aortic valve area. J. Cardiol. 2012, 59, 337–343. doi:10.1016/j.jjcc.2012.01.011. [Google Scholar]
-
Jilaihawi H, Doctor N, Kashif M, Chakravarty T, Rafique A, Makar M, et al. Aortic annular sizing for transcatheter aortic valve replacement using cross-sectional 3-dimensional transesophageal echocardiography. J. Am. Coll. Cardiol. 2013, 61, 908–916. doi:10.1016/j.jacc.2012.11.055. [Google Scholar]
-
Baumgartner H, Hung J, Bermejo J, Chambers JB, Edvardsen T, Goldstein S, et al. Recommendations on the Echocardiographic Assessment of Aortic Valve Stenosis: A Focused Update from the European Association of Cardiovascular Imaging and the American Society of Echocardiography. J. Am. Soc. Echocardiogr. 2017, 30, 372–392. doi:10.1016/j.echo.2017.02.009. [Google Scholar]
-
Monin JL, Monchi M, Gest V, Duval-Moulin AM, Dubois-Rande JL, Gueret P. Aortic stenosis with severe left ventricular dysfunction and low transvalvular pressure gradients: Risk stratification by low-dose dobutamine echocardiography. J. Am. Coll. Cardiol. 2001, 37, 2101–2107. doi:10.1016/S0735-1097(01)01339-0. [Google Scholar]
-
Annabi M, Clavel M, Pibarot P. Dobutamine Stress Echocardiography in Low-Flow, Low-Gradient Aortic Stenosis: Flow Reserve Does Not Matter Anymore. J. Am. Heart Assoc. 2019, 8, e012212. doi:10.1161/JAHA.119.012212. [Google Scholar]
-
Choudhary KV, Kakouros N, Aurigemma GP, Parker MW, Fitzgibbons T. Differentiating Pseudo Versus True Aortic Stenosis in Patients Without Contractile Reserve: A Diagnostic Dilemma. Cureus 2021, 13, e14086. doi:10.7759/cureus.14086. [Google Scholar]
-
Clavel MA, Dumesnil JG, Capoulade R, Mathieu P, Sénéchal M, Pibarot P. Outcome of patients with aortic stenosis, small valve area, and low-flow, low-gradient despite preserved left ventricular ejection fraction. J. Am. Coll. Cardiol. 2012, 60, 1259–1267. doi:10.1016/j.jacc.2011.12.054. [Google Scholar]
-
Hachicha Z, Dumesnil JG, Pibarot P. Usefulness of the Valvuloarterial Impedance to Predict Adverse Outcome in Asymptomatic Aortic Stenosis. J. Am. Coll. Cardiol. 2009, 54, 1003–1011. doi:10.1016/j.jacc.2009.04.079. [Google Scholar]
-
Bahlmann E, Gerdts E, Cramariuc D, Gohlke-Baerwolf C, Nienaber CA, Wachtell K, et al. Prognostic value of energy loss index in asymptomatic aortic stenosis. Circulation 2013, 127, 1149–1156. doi:10.1161/CIRCULATIONAHA.112.078857. [Google Scholar]
-
Kovacs G, Humbert M, Avian A, Lewis GD, Ulrich S, Vonk Noordegraaf A, et al. Prognostic relevance of exercise pulmonary hypertension: Results of the multicentre PEX-NET Clinical Research Collaboration. Eur. Respir. J. 2024, 60, 2400698. doi:10.1183/13993003.00698-2024. [Google Scholar]
-
Grodecki K, Warniello M, Spiewak M, Kwiecinski J. Advanced Cardiac Imaging in the Assessment of Aortic Stenosis. J. Cardiovasc. Dev. Dis. 2023, 10, 216. doi:10.3390/jcdd10050216. [Google Scholar]
-
Pawade T, Sheth T, Guzzetti E, Dweck MR, Clavel MA. Why and How to Measure Aortic Valve Calcification in Patients With Aortic Stenosis. JACC Cardiovasc. Imaging 2019, 12, 1835–1848. doi:10.1016/j.jcmg.2019.01.045. [Google Scholar]
-
Wang TKM, Flamm SD, Schoenhagen P, Griffin BP, Rodriguez LL, Grimm RA, et al. Diagnostic and Prognostic Performance of Aortic Valve Calcium Score with Cardiac CT for Aortic Stenosis: A Meta-Analysis. Radiol. Cardiothorac. Imaging 2021, 3, e210075. doi:10.1148/ryct.2021210075. [Google Scholar]
-
Pontes ÍCDM, Guimarães CPBDF, Fonseca EKUN, Silva MMA, Sasdelli Neto R, Ishikawa WY. Computed tomography angiography in the planning of transcatheter aortic valve replacement: A step-by-step approach. Radiol. Bras. 2022, 55, 373–379. doi:10.1590/0100-3984.2021.0156. [Google Scholar]
-
Ajmone Marsan N, Delgado V, Shah DJ, Pellikka P, Bax JJ, Treibel T, et al. Valvular heart disease: Shifting the focus to the myocardium. Eur. Heart J. 2023, 44, 28–40. doi:10.1093/eurheartj/ehac504. [Google Scholar]
-
Myerson SG. CMR in Evaluating Valvular Heart Disease: Diagnosis, Severity, and Outcomes. JACC Cardiovasc. Imaging 2021, 14, 2020–2032. doi:10.1016/j.jcmg.2020.09.029. [Google Scholar]
-
Bohbot Y, Renard C, Manrique A, Levy F, Maréchaux S, Gerber BL, et al. Usefulness of Cardiac Magnetic Resonance Imaging in Aortic Stenosis. Circ. Cardiovasc. Imaging 2020, 13, e010356. doi:10.1161/CIRCIMAGING.119.010356. [Google Scholar]
-
Wymer DT, Patel KP, Burke WF III, Bhatia VK. Phase-Contrast MRI: Physics, Techniques, and Clinical Applications. RadioGraphics 2020, 40, 122–140. doi:10.1148/rg.2020190039. [Google Scholar]
-
Caruthers SD, Lin SJ, Brown P, Watkins MP, Williams TA, Lehr KA, et al. Practical value of cardiac magnetic resonance imaging for clinical quantification of aortic valve stenosis: Comparison with echocardiography. Circulation 2003, 108, 2236–2243. doi:10.1161/01.CIR.0000095268.47282.A1. [Google Scholar]
-
Chai P, Mohiaddin R. How we perform cardiovascular magnetic resonance flow assessment using phase-contrast velocity mapping. J. Cardiovasc. Magn. Reson. 2005, 7, 705–716. doi:10.1081/JCMR-200065639. [Google Scholar]
-
Bissell MM, Raimondi F, Ait Ali L, Allen BD, Barker AJ, Bolger A, et al. 4D Flow cardiovascular magnetic resonance consensus statement: 2023 update. J. Cardiovasc. Magn. Reson. 2023, 25, 40. doi:10.1186/s12968-023-00942-z. [Google Scholar]
-
Archer GT, Elhawaz A, Barker N, Fidock B, Rothman A, van der Geest RJ, et al. Validation of four-dimensional flow cardiovascular magnetic resonance for aortic stenosis assessment. Sci. Rep. 2020, 10, 10569. doi:10.1038/s41598-020-66659-6. [Google Scholar]
-
Rose MJ, Jarvis K, Chowdhary V, Barker AJ, Allen BD, Robinson JD, et al. Efficient method for volumetric assessment of peak blood flow velocity using 4D flow MRI. J. Magn. Reson. Imaging 2016, 44, 1673–1682. doi:10.1002/jmri.25305. [Google Scholar]
-
Dweck MR, Joshi S, Murigu T, Alpendurada F, Jabbour A, Melina G, et al. Midwall fibrosis is an independent predictor of mortality in patients with aortic stenosis. J. Am. Coll. Cardiol. 2011, 58, 1271–1279. doi:10.1016/j.jacc.2011.03.064. [Google Scholar]
-
Everett RJ, Treibel TA, Fukui M, Lee H, Rigolli M, Singh A, et al. Extracellular Myocardial Volume in Patients with Aortic Stenosis. J. Am. Coll. Cardiol. 2020, 75, 304–316. doi:10.1016/j.jacc.2019.11.032. [Google Scholar]
-
Musa TA, Treibel TA, Vassiliou VS, Captur G, Singh A, Chin C, et al. Myocardial Scar and Mortality in Severe Aortic Stenosis. Circulation 2018, 138, 1935–1947. doi:10.1161/CIRCULATIONAHA.117.032839. [Google Scholar]
-
Nakamori S, Dohi K. Myocardial tissue imaging with cardiovascular magnetic resonance. J. Cardiol. 2022, 80, 377–385. doi:10.1016/j.jjcc.2022.02.006. [Google Scholar]
-
Hwang IC, Kim HK, Park JB, Park EA, Lee W, Lee SP, et al. Aortic valve replacement-induced changes in native T1 are related to prognosis in severe aortic stenosis: T1 mapping cardiac magnetic resonance imaging study. Eur. Heart J.-Cardiovasc. Imaging 2020, 21, 653–663. doi:10.1093/ehjci/jez201. [Google Scholar]
-
Chin CWL, Everett RJ, Kwiecinski J, Vesey AT, Yeung E, Esson G, et al. Myocardial Fibrosis and Cardiac Decompensation in Aortic Stenosis. JACC Cardiovasc. Imaging 2017, 10, 1320–1333. doi:10.1016/j.jcmg.2016.10.007. [Google Scholar]
-
Tzolos E, Andrews JP, Dweck MR. Aortic valve stenosis-multimodality assessment with PET/CT and PET/MRI. Br. J. Radiol. 2020, 93, 20190688. doi:10.1259/bjr.20190688. [Google Scholar]
-
Khedr AE, Odeh NB, Bcharah G, Abdalla HM, Senjab A, Zeineddine RM, et al. Comparing Early Intervention to Watchful Waiting: A Review on Risk Stratification and Management in Asymptomatic Aortic Stenosis. Medicina 2025, 61, 448. doi:10.3390/medicina61030448. [Google Scholar]
-
Marincheva-Savcheva G, Subramanian S, Qadir S, Figueroa A, Truong Q, Vijayakumar J, et al. Imaging of the aortic valve using fluorodeoxyglucose positron emission tomography increased valvular fluorodeoxyglucose uptake in aortic stenosis. J. Am. Coll. Cardiol. 2011, 57, 2507–2515. doi:10.1016/j.jacc.2010.12.046. [Google Scholar]
-
Dweck MR, Jones C, Joshi NV, Fletcher AM, Richardson H, White A, et al. Assessment of valvular calcification and inflammation by positron emission tomography in patients with aortic stenosis. Circulation 2012, 125, 76–86. doi:10.1161/CIRCULATIONAHA.111.051052. [Google Scholar]
-
Dweck MR, Khaw HJ, Sng GKZ, Luo ELC, Baird A, Williams MC, et al. Aortic stenosis, atherosclerosis, and skeletal bone: Is there a common link with calcification and inflammation? Eur. Heart J. 2013, 34, 1567–1574. doi:10.1093/eurheartj/eht034. [Google Scholar]
-
Arsenault BJ, Loganath K, Girard A, Botezatu S, Zheng KH, Tzolos E, et al. Lipoprotein(a) and Calcific Aortic Valve Stenosis Progression: A Systematic Review and Meta-Analysis. JAMA Cardiol. 2024, 9, 835–842. doi:10.1001/jamacardio.2024.1882. [Google Scholar]
-
Murtazalieva P, Ryzhkova D, Malev E, Zhiduleva E, Moiseeva O. Prediction of Aortic Stenosis Progression by (18)F-FDG and (18)F-NaF PET/CT in Different Aortic Valve Phenotypes. Front. Pharmacol. 2022, 13, 909975. doi:10.3389/fphar.2022.909975. [Google Scholar]
-
Doris MK, Rubeaux M, Pawade T, Otaki Y, Xie Y, Li D, et al. Motion-Corrected Imaging of the Aortic Valve with (18)F-NaF PET/CT and PET/MRI: A Feasibility Study. J. Nucl. Med. 2017, 58, 1811–1814. doi:10.2967/jnumed.117.194597. [Google Scholar]
-
Abgral R, Dweck MR, Trivieri MG, Robson PM, Karakatsanis N, Mani V, et al. Clinical Utility of Combined FDG-PET/MR to Assess Myocardial Disease. JACC Cardiovasc. Imaging 2017, 10, 594–597. doi:10.1016/j.jcmg.2016.02.029. [Google Scholar]
-
Peeters FECM, van Mourik MJW, Meex SJR, Bucerius J, Schalla SM, Gerretsen SC, et al. Bicuspid Aortic Valve Stenosis and the Effect of Vitamin K2 on Calcification Using (18)F-Sodium Fluoride Positron Emission Tomography/Magnetic Resonance: The BASIK2 Rationale and Trial Design. Nutrients 2018, 10, 386. doi:10.3390/nu10040386. [Google Scholar]
-
Cohen-Shelly M, Attia ZI, Friedman PA, Ito S, Essayagh BA, Ko WY, et al. Electrocardiogram screening for aortic valve stenosis using artificial intelligence. Eur. Heart J. 2021, 42, 2885–2896. doi:10.1093/eurheartj/ehab153. [Google Scholar]
-
Fukui M, Sorajja P, Hashimoto G, Lopes BBC, Stanberry LI, Garcia S, et al. Right ventricular dysfunction by computed tomography associates with outcomes in severe aortic stenosis patients undergoing transcatheter aortic valve replacement. J. Cardiovasc. Comput. Tomogr. 2022, 16, 158–165. doi:10.1016/j.jcct.2021.11.005. [Google Scholar]
-
Manzo R, Ilardi F, Nappa D, Mariani A, Angellotti D, Immobile Molaro M, et al. Echocardiographic Evaluation of Aortic Stenosis: A Comprehensive Review. Diagnostics 2023, 13, 2527. doi:10.3390/diagnostics13152527. [Google Scholar]
-
De Azevedo D, Geers J, Gheysens O, Dweck M, Vancraeynest D. (18)F-Sodium Fluoride PET/CT in Assessing Valvular Heart and Atherosclerotic Diseases. Semin. Nucl. Med. 2023, 53, 241–257. doi:10.1053/j.semnuclmed.2022.08.007. [Google Scholar]
-
Dweck MR, Jenkins WSA, Vesey AT, Pringle MAH, Chin CWL, Malley TS, et al. 18F-sodium fluoride uptake is a marker of active calcification and disease progression in patients with aortic stenosis.Circ. Cardiovasc. Imaging 2014, 7, 371–378. doi:10.1161/CIRCIMAGING.113.001508. [Google Scholar]
-
Nakamoto Y, Kitagawa T, Sasaki K, Tatsugami F, Awai K, Hirokawa Y, et al. Clinical implications of (18)F-sodium fluoride uptake in subclinical aortic valve calcification: Its relation to coronary atherosclerosis and its predictive value. J. Nucl. Cardiol. 2021, 28, 1522–1531. doi:10.1007/s12350-019-01879-6. [Google Scholar]
-
Després AA, Perrot N, Poulin A, Tastet L, Shen M, Chen HY, et al. Lipoprotein(a), Oxidized Phospholipids, and Aortic Valve Microcalcification Assessed by 18F-Sodium Fluoride Positron Emission Tomography and Computed Tomography. CJC Open 2019, 1, 131–140. doi:10.1016/j.cjco.2019.03.004. [Google Scholar]
-
Cartlidge TRG, Doris MK, Sellers SL, Pawade TA, White AC, Pessotto R, et al. Detection and Prediction of Bioprosthetic Aortic Valve Degeneration. J. Am. Coll. Cardiol. 2019, 73, 1107–1119. doi:10.1016/j.jacc.2018.12.056. [Google Scholar]
-
Pawade TA, Doris MK, Bing R, White AC, Forsyth L, Evans E, et al. Effect of Denosumab or Alendronic Acid on the Progression of Aortic Stenosis: A Double-Blind Randomized Controlled Trial. Circulation 2021, 143, 2418–2427. doi:10.1161/CIRCULATIONAHA.121.053708. [Google Scholar]