Machine Learning in Forensic Anthropology: Sex Classification of Fingerprints

Machine Learning in Forensic Anthropology: Sex Classification of Fingerprints
Received: 08 October 2025 Revised: 27 October 2025 Accepted: 19 November 2025 Published: 26 November 2025

© 2025 The authors. This is an open access article under the Creative Commons Attribution 4.0 International License (https://creativecommons.org/licenses/by/4.0/).
1. Introduction
There are different types of biometric evidence, such as iris patterns, facial features, voice, gait patterns, etc., that form a robust identification system for personal identification [1]. The fingerprint recognition is the most prominent parameter for the identification of a human being because of its unique, permanent, and inimitable features. Common evidence that one can come across at crime scenes is a fingerprint, which can help to narrow down the investigation. Fingerprints may be recovered from numerous objects such as cutlery, window glasses, doorknobs, the steering of a vehicle, and even from human skin [2]. In the 21st century, artificial intelligence and machine learning play a very important role in forensic science for identification purposes. Because of concern about security, authentication, forensic and criminal investigation, fingerprints have gained attention as an essential feature of human beings [3]. So, Artificial intelligence is playing a vital role in the recognition and identification of an individual through fingerprints, if trained well. Fingerprint patterns and ridge density are very imperative aspects of the fingerprint science, which make them biological traits for anthropological and forensic studies [4,5]. Fingerprint ridge density (FPRD) can be defined as the number of ridges present per unit area of a fingerprint [6]. FPRD can also be defined as the ridge count present in a defined area of a fingerprint, and it can be considered as an important parameter to classify the sex of a person from a fingerprint [7]. Females tend to have higher ridge density as compared to males because males have larger body proportions with greater surface area than females, which results in the distribution of a similar number of ridges on a larger surface area [8]. There are many studies conducted by different researchers on different sets of populations to classify the sex of the fingerprint through the FPRD [9,10,11]. Ridge density has not only been evaluated on the fingers but also on the footprints [12] and palmprints [13] for sex classification of the individuals. These studies have been conducted using manual analysis, i.e., calculation of the FPRD by counting the fingerprint ridges manually.
After going through the literature, it has been observed that no study used artificial intelligence (AI) and machine learning (ML) models to classify fingerprints on the basis of fingerprint ridge density, i.e., FPRD. However, there are few studies that classified the sex of the person based upon fingerprints, but they used different parameters or features of the fingerprints, and research has been done on the other aspects of fingerprint classification algorithms, including classification and detection [14,15]. Using a time domain technique and systematic pixel counting, A gender detection system was developed for fingerprints that achieved 90.2% accuracy for females and 96.4% for males [16]. The dataset used by the researchers was a secondary dataset. However, the method is not appropriate for low-quality latent fingerprints. Similarly, for latent fingerprint segmentation, [17] integrated local ridge frequency characteristics with fingerprint ridge orientation. The suggested work used small and different datasets, which was the biggest drawback. Additionally, the proposal did not include matching algorithms and ridge types, among other aspects. Researchers used different classifiers to classify fingerprints with Naïve Bayes, SVM, Logistic Regression, and Random forest, where they found Random forest to be the most sensitive for gender segregation [18]. But they worked on fingerprint images where they used termination and bifurcation as characters for fingerprint minutiae, not fingerprint ridge density. A comparative approach of fingerprint based gender identification was made through different machine learning models like Principal Component Analysis (PCA) and fused features for gender classification [19]. He made a comparison for k nearest neighbors (KNN) and SVM, where SVM has shown better accuracy, but again, the study was not based on FPRD but on other characteristics of fingerprints. The limitation of earlier studies is that the researchers did not use population specific data or data of a particular endogamous population group to classify the sex of the fingerprint through fingerprint ridge density. The previous studies were also not utilized Random forest for sex classification with the features of fingerprint ridge density.
The objective of the research is to classify sex using fingerprint ridge density through Random Forest as a tool of machine learning. The Random Forest model was customized to classify the sex of the fingerprint through FPRD. The present study may have implications in sex determination from fingerprints recovered from the crime scene and may help to reduce the burden of the investigating officer, i.e., after knowing the gender or sex of the criminal, the officer may focus the investigation on a particular sex.
2. Material and Methodology
Participants and data collection: The fingerprints of the north Indian population aged between 18 to 45 years were collected on fingerprint card with the help of a standard and sophisticated inkpad. A total of 2040 fingerprints from 204 participants (102 males and 102 females) were collected. The standard procedure given was followed for recording the fingerprints. Rolled fingerprints, i.e., nail to nail prints, were taken instead of press prints [20]. The most important concern of the study is maintaining the privacy and anonymity of the subjects. Ethical clearance was taken for collecting the data from the Panjab University Institutional Ethics Committee (PUIEC) vide letter no EC-D-2405-283.
Inclusion and exclusion criteria: In this study, only healthy individuals in a specific age group, i.e., 18–45, have been included. Persons with severe injuries, scars, or disease, deliberate alterations, or incomplete fingerprints were excluded from the study.
Calculation of fingerprint ridge density (FPRD): For the calculation of fingerprint ridge density (FPRD), the standard methodology as described was used [7]. The number of ridges that occur in the 5 × 5 mm square in the three areas,i.e., Radial, Ulnar, and Proximal area, were calculated (Figure 1). The square of 5 × 5 mm on a transparent film was made and placed on the fingerprint above the core of the fingerprint to calculate the ridge density. Six types of fingerprint patterns i.e,. Radial Loop, Ulnar Loop, Single Spiral Whorl, Double Spiral Whorl, Simple Arch and Tented Arch were taken in the study to calculate the fingerprint ridge density. The procedure of calculating ridge density of the fingerprint pattern is shown in Figure 1. After calculating the ridge density of all three areas (radial, ulnar, and proximal areas) of the fingerprint, the CSV file was made, and analysis was done by using an RF model. The CSV file consisted of the features of ridge density, i.e., radial, ulnar, and proximal ridge density. The customized model has been deployed using the Python language. An online platform, i.e., Google Colab has been used for implementing the Python code.
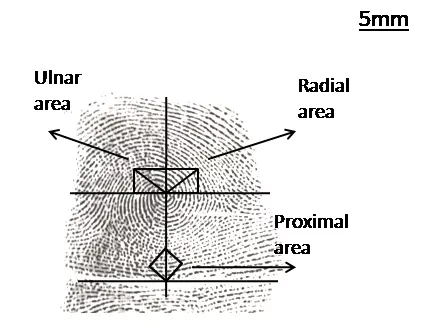
Figure 1. Figure showing the ridge density of radial, ulnar, and proximal areas on the fingerprint pattern.
Steps of utilization of Random forest (RF): A classification algorithm of machine learning was deployed for classifying sex using fingerprint ridge density. The key steps of the proposed methodology are depicted in figure Table 1. This section outlines the details regarding the data preprocessing, training of the RF model, and its testing. The first step in the proposed approach is fingerprint data collection. The ridge density information from a sample was computed by placing a 5 × 5 mm square of transparent film on the fingerprint core region (Figure 1). It assisted in computing the number of ridges in the radial, ulnar, and proximal areas of the fingerprints. The CSV file was prepared, which includes the numerical dataset of FPRD. This raw data was further pre-processed by selecting relevant features of FPRD, i.e., radial, ulnar, proximal, and normalizing the collected data. The ML model used in the work is RF, which has been coded in Python programming language on Google Colab, which is an online platform.
In general, RF models are sensitive to the scale of the data. Grid search was used because it ensures the best-performing hyperparameters are used for final testing. Grid Search also improves model generalization and prevents under/overfitting. Table 1 shows the steps and the description for sex classification of the data through fingerprint ridge density.
Table 1. Steps for using the random forest machine learning tool for sex classification of fingerprints through FPRD.
|
Steps |
Description |
|---|---|
|
1. Data Collection |
Gather labeled data with features of fingerprint ridge density and gender labels (0 = Female, 1 = Male). |
|
2. Preprocessing |
Handle missing values, encode categorical features, and normalize/standardize data. |
|
3. Feature selection |
Identify relevant features (fingerprint ridge density of radial, ulnar, and proximal area in the CSV file) using correlation or importance metrics. |
|
4. Train-Test split |
Split the dataset into training and testing sets (70:30). |
|
5. Model Training |
Train a Random Forest classifier on the training data. Parameters tuned: n_estimators (number of trees) max_depth (tree depth) min_samples_split (split criteria) min_samples_leaf (leaf size) Grid Search with 5-fold cross-validation selected the best combination.) |
|
6. Predication |
Use the trained model to predict gender on the test set. |
|
7. Evaluation |
Evaluate performance using accuracy, precision, recall, and a confusion matrix. |
|
8. Deployment |
Deploy the model into a real-world application or forensic and crime scene investigation. |
There are several metrics, like Accuracy, Confusion Matrix, Area Under the ROC Curve (Receiver operating characteristic curve, area under the curve; AUC), Precision, Recall, and F1-score, used for model evaluation, which are shown in the results section. The evaluation parameters can be computed using the following formulae:
| ```latex\mathrm{A}\mathrm{c}\mathrm{c}\mathrm{u}\mathrm{r}\mathrm{a}\mathrm{c}\mathrm{y}=\frac{\mathrm{T}\mathrm{P}+\mathrm{T}\mathrm{N}}{\mathrm{T}\mathrm{P}+\mathrm{T}\mathrm{N}+\mathrm{F}\mathrm{P}+\mathrm{F}\mathrm{N}}``` | (1) |
| ```latex\mathrm{P}\mathrm{r}\mathrm{e}\mathrm{c}\mathrm{i}\mathrm{s}\mathrm{i}\mathrm{o}\mathrm{n}=\frac{\mathrm{T}\mathrm{P}}{\mathrm{T}\mathrm{P}+\mathrm{F}\mathrm{P}}``` | (2) |
| ```latex\mathrm{R}\mathrm{e}\mathrm{c}\mathrm{a}\mathrm{l}\mathrm{l}=\frac{\mathrm{T}\mathrm{P}}{\mathrm{T}\mathrm{P}+\mathrm{F}\mathrm{N}}``` | (3) |
| ```latex\mathrm{F}1\,\mathrm{ }\mathrm{s}\mathrm{c}\mathrm{o}\mathrm{r}\mathrm{e}=\frac{2\mathrm{*}\mathrm{P}\mathrm{r}\mathrm{e}\mathrm{c}\mathrm{i}\mathrm{s}\mathrm{i}\mathrm{o}\mathrm{n}\mathrm{*}\mathrm{R}\mathrm{e}\mathrm{c}\mathrm{a}\mathrm{l}\mathrm{l}}{\mathrm{P}\mathrm{r}\mathrm{e}\mathrm{c}\mathrm{i}\mathrm{s}\mathrm{i}\mathrm{o}\mathrm{n}+\mathrm{R}\mathrm{e}\mathrm{c}\mathrm{a}\mathrm{l}\mathrm{l}}``` | (4) |
| ```latex\mathrm{S}\mathrm{e}\mathrm{n}\mathrm{s}\mathrm{i}\mathrm{t}\mathrm{i}\mathrm{v}\mathrm{i}\mathrm{t}\mathrm{y}=\frac{\mathrm{T}\mathrm{P}}{\mathrm{T}\mathrm{P}+\mathrm{F}\mathrm{N}}``` | (5) |
| ```latex\mathrm{S}\mathrm{p}\mathrm{e}\mathrm{c}\mathrm{i}\mathrm{f}\mathrm{i}\mathrm{c}\mathrm{i}\mathrm{t}\mathrm{y}=\frac{\mathrm{T}\mathrm{N}}{\mathrm{T}\mathrm{N}+\mathrm{F}\mathrm{P}}``` | (6) |
where, TP = True positive, TN = True Negative, FP = False positive, and FN = False negative. For binary classification, the ROC curve plots the true positive rate against the false positive rate at various thresholds. The area under the curve (AUC) gives an overall indication of model performance.
3. Results and Discussion
The results achieved from the proposed ML-based approach are analyzed. As described in the methodology, the dataset in the CSV file comprised ridge density of 2040 fingerprint samples that include radial, ulnar, and proximal ridge density, with 1020 samples each for male and female participants. The dataset of FPRD was pre-processed and split into training and testing sets for the implementation of the RF algorithm. The RF model is trained on 70% of the dataset (1428 samples) and tested on the remaining 30% (612 samples). The performance of the RF model for classifying sex based on fingerprint ridge density is evaluated using standard classification metrics like accuracy, precision, recall, F1-score, confusion matrix, and the ROC curve.
As per the classification, out of 612 fingerprint testing samples, the model is able to recognize 81.53% of the data correctly. The highest precision value of 82% is achieved by the model for classifying the female label, and 82% for the males. The confusion matrix in Figure 2 indicates that the model correctly classified the majority of the data samples, with a balanced classification between both male and female categories. From the test set, the model assigns 251 samples as true positives and 248 samples as true negatives.
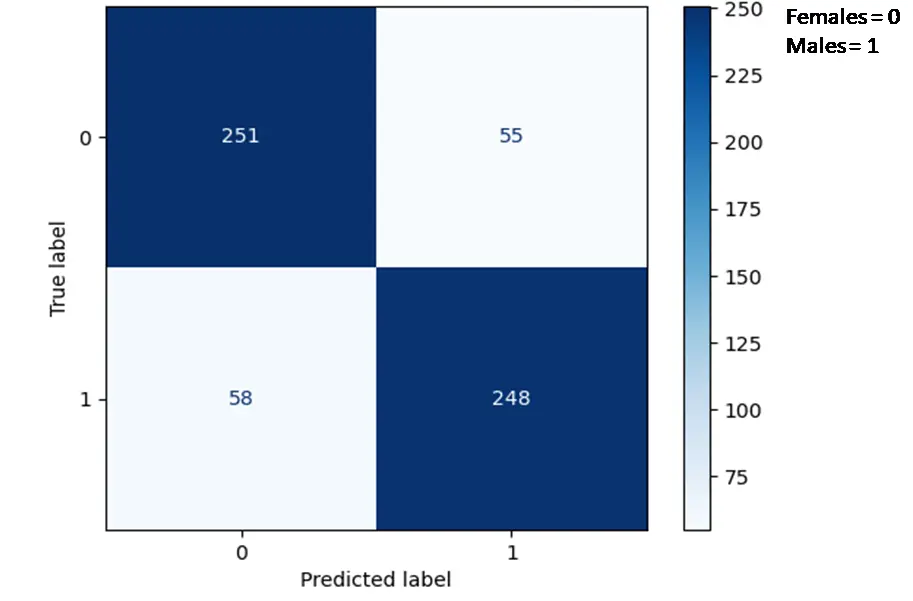
The evaluation, as per the confusion matrix (Figure 2), computed by Random forest (RF) for the ridge density of the fingerprint is given below:
| ```latex\mathrm{Accuracy} = 251 + 248/(251 + 248 + 55 + 58) = 0.8153 \,i.e., \,81.53\%``` | (7) |
| ```latex\mathrm{Precision} = 251/(251 + 55) = 0.82``` | (8) |
| ```latex\mathrm{Recall} = 251/(251 + 58) = 0.81``` | (9) |
| ```latex\mathrm{F1\,Score} = 2 × 0.82 × 0.81/(0.82 + 0.81) = 0.814``` | (10) |
where, TP = 251, FN = 58, TN = 248 and FP = 55
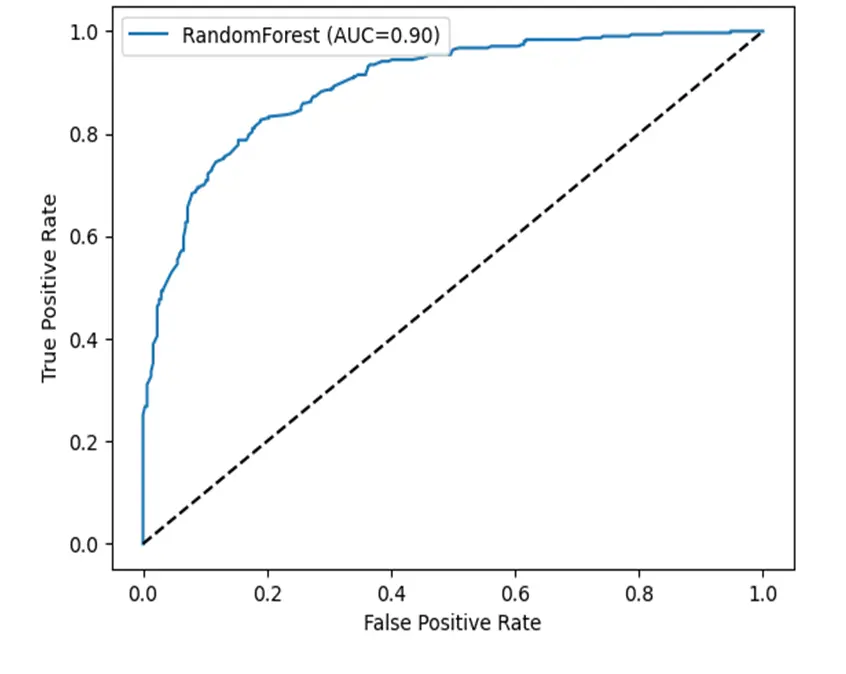
The ROC Curve for the experiment is presented in Figure 3 where the black dashed line depicts the line of random guess.
| ```latex\mathrm{Sensitivity }= 251/(251 + 58) = 0.81``` | (11) |
| ```latex\mathrm{Specificity} = 248/(248 + 55) = 0.81``` | (12) |
The Receiver Operating Characteristic (ROC) curve (Figure 3) is plotted to visualize the trade-off between the true positive rate (sensitivity) and the false positive rate (1-specificity), where the black dashed line depicts the line of random guess. To further analyze the performance of the binary classifier, the area under the curve (AUC) was also computed. The AUC value of 0.90 is obtained across different threshold values, signifying the reliable performance of the model. As per the interpretation done by Çorbacıoğlu and Aksel (2023) [21], the AUC value of more than 0.8 is very significant, which shows that the model is able to differentiate the given dataset.
The random forest learns the difference in ridge density between males and females when trained on the dataset. RF is able to classify 81.53% of the data correctly. One can estimate the pattern of the fingerprint, but sex estimation from the fingerprint on the crime scene remains a challenge for forensic anthropologists. Therefore, the sex classification from fingerprint ridge density through a machine learning technique may enhance the functionality of a system for sex recognition and human-computer interactions. A gender prediction model using the random forest algorithm was built through fingerprints, where they used parameters such as ridge endings, bifurcations, number of cores, and deltas, where they found the model reasonably accurate [22]. Further Ref. [23] proposed an efficient tool with 99% for fingerprint classification as real or altered by combining histogram oriented gradient and Gabor filters with a random forest. But the features of the fingerprint were not mentioned for classification purposes.
In the previous studies (Table 2), researchers used the images of fingerprints to train the RF model, but did not use the ridge density in the numerical value of radial, ulnar, and proximal areas. One reason for the low accuracy can be the dataset used by the researchers. In the present study, the data of a particular population has been taken, which can help forensic scientists to solve the case based on the geographical location where the particular population is located. The major advantage of the RF is that it can potentially be used as the presumptive indicator of the sex classification of any unknown fingerprint left at the crime scene. The findings indicate that the RF model can differentiate between male and female fingerprint samples using ridge density measurements. The features of FPRD offered a consistent and comprehensible depiction of the variations found between male and female fingerprints.
Table 2. Previous studies of machine learning approaches for sex classification of fingerprints.
|
Authors |
Year |
Approaches Used |
Parameters Used |
Performance |
|---|---|---|---|---|
|
Narayanan A, Sajith K [16] |
2019 |
Histogram equalization pixel count |
Fingerprint images |
90.2% for females 96.4% for males |
|
Athiraja A, et al. [17] |
2014 |
Discrete Fourier Transform |
Fingerprint Ridge orientation |
77% |
|
Tiwari M, Mishra A [18] |
2022 |
SVM, RF, Naïve Bayes, Logistic regression |
Fingerprint Images with minutiae characters |
RF was most sensitive |
|
Pisharody AS et al. [22] |
2016 |
Random Forest |
Minutiae characters |
Reasonably accurate |
|
Jasem FM et al. [23] |
2014 |
HOG, Gabor filters with RF |
Fingerprint images (real or altered) |
99% |
|
Proposed work |
Random Forest |
Fingerprint Ridge density (FPRD) |
81.53% |
4. Limitations and Recommendations
Forensic crime scenes must be categorized by sex to enable artificial intelligence algorithms to assist in locating the culprit as soon as possible. When a forensic examiner finds a fingerprint, he/she can shortlist suspects and victims from crime scenes based on sex classification. Therefore, the RF can be used in forensic investigations to classify sex based on fingerprint ridge density, thereby saving manpower. The best outcome of RF, with an accuracy of 81.53% has been achieved when evaluated using the confusion matrix for the ridge density of fingerprints. However, if the dataset will be increased to know the sex of the fingerprint through FPRD, then the accuracy may increase because the model will be able to learn more and more about the dataset and give more accurate results. There may be some factors that influence fingerprint ridge density, like age, sex, hand dimension etc. For example, when we compare fingerprint ridge density to the hand length, there is a strong correlation in both males and females [24]. The major role random forest (RF) can play is that it can save the time and energy of the forensic examiner on a particular case by just putting the data of the ridge density into the model of random forest (RF), which classifies the given data between male and female. So, more studies are suggested with a larger dataset so that RF can give more accuracy. The present study was conducted on a specific population; there may a lot of variations among people of different regions and ancestries. Therefore, further studies are suggested among diverse populations residing in different areas to validate FPRD further using ML models, to determine whether RF holds greater potential to classify sex based on fingerprint ridge density.
5. Conclusions
This study concludes that the machine learning models, such as RF, can be utilized for sex classification of fingerprints on the basis of FPRD. The results of this study demonstrate that the RF model of machine learning can classify sex based on fingerprint ridge density with an accuracy of 81.53%. Moreover, with regard to sex classification, variations in fingerprint ridge density through the RF model of AI have not been presented earlier. The present research evaluates the variability of fingerprint ridge density in the radial, ulnar, and proximal areas of fingerprints with the help of an ML model, i.e., RF. There is direct application of RF, which can be utilized in crime scene investigation and forensic examinations, especially when there is no clue criminal or sex of the criminal can be predicted from fingerprints recovered from the crime scene using the present customized model.
Acknowledgements
The article is the part of PhD research topic of RV and emerged out of the objective of the PhD research topic. The authors sincerely thank the participants for providing the data so that the research can be performed. Results from the research can potentially increase the scope of artificial intelligence for utilization in solving crime scene using fingerprint ridge density.
Author Contributions
R.V.: Conceptualization, searching the literature, writing original draft, data collection, data analysis using random forest model in python, review and editing, final approval. M.L.: Data analysis, review and editing, using random forest model in python, final approval. R.S.: Data analysis, review and editing, using random forest model in python, final approval.
Ethics Statement
Ethical clearance was taken for collecting the data from the Panjab University Institutional Ethics Committee (PUIEC) vide letter no EC-D-2405-283 on 14 May 2024.
Informed Consent Statement
Informed consent form was taken from the participants and all the participants were informed prior that the confidentiality of the data will be maintained.
Data Availability Statement
The data that support the findings of this study are available from the corresponding author upon reasonable request.
Funding
This research received no external funding.
Declaration of Competing Interest
The authors declare that they have no known competing financial interests or personal relationships that could have appeared to influence the work reported in this paper.
References
-
Shekhar M, Patgiri R, Trivedi AK, Dhar P. A Critical Study of Biometrics and Their Fusion. In Proceedings of the 2023 International Conference on Intelligent Systems Advanced Computing and Communication (ISACC), Silchar, India, 3–4 February 2023; pp. 1–7. doi:10.1109/ISACC56298.2023.10083801. [Google Scholar]
-
Neumann C, Champod C, Solis RP, Egli N, Anthonioz A, Griffiths AB. Computation of likelihood ratios in fingerprint identification for configurations of any number of minutiæ. J. Forensic Sci. 2006, 521, 54–64. doi:10.1111/j.1556-4029.2006.00327.x. [Google Scholar]
-
Garg R, Singh RG, Singh A, Singh MP. Fingerprint Recognition using Convolution Neural Network with Inversion and Augmented Techniques. Syst. Soft Comput. 2024, 6, 200106. doi:10.1016/j.sasc.2024.200106. [Google Scholar]
-
Gungadin S. Sex Determination from Fingerprint Ridge Density. Internet J. Med. Update 2007, 2, 4–7. [Google Scholar]
-
Redomero EG, Quirós JA, Rivaldería N, Alonso MC. Topological variability of fingerprint ridge density in a Sub-Saharan population sample for application in personal identification. J. Forensic Sci. 2013, 583, 592–600. doi:101111/1556-402912092. [Google Scholar]
-
Redomero EG, Alonso C, Romero E, Galera V. Variability of fingerprint ridge density in a sample of Spanish Caucasians and its application to sex determination. Forensic Sci. Int. 2008, 1801, 17–22. doi:10.1016/j.forsciint.2008.06.014. [Google Scholar]
-
Acree MA. Is there a gender difference in fingerprint ridge density? Forensic Sci. Int. 1999, 1021, 35–44. doi:10.1016/S0379-0738(99)00037-7. [Google Scholar]
-
Krishan K, Kanchan T, Ngangom C. A study of sex differences in fingerprint ridge density in a North Indian young adult population. J. Forensic Leg. Med. 2013, 204, 217–222. doi:10.1016/j.jflm.2012.09.008. [Google Scholar]
-
Nayak VC, Rastogi P, Kanchan T, Yoganarasimha K, Kumar GP, Menezes RG. Sex differences from fingerprint ridge density in Chinese and Malaysian population. Forensic Sci. Int. 2010, 197, 67–69. doi:10.1016/j.forsciint.2009.12.055. [Google Scholar]
-
Nithin MD, Manjunatha B, Preethi DS, Balaraj B. Gender differentiation by finger ridge count among South Indian population. J. Forensic Leg. Med. 2011, 182, 79–81. doi:10.1016/j.jflm.2011.01.006. [Google Scholar]
-
Eshak GA, Zaher JF, Hasan EI, Ewis AAEA. Sex identification from fingertip features in Egyptian population. J. Forensic Leg. Med. 2012, 201, 46–50. doi:10.1016/j.jflm.2012.04.038. [Google Scholar]
-
Kanchan T, Krishan K, Aparna K, Shyamsunder S. Footprint ridge density: A new attribute for sexual dimorphism. HOMO 2012, 636, 468–480. doi:10.1016/j.jchb.2012.09.004. [Google Scholar]
-
Ali FI, Ahmed AA. Sexual and topological variability in palmprint ridge density in a sample of Sudanese population. Forensic Sci. Int. Rep. 2020, 2, 100151. doi:10.1016/j.fsir.2020.100151. [Google Scholar]
-
Verma M, Agarwal S. Fingerprint Based Male-Female Classification. In Proceedings of the International Workshop on Computational Intelligence in Security for Information Systems CISIS’08; Corchado E, Zunino R, Gastaldo P, Herrero Á, Eds.; Advances in Soft Computing; Springer: Berlin/Heidelberg, Germany, 2009; Volume 53. doi:10.1007/978-3-540-88181-0_32. [Google Scholar]
-
Wang JF, Lin CL, Chang YH, Nagurka M, Yen CW, Yeh C. Gender Determination using Fingertip Features. Internet J. Med. Update 2008, 3, 22–28. doi:10.4314/ijmu.v3i2.39838. [Google Scholar]
-
Narayanan A, Sajith K. Gender Detection and Classification from Fingerprints Using Pixel Count. In Proceedings of the 3rd International Conference on Systems, Energy and Environment (ICSEE), Kannur, India, 12–13 July 2019; pp. 1–5. doi:10.2139/ssrn.3444032. [Google Scholar]
-
Athiraja A, Arunkumar G, Nandhakumar R. Automatic Latent Fingerprint Segmentation based on Orientation and Frequency Features. Int. J. Electr. Eng. Technol. 2019, 10, 77–87. [Google Scholar]
-
Tiwari M, Mishra A. Different classifier approaches used for fingerprint classification. Ann. Comput. Sci. Inf. Syst. 2022, 33, 249–253. doi:10.15439/2022R13. [Google Scholar]
-
Berriche L. Comparative Study of Fingerprint-Based Gender Identification. Secur. Commun. Netw. 2022, 1626953. doi:10.1155/2022/1626953. [Google Scholar]
-
Cummins HH, Midlo C. Fingerprints Palms and Soles: An Introduction to Dermatoglyphics; Dover Publication: New York, NY, USA, 1961. [Google Scholar]
-
Çorbacıoğlu ŞK, Aksel G. Receiver operating characteristic curve analysis in diagnostic accuracy studies: A guide to interpreting the area under the curve value. Turk. J. Emerg. Med. 2023, 234, 195–198. doi:10.4103/tjem.tjem_182_23. [Google Scholar]
-
Pisharody AS, Pargaonkar S, Kulkarni VY. Fingerprint classification and building a gender prediction model using random forest algorithm. Int. J. Knowl. Eng. Data Min. 2015, 3, 286. doi:10.1504/IJKEDM.2015.074080. [Google Scholar]
-
Jasem FM, Ahmed IT, Hammad BT. A comprehensive method for fingerprint classification based on GABOR filters and machine learning. Int. J. Saf. Secur. Eng. 2024, 14, 1775–1782. doi: 10.18280/ijsse.140612. [Google Scholar]
-
Sharma S, Krishan K, Rani D, Mukhra M. Is fingerprint ridge density influenced by hand dimensions? Acta Biomed 2022, 93, e2022315. doi:10.23750/abm.v93i6.13548. [Google Scholar]