Ambient Air Pollution Exposure Influences Dementia through the Bidirectional Pathways of Psychological Factors and Brain Structure

Ambient Air Pollution Exposure Influences Dementia through the Bidirectional Pathways of Psychological Factors and Brain Structure
Fei Tian 1,† Dashan Zheng 1,† Jinde Zhao 1 Zihan Lin 1 Lan Chen 1 Zhengmin Qian 2 Shengtao Wei 1 Tom Burroughs 3 Hualiang Lin 1,*
Received: 23 October 2025 Revised: 10 November 2025 Accepted: 18 November 2025 Published: 25 November 2025

© 2025 The authors. This is an open access article under the Creative Commons Attribution 4.0 International License (https://creativecommons.org/licenses/by/4.0/).
1. Introduction
Ambient air pollution exposure has long been identified as a significant environmental risk factor for various health problems, including cardiovascular and respiratory diseases [1,2]. Recent studies have begun to uncover its more subtle and alarming effects on brain health, particularly in relation to cognitive decline and dementia [3,4,5,6,7,8]. The 2020 report from the Lancet Commission further emphasized air pollution as one of the important modifiable risk factors for dementia [9]. While the association between air pollution and dementia has been well-documented, the underlying mechanisms remain poorly understood.
Dementia develops as a long-term neurodegenerative process, with air pollution potentially serving as a trigger that sets off a cascade of intracerebral adverse events, including psychological distress and structural changes in the brain [10,11,12]. A meta-analysis pooling data from nine studies demonstrated statistically significant positive associations between PM2.5 exposure and an increased risk of anxiety and depression [10]. Prior evidence further suggested that psychological factors or disorders were important predictors of dementia, and reliable psychological intervention was associated with reduced incidence of future dementia [13,14]. It is thus plausible to hypothesize that air pollution was associated with a higher risk of psychiatric disorders, such as anxiety, depression, and stress, that might further contribute to the detrimental effects on cognitive function. However, limited studies explored the mediating effects of psychological factors in the relationship between air pollution and dementia risk.
Similarly, exposure to air pollution has been shown to affect brain regions associated with memory, decision-making, and emotional regulation, including the hippocampus and prefrontal cortex [15]. These structural and functional changes may further contribute to the development of dementia [16,17,18]. However, the precise sequence of these events—whether psychological factors precede brain structural changes, or vice versa—remains unclear. In addition, previous studies have focused on the direct effects of air pollution on cognitive decline, with limited attention to the potential mediating or moderating roles of psychological and brain structural factors. Understanding the temporal and mechanistic relationships between these factors is crucial for developing targeted interventions to mitigate the impact of air pollution on brain health.
In the present study, leveraging comprehensive data from the UK Biobank cohort study encompassing over 500,000 participants, we aim to elucidate the prospective associations between air pollution, psychological disorders, brain structure, and dementia risk. We further investigate the potential mediating roles of psychological disorders and brain structure in the relationship between air pollution and dementia. Additionally, we employ structural equation modeling to explore the underlying mechanisms linking ambient air pollution to dementia, with a focus on the pathways involving psychological disorders and brain structures. Finally, we use Mendelian randomization analysis to establish the directional and causal relationships among psychological disorders, brain structure, and dementia.
2. Methods
2.1. Study Design and Participants
This analysis utilized data from the UK Biobank, a large population-based cohort study that recruited more than 500,000 participants aged 37–73 years from 22 assessment centers across the UK between 2006 and 2010. Detailed study protocols have been published elsewhere [19]. At baseline, participants completed demographic, behavioral, and psychological assessments, along with a self-reported touchscreen questionnaire. Approximately one in ten participants also provided neuroimaging data after 2014. The UK Biobank was supported by the National Health Service North West Centre for Research Ethics Committee (ref. 11/NW/0382), and informed consent was obtained from all participants via electronic signature.
2.2. Air Pollution Assessment
We selected four air pollutants including particulate matter with aerodynamic diameter <2.5 μm (PM2.5), <10 μm (PM10), nitrogen oxides (NOx), and nitrogen dioxide (NO2) based on the air pollution criteria set by the World Health Organization and the European Commission, as well as the data availability within the UK Biobank (category ID: 114). The annual average concentrations of these pollutants were estimated using a standardized land use regression (LUR) model developed by the European Study of Cohorts for Air Pollution Effects (ESCAPE) project [20,21]. This model computed the annual average pollutant levels for each participant by matching their residential address at the baseline visit with various spatial predictor variables from Geographic Information System (GIS) data, including land use, traffic, population density, and topography. The model performed at a spatial resolution of 100 × 100 m. The land use regression models demonstrated strong performance, with cross-validation 𝑅2 of 77%, 88%, 87%, and 88% for PM2.5, PM10, NO2, and NOx, respectively. Within the UK Biobank, data for PM2.5 and NOx were available for the year 2010, while NO2 and PM10 data were available for multiple years (2005–2007 and 2010 for NO2, and 2007 and 2010 for PM10). For these pollutants, we computed the mean exposure concentrations, representing the average levels over the available years.
2.3. Psychological Factors and Psychiatric Disorders Measurement
At recruitment, participants completed a touchscreen questionnaire assessing psychological factors, mental health, and social support. This included 48 psychological variables related to affective and anxiety disorder symptoms, as well as personality traits (Category ID: 100059). Out of the initial questionnaire items, we excluded 21 items due to more than 50% missing data among the 502,411 UK Biobank participants. In addition, two additional items were removed based on extreme skewness in their distribution. As a result, 24 psychological factors with complete data from 263,095 participants were retained for the analysis (Supplementary Figure S1). Baseline characteristics of included and excluded participants are summarized in Supplementary Table S1. Both groups demonstrated similar distributions across key variables. A comprehensive list of these factors is provided in Supplementary Table S2. Each item was defined as 0 or 1. We calculated the total score by summing the psychological factors, divided into three groups, and computed the group scores, including the affective symptom group, anxiety symptom group, and emotional-instability symptom group [11]. To identify incident psychiatric disorders, we utilized hospital inpatient records and extracted relevant ICD-9 and ICD-10 codes for psychiatric conditions, as detailed in Supplementary Table S3. To maintain temporal precedence in our analysis, we exclusively included cases where psychiatric disorders were diagnosed prior to the onset of dementia.
2.4. Brain Imaging Data
In the current analysis, quality-controlled T1-weighted brain imaging data were obtained through a standard Siemens Skyra 3T scanner with a 32-channel receiver head coil at the assessment center since 2014. The detailed neuroimaging acquisition has been provided elsewhere [22]. In this study, imaging data from the UK Biobank were processed using FreeSurfer and analyzed as image-derived phenotypes (IDPs). Regional grey matter volumes (FAST; category ID: 1101) were specifically examined. FAST-based grey matter segmentation was employed to calculate 139 regional IDPs, which included 111 cortical and subcortical grey matter volumes (GMV) as well as 28 cerebellar GMVs, based on partial volume estimates within 139 predefined regions of interest (ROIs). All the brain imaging data were standardized using Z-transformation before analysis. The detailed brain structure information on IDPs used in the current study is presented in Supplementary Table S4. A total of 26,383 participants with the neuroimaging data were used in this analysis (Supplementary Figure S1).
2.5. Ascertainment of Dementia
The UKB identified incident and prevalent cases of all-cause dementia (ACD), Alzheimer’s dementia (AD), and vascular dementia (VaD) through linkage with hospital inpatient records from Health Episode Statistics (England and Wales) and Scottish Morbidity Records (Scotland). Additional cases were identified through death registry linkages. Prevalent cases included participants who self-reported a dementia diagnosis at baseline, while incident cases were determined using UKB-developed algorithms (Category ID: 47) that integrated multiple data sources. This approach demonstrated positive predictive values of 82.5% for ACD, 71.4% for AD, and 43.8% for VaD. Dementia diagnoses were coded using the International Classification of Diseases (ICD) system, with specific ICD-9 and ICD-10 codes listed in Supplementary Table S5.
2.6. Covariates
Baseline data on sociodemographic factors, lifestyle factors, and medical information were considered as the covariates, including age at baseline, sex, ethnicity, educational attainment, Townsend deprivation index (TDI), body mass index (BMI), smoking status, alcohol consumption, and physical activity, prevalence of diabetes and hypertension, and apolipoprotein E (APOE) ε4 carrier status. Educational attainment was classified into two groups: those with a college/university degree (or other professional qualifications) and those with lower education levels. BMI, derived from measured height and weight, was categorized into four groups: underweight, normal weight, overweight, and obese. Smoking status was classified as never, former, or current smoker. Alcohol consumption was stratified into four levels (none, occasional, moderate, or heavy) based on self-reported frequency and quantity. Physical activity was assessed using the International Physical Activity Questionnaire (IPAQ) and included walking, moderate-intensity, and vigorous-intensity activities. Total physical activity was quantified in metabolic equivalent minutes per week (MET-min/week) and categorized as low (<600), moderate (600–3000), or high (≥3000). Prevalent hypertension and diabetes were determined through a combination of self-reported medical history and hospital inpatient records.
2.7. Statistical Analysis
Descriptive analysis. The baseline characteristics of the participants stratified by incident dementia status were described using mean and SD for continuous variables and frequency and percentage for categorical variables.
Cox proportional hazard regression model. Cox proportional hazard regression models were initially used to detect the association between exposure of interest, including air pollution, psychological factors, and groups, and brain structure with the incident risk of dementia. The longitudinal association of air pollution and brain structure with incident psychiatric disorders was also investigated. The proportional hazard assumptions were satisfied based on the tests of Schoenfeld residuals (Supplementary Figure S2). In the multivariable-adjusted model, we accounted for potential confounders, including age, sex, ethnicity, education level, BMI, TDI, smoking status, alcohol consumption, physical activity, diabetes, hypertension, and APOE ɛ4 carrier status. Hazard ratios (HRs) with 95% confidence intervals (CIs) were reported for each interquartile range (IQR) increase in air pollution and standardized brain structure indices, as well as for one-unit increases in total psychological scores and group scores. Statistical significance was adjusted for multiple comparisons using the false discovery rate (FDR) method. We also examined the dose-response relationship by introducing a natural cubic spline into models. To evaluate the potential modifying effects, we performed the stratified analysis by the important covariates (sex, age, and APOE ɛ4 carrier status), and the multiplicative interaction terms for each of the 10 covariates were introduced into the Cox proportional hazard models. Additionally, we calculated the population attributable fraction of air pollution and psychological factors with dementia.
Logistics and linear regression model. Multiple logistics and linear regression models were applied to calculate the coefficients and 95% CI for the association between air pollution and the measures of interest, including individual psychological factors and brain morphometric measures, with the same covariate adjustments as in the Cox models. In addition, the association between psychological factors and brain morphometric measures was also detected. Exposure-response curves were plotted using natural cubic spline regression models for the associations between air pollution and both total and group psychological scores. All p values were adjusted for multiple comparisons using the FDR method.
Mediation analysis. We also constructed mediation models to investigate the potential role of psychological factors or brain structure underlying the association between air pollution and dementia risk. In the models, we adjusted for age, sex, ethnicity, education level, BMI, TDI, smoking status, alcohol consumption, physical activity, diabetes, hypertension, and APOE ɛ4 carrier status. The total psychological score and the mean values of brain gray matter volumes significantly associated with air pollution that survived FDR correction were considered as mediators in the model. In addition, we also explored the mediating role of each psychological factor and brain structure underlying these associations, and FDR corrections were further performed for multiple comparisons. Total, direct, and indirect effects were estimated using a 1000-iteration nonparametric bootstrap approach.
Structural equation model. We fitted a structural equation model to determine the directional dependencies among air pollution exposure, psychological scores, brain structural imaging, and dementia (performed in the lavaan package of R software 4.4.1). Confirmatory factor analysis (CFA) was conducted to estimate three latent variables. The latent variable of air pollution was established through PM2.5, PM10, NO2, and NOx. The latent variable of psychological health was derived from the first ten psychological items most strongly associated with air pollution. Similarly, the latent variable for brain structure was calculated using the first twenty grey matter volumes from cortical, subcortical, and cerebellar regions that were significantly related to ambient air pollution. These three latent variables were then examined to explore their directional relationships with air pollution and dementia using path modeling. Prior to model input, we standardized air pollution levels, dementia onset status, and each sub-score of the latent variables to ensure they were on the same scale. FDR corrections were applied to adjust p values for multiple comparisons across all paths in the model. In the analysis, we examined the different sequential orders of psychological scores/psychiatric disorders and brain structure in the SEMs.
Mendelian randomization (MR) analysis. A two-sample MR analysis was performed to identify the potential causal association among psychiatric disorders, brain structure (as measured by imaging-derived phenotypes or IDPs), and dementia. Genome-wide association study (GWAS) summary statistics for psychiatric disorders were obtained from the Psychiatric Genomics Consortium (PGC) and included major depressive disorder, anxiety disorders, bipolar disorder, schizophrenia, and anorexia nervosa. For brain IDPs, we used GWAS summary data from a study by Smith et al., which involved 3913 brain IDPs measured in 33,224 participants of European descent from the 2020 UK Biobank release [23]. Based on prior evidence linking specific IDPs with psychiatric disorders and dementia, we selected five IDPs for further analysis. Genetic variants serving as instrumental variables for ACD were sourced from three open GWAS projects, which collectively included 216,771 to 218,792 participants. Bidirectional MR was performed to estimate the following causal effects: (a) psychiatric disorders → IDPs, (b) psychiatric disorders → dementia, (c) IDPs → dementia, and (d) IDPs → psychiatric disorders. To ensure the independence of genetic variants, stringent linkage disequilibrium (LD) clumping thresholds were applied (clumping window size = 10,000 kb, r2 threshold = 0.1). The primary causal inference was based on the inverse variance-weighted (IVW) approach. In addition, we performed several sensitivity analyses using the weighted median, MR-Egger regression, and both simple and weighted mode-based estimators to assess the robustness of our findings.
3. Results
Baseline characteristics. A total of 263,095 participants were retrieved from the UK Biobank, with a mean age of 55.80 years and 50.49% female. During the over 12-year follow-up, a total of 3039 all-cause dementia cases were identified. The follow-up time was computed from the date of initial recruitment to the date of any dementia, death, or the end of follow-up date (30 October 2022 for England, 31 August 2022 for Scotland, and 31 May 2022 for Wales), whichever occurred first. The baseline characteristics of included participants are presented in Table 1. Individuals with dementia were more likely to be older, male, with higher TDI and BMI, with hypertension and diabetes, have less education, and be APOE ɛ4 carriers. In addition, it was observed that the ambient air pollution concentrations and psychological scores were higher in the incident dementia groups. Figure 1 provides a comprehensive overview of the analytical framework and methodological steps employed in the current study.
Table 1. The baseline characteristics of the participants were stratified by the incident status of dementia.
|
Characteristics |
No Incident of Dementia |
Incident Dementia |
|---|---|---|
|
No. of participants |
260,056 |
3039 |
|
Age, years (Mean (SD)) |
55.70 (8.03) |
63.92 (4.90) |
|
Sex, Female, n (%) |
131,608 (50.61) |
1224 (40.28) |
|
Ethnicity, White, n (%) |
249,320 (95.87) |
2956 (97.27) |
|
BMI level, n (%) |
||
|
Underweight |
1199 (0.46) |
20 (0.66) |
|
Normal |
84,309 (32.55) |
857 (28.42) |
|
Overweight |
111,547 (43.07) |
1297 (43.02) |
|
Obese |
61,929 (23.91) |
841 (27.89) |
|
Higher TDI, n (%) |
46,823 (18.03) |
723 (23.84) |
|
Higher education, n (%) |
134,065 (51.67) |
1152 (38.21) |
|
Intake of alcohol, n (%) |
||
|
Never |
17,399 (6.69) |
376 (12.39) |
|
Occasional |
54,636 (21.01) |
692 (22.80) |
|
Moderate |
130,690 (50.26) |
1253 (41.29) |
|
Heavy |
57,277 (22.03) |
714 (23.53) |
|
Smoking status, n (%) |
||
|
Never |
142,950 (54.97) |
1382 (45.48) |
|
Previous |
90,641 (34.85) |
1347 (44.32) |
|
Current |
26,465 (10.18) |
310 (10.20) |
|
Physical activity, n (%) |
||
|
Low |
42,381 (18.57) |
525 (20.38) |
|
Moderate |
92,790 (40.67) |
1060 (41.15) |
|
High |
93,003 (40.76) |
991 (38.47) |
|
APOE ε4 carrier, n (%) |
71,466 (28.06) |
1515 (50.92) |
|
Hypertension, n (%) |
109,304 (42.03) |
1953 (64.26) |
|
Diabetes, n (%) |
13,982 (5.71) |
481 (16.77) |
|
PM2.5, μg/m3 (Mean (SD)) |
9.96 (1.05) |
10.02 (1.05) |
|
PM10, μg/m3 (Mean (SD)) |
19.27 (1.94) |
19.31 (1.89) |
|
NO2, μg/m3 (Mean (SD)) |
28.97 (9.20) |
29.39 (9.02) |
|
NOx, μg/m3 (Mean (SD)) |
43.58 (15.46) |
44.24 (15.98) |
|
Psychological score (Mean (SD)) |
8.10 (5.21) |
8.20 (5.39) |
|
Affective symptom score (Mean (SD)) |
1.49 (1.55) |
1.58 (1.61) |
|
Anxiety symptom score (Mean (SD)) |
1.76 (1.63) |
1.81 (1.70) |
|
Emotional instability symptom score (Mean (SD)) |
3.20 (2.37) |
3.12 (2.39) |
BMI, body mass index; TDI, Townsend deprivation index; APOE, apolipoprotein E; PM2.5, fine particulate matter with diameter < 2.5 µm; PM10, particulate matter with diameter < 10 µm; NO2, nitrogen dioxide; NOx, nitrogen oxides; SD, standard.
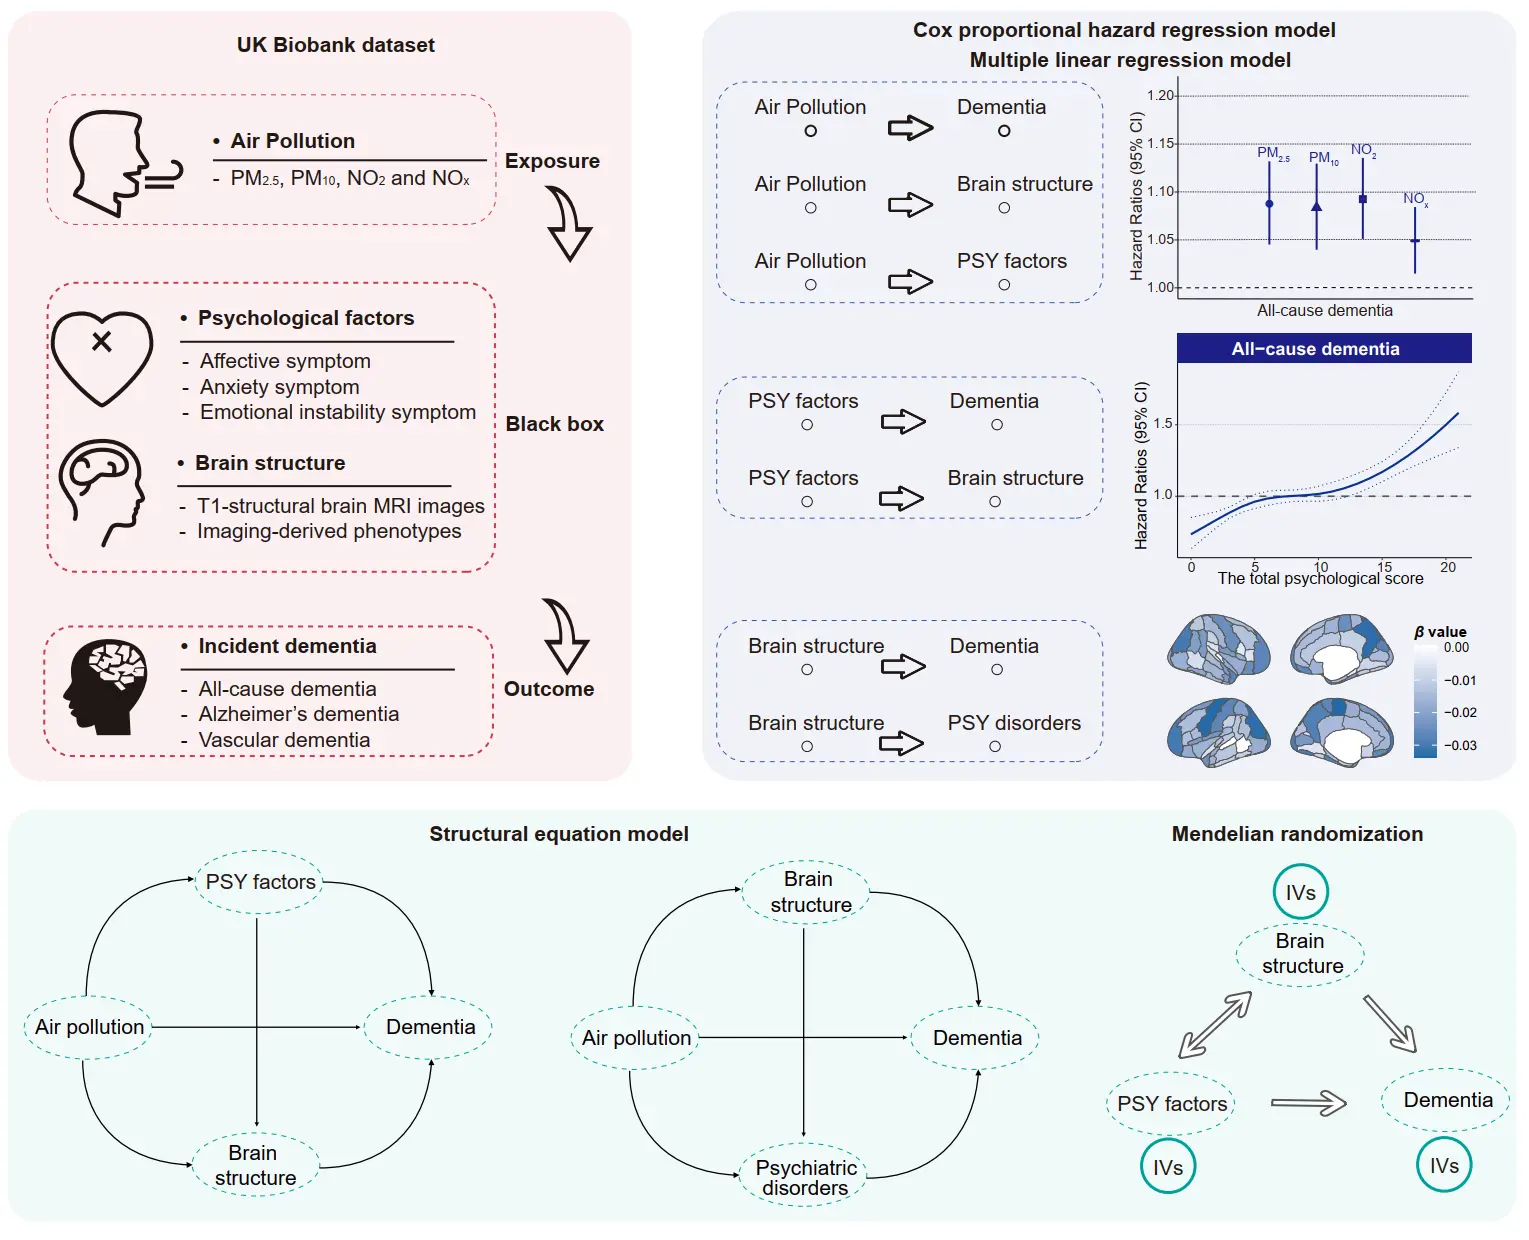
Figure 1. Analytical framework of the current study. (Top left) Overview of the UK Biobank data utilized, encompassing air pollution exposure, psychological factors, brain imaging phenotypes, and incident dementia. (Top right) Leveraging the UK Biobank data, this study investigated the associations between air pollution and brain health, including psychiatric disorders, brain structure, and dementia risk among middle-aged and older participants. Longitudinal associations were further examined among psychological factors, brain volumes, and incident dementia. (Bottom) Structural equation models were employed to explore the mediating roles and potential pathways of psychological factors and brain structure in the associations between air pollution and dementia. Additionally, Mendelian randomization analysis was conducted to assess bidirectional causal relationships. PM2.5, fine particulate matter with diameter < 2.5 µm; PM10, particulate matter with diameter < 10 µm; NO2, nitrogen dioxide; NOx, nitrogen oxides.
Longitudinal association of air pollution with risk of dementia. We initially observed a significant association between air pollution exposure and risk of dementia through Cox proportional hazard regression models. Figure 2A,B presented the HRs and 95% CI, and the dose-response relationship of air pollution with dementia. Four studied air pollutants were associated with a higher risk of ACD and subtypes. After adjustment for covariates, a per IQR increase of PM2.5, PM10, NO2, and NOx concentrations were associated with HRs of 1.09 (95% CI: 1.05, 1.13), 1.08 (95% CI: 1.04, 1.13), 1.09 (95% CI: 1.04, 1.14) and 1.05 (95% CI: 1.02, 1.08) for ACD. Air pollution demonstrated an approximately linear association with the risk of dementia, without any discernible thresholds, and a flat slope was observed at higher concentrations. The same associations were also observed for the subtypes of dementia (Supplementary Figure S3 and Figure S4). Among the modifiers, we only found the significant interaction between PM2.5 and APOE carrier status (p = 0.02) on dementia incidence (Figure 2C). In further subgroup analysis (Supplementary Table S6, Table S7 and Table S8), the associations between PM2.5 and dementia tended to be higher in APOE non-carriers (HR = 1.12) than APOE carriers (HR = 1.06). Compared with males, Females demonstrated a stronger association of PM10 and NO2 exposure with AD risk. We also estimated that a total of 3.29% dementia cases can be attributed to PM2.5 exposure, and the PAF of dementia attributed to air pollution ranged from 0.74% (PM10 for AD) to 8.71% (NO2 for VD) (Figure 2D).
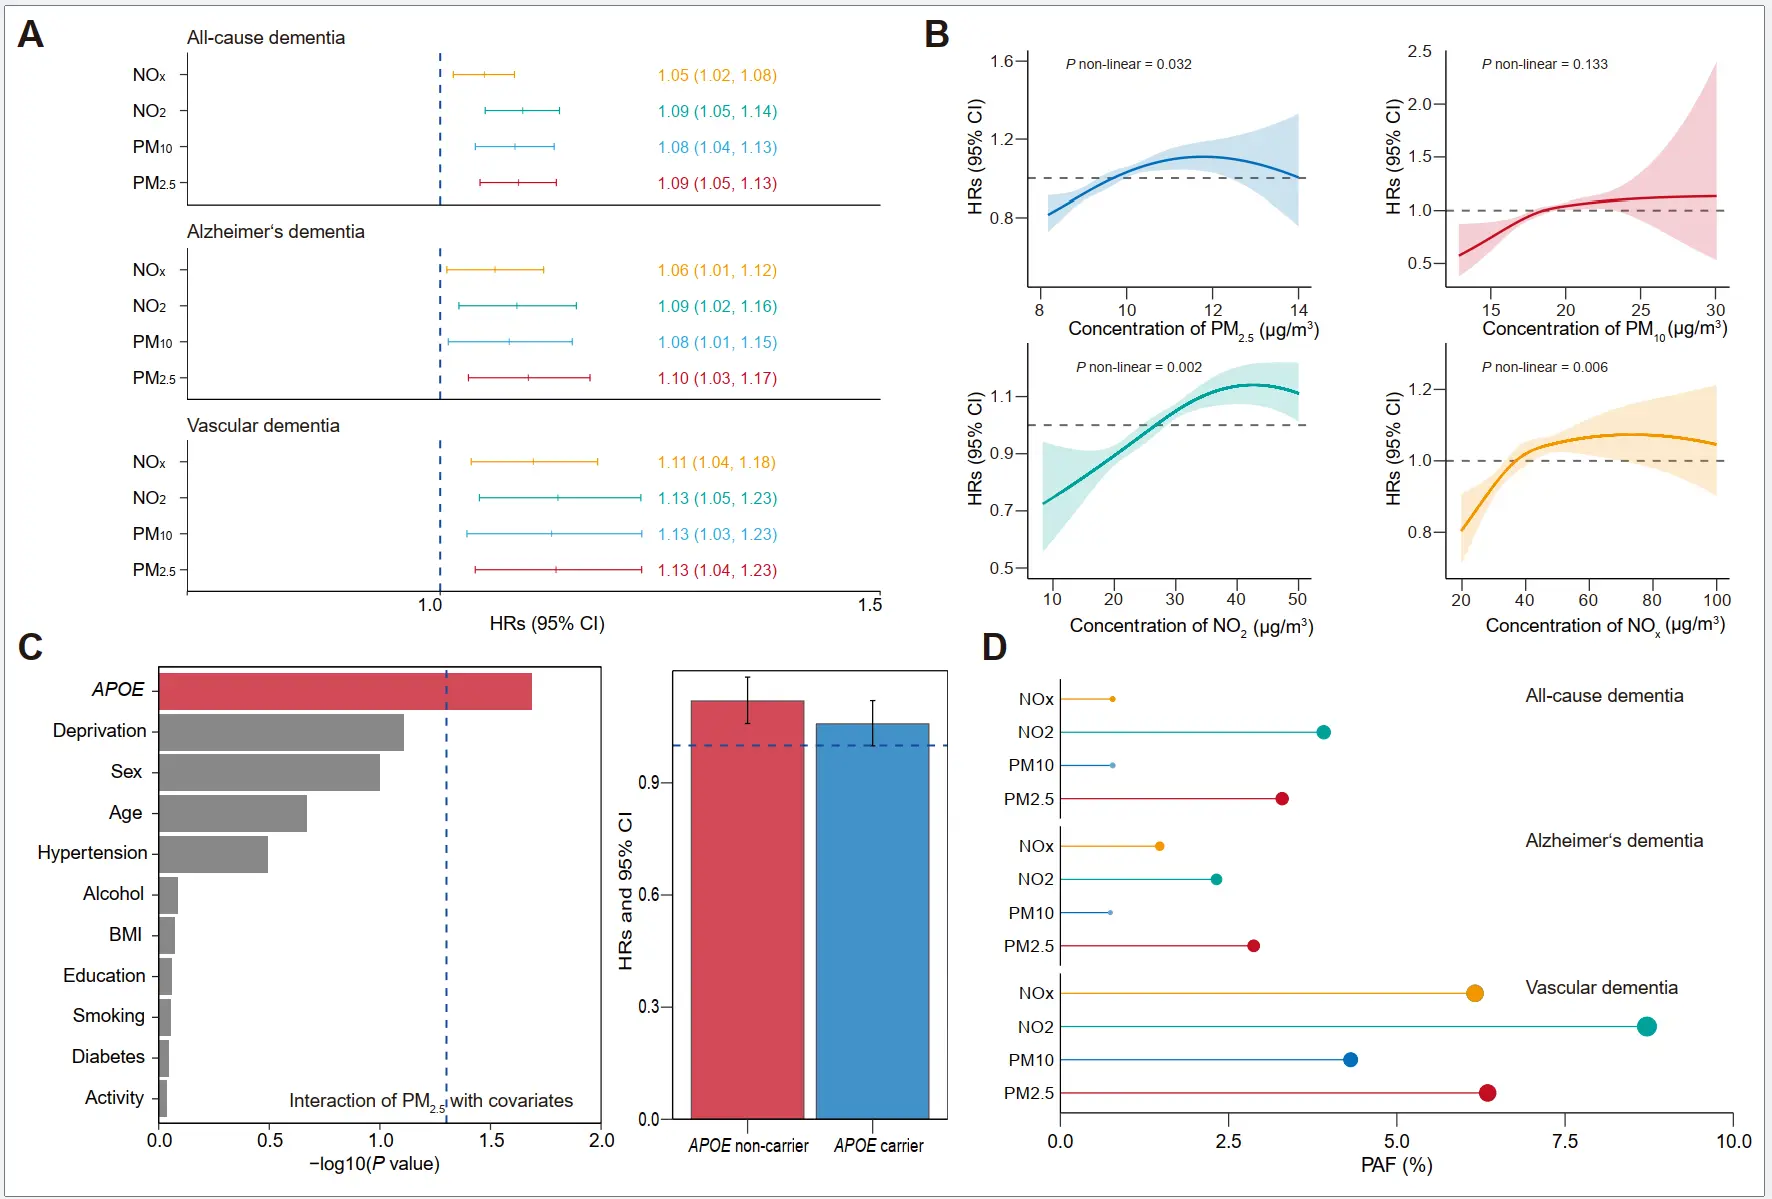
Figure 2. Longitudinal associations between air pollution exposure and dementia risk. (A) Hazard ratios (HRs) with 95% confidence intervals (CIs) of dementia associated with each interquartile range (IQR) increase in air pollution levels (μg/m3). (B) Exposure-response relationships between air pollution and dementia risk. (C) Effect modification analysis revealed a significant interaction between PM2.5 exposure and APOE carrier status (p = 0.02) on dementia incidence. Subgroup analysis demonstrated stronger associations between PM2.5 and dementia in APOE non-carriers (HR = 1.12, red) compared to APOE carriers (HR = 1.06, blue). (D) Population attributable fractions (PAFs) for dementia incidence associated with high air pollution exposure. PM2.5, fine particulate matter with diameter < 2.5 µm; PM10, particulate matter with diameter < 10 µm; NO2, nitrogen dioxide; NOx, nitrogen oxides. APOE, apolipoprotein E. BMI, body mass index.
Associations of air pollution with psychological factors and brain structure. We tested the correlation among the psychological factors (Figure 3A). High correlation coefficients were observed for mood swings with neuroticism score (r = 0.62) and fed-up feelings (r = 0.53). In terms of psychological factors, most of factors displayed the significant association with air pollution exposure (Figure 3B). Specifically, each IQR increase PM2.5 exposure was associated with higher risk of loneliness and isolation (Odd Ratio [OR]= 1.06, 95% CI: 1.05, 1.08), followed by nervous feelings (OR = 1.06, 95% CI: 1.04, 1.07), and seen a psychiatrist (OR = 1.05, 95% CI: 1.03, 1.07). In addition, we found that depressed mood, seeing a psychiatrist, tense /highly strung, nervous feelings, and being able to confide could be affected by all four air pollutants. Air pollution exposure was also associated with the total psychological score and related symptoms, and PM2.5 showed the stronger effects, and each IQR increase was associated with the coefficients of 0.09 (95% CI: 0.07, 0.12) for total score (p = 2.09 × 10⁻¹¹) (Figure 3C). We also observed the significant associations between air pollution and psychiatric disorders (Figure 3D). The exposure-response relationships between air pollution exposure and psychological factors were also examined, with the coefficients increasing as pollutant concentrations rose (Figure 3E and Supplementary Figure S5, Figure S6 and Figure S7). As Figure 3F presents, air pollution was associated with lower volumes of brain structures. A total of 39, 5, 5, 18 out of 139 brain regions were identified to be significantly associated with PM2.5, PM10, NO2, and NOx (FDR-adjusted p value < 0.05). We observed that the volumes of GM in the precentral gyrus (left), precuneus cortex (right), and lateral occipital cortex, superior division (left) were affected most by air pollution, with standardized coefficients ranging from −0.03 to −0.02.
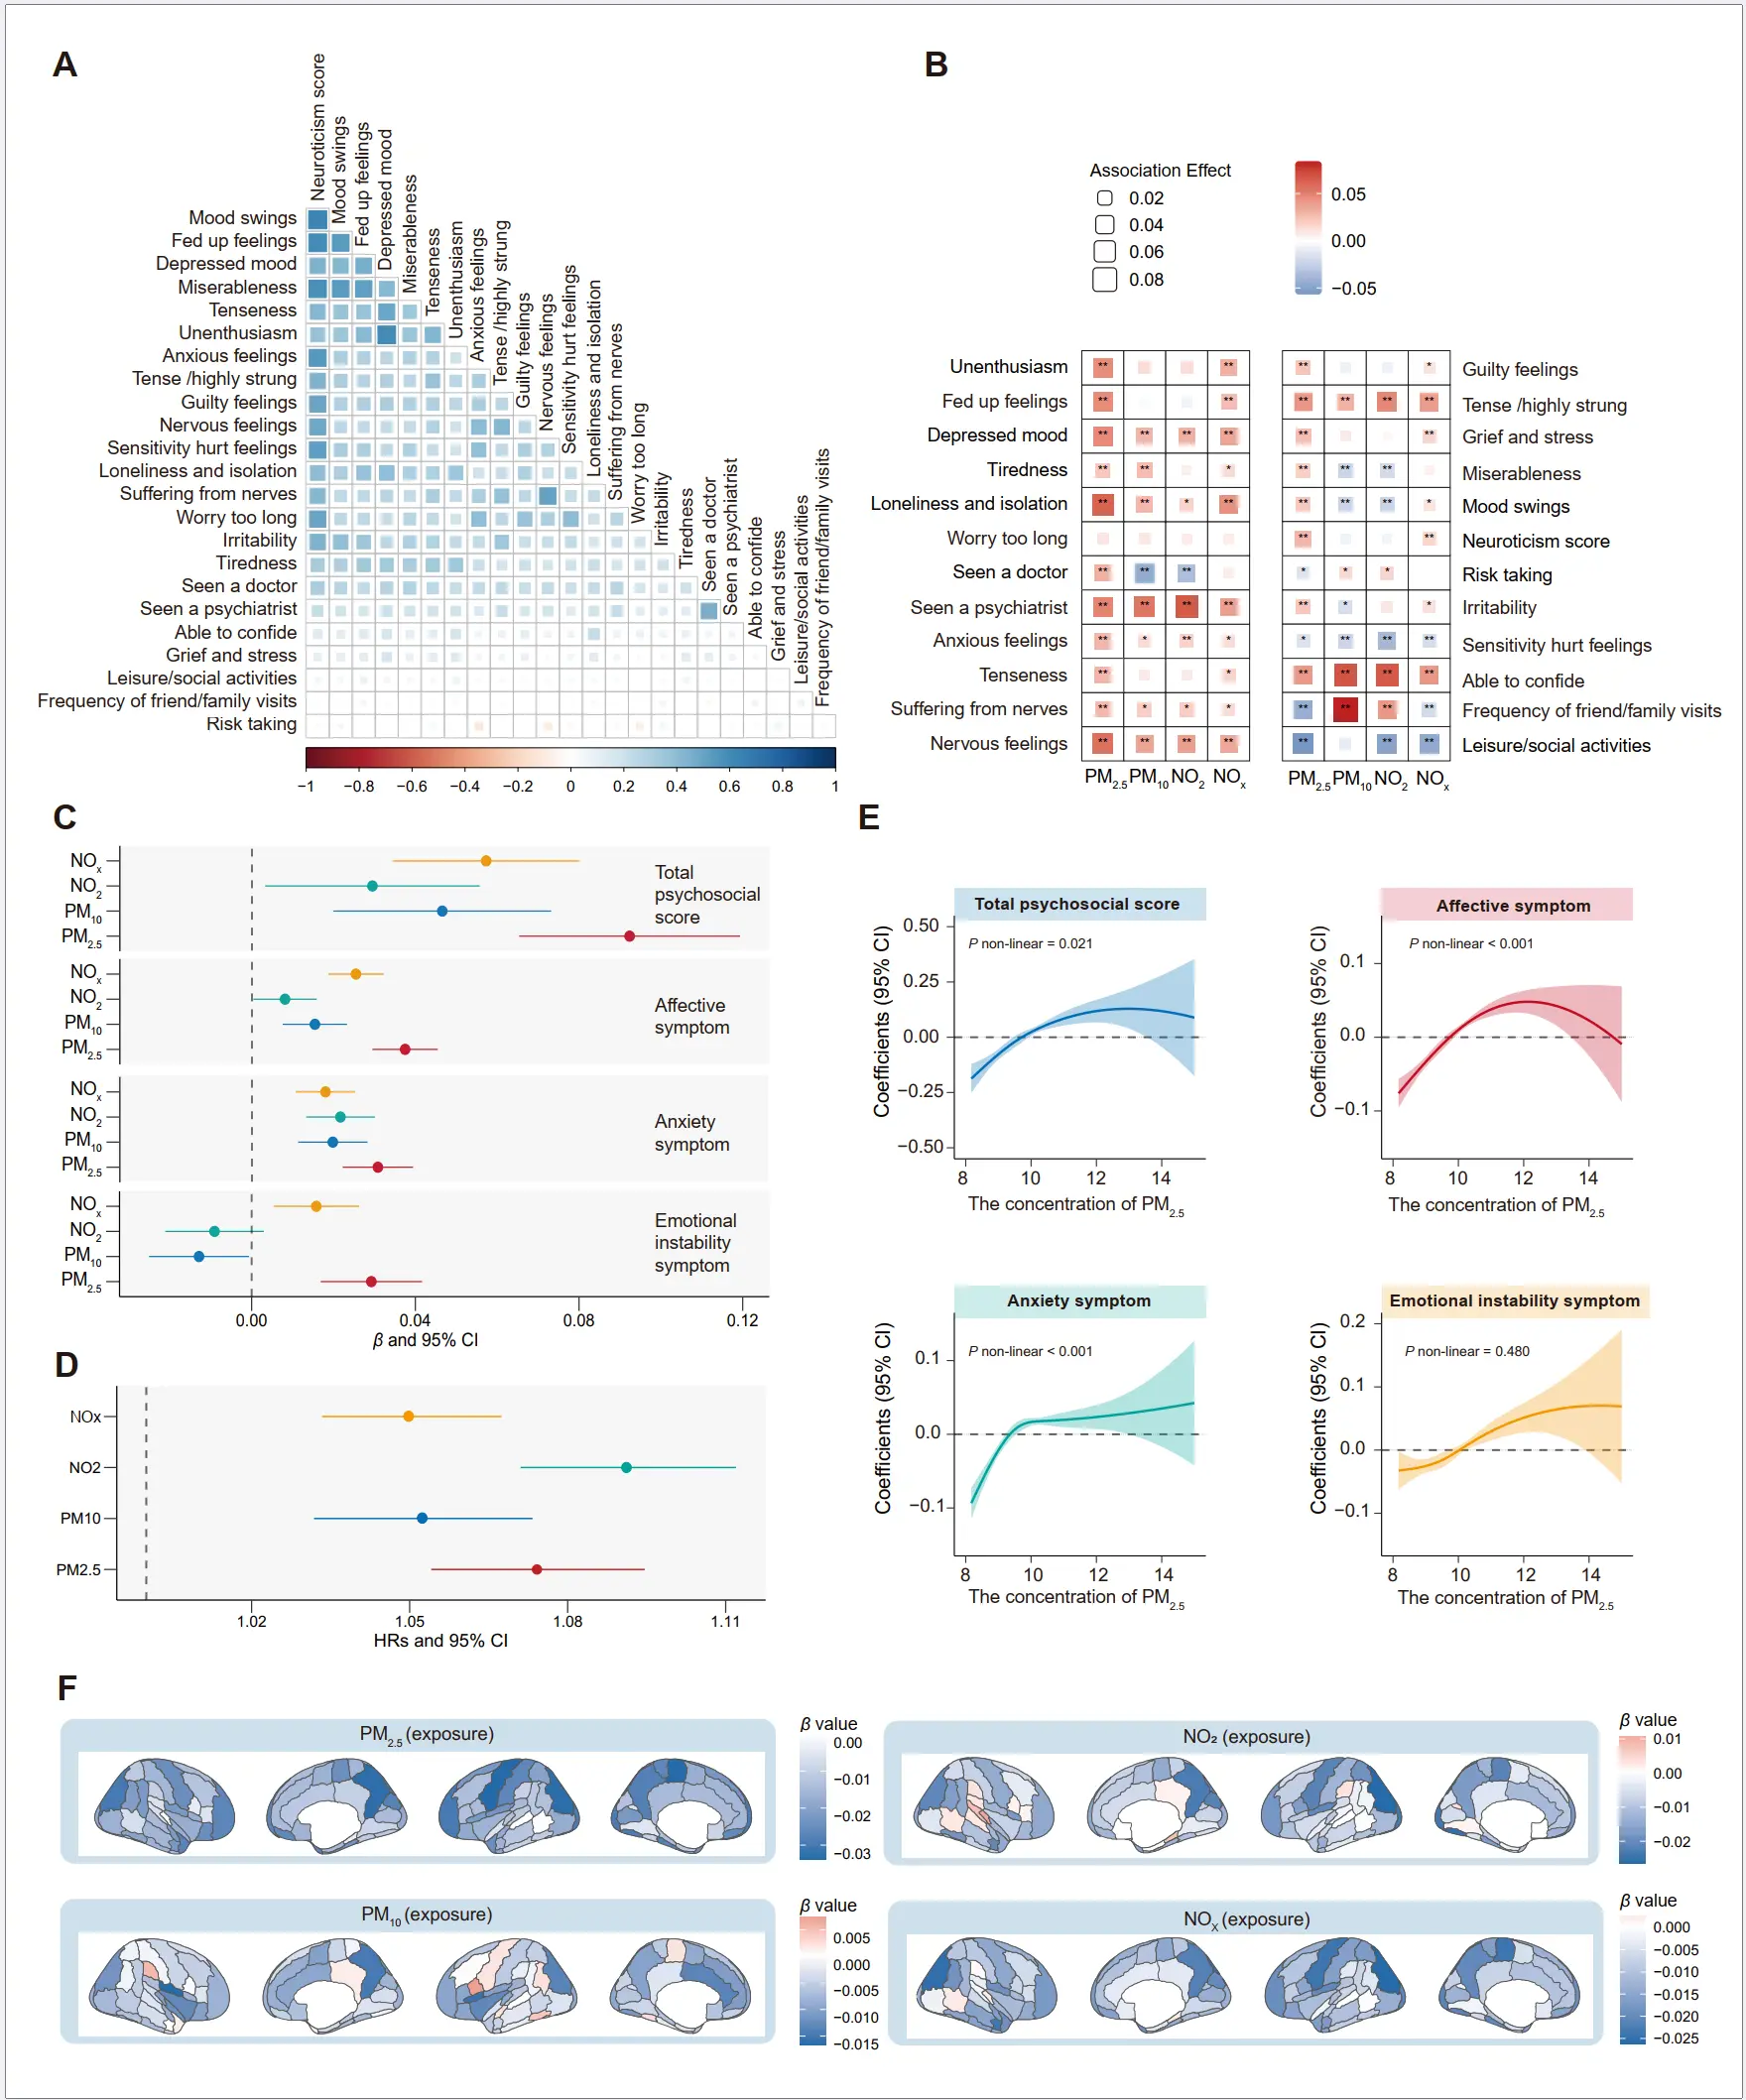
Figure 3. Associations of air pollution with psychological factors and brain structure. (A) The correlation heatmap showed a strong correlation among the psychological factors. (B) The heatmap showed the significant associations of air pollution with 22 psychological factors. The asterisks indicate associations of statistical significance (* p < 0.05, ** Bonferroni-corrected p < 0.05). (C) Coefficients with 95% confidence intervals (CIs) for specific psychological domains and the total psychological score associated with each interquartile range (IQR) increase in air pollution levels (μg/m3). (D) Longitudinal associations between air pollution exposure and risk of psychiatric disorders, and presented by hazard ratio with 95% confidence intervals (CIs) for each interquartile range (IQR) increase in air pollution levels (μg/m3). (E) Exposure-response relationships between air pollution and psychological score. (F) Associations between psychological factors and brain imaging phenotypes were tested using a linear regression model. Data are presented as β values. PM2.5, fine particulate matter with diameter < 2.5 µm; PM10, particulate matter with diameter < 10 µm; NO2, nitrogen dioxide; NOx, nitrogen oxides.
Longitudinal association of psychological factors and brain structure with risk of dementia. In addition, almost all psychological items were associated with a higher risk of dementia (Figure 4A and Supplementary Table S9 and Table S10). We observed that unenthusiasm, longlines, and isolation and seen a psychiatrist possessed stronger effects on dementia, with HRs of 1.41 (95% CI: 1.29, 1.55), 1.45 (95% CI: 1.32, 1.59), and 1.47 (95% CI: 1.33, 1.64), respectively. The associations between specific psychological groups and dementia risk were also estimated (Figure 4B). One-unit increase in the total psychological score was associated with HRs of 1.03 (95% CI: 1.02, 1.04), 1.01 (95% CI: 1.00, 1.03), and 1.04 (95% CI: 1.02, 1.05) for ACD, AD and VD, respectively. Higher effects of the affective symptom group on dementia were detected, with HRs of 1.12 (95% CI: 1.10, 1.15), 1.08 (95% CI: 1.04, 1.13), and 1.16 (95% CI: 1.10, 1.22). A monotonic increase pattern was distinctly identified for the association between total psychosocial score, affective symptom score, anxiety symptom score, emotional instability symptom score, and dementia risk (Figure 4C). The same patterns were also found for AD and VD (Supplementary Figure S8 and Figure S9). Furthermore, an increase in volume of GM in hippocampus (left and right) and amygdala (left and right) was most strongly associated with a reduced risk of dementia (FDR-adjusted p value < 0.05) (Figure 4D).
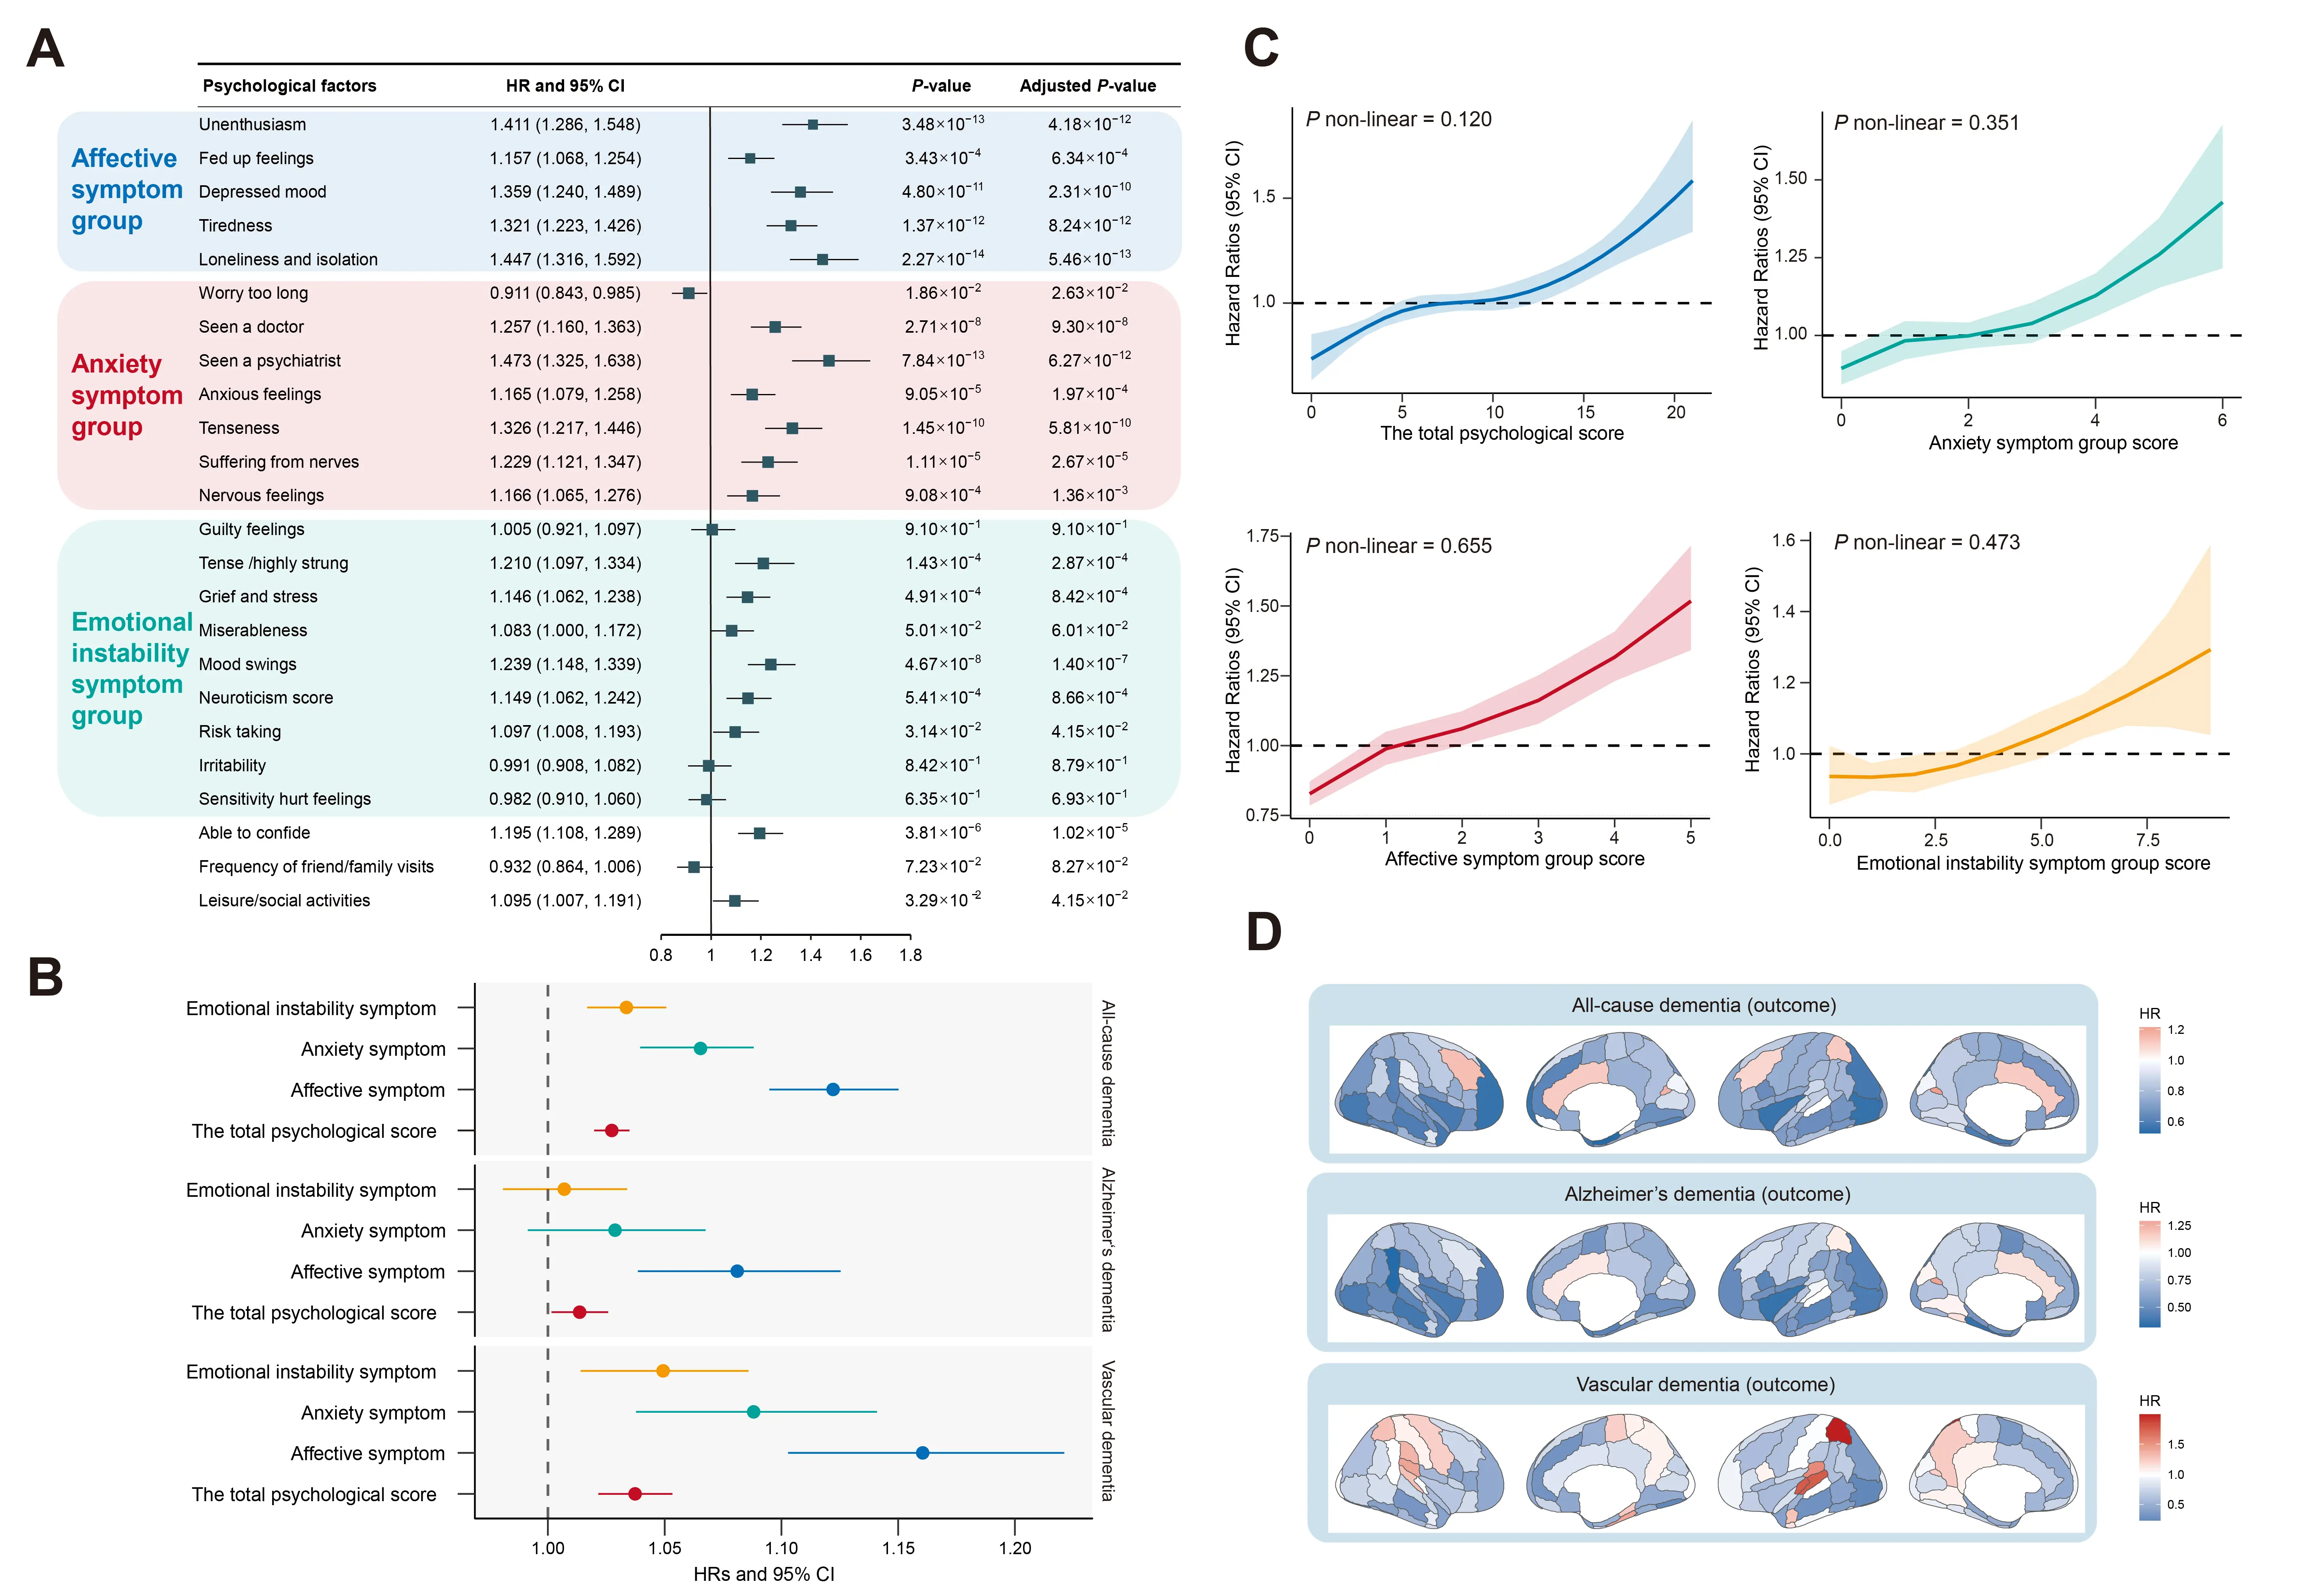
Figure 4. Longitudinal association of psychological factors and brain structure with risk of dementia. (A) Significant associations between individual psychological factors and dementia risk. (B) Hazard ratios (HRs) with 95% confidence intervals (CIs) for dementia associated with a one-score increase in specific psychological domains and the total psychological score. (C) Linear exposure-response relationships between specific psychological domains, total psychological score, and dementia risk were further evaluated. (D) Associations between brain imaging phenotypes and risk of dementia, tested using a Cox regression model. Data are presented as hazard ratio values.
Observational Bidirectional Associations between Psychological Factors/Psychiatric Disorders and Brain Structure
We examined the bidirectional relationship between brain imaging phenotypes and psychological factors/psychiatric disorders. The psychological factors were observed to be associated with the decrease volumes of several brain structures (Figure 5A). We found the total psychological score and affective symptom were closely associated with the reduction of the volume of GM in putamen (left), while anxiety symptom and emotional instability symptom might mainly exert influence on the volume of GM in frontal operculum cortex (left) and subcallosal cortex (left), respectively. We further identified the intersections of brain structures associated with psychological phenotypes, including frontal medial cortex (left), frontal operculum cortex (left), subcallosal cortex (left and right), paracingulate gyrus (right), caudate (left and right), putamen (left and right) (Figure 5B). We also detected the associations of each psychological factor with brain structures (Supplementary Figure S10, Figure S11, Figure S12 and Figure S13). In addition, the associations between brain structure and psychiatric disorders were shown in Figure 5C, we found that the reserve of amygdala, temporal fusiform cortex, occipital fusiform gyrus, and occipital fusiform gyrus were associated with a lower risk of psychiatric disorders. Furthermore, the amygdala, temporal fusiform cortex, and cerebellum were consistently associated with anxiety and depression (Figure 5D).
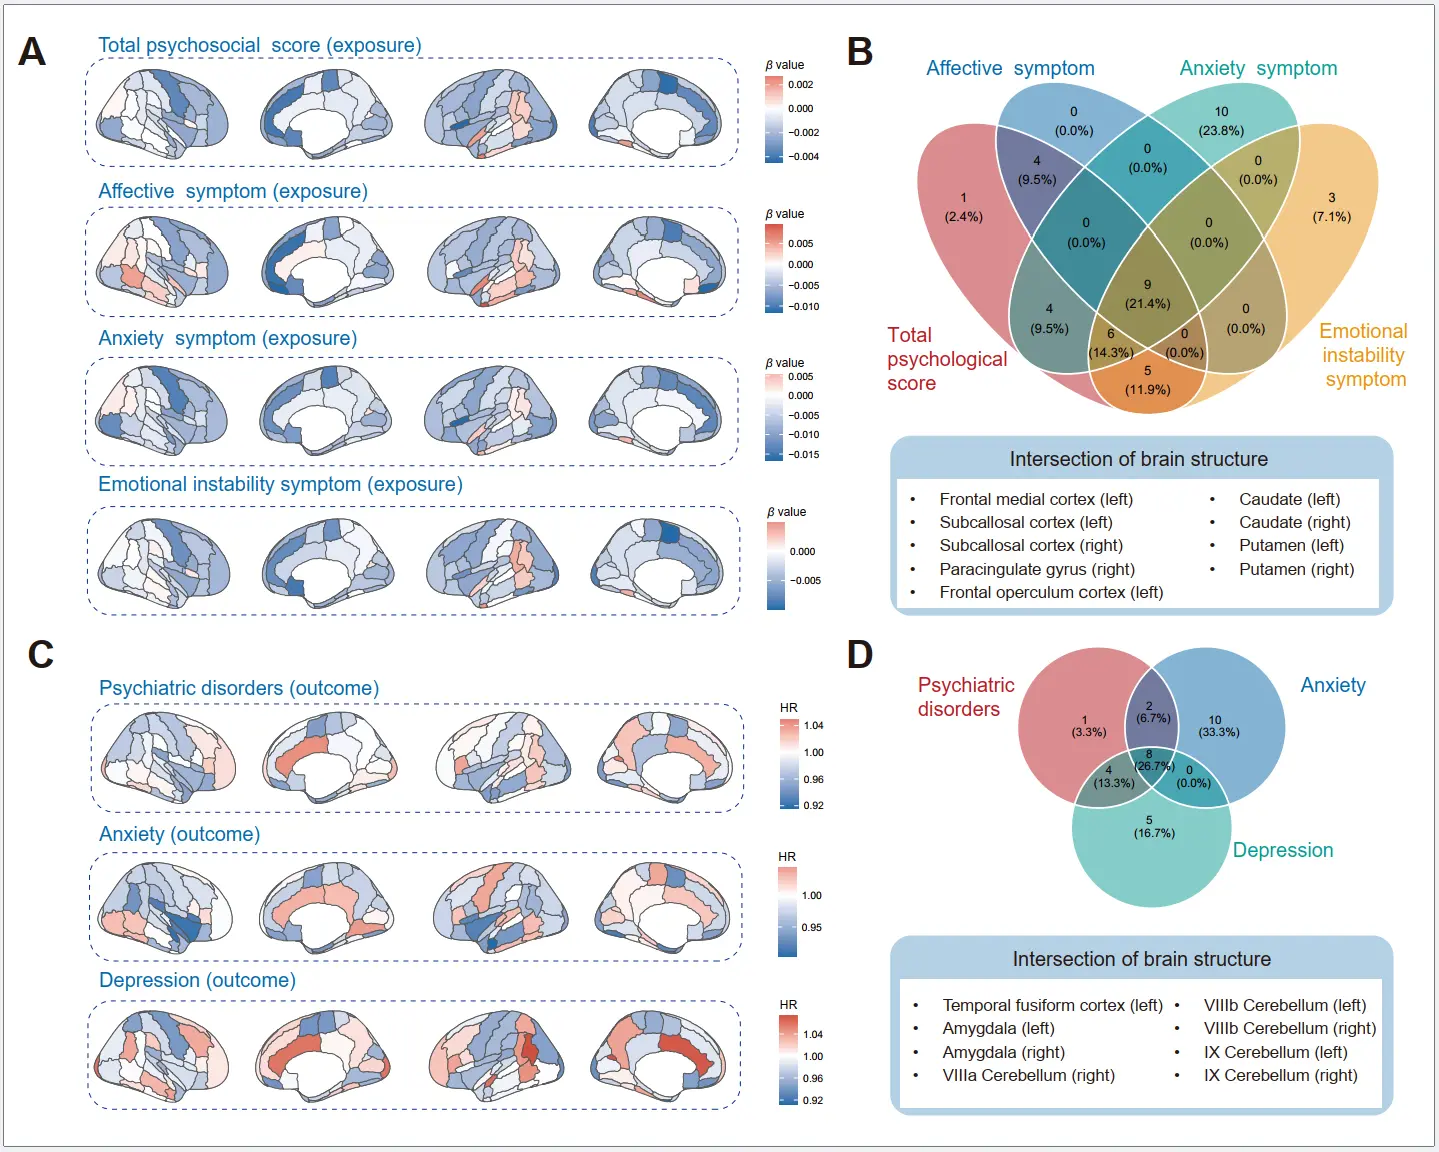
Figure 5. Associations of brain imaging phenotypes with air pollution, psychological factors, and dementia risk. (A) Associations between psychological groups (total psychosocial score, affective symptom, anxiety symptom, emotional instability symptom) and brain imaging phenotypes, tested using a linear regression model. Data are presented as β values. (B) The intersections of brain structures associated with psychological phenotypes (total psychosocial score, affective symptom, anxiety symptom, and emotional instability symptom). (C) Associations between brain imaging phenotypes and the risk of psychiatric disorders were tested using a Cox proportional hazard regression model. Data are presented as hazard ratio values. (D) The intersections of brain structures associated with psychiatric disorders, including anxiety and depression.
Mediation analysis. Based on the identified association between air pollution and risk of dementia and the significant association of psychological factors and brain structures with exposure (air pollution) and outcome (dementia), we further investigated the potential mediation role of psychological factors and brain structures underlying exposure-outcome. As Figure 6A,B shown, we observed that PM2.5 was inversely associated with dementia (β = 8.15 × 10⁻⁴, p = 1.04 × 10⁻⁴), PM2.5 had a significant detrimental effect on psychological factors (β = 0.184, p < 1.00 × 10⁻⁶), and psychological score was associated with dementia risk (β = 2.70 × 10⁻⁴, p = 5.43 × 10⁻¹⁰). Psychological score had a strong mediating effect, explaining 5.75% (95% CI: 3.83%, 7.67%). In addition, the brain structure also contributed to the association between PM2.5 and dementia (β = −1.16 × 10⁻³, p = 2.94 × 10⁻⁴). We further investigated the mediating role of each psychological item and brain structure (Figure 6C–E). Loneliness, isolation, and unenthusiasm were observed to be the strong mediators of psychological factors, with 4.45% and 4.23% of mediating effects. Amygdala (8.86% for right and 6.35% for left), hippocampus (8.21% for right and 5.45% for left), temporal pole (7.01% for right), frontal pole (6.53% for right), and temporal fusiform cortex, posterior division (6.37% for left) were also identified as important mediators.
Structural equation model. We assessed the latent variables through confirmatory factor analysis (CFA) in the SEM, including brain structure and psychological status (Supplementary Table S11). Frontal pole (right), frontal pole (left), precuneous cortex (right), precuneous cortex (left), and frontal orbital cortex (right) were the significant markers for predicting the brain structure latent variable (β = 0.857, 0.852, 0.769, 0.756, and 0.718, respectively; p < 0.001). Neuroticism score, mood swings, fed up feelings, miserableness, and depressed mood were the main components of the psychological status latent variable (β = 0.876, 0.691, 0.677, 0.639, and 0.575, respectively; p < 0.001). Next, the identified latent variables were introduced into the SEMs to obtain the path coefficients, and we examined all hypothetical paths (Figure 6F,G). Air pollution was a significant contributor of psychological status (β = 1.34 × 10⁻³, p = 8.79 × 10⁻⁹), brain structure (β = −1.04 × 10⁻², p = 0.027), and dementia (β = 1.14 × 10⁻⁴, p = 6.94 × 10⁻³). Psychological factors were significantly associated with brain structure (β = −0.664, p = 3.97 × 10⁻⁴) and dementia (β = 4.32 × 10⁻², p = 6.87 × 10⁻⁴). In addition, brain structure was a significant predictor for dementia (β = −2.25 × 10⁻³, p = 1.78 × 10⁻⁸). We further examined the path of air pollution → brain structure → psychiatric disorders → dementia, and observed that brain structure was also a significant predictor for psychiatric disorders (β = −6.54 × 10⁻³, p = 2.49 × 10⁻⁵).
Mendelian randomization analysis. As shown in Supplementary Table S12, we found that genetically proxied psychiatric orders, including bipolar disorder and schizophrenia, were associated with dementia (FDR-adjusted p value < 0.05), and the corresponding ORIVW of 1.05 (95% CI: 1.01, 1.10) and 1.07 (95% CI: 1.04, 1.10). We also observed the evidence for the marginally causal associations between several brain IDPs and dementia risk, including GM in Heschl’s gyrus (right), GM in caudate (left), GM in VI cerebellum (vermis), GM in superior parietal lobule (left), and GM in cingulate gyrus, anterior division (right). However, most associations no longer became statistically significant after accounting for multiple testing. The bidirectional causal associations between psychiatric disorders and brain IDPs were further estimated. Overall, we identified the potential causal relationship between some psychiatric disorders and specific brain regions. Specifically, genetically predicted anxiety disorders were associated with increased volumes of GM in the hippocampus (left, βIVW = 0.22, 95% CI: 0.09, 0.35, p = 9.83 × 10⁻⁴, and right, βIVW = 0.23, 95% CI: 0.07, 0.40, p = 5.53 × 10⁻³). Genetically predicted levels of brain IDPs, including GM in paracingulate gyrus (left) and superior temporal gyrus, posterior division (left) were causally associated with the reduced risk of anxiety disorders (ORIVW = 0.79, 95% CI: 0.67, 0.93; ORIVW = 0.71, 95% CI: 0.55, 0.94).
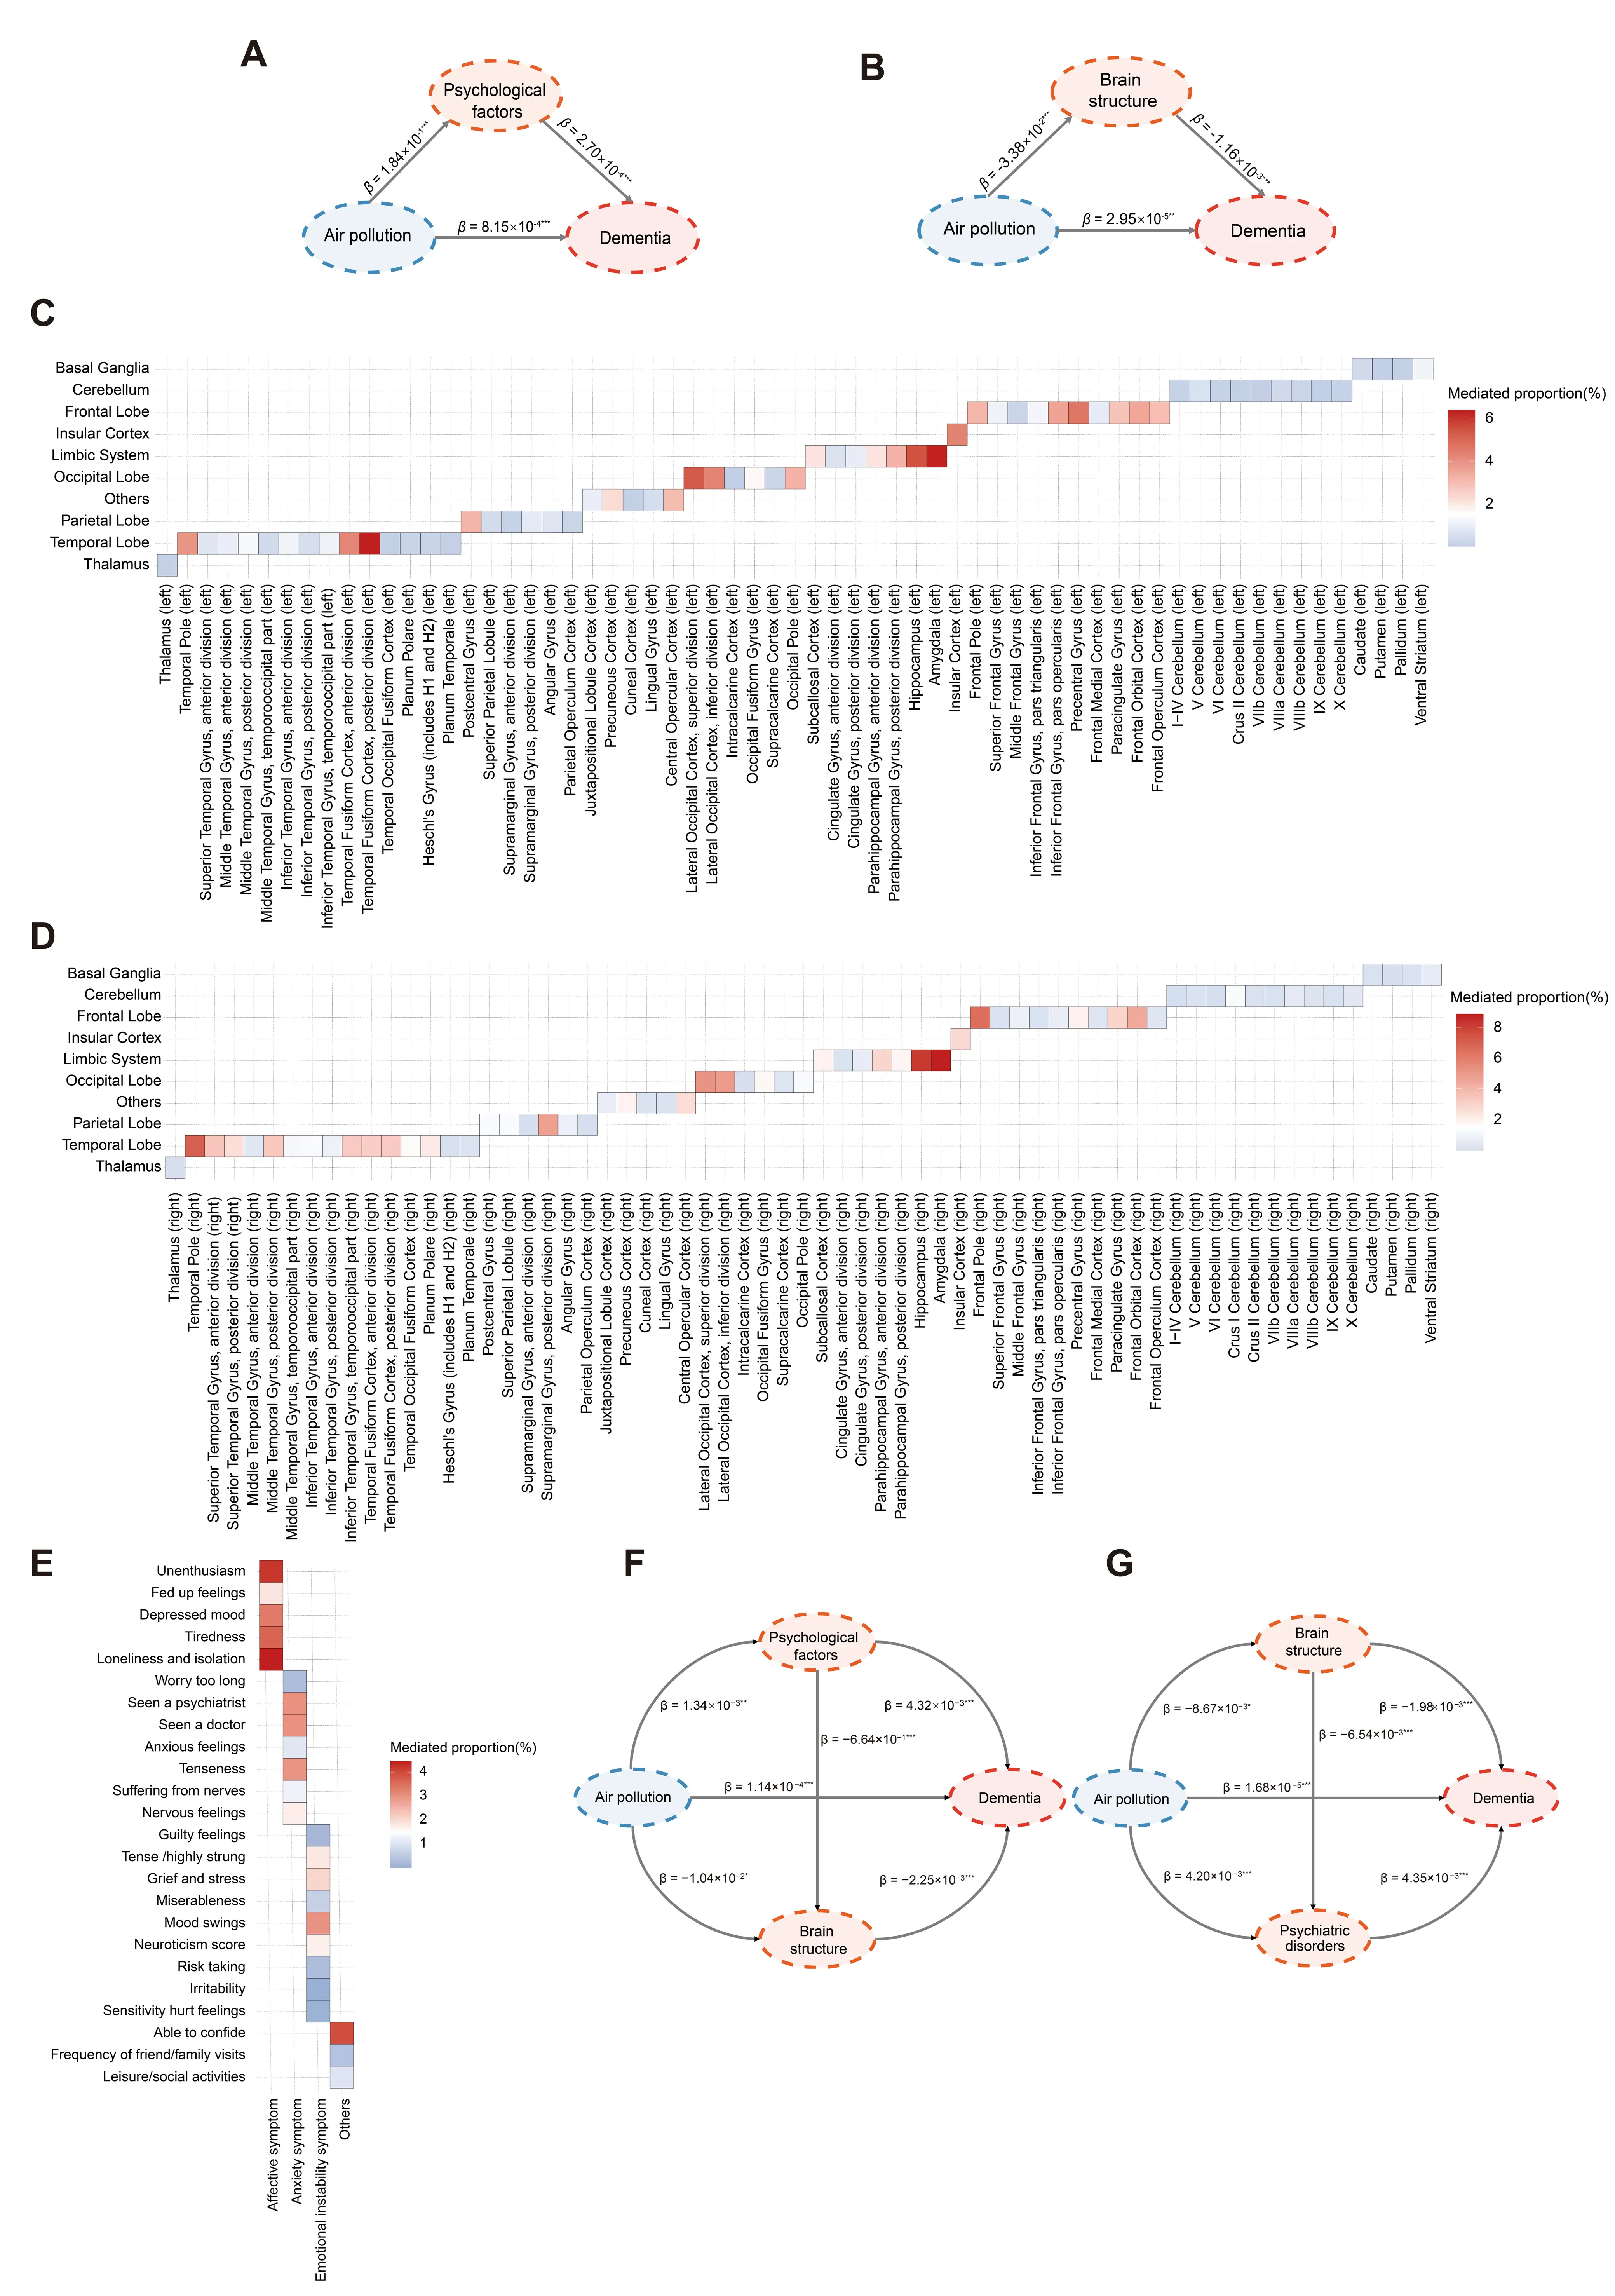
Figure 6. Mediation analysis and structural equation model. (A) Mediation model was conducted to analyze the direct relationship between air pollution and dementia, with total psychological score as mediator. (B) Mediation model was conducted to analyze the direct relationship between air pollution and dementia, with mean values of brain gray matter associated with air pollution as mediator. (C) Mediation model was conducted to analyze the direct relationship between air pollution and dementia, with each brain imaging phenotype (left) as mediator. (D) Mediation model was conducted to analyze the direct relationship between air pollution and dementia, with each brain imaging phenotype (right) as mediator. (E) Mediation model was conducted to analyze the direct relationship between air pollution and dementia, with each psychological factor as mediator. (F) Structural equation models were constructed for the air pollution, psychological factors, brain structure, and dementia. (G) Structural equation models were constructed for air pollution, brain structure, psychiatric disorders, and dementia. Standardized coefficients were shown in the Figure. Standardized coefficients were shown in the Figure. The asterisks indicate associations of statistical significance (* p < 0.05, ** p < 0.01, and *** p < 0.001).
4. Discussion
The current study provided a comprehensive evaluation and clarification of the association between air pollution and brain health, including psychiatric orders, brain structure, and dementia risk among middle-aged and older participants. Our findings indicated that long-term air pollution exposure was significantly associated with a higher risk of dementia, adverse psychological factors, and reduced volumes of specific brain imaging phenotypes. The bidirectional relationships between psychological factors/psychiatric disorders and brain structural alterations were demonstrated through observational analyses. Additionally, psychological factors and brain structure were observed to mediate the relationship between air pollution and dementia risk, especially for loneliness and isolation, unenthusiasm, and reductions in volumes of the amygdala, hippocampus, temporal pole, and frontal pole. The SEM results revealed two potential pathways through which air pollution may induce dementia risk: (1) air pollution → psychological factors → brain structures → dementia, and (2) air pollution → brain structures → psychological factors → dementia. These mediating pathways highlighted the complex interplay and bidirectional relationships. Furthermore, the bidirectional MR analysis provided additional support for the potentially bidirectional associations among psychological factors, brain structures, and dementia risk. These findings highlighted the importance of air pollution as a modifiable environmental risk factor for dementia and provided potential intervention targets to mitigate the effects of air pollution on brain health.
In our study, we observed that air pollution was significantly associated with an elevated dementia risk, including ACD, AD, and VD. Specifically, each IQR increment in air pollutant levels was linked to a 5%~13% higher risk of dementia. Previous studies have also demonstrated the detrimental effects of air pollution on dementia [4,5,6,24,25,26], and the Lancet commission has included air pollution in the list of modifiable risk factors of dementia [9]. The Health and Retirement Study from the US reported that higher residential PM2.5 levels, especially from agriculture and wildfires, were associated with a higher risk of incident dementia [27]. The findings from the Chinese Longitudinal Healthy Longevity Survey indicated that long-term exposure to PM2.5 contributed to the development of cognitive decline [28]. A longitudinal study from northern Sweden also found that traffic-related air pollution was significantly associated with the risk of VD and AD [26]. Though there was heterogeneity in the study population, study setting, study design, exposure assessment, and statistical analysis, we all observed the adverse effects of air pollution on dementia. Furthermore, our findings revealed a more pronounced association between PM2.5 exposure and dementia risk among APOE ε4 non-carriers compared to carriers, potentially attributable to a “masking effect” The substantial influence of the APOE ε4 allele on dementia risk may effectively “obscure” or “diminish” the observable impact of other contributing risk factors [29]. Our analysis further revealed that PM2.5 exposure accounted for over 2.5% of ACD and AD cases, with this attributable fraction increasing to 6% for VD. This finding was in line with the recent report of the Lancet standing Commission, which identified air pollution as a persistent and modifiable risk factor that exerted cumulative effects throughout the lifespan [30]. When extrapolated to national or global populations, this proportion corresponds to thousands of potentially avoidable dementia cases. Importantly, the public health benefits may be even greater in regions with higher baseline pollution levels.
Previous investigations identified the association between air pollution and psychiatric disorders, whereas studies failed to illustrate the specific symptom profiles in response to air pollution exposure [31,32]. In our analysis, we measured the psychological factors through validated questionnaires and divided them into three distinct symptom clusters, including the affective symptom cluster, anxiety symptom cluster, and emotional-instability symptom cluster. We found that PM2.5 exposure was strongly associated with affective, anxiety, and emotional instability symptoms. Furthermore, our analysis revealed that NOx exposure represents an additional significant environmental risk factor for these psychiatric manifestations. A possible mechanism for the association may be due to oxidative stress-mediated neuronal damage and altered neurotransmitter metabolism due to systemic inflammation [33,34].
Neuroimaging analyses revealed significant reductions in gray matter volume associated with increasing air pollution concentrations, particularly in several critical brain regions: the precentral gyrus, lateral occipital cortex, precuneus cortex, frontal pole, and hippocampus. These structural changes were most pronounced in regions associated with motor function, visual processing, self-referential cognition, executive function, and memory formation [35,36,37,38]. Previous studies have consistently demonstrated that high levels of air pollution were associated with reductions in the total gray matter, prefrontal cortox, and fronto-parietal network (FPN) [12,39,40]. A neurological effects study from Korean showed that per10 μg/m3 increase in PM2.5 was linked to a −0.18 mm (95% CI: −0.27, −0.08) decrease in thicknesses of temporal cortex, and they also observed that air pollution exposure was associated with other important subcortical structures, including the thalamus, caudate, pallidum, hippocampus, and amygdala [41]. Our findings align with these results and further provide quantitative evidence on the long-term effects of air pollution exposure on various gray matter structures in the brain.
The associations between air pollution and dementia have been well-identified; however, the underlying mechanisms remain poorly understood. Filling in these black boxes is crucial for enhancing causal inferences by providing a clearer understanding of the pathways involved. Our study findings have shed light on potential pathways linking air pollution to dementia, which may be sequentially mediated through psychological factors and brain structural changes. This is supported by a prior longitudinal study that investigated the mediating role of brain volumes in the association between air pollution and incident dementia, revealing significant mediating effects (2–8%) of reduced total brain volume, peripheral cortical grey matter, and total grey matter [42]. Additionally, a study conducted in older Chinese adults observed the mediating effect of depression on the association between solid cooking fuel use and dementia [43]. The findings from our study, along with those from prior research, underscore the complex and multifaceted nature of the relationship between air pollution and dementia.
The sequential mediation through psychological factors, brain structural changes, and bidirectional MR analysis provided a plausible pathway that could explain how chronic exposure to air pollution may contribute to cognitive decline and dementia. The interplay between psychological factors and brain structural changes may create a self-perpetuating cycle of neurodegeneration. Specifically, depression has been consistently associated with volumetric reductions in the hippocampus, a brain region critical for memory and learning. This hippocampal atrophy may subsequently lead to cognitive impairment, which could potentially intensify depressive symptomatology, thereby creating a feedback loop that may accelerate progressive brain atrophy. In addition, brain structure changes demonstrate significant associations with anxiety disorders. The limbic system, comprising the hippocampus, amygdala, hypothalamus, and thalamus, plays a pivotal role in emotional regulation and processing. Individuals with anxiety disorders typically exhibit hyperactivation within these limbic structures. This bidirectional relationship highlighted the critical need for a dual-focused approach that simultaneously addresses both psychological well-being and neurostructural integrity when investigating the etiological pathways connecting air pollution exposure to dementia development.
The greatest strength of the current study is the large sample size and long follow-up duration from the UK Biobank. In addition, leveraging multifaceted data, we comprehensively explored the association between air pollution and brain health, including psychological factors, brain structure, and dementia. We further identified the potential mechanistic pathways underlying the observed associations and assessed the mediating effects of psychological factors and brain structures. Our study had several limitations to be acknowledged. First, air pollution exposure was estimated using annual average concentrations prior to baseline, without accounting for temporal variations during follow-up. The air pollution estimates were primarily based on 2010 data, while UK Biobank recruitment occurred between 2006 and 2010. This limitation is inherent to the ESCAPE exposure modeling framework, which provides the most reliable and standardized pollution estimates available for the cohort. Importantly, these exposure metrics have been widely used and validated in multiple UK Biobank studies examining neurological and cardiometabolic outcomes [44,45,46]. Second, although brain volumes were measured after exposure to air pollution, the availability of only absolute volume data makes it impossible to rule out the possibility that these volumetric differences predated the exposure. Furthermore, since dementia diagnosis is typically based on a gradual decline in functioning, the disease progression may have begun well before the imaging visit, even if the diagnosis was made afterward. This suggests that current brain imaging data may not fully capture the impact of air pollution on dementia. Future research should employ longitudinal tracking of brain volume changes and cognitive function to assess their response more accurately to air pollution exposure, with subsequent follow-up on dementia cases. In addition, although our SEM and bidirectional MR analyses provide support for mutual influence between psychological factors and brain structure, the possibility of reverse causality—particularly early neuroanatomical changes preceding psychological symptoms—cannot be entirely ruled out. Third, as the UK Biobank participants were recruited from healthy volunteers, the potential for selection bias cannot be entirely ruled out. Additionally, the UK Biobank sample is predominantly White British, which may limit generalizability to non-European populations. Replication in more diverse cohorts is warranted. Fourth, the psychological factors were evaluated through a standardized mental health questionnaire, and we dropped more than 20 items due to the >50% missing rate, which might contribute to loss of information and selection bias.
In conclusion, this study provides novel insights into the multifaceted relationship between air pollution and brain health, particularly in middle-aged and older populations. By integrating psychiatric, neuroimaging, and dementia risk data, we identified significant associations between long-term air pollution exposure and adverse brain health outcomes, including increased dementia risk, psychological distress, and reduced volumes of specific brain regions. Furthermore, psychological factors and brain structural changes independently explained 5% to 10% of the association between air pollution and dementia risk. Two distinct yet interconnected pathways were identified to illustrate the complex, bidirectional interplay among air pollution, psychological, and neuroanatomical factors in dementia development. These findings have emphasized the importance of air pollution as a modifiable environmental determinant of brain health and suggested that interventions targeting psychological well-being and neuroanatomical integrity may help mitigate the impact of air pollution on dementia risk.
Supplementary Materials
The following supporting information can be found at: https://www.sciepublish.com/article/pii/769, Figure S1: The flowchart of the UK biobank participants included and excluded in the current analysis; Figure S2: Diagnostic plot for cox model proportional hazards assumption; Figure S3: The exposure-response relationship between air pollution exposure and Alzheimer’s dementia. PM2.5, fine particulate matter with diameter < 2.5 µm; PM10, particulate matter with diameter < 10 µm; NO2, nitrogen dioxide; NOx, nitrogen oxides. HRs, hazard ratios; CIs, confidence intervals. Models adjusted for age, sex, ethnicity, education level, Townsend deprivation index (TDI), body mass index (BMI), smoking status, alcohol consumption, physical activity, diabetes, hypertension, and APOE ɛ4 carrier status; Figure S4: The exposure-response relationship between air pollution exposure and vascular dementia. PM2.5, fine particulate matter with diameter < 2.5 µm; PM10, particulate matter with diameter < 10 µm; NO2, nitrogen dioxide; NOx, nitrogen oxides. HRs, hazard ratios; CIs, confidence intervals. Models adjusted for age, sex, ethnicity, education level, Townsend deprivation index (TDI), body mass index (BMI), smoking status, alcohol consumption, physical activity, diabetes, hypertension, and APOE ɛ4 carrier status; Figure S5: The exposure-response relationship between PM10 exposure and psychological group scores. PM10, particulate matter with diameter < 10 µm; HRs, CIs, confidence intervals. Models adjusted for age, sex, ethnicity, education level, Townsend deprivation index (TDI), body mass index (BMI), smoking status, alcohol consumption, physical activity, diabetes, and hypertension; Figure S6: The exposure-response relationship between NO2 exposure and psychological group scores. NO2, nitrogen dioxide; CIs, confidence intervals. Models adjusted for age, sex, ethnicity, education level, Townsend deprivation index (TDI), body mass index (BMI), smoking status, alcohol consumption, physical activity, diabetes, and hypertension; Figure S7: The exposure-response relationship between NOx exposure and psychological group scores. NOx, nitrogen oxides; CIs, confidence intervals. Models adjusted for age, sex, ethnicity, education level, Townsend deprivation index (TDI), body mass index (BMI), smoking status, alcohol consumption, physical activity, diabetes, and hypertension; Figure S8: The exposure-response relationship between psychological group score and vascular dementia. HRs, hazard ratios; CIs, confidence intervals. Models adjusted for age, sex, ethnicity, education level, Townsend deprivation index (TDI), body mass index (BMI), smoking status, alcohol consumption, physical activity, diabetes, hypertension, and APOE ɛ4 carrier status; Figure S9: The exposure-response relationship between psychological group score and Alzheimer’s dementia. HRs, hazard ratios; CIs, confidence intervals. Models adjusted for age, sex, ethnicity, education level, Townsend deprivation index (TDI), body mass index (BMI), smoking status, alcohol consumption, physical activity, diabetes, hypertension, and APOE ɛ4 carrier status; Figure S10: The association of affective symptom factors with brain structures. Tested using a linear regression model. Data are presented as β values; Figure S11: The association of anxiety symptom factors with brain structures. Tested using a linear regression model. Data are presented as β values; Figure S12: The association of emotional instability symptom factors with brain structures. Tested using a linear regression model. Data are presented as β values; Figure S13: The association of other psychological factors with brain structures. Tested using a linear regression model. Data are presented as β values. Table S1: Baseline characteristics for included and excluded participants of the current study; Table S2: The detailed definition of the 24 psychological factors in the UK biobank; Table S3: International Classification of Disease codes used to ascertain psychiatric disorders; Table S4: The definitions of brain imaging phenotypes; Table S5: International Classification of Disease codes used to ascertain dementia and its subtypes; Table S6: Associations of air pollution exposure with dementia risk stratified by age; Table S7: Associations of air pollution exposure with dementia risk stratified by sex; Table S8: Associations of air pollution exposure with dementia risk stratified by APOE ε4 carrier’s status; Table S9: Associations between psychological factors and incident vascular dementia risk; Table S10: Associations between psychological factors and incident Alzheimer’s dementia risk; Table S11: Factor loading in comfirmatory factor analysis for latent variable of air pollution, psychological factors, and brain structure; Table S12: The Mendelian randomization estimates of bidirectional associations among psychiatric disorders, brain imaging-derived phenotypes, and dementia.
Statement of the Use of Generative AI and AI-Assisted Technologies in the Writing Process
During the preparation of this manuscript, the author(s) used ChatGPT (OpenAI) in order to improve readability and language. After using this tool/service, the author(s) reviewed and edited the content as needed and take(s) full responsibility for the content of the published article.
Acknowledgement
This research has been conducted using the UK Biobank Resource (Application Number 69550). This work uses data provided by patients and collected by the NHS as part of their care and support. We appreciate all participants and professionals contributing to the UK Biobank.
Author contributions
F.T.: Formal analysis, Writing—original draft, Writing—review & editing. D.Z.: Formal analysis, Writing—review & editing; J.Z.: Writing—review & editing; Z.L.: Writing—review & editing; L.C.: Formal analysis, Writing—review & editing; Z.Q.: Writing—review & editing; S.W.: Formal analysis, Writing—review & editing; T.B.: Writing—review & editing; H.L.: Conceptualization, Formal analysis, Writing—original draft, Writing—review & editing.
Ethics Statement
The study was conducted according to the guidelines of the Declaration of Helsinki and approved by the Ethics Committee of National Health Service North West Centre for Research (ref. 11/NW/0382 and 17 June 2011).
Informed Consent Statement
Informed consent was obtained from all subjects involved in the study.
Data Availability Statement
The data presented in this study are available upon reasonable request from the corresponding author.
Funding
This work was supported by the National Natural Science Foundation of China (82373534).
Declaration of Competing Interest
The authors declare that they have no known competing financial interests or personal relationships that could have appeared to influence the work reported in this paper.
References
-
Verhoeven JI, Allach Y, Vaartjes ICH, Klijn CJM, de Leeuw FE. Ambient air pollution and the risk of ischaemic and haemorrhagic stroke. Lancet Planet. Health 2021, 5, e542–e552. doi:10.1016/S2542-5196(21)00145-5. [Google Scholar]
-
Liu S, Jørgensen JT, Ljungman P, Pershagen G, Bellander T, Leander K, et al. Long-term exposure to low-level air pollution and incidence of chronic obstructive pulmonary disease: The ELAPSE project. Environ. Int. 2021, 146, 106267. doi:10.1016/j.envint.2020.106267. [Google Scholar]
-
Weuve J, Bennett EE, Ranker L, Gianattasio KZ, Pedde M, Adar SD, et al. Exposure to Air Pollution in Relation to Risk of Dementia and Related Outcomes: An Updated Systematic Review of the Epidemiological Literature. Environ. Health Perspect. 2021, 129, 96001. doi:10.1289/EHP8716. [Google Scholar]
-
Wilker EH, Osman M, Weisskopf MG. Ambient air pollution and clinical dementia: systematic review and meta-analysis. BMJ 2023, 381, e071620. doi:10.1136/bmj-2022-071620. [Google Scholar]
-
Shaffer RM, Blanco MN, Li G, Adar SD, Carone M, Szpiro AA, et al. Fine Particulate Matter and Dementia Incidence in the Adult Changes in Thought Study. Environ. Health Perspect. 2021, 129, 87001. doi:10.1289/EHP9018. [Google Scholar]
-
Semmens EO, Leary CS, Fitzpatrick AL, Ilango SD, Park C, Adam CE, et al. Air pollution and dementia in older adults in the Ginkgo Evaluation of Memory Study. Alzheimer's Dement. 2022, 19, 549–559. doi:10.1002/alz.12654. [Google Scholar]
-
Grande G, Ljungman PLS, Eneroth K, Bellander T, Rizzuto D. Association Between Cardiovascular Disease and Long-term Exposure to Air Pollution With the Risk of Dementia. JAMA Neurol. 2020, 77, 801–809. doi:10.1001/jamaneurol.2019.4914. [Google Scholar]
-
Mukadam N, Wolters FJ, Walsh S, Wallace L, Brayne C, Matthews FE, et al. Changes in prevalence and incidence of dementia and risk factors for dementia: An analysis from cohort studies. Lancet Public. Health 2024, 9, e443–e460. doi:10.1016/S2468-2667(24)00120-8. [Google Scholar]
-
Livingston G, Huntley J, Sommerlad A, Ames D, Ballard C, Banerjee S, et al. Dementia prevention, intervention, and care: 2020 report of the Lancet Commission. Lancet. 2020, 396, 413–446. doi:10.1016/S0140-6736(20)30367-6. [Google Scholar]
-
Braithwaite I, Zhang S, Kirkbride JB, Osborn DPJ, Hayes JF. Air Pollution (Particulate Matter) Exposure and Associations with Depression, Anxiety, Bipolar, Psychosis and Suicide Risk: A Systematic Review and Meta-Analysis. Environ. Health Perspect. 2019, 127, 126002. doi:10.1289/EHP4595. [Google Scholar]
-
Xu J, Liu N, Polemiti E, Garcia-Mondragon L, Tang J, Liu X, et al. Effects of urban living environments on mental health in adults. Nat. Med. 2023, 29, 1456–1467. doi:10.1038/s41591-023-02365-w. [Google Scholar]
-
Nußbaum R, Lucht S, Jockwitz C, Moebus S, Engel M, Jöckel KH, et al. Associations of Air Pollution and Noise with Local Brain Structure in a Cohort of Older Adults. Environ. Health Perspect. 2020, 128, 67012. doi:10.1289/EHP5859. [Google Scholar]
-
Stott J, Saunders R, Desai R, Bell G, Fearn C, Buckman JEJ, et al. Associations between psychological intervention for anxiety disorders and risk of dementia: a prospective cohort study using national health-care records data in England. Lancet Healthy Longev. 2023, 4, e12–e22. doi:10.1016/S2666-7568(22)00242-2. [Google Scholar]
-
Beach B, Steptoe A, Zaninotto P. Depression and anxiety in people with cognitive impairment and dementia during the COVID-19 pandemic: Analysis of the English Longitudinal Study of Ageing. PLoS Med. 2023, 20, e1004162. doi:10.1371/journal.pmed.1004162. [Google Scholar]
-
Vanbrabant K, Van Dam D, Bongaerts E, Vermeiren Y, Bové H, Hellings N, et al. Accumulation of Ambient Black Carbon Particles Within Key Memory-Related Brain Regions. JAMA Netw. Open 2024, 7, e245678. doi:10.1001/jamanetworkopen.2024.5678. [Google Scholar]
-
van der Velpen IF, Vlasov V, Evans TE, Ikram MK, Gutman BA, Roshchupkin GV, et al. Subcortical brain structures and the risk of dementia in the Rotterdam Study. Alzheimers Dement. 2023, 19, 646–657. doi:10.1002/alz.12690. [Google Scholar]
-
Tian F, Wang Y, Qian ZM, Ran S, Zhang Z, Wang C, et al. Plasma metabolomic signature of healthy lifestyle, structural brain reserve and risk of dementia. Brain 2025, 148, 143–153. doi:10.1093/brain/awae257. [Google Scholar]
-
Zheng D, Zhuo B, Zheng G, Hua J, Zhang J, Wang C, et al. The associations of energy adjusted dietary inflammatory index with brain structure and cognitive function. Innov. Med. 2023, 1, 100036. doi:10.59717/j.xinn-med.2023.100036. [Google Scholar]
-
Sudlow C, Gallacher J, Allen N, Beral V, Burton P, Danesh J, et al. UK biobank: An open access resource for identifying the causes of a wide range of complex diseases of middle and old age. PLoS Med. 2015, 12, e1001779. doi:10.1371/journal.pmed.1001779. [Google Scholar]
-
Eeftens M, Beelen R, de Hoogh K, Bellander T, Cesaroni G, Cirach M, et al. Development of Land Use Regression models for PM2.5, PM2.5 absorbance, PM10 and PMcoarse in 20 European study areas; results of the ESCAPE project. Environ. Sci. Technol. 2012, 46, 11195–11205. doi:10.1021/es301948k. [Google Scholar]
-
Beelen R, Hoek G, Vienneau D, Eeftens M, Dimakopoulou K, Pedeli X, et al. Development of NO2 and NOx land use regression models for estimating air pollution exposure in 36 study areas in Europe—The ESCAPE project. Atmos. Environ. 2013, 72, 10–23. doi:10.1016/j.atmosenv.2013.02.037. [Google Scholar]
-
Miller KL, Alfaro-Almagro F, Bangerter NK, Thomas DL, Yacoub E, Xu J, et al. Multimodal population brain imaging in the UK Biobank prospective epidemiological study. Nat. Neurosci. 2016, 19, 1523–1536. doi:10.1038/nn.4393. [Google Scholar]
-
Smith SM, Douaud G, Chen W, Hanayik T, Alfaro-Almagro F, Sharp K, et al. An expanded set of genome-wide association studies of brain imaging phenotypes in UK Biobank. Nat. Neurosci. 2021, 24, 737–745. doi:10.1038/s41593-021-00826-4. [Google Scholar]
-
Zhang Z, Chen L, Wang X, Wang C, Yang Y, Li H, et al. Associations of Air Pollution and Genetic Risk With Incident Dementia: A Prospective Cohort Study. Am. J. Epidemiol. 2023, 192, 182–194. doi:10.1093/aje/kwac188. [Google Scholar]
-
Sommerlad A, Liu KY. Air pollution and dementia. BMJ 2023, 381, 655. doi:10.1136/bmj.p655. [Google Scholar]
-
Oudin A, Forsberg B, Adolfsson AN, Lind N, Modig L, Nordin M, et al. Traffic-Related Air Pollution and Dementia Incidence in Northern Sweden: A Longitudinal Study. Environ. Health Perspect. 2016, 124, 306–312. doi:10.1289/ehp.1408322. [Google Scholar]
-
Zhang B, Weuve J, Langa KM, D’Souza J, Szpiro A, Faul J, et al. Comparison of Particulate Air Pollution from Different Emission Sources and Incident Dementia in the US. JAMA Intern. Med. 2023, 183, 1080–1089. doi:10.1001/jamainternmed.2023.3300. [Google Scholar]
-
Ma YH, Chen HS, Liu C, Feng QS, Feng L, Zhang YR, et al. Association of Long-term Exposure to Ambient Air Pollution With Cognitive Decline and Alzheimer’s Disease-Related Amyloidosis. Biol. Psychiatry 2023, 93, 780–789. doi:10.1016/j.biopsych.2022.05.017. [Google Scholar]
-
Liu C-C, Kanekiyo T, Xu H, Bu G. Apolipoprotein E and Alzheimer disease: Risk, mechanisms and therapy. Nat. Rev. Neurol. 2013, 9, 106–118. doi:10.1038/nrneurol.2012.263. [Google Scholar]
-
Livingston G, Huntley J, Liu KY, Costafreda SG, Selbæk G, Alladi S, et al. Dementia prevention, intervention, and care: 2024 report of the Lancet standing Commission. Lancet. 2024, 404, 572–628. doi:10.1016/S0140-6736(24)01296-0. [Google Scholar]
-
Gao X, Jiang M, Huang N, Guo X, Huang T. Long-Term Air Pollution, Genetic Susceptibility, and the Risk of Depression and Anxiety: A Prospective Study in the UK Biobank Cohort. Environ. Health Perspect. 2023, 131, 17002. doi:10.1289/EHP10391. [Google Scholar]
-
Yang T, Wang J, Huang J, Kelly FJ, Li G. Long-term Exposure to Multiple Ambient Air Pollutants and Association with Incident Depression and Anxiety. JAMA Psychiatry 2023, 80, 305–313. doi:10.1001/jamapsychiatry.2022.4812. [Google Scholar]
-
Bhatt S, Nagappa AN, Patil CR. Role of oxidative stress in depression. Drug Discov. Today 2020, 25, 1270–1276. doi:10.1016/j.drudis.2020.05.001. [Google Scholar]
-
Mithaiwala MN, Santana-Coelho D, Porter GA, O’Connor JC. Neuroinflammation and the Kynurenine Pathway in CNS Disease: Molecular Mechanisms and Therapeutic Implications. Cells 2021, 10, 1548. doi:10.3390/cells10061548. [Google Scholar]
-
Beckwith T, Cecil K, Altaye M, Severs R, Wolfe C, Percy Z, et al. Reduced gray matter volume and cortical thickness associated with traffic-related air pollution in a longitudinally studied pediatric cohort. PLoS ONE 2020, 15, e0228092. doi:10.1371/journal.pone.0228092. [Google Scholar]
-
Guxens M, Lubczyńska MJ, Muetzel RL, Dalmau-Bueno A, Jaddoe VWV, Hoek G, et al. Air Pollution Exposure During Fetal Life, Brain Morphology, and Cognitive Function in School-Age Children. Biol. Psychiatry 2018, 84, 295–303. doi:10.1016/j.biopsych.2018.01.016. [Google Scholar]
-
Wilker EH, Preis SR, Beiser AS, Wolf PA, Au R, Kloog I, et al. Long-term exposure to fine particulate matter, residential proximity to major roads and measures of brain structure. Stroke 2015, 46, 1161–1166. doi:10.1161/STROKEAHA.114.008348. [Google Scholar]
-
Harris MH, Gold DR, Rifas-Shiman SL, Melly SJ, Zanobetti A, Coull BA, et al. Prenatal and childhood traffic-related air pollution exposure and childhood executive function and behavior. Neurotoxicol. Teratol. 2016, 57, 60–70. doi:10.1016/j.ntt.2016.06.008. [Google Scholar]
-
Gale SD, Erickson LD, Anderson JE, Brown BL, Hedges DW. Association between exposure to air pollution and prefrontal cortical volume in adults: A cross-sectional study from the UK biobank. Environ. Res. 2020, 185, 109365. doi:10.1016/j.envres.2020.109365. [Google Scholar]
-
Furlong MA, Alexander GE, Klimentidis YC, Raichlen DA. Association of Air Pollution and Physical Activity with Brain Volumes. Neurology 2022, 98, e416–e426. doi:10.1212/WNL.0000000000013031. [Google Scholar]
-
Cho J, Noh Y, Kim SY, Sohn J, Noh J, Kim W, et al. Long-Term Ambient Air Pollution Exposures and Brain Imaging Markers in Korean Adults: The Environmental Pollution-Induced Neurological EFfects (EPINEF) Study. Environ. Health Perspect. 2020, 128, 117006. doi:10.1289/EHP7133. [Google Scholar]
-
Thompson R, Tong X, Shen X, Ran J, Sun S, Yao XI, et al. Longitudinal associations between air pollution and incident dementia as mediated by MRI-measured brain volumes in the UK Biobank. Environ. Int. 2025, 195, 109219. doi:10.1016/j.envint.2024.109219. [Google Scholar]
-
Li M, Ma C, Wu C. Association between solid cooking fuel use and dementia in older Chinese adults: The mediating effect of depression. Int. J. Environ. Health Res. 2024, 34, 779–791. doi:10.1080/09603123.2023.2167950. [Google Scholar]
-
Tian F, Qian Z, Zhang Z, Liu Y, Wu G, Wang C, et al. Air pollution, APOE genotype and risk of dementia among individuals with cardiovascular diseases: A population-based longitudinal study. Environ. Pollut. 2024, 347, 123758. doi:10.1016/j.envpol.2024.123758. [Google Scholar]
-
Parra KL, Alexander GE, Raichlen DA, Klimentidis YC, Furlong MA. Exposure to air pollution and risk of incident dementia in the UK Biobank. Environ. Res. 2022, 209, 112895. doi:10.1016/j.envres.2022.112895. [Google Scholar]
-
Wang M, Zhou T, Song Y, Li X, Ma H, Hu Y, et al. Joint exposure to various ambient air pollutants and incident heart failure: A prospective analysis in UK Biobank. Eur. Heart J. 2021, 42, 1582–1591. doi:10.1093/eurheartj/ehaa1031. [Google Scholar]