Under the “Carbon neutrality” and “Carbon peaking” goals, the pressure on the steel industry to reduce carbon emissions is increasing, and it is actively seeking a transition from carbon metallurgy to hydrogen metallurgy [
1,
2]. As an emerging non-blast furnace ironmaking process, the hydrogen-based shaft furnace process has gradually become the focus of the steel industry due to its advantages, such as high hydrogen consumption and low carbon emissions [
3,
4,
5]. In the production process of the shaft furnace, the stable and smooth production of qualified direct reduced iron (DRI) is the key to the hydrogen-based shaft furnace process. However, in actual industrial production, DRI discharged from the shaft furnace sometimes breaks [
6], indicating that during the downward movement of the burden in the shaft furnace, the burden continuously undergoes impacts due to collisions between burden particles and between burden and the furnace wall, eventually exceeding its strength and causing breakage. The broken small particles of burden will fill the pores of the moving bed, reducing the permeability of the bed layer and affecting the distribution of gas flow, which may lead to production problems such as reduced metallization degree, burden blockage, and decreased yield, thereby hindering the stable, high-yield, and smooth operation of the shaft furnace. Moreover, in the subsequent electric arc furnace (EAF) process, broken DRI can cause uneven feed flow and unstable arcs, thereby reducing the overall efficiency of the EAF. The main cause of this phenomenon is the breakage of the burden due to the reduction of its strength during the reduction process.
Previous studies have mainly focused on mechanical property experiments and DEM simulations of unreduced pellets. Barrios et al. [
7] systematically calibrated parameters such as the restitution coefficient, static friction coefficient, and rolling friction coefficient of pellets through single-ball impact tests, friction tests, and rolling angle measurements. The study compared the effects of the single-sphere model and the overlapping sphere model on pellet motion simulation, and the results showed that the overlapping sphere model can more realistically reflect the rolling and collision behaviors of non-spherical particles. In addition, the effectiveness of the parameters was verified through slump tests and tumbling tests. Subsequently, Barrios et al. [
8] conducted single-particle breakage tests, particle bed breakage tests, and DEM breakage simulations on iron ore pellets. The single-particle breakage tests were used to obtain material breakage parameters, and the DEM simulation results showed good agreement with the experiments regarding force-displacement curves and specific breakage energy. Tavares et al. [
9] focused on the body crushing mechanism of pellets under impact.Through drop-weight tests and compression tests, they found that the pellet crushing probability is directly related to the normal component of impact energy, which a gamma distribution can describe, and a significant size effect exists (the larger the particle size, the lower the crushing energy). Meanwhile, it was found that the model parameter γ of different pellet samples varies between 6.9 and 10.5, but does not change significantly with pellet size. The influence of impact angle on crushing was verified, and the energy distribution during the collision process was analyzed by combining DEM simulations. Cavalcanti et al. [
10] developed a pneumatic gun device to simulate high-energy impacts, systematically analyzing the effects of different impact angles (30°–90°) and surface materials (steel, aluminum, rubber) on pellet crushing. The results show that the bulk crushing probability only depends on the normal impact energy. At the same time, the mass loss of surface damage is related to the tangential component of impact energy, and a modified wear model was proposed. Boechat et al. [
11] conducted DEM simulations on the MINIMOD MIDREX shaft furnace using the material breakage parameters of unreduced pellets. The compressive force and collision energy distributions in various regions of the furnace under different production capacities were analyzed. The simulated regions were not based on a complete shaft furnace but divided into four parts for separate simulation. Although the DEM simulations did not include burden breakage and wear, according to the collision energy data obtained from the simulations, the model proposed by Cavalcanti [
12] was used to predict that the fine generation ratio in the reduction zone during normal operation was 3.4%, which could increase to 4.6% when production was increased. Boechat et al. [
13] reduced pellets to different reduction degrees and then carried out experiments such as cold compression strength tests and drop tests. The results showed that with the increase in reduction degree, the cold compression strength decreased significantly, and the mass loss of surface breakage caused by the same impact energy increased. Based on the model in reference [
11] and combined with the fine generation coefficients of pellets with different reduction degrees, the fine generation ratio in the furnace was predicted to be 5.7%. Petit et al. [
14] proposed a numerical simulation method that integrates DEM, CFD, continuum damage mechanics, and particle dynamics theory. This approach first uses DEM to simulate the MINIMOD MIDREX shaft furnace to obtain collision energy data of the burden. Then, the CFD-KTGF model is employed to treat the particle phase as a pseudo-fluid for simulation to reduce computational load. The study investigates the generation of burden fragments during the reduction process and their effects on the velocity and pressure fields of the reducing gas.
Compression tests were performed on industrial pellets and DRI, and fitting equations obtained breakage parameters, providing corresponding parameters for modeling the movement and breakage processes of burdens in hydrogen-based shaft furnaces. Meanwhile, differences between pellets and DRI were compared in aspects such as sample porosity and spatial distribution of pore sizes, to explain the distinctions in breakage properties between pellets and DRI.
3.1. Strength Distribution
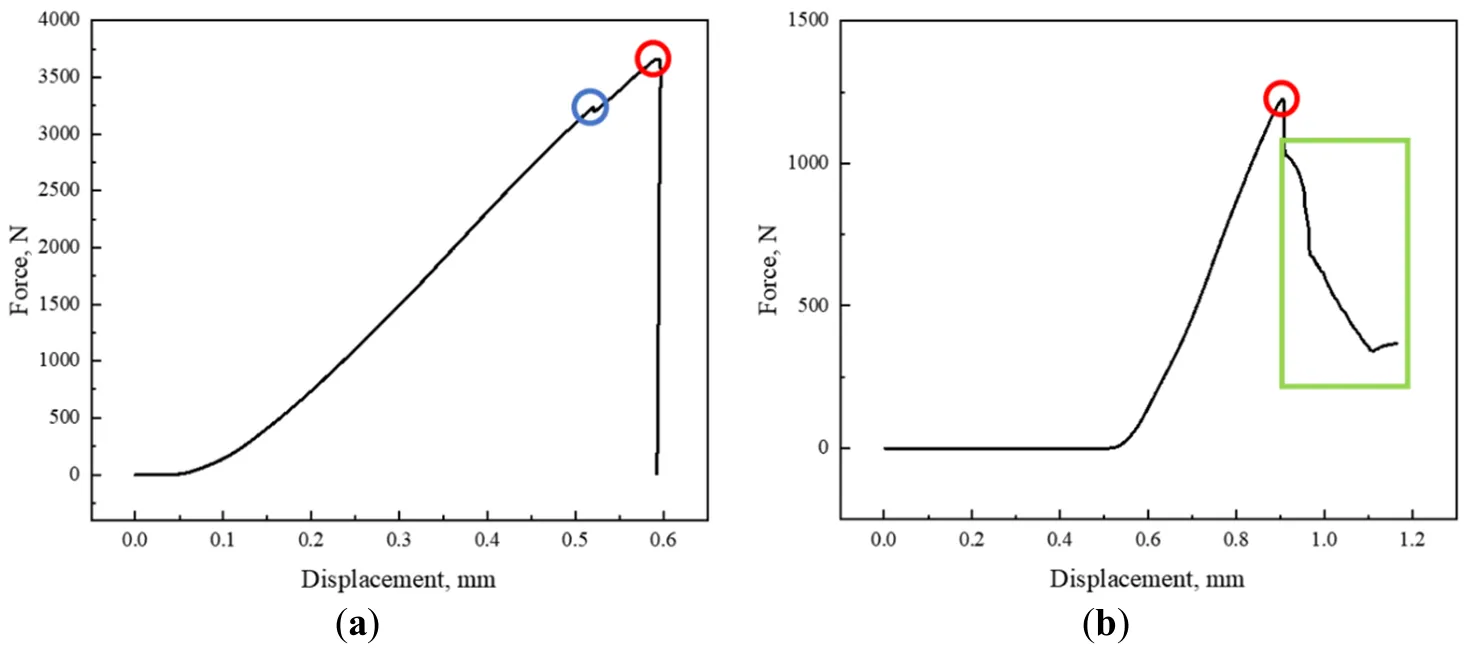
The typical force-displacement curves of pellets and DRI are shown in . a shows that the pellet exhibits a flat region at the initial loading stage, representing a centroid stabilization period with minimal force variation. This stage primarily involves the adjustment of irregular particle positions. Subsequently, it enters the elastic deformation stage, where the experimental device continuously increases the compression on the particle. During this process, the edges and corners at the contact area between the particle surface and the indenter are found to fracture, resulting in local minor breakage, as indicated by the blue circle in a, which corresponds to the local edge peeling stage. As the force continues to increase, when the experimental force reaches its maximum, the particle undergoes complete fracture, which is reflected in the force-displacement curve as a sudden drop in load, as shown by the red circle in a. This stage is the complete fracture period, where the pellet breaks into several small fragments, some of which may even splash out. The compressive strength of the pellet is the maximum force value (
Fc) in the force-displacement curve, and the corresponding displacement (
δc) is the displacement at breakage.
b shows the force-displacement curve of DRI. It can be seen that DRI also exhibits a flat region at the initial loading stage, followed by the elastic deformation stage, and breakage occurs at the position indicated by the red circle. However, the difference between DRI and pellets lies in the area shown by the green box. After DRI breaks, large-volume fragments do not splash but collapse and stack on each other. Therefore, the force shows a fluctuating decline in the green box rather than a sudden drop after breakage.
. Typical force-displacement curves: (<b>a</b>) Pellet, 14–16 mm, 7.0094 g; (<b>b</b>) DRI, 12.5–14 mm, 4.4403 g. (The blue circle indicates that the particles have small local fractures, the red circle indicates that the particles are completely broken, and the green frame indicates that the particles are stacked after they are broken).
Through the force-displacement curve, the specific breakage energy can be calculated. The specific breakage energy (
Es) is the energy required to break a unit mass of the sample (J/kg), as shown in
Equation (1).
where
F represents the load force during uniaxial compression (
N),
δ is the displacement during compression (mm),
δc is the displacement corresponding to DRI breakage, and m is the particle mass (g).
For a finite number of samples, the particle breakage probability can be calculated using the probability estimation factor (
P), as shown in
Equation (2). Here,
N is the total number of experimental samples, and
i is the rank of a specific particle strength in the sequence after arranging the strength data of all specimens in ascending order.
The Lognormal model is employed to fit the data when defining the breakage probability
P(
F) using compressive strength.
when defining the breakage probability
P(
E) using specific breakage energy, the Lognormal model improved by Tavares [
15] is employed to fit the data.
where
σ2 represents the variance,
α is the fitting parameter,
Fc is the compressive strength,
E∗ is an expression related to
E,
E is the specific breakage energy, and
Emax/
αE = 4.
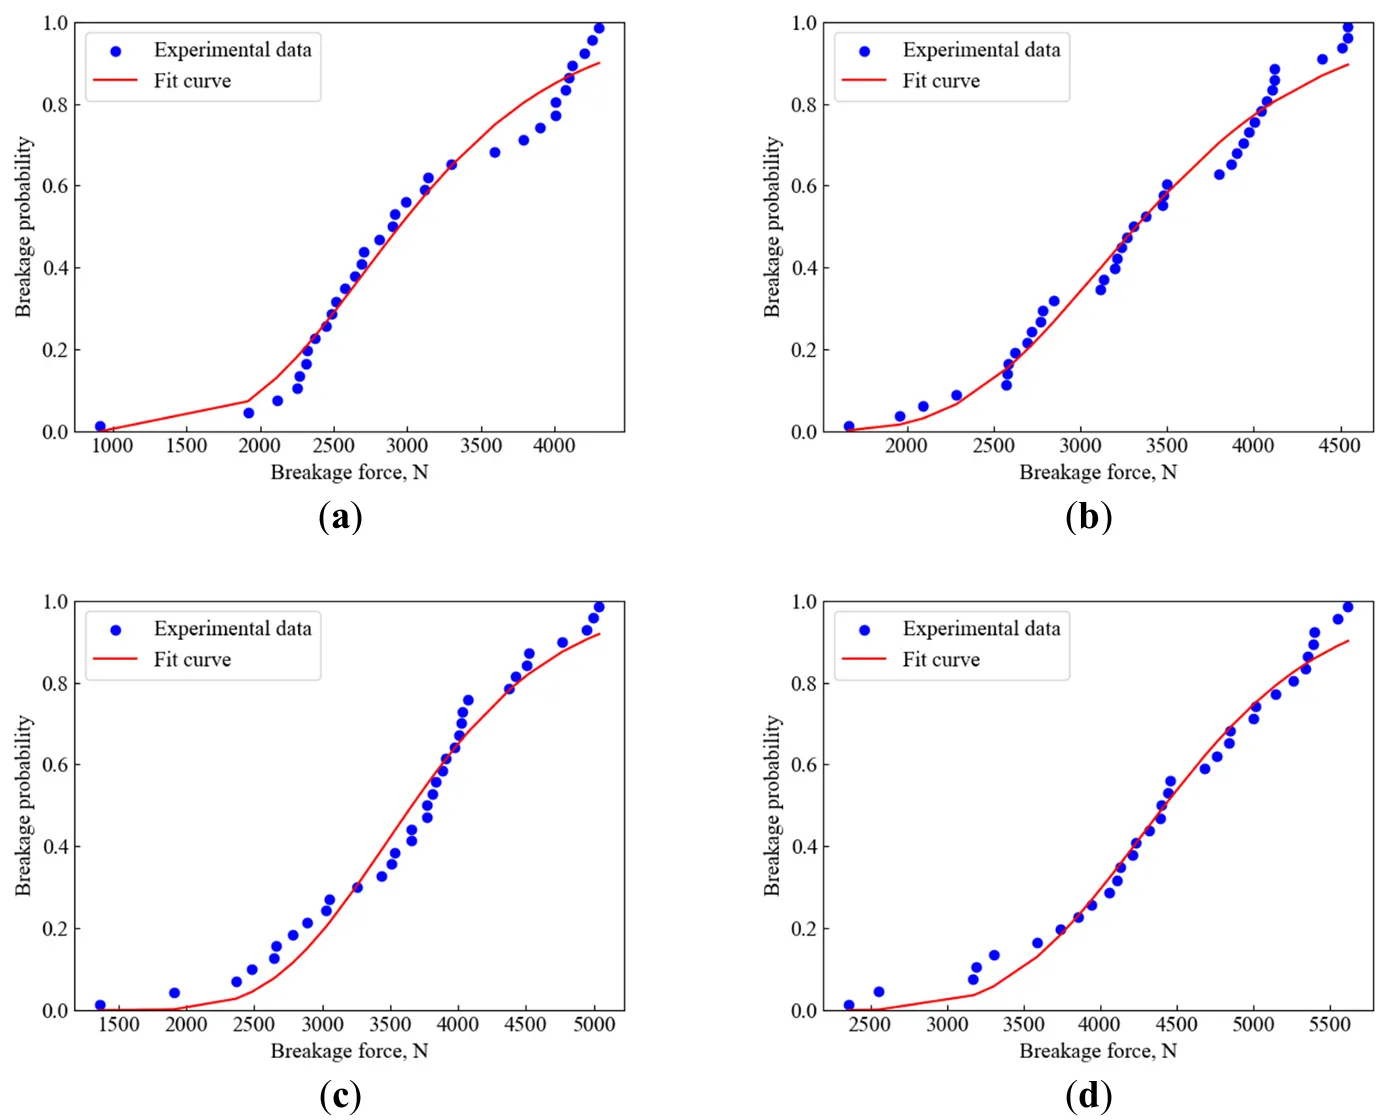
The breakage probability
P(
F) of pellets with different particle sizes and the fitting curves based on compressive strength are shown in
. It can be observed that as the pellet size increases, the compressive strength corresponding to the same breakage probability gradually increases.
. Distribution of breakage probability and compressive strength for pellets with different particle sizes: (<b>a</b>) 10–12.5 mm; (<b>b</b>) 12.5–14 mm; (<b>c</b>) 14–16 mm; (<b>d</b>) 16–20 mm.
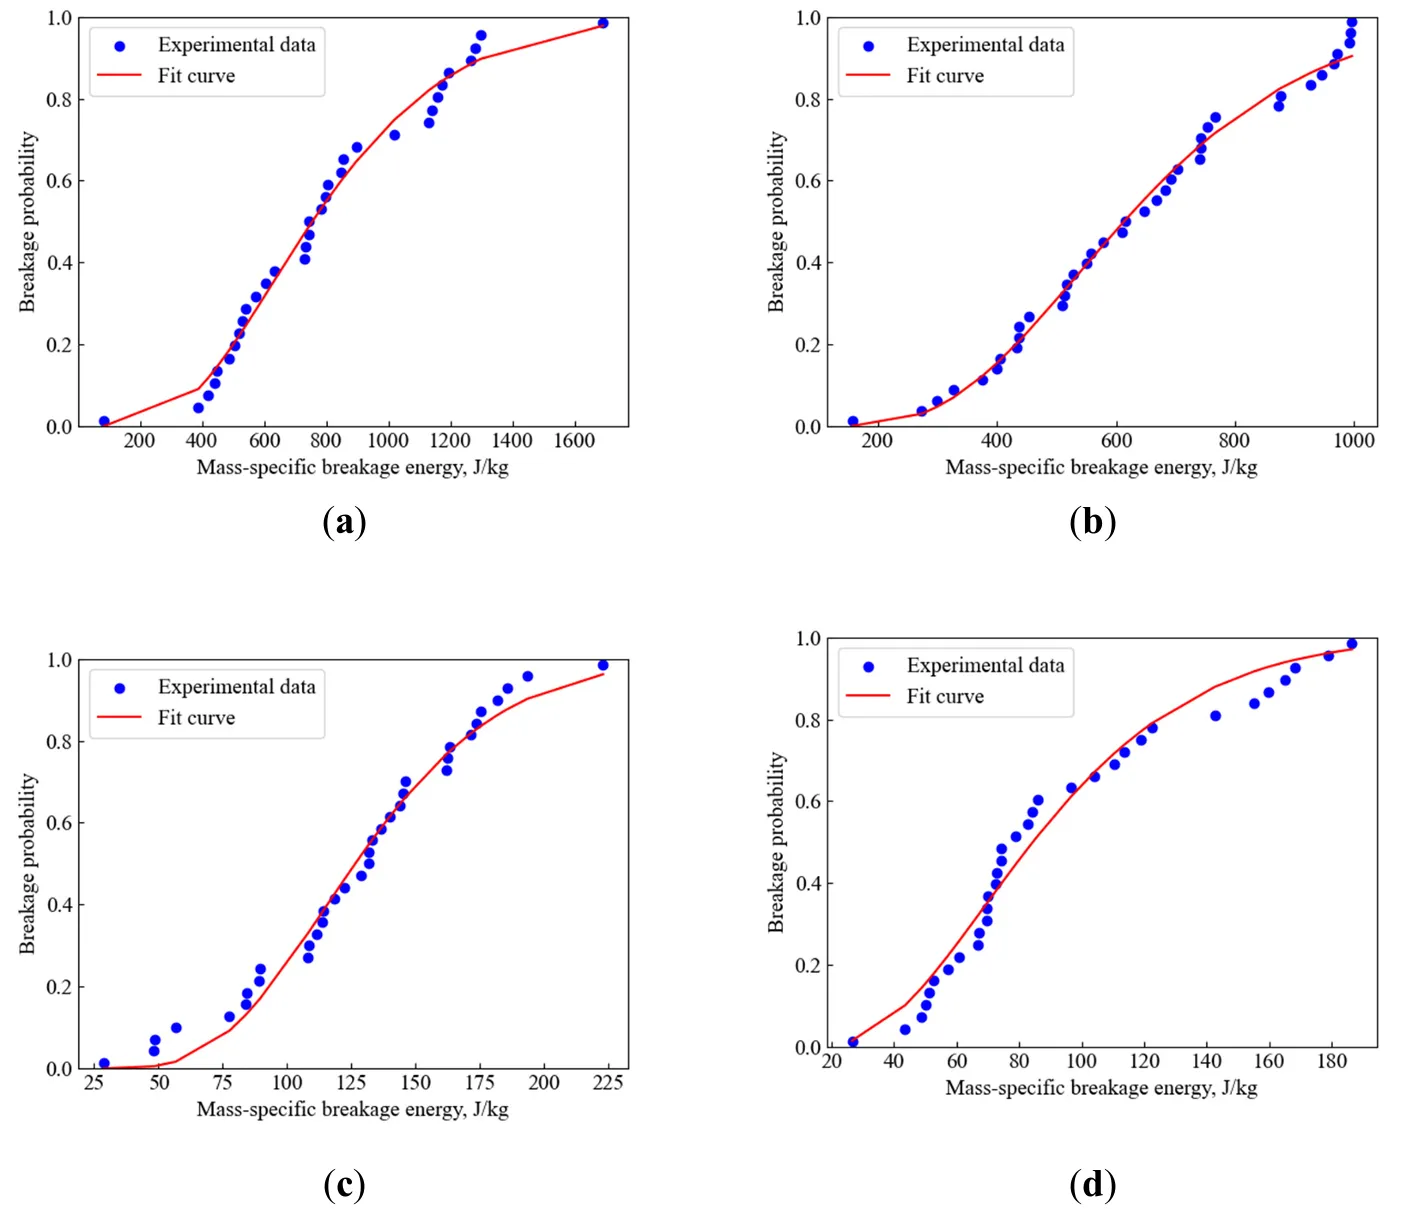
The breakage probability
P(
E) of pellets with different particle sizes and the fitting curves based on specific breakage energy are shown in
. It can be observed that for the same breakage probability, the larger the pellet size, the lower the corresponding specific breakage energy.
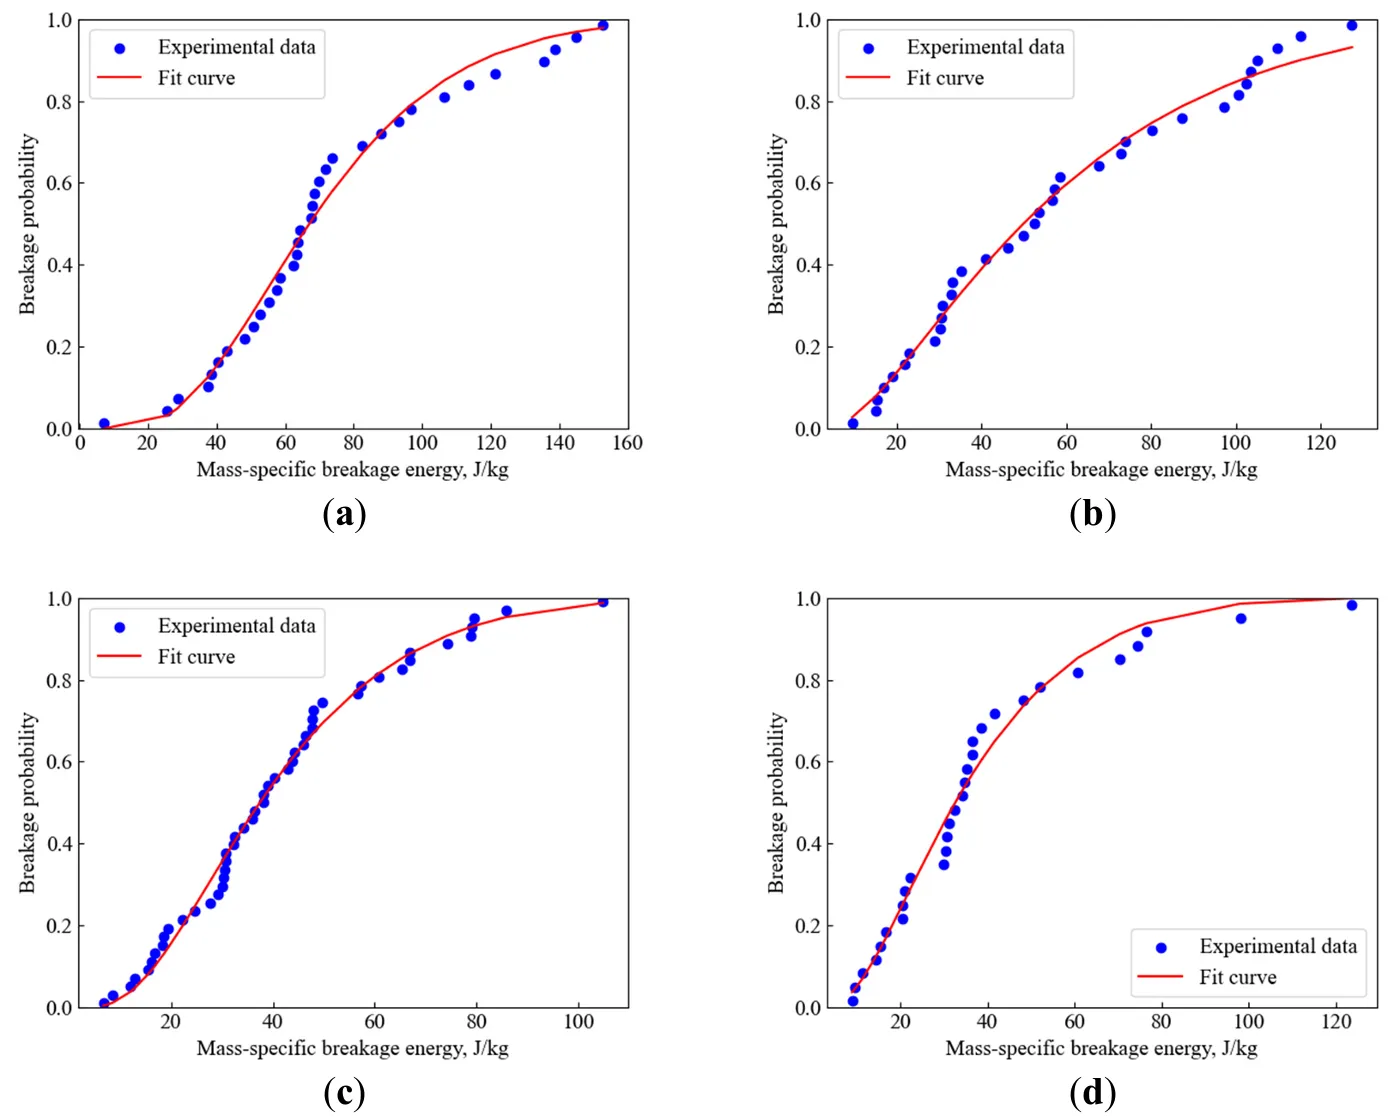
. Distribution of breakage probability and specific breakage energy for pellets with different particle sizes: (<b>a</b>) 10–12.5 mm; (<b>b</b>) 12.5–14 mm; (<b>c</b>) 14–16 mm; (<b>d</b>) 16–20 mm.
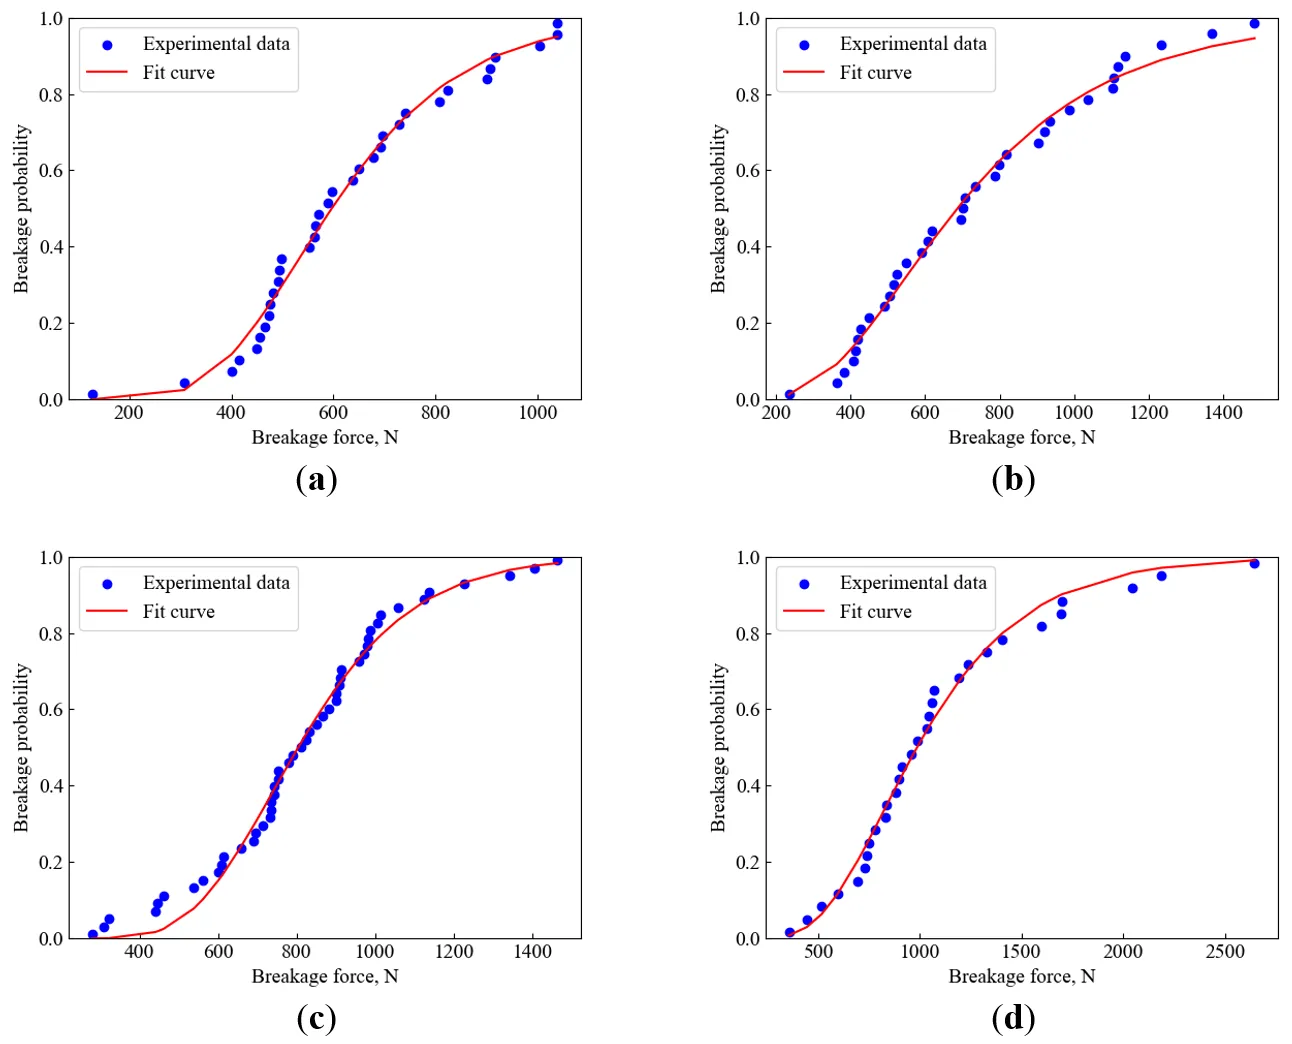
The breakage probability
P(
F) of DRI with different particle sizes and the fitting curves based on compressive strength are shown in
. Similar to pellets, it can be observed that the compressive strength corresponding to the same breakage probability increases with the increase in DRI particle size. Compared with
, under the same particle size and breakage probability, the breaking force of pellets is greater than that of DRI.
. Distribution of breakage probability and compressive strength for DRI with different particle sizes: (<b>a</b>) 8–10 mm; (<b>b</b>) 10–12.5 mm; (<b>c</b>) 12.5–14 mm; (<b>d</b>) 14–16 mm.
The breakage probability
P(
E) of DRI with different particle sizes and the fitting curves based on specific breakage energy are shown in
. Similarly, as the DRI particle size increases, the specific breakage energy corresponding to the same breakage probability decreases. Compared with
, it can be seen that under the same particle size and breakage probability, the specific breakage energy of pellets is higher than that of DRI.
. Distribution of breakage probability and specific breakage energy for DRI with different particle sizes: (<b>a</b>) 8–10 mm; (<b>b</b>) 10–12.5 mm; (<b>c</b>) 12.5–14 mm; (<b>d</b>) 14–16 mm.
shows the average particle size,
αF,
σF,
αE,
σE and
R2 values for pellets of different particle sizes. Where α
F is the fitting parameter for breakage probability
P(
F) using compressive strength, and
σF represents the standard deviation of breakage probability
P(
F) using compressive strength.
αE is the fitting parameter for breakage probability
P(
E) using specific breakage energy, and
σE represents the standard deviation of breakage probability
P(
E) using specific breakage energy.
It can be observed from
that the model function exhibits a good fitting effect.
αF showing a positive correlation with particle size. In contrast,
αE is negatively correlated with particle size, indicating that larger pellets tend to fracture at lower specific energies, as results reported by Tavares (2004) [
16]. Additionally, neither
σF nor
σE demonstrates a significant relationship with pellet size, a finding similar to that in Reference [
17].
.
Summary of breakage characteristic parameters for pellet in four particle size ranges.
| Pellet Size Range, mm |
Average Size, mm |
αF, N |
σF |
R2 |
αE, J/kg |
σE |
R2 |
| 10–12.5 |
11.853 |
2945.41 |
0.297 |
0.975 |
314.47 |
0.586 |
0.987 |
| 12.5–14 |
13.453 |
3322.14 |
0.250 |
0.980 |
219.11 |
0.502 |
0.991 |
| 14–16 |
15.126 |
3662.08 |
0.229 |
0.970 |
158.12 |
0.438 |
0.983 |
| 16–20 |
16.635 |
4422.22 |
0.186 |
0.984 |
105.45 |
0.610 |
0.973 |
shows the average particle size,
αF,
σF,
αE,
σE and
R2 values for DRI with different particle sizes. It can be observed that both the
αF and
αE values of DRI are lower than those of pellets, indicating that DRI is more prone to breakage in the shaft furnace compared to pellets. Similarly, neither
σF nor
σE of DRI exhibits a significant relationship with particle size.
.
Summary of breakage characteristic parameters for DRI in four particle size ranges.
| DRI Size Range, mm |
Average Size, mm |
αF, N |
σF |
R2 |
αE, J/kg |
σE |
R2 |
| 8–10 |
9.580 |
596.62 |
0.337 |
0.986 |
83.83 |
0.599 |
0.985 |
| 10–12.5 |
11.625 |
686.51 |
0.480 |
0.991 |
62.3 |
0.964 |
0.990 |
| 12.5–14 |
13.257 |
803.82 |
0.283 |
0.987 |
46.81 |
0.728 |
0.992 |
| 14–16 |
14.810 |
986.80 |
0.421 |
0.989 |
40.7 |
0.824 |
0.979 |
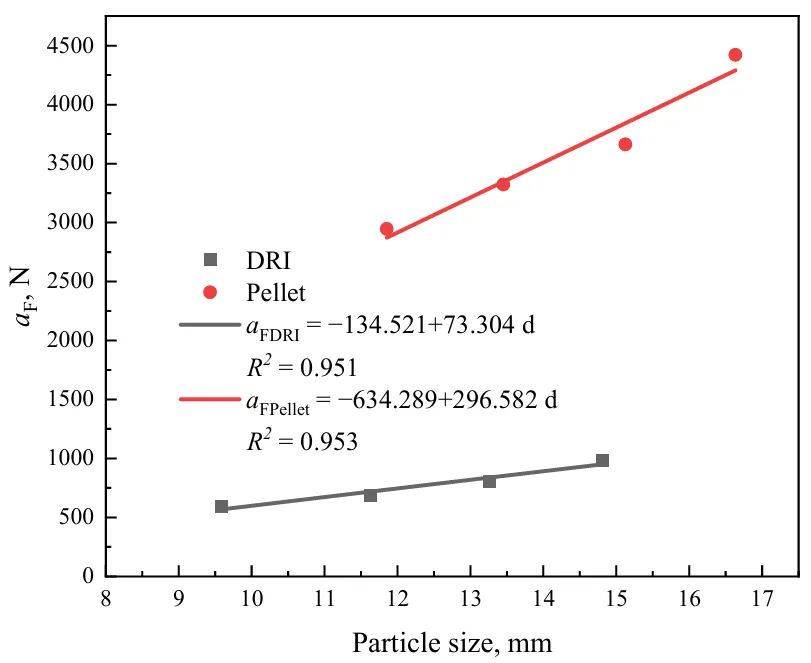
Equation (6) is used to fit the experimental data of pellets and DRI with different sizes in
and
, as shown in
. Among them,
AF (N) and
BF (N/mm) are parameters obtained by fitting the experimental data, and
d (mm) is the average particle size.
It can be observed that compared with DRI, the compressive strength of the pellet increases more rapidly with the increase in particle size.
. Fitting results of <i>α<sub>F</sub></i> and particle size of pellets and DRI.
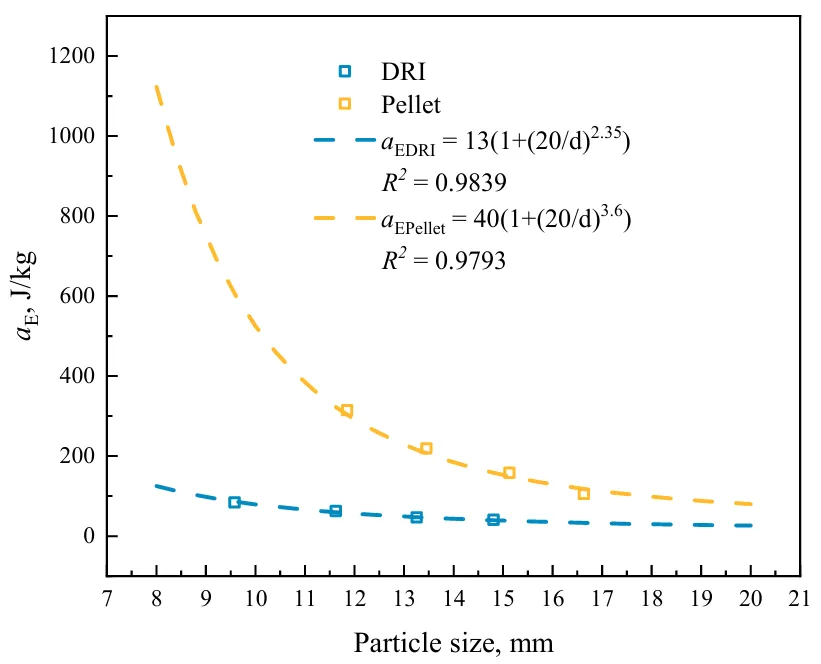
According to
Equation (7) [
16], the
αE corresponding to various particle sizes can be predicted, and the results are shown in
. Among them,
E∞ (J/kg),
d0 (mm), and
φ are parameters obtained by fitting experimental data, and
d is the average particle size.
shows the experimental data and the fitting curves for pellets and DRI in
and
. It can be observed that for both pellets and DRI,
αE decreases with increasing particle diameter, exhibiting a trend opposite to
αF. The reason is that although compressive strength increases with increasing particle diameter, this change is linear, whereas the specific breakage energy of pellets equals breakage energy divided by mass. Mass varies nonlinearly with particle diameter, rising more rapidly, resulting in decreased specific breakage energy with increasing particle diameter. Additionally, it can be noted that at identical particle diameters,
αE of pellets consistently exceed that of DRI, and this disparity progressively widens as particle diameter increases.
. Fitting results of <i>α<sub>E</sub></i> and particle size of pellets and DRI.
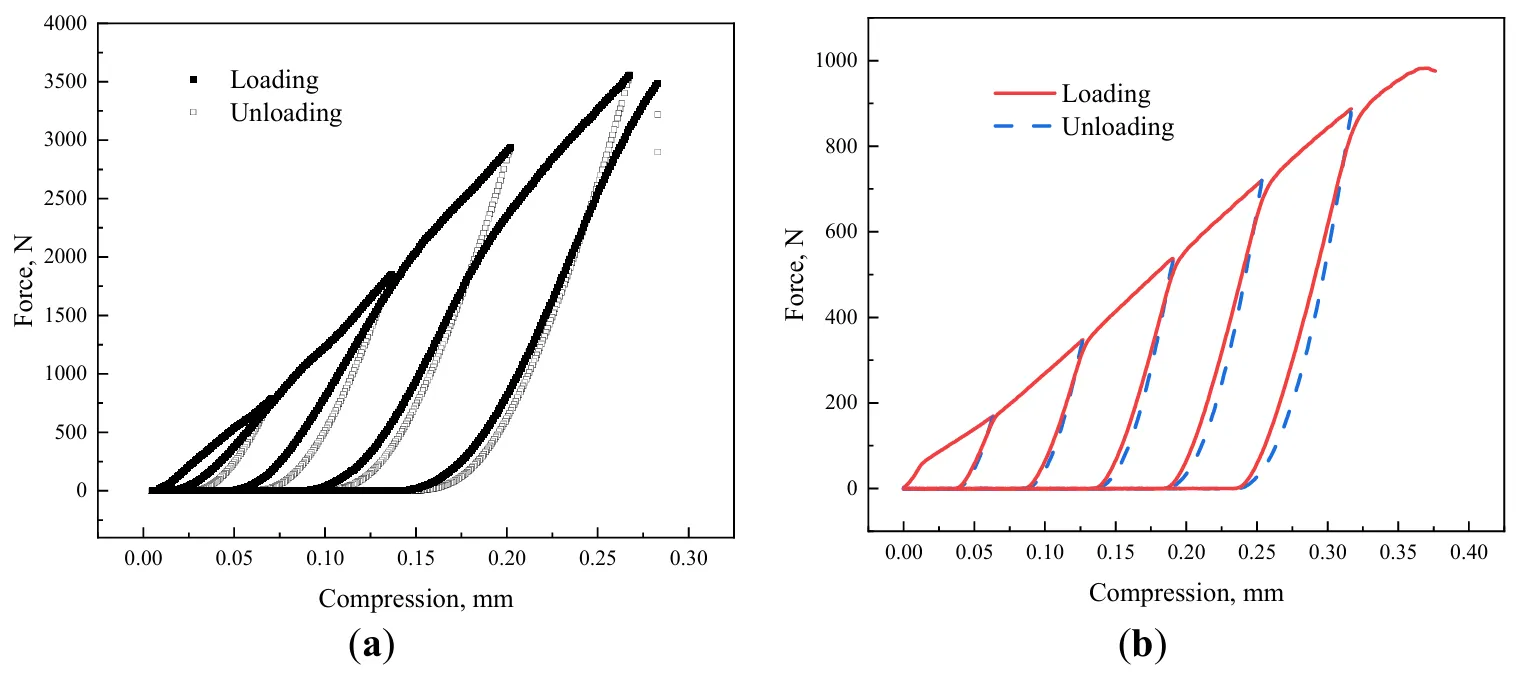
The results of repeated compression tests for pellets and DRI are shown in
. It can be observed that the applied force gradually increases with the number of compression cycles for both materials. In terms of strain during compression, pellets fracture at the 5th compression cycle, while DRI only fractures at the 6th cycle, indicating that DRI can withstand greater compressive strain. However, pellets bear a higher force than DRI at a fixed compressive strain. For example, in the 4th compression cycle, the maximum compressive force of pellets is 3557 N, while that of DRI is only 719 N, suggesting that pellets exhibit smaller strain than DRI under the same applied force.
. Force-displacement curves from repeated compression tests: (<b>a</b>) Pellets; (<b>b</b>) DRI.
Under hydrogen-based shaft furnace conditions, pellets undergo reduction by H
2 and CO, transitioning through the sequence Fe
2O
3→Fe
3O
4→FeO→Fe. Simultaneously, free carbon is generated on the surface of DRI via cracking and carburization reactions of CH
4 and CO. This carbon combines with Fe to further form Fe
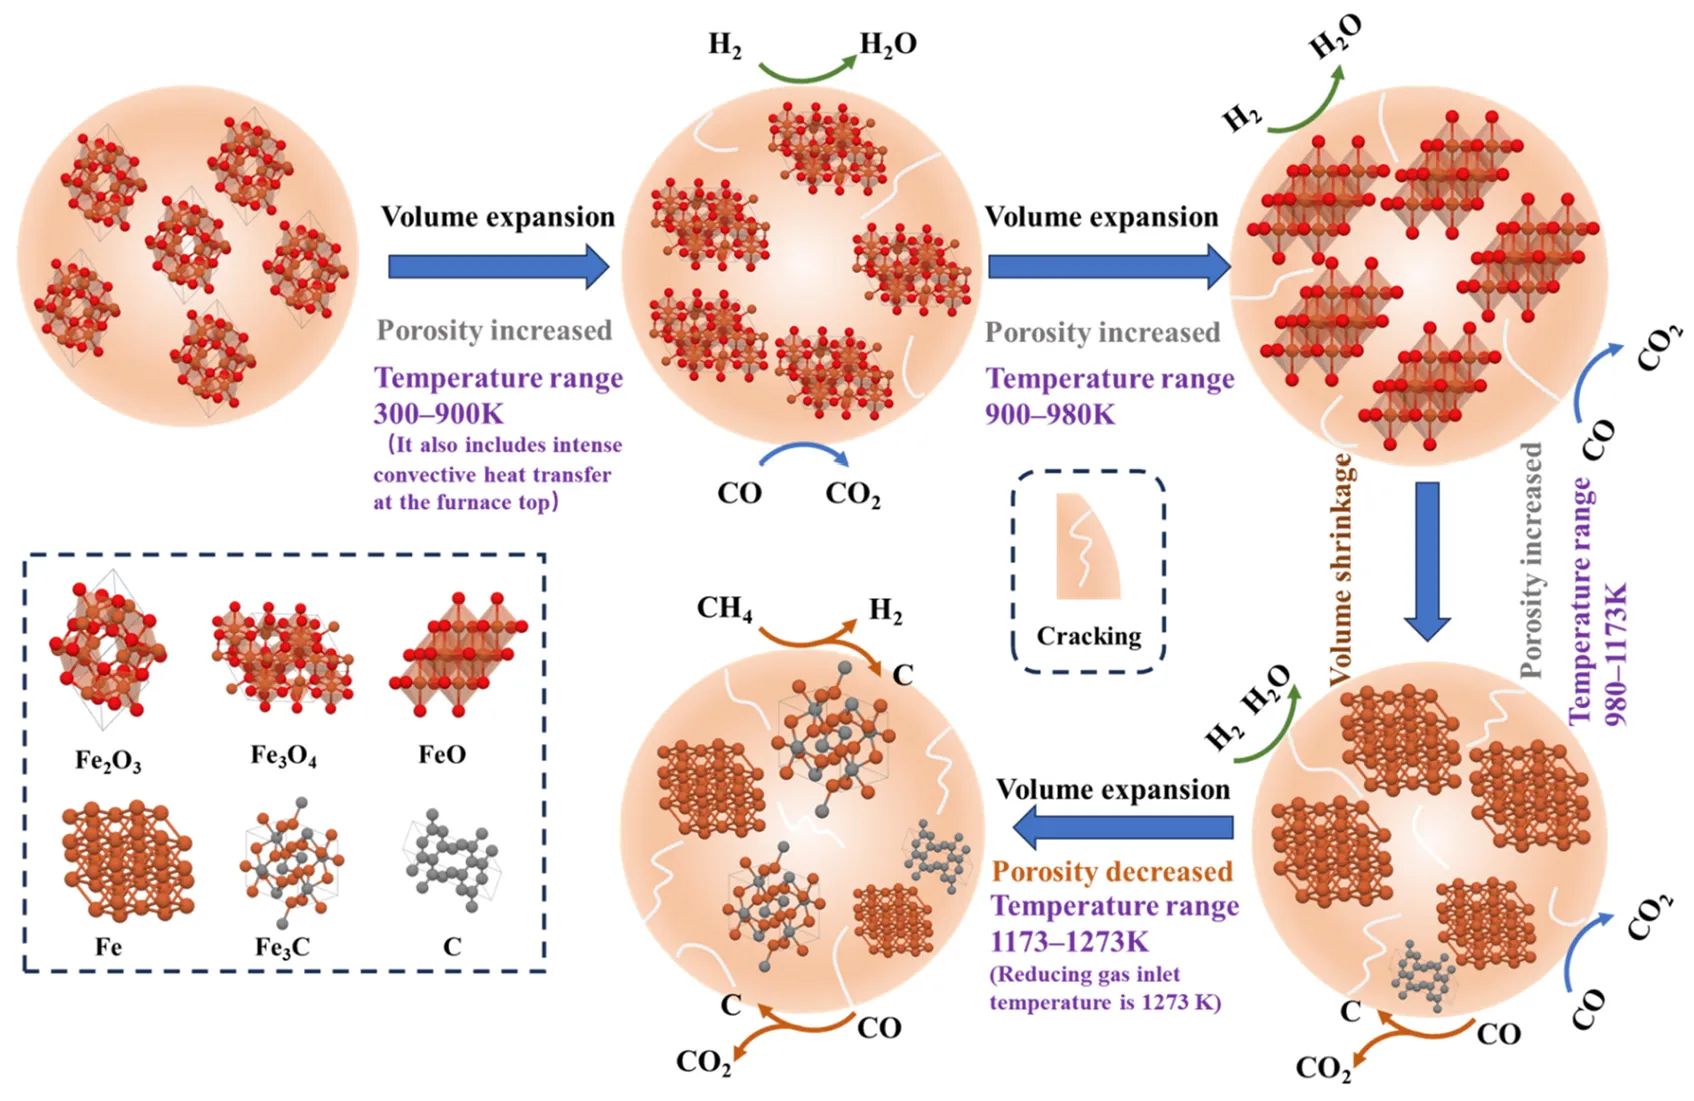
3C. The schematic diagram of the pellet-to-DRI evolution process is shown in
.
. Schematic diagram of pellet transition to DRI under hydrogen-based shaft furnace conditions.
During the reduction from Fe
2O
3 to Fe
3O
4, the crystal structure transforms from a rhombohedral system to an inverse spinel structure of the cubic system. This transition triggers a reduction swelling, manifested as increased volume, higher porosity, and the appearance of cracks on the pellet surface. When further reducing from Fe
3O
4 to FeO, more significant changes in the crystal structure occur, exacerbating reduction swelling and making the cracks on the pellet surface more pronounced. In the process of transforming FeO into Fe, the crystal structure changes from face-centered cubic to body-centered cubic, leading to reduction shrinkage and a decrease in volume. After this stage, most of the O elements in pellets are removed by H
2 and CO. Reduced mass loss of the O element plays a dominant role in pore formation during reduction; therefore, the internal porosity of pellets reaches its maximum at this stage. With the progression of the carburization reaction, on the one hand, part of the carbon exists as free carbon and fills the pores, resulting in a decrease in porosity; on the other hand, another part of the carbon combines with Fe to form Fe
3C. During this process, the crystal structure transforms into an orthorhombic system, causing a slight expansion in the volume of the pellet. It is worth noting that Fe
3C is more brittle than Fe [
18,
19,
20,
21,
22]. The above series of transformations ultimately results in DRI exhibiting different characteristics from pellets. DRI has significantly higher porosity and lower compressive strength than pellets. This makes DRI more prone to breakage when subjected to impacts or collisions. In essence, the transformation of crystal structures and changes in pore structure during the reduction and carburization processes collectively affect the mechanical properties of the material, making the structural stability of DRI inferior to that of pellets and thus more susceptible to damage under external forces.
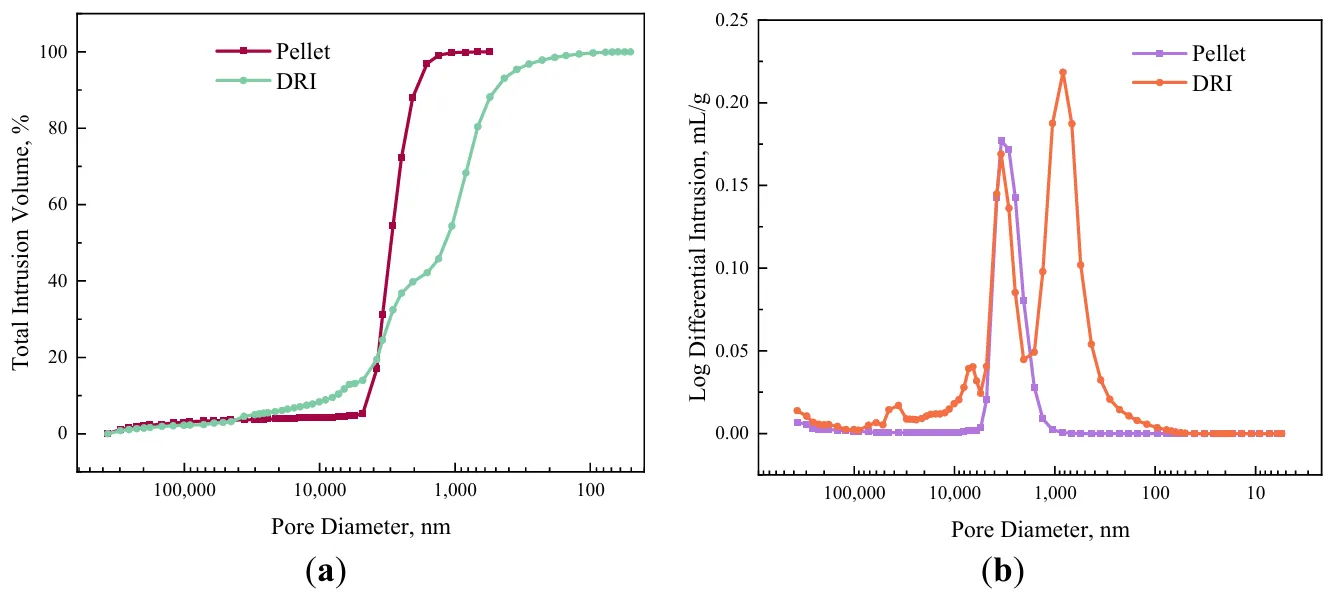
shows the pore size distribution functions and most probable pore sizes of pellets and DRI. As observed from
a, the pore volume of pellets increases sharply in the pore size range of 1600–4800 nm, rising from 5% to 97%, with no significant increase in pore volume for other pore sizes. For DRI, the pore volume gradually increases starting from a pore size of 36,000 nm, featuring a rapid growth zone in the range of 2480–4800 nm (increasing from 14% to 37%), followed by a steep increase from 46% to 95% at pore sizes of 350–1318 nm.
b illustrates the most probable pore sizes: pellets exhibit a single distinct peak at 3428 nm. DRI has two prominent peaks at 3431 nm and 831 nm, indicating smaller pore sizes in DRI compared to pellets. Pellets have uniformly distributed and relatively larger pores, whereas DRI contains micropores and fewer macropores.
. Comparison of pore diameters of pellets and DRI, (<b>a</b>) distribution function of pore diameters; (<b>b</b>) most probable pore diameters.
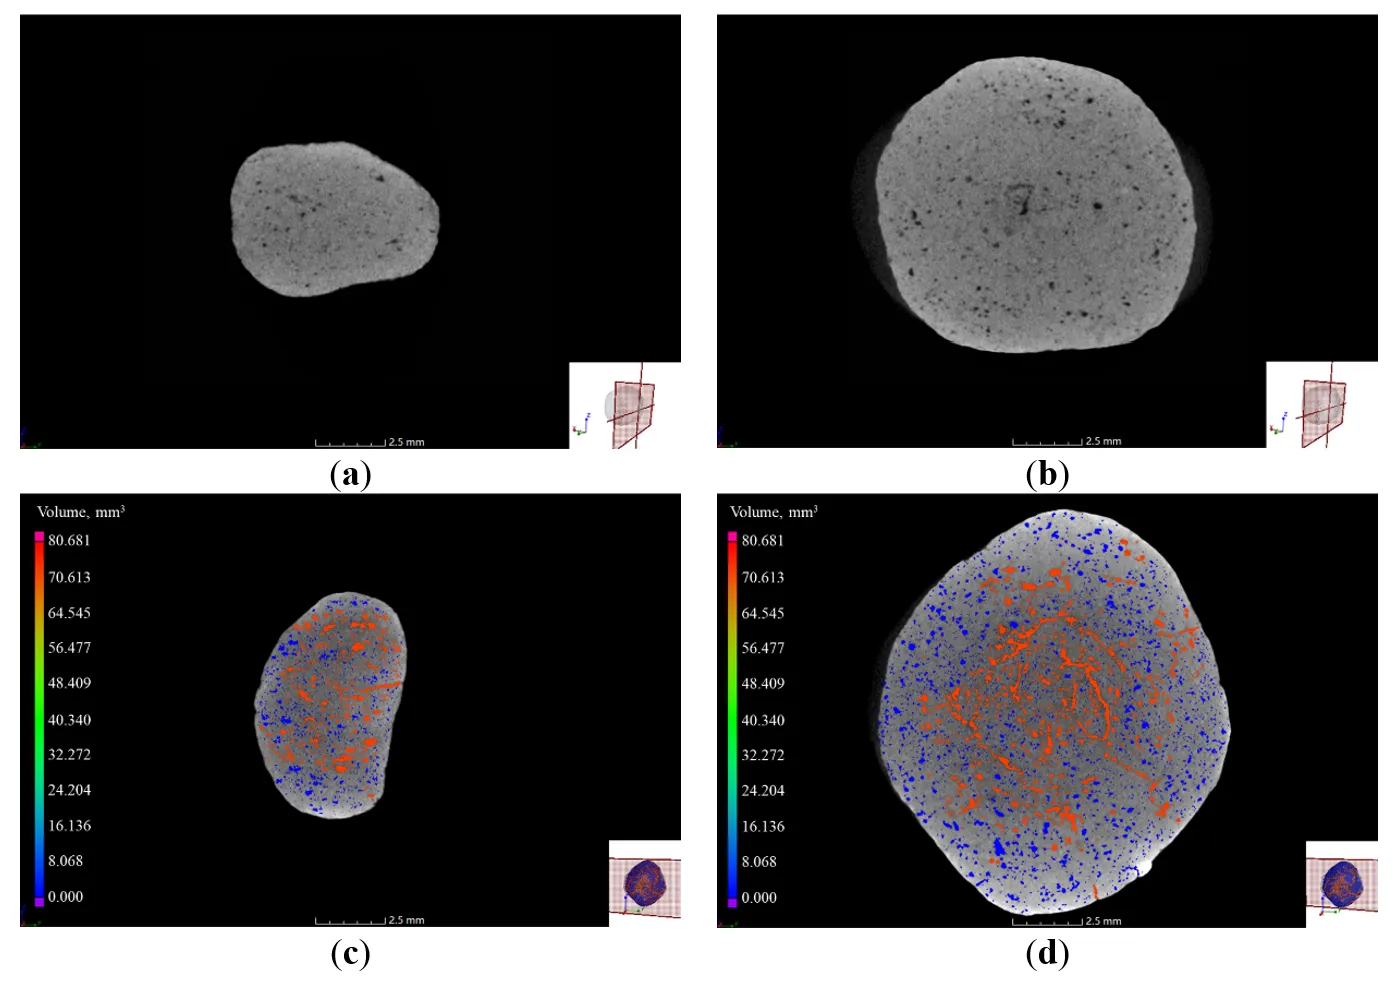
displays the pore distribution of pellets obtained via CT scanning, where
a and b are the original cross-sections of the edge and center, respectively, and
c and d show the pore distributions at the edge and center. The results in
indicate that the pores in both the edge and center cross-sections of the pellets are dominated by macropores, consistent with the findings in
, and the pore distribution is relatively uniform.
. CT scanning results of pellets: (<b>a</b>) Original cross-section of the edge; (<b>b</b>) Original cross-section of the center; (<b>c</b>) Pore distribution at the edge; (<b>d</b>) Pore distribution at the center.
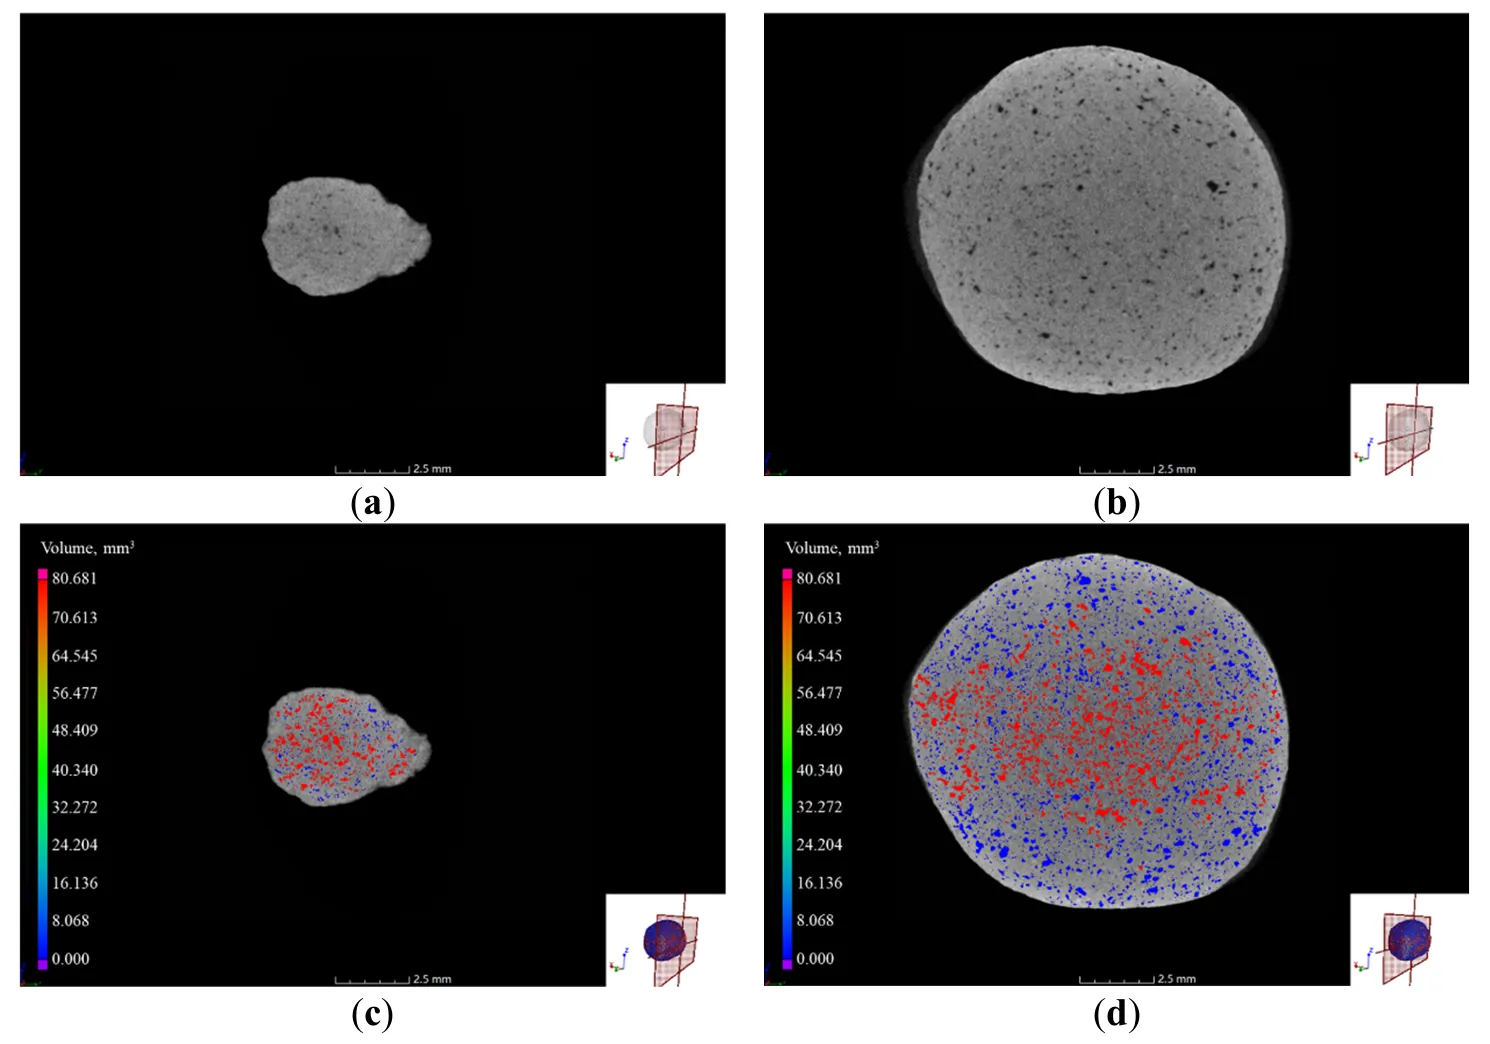
The CT scanning results of the DRI pore distribution are shown in
. The scanning results of DRI indicate that the edge cross-section is mainly composed of large-volume pores, while fine micropores dominate the central cross-section. Although the pore distribution is uneven, a clear comparison between
and
reveal that pores in both the edge and center of DRI are more developed than those in pellets.
. CT scanning results of DRI: (<b>a</b>) Original cross-section of the edge; (<b>b</b>) Original cross-section of the center; (<b>c</b>) Pore distribution at the edge; (<b>d</b>) Pore distribution at the center.
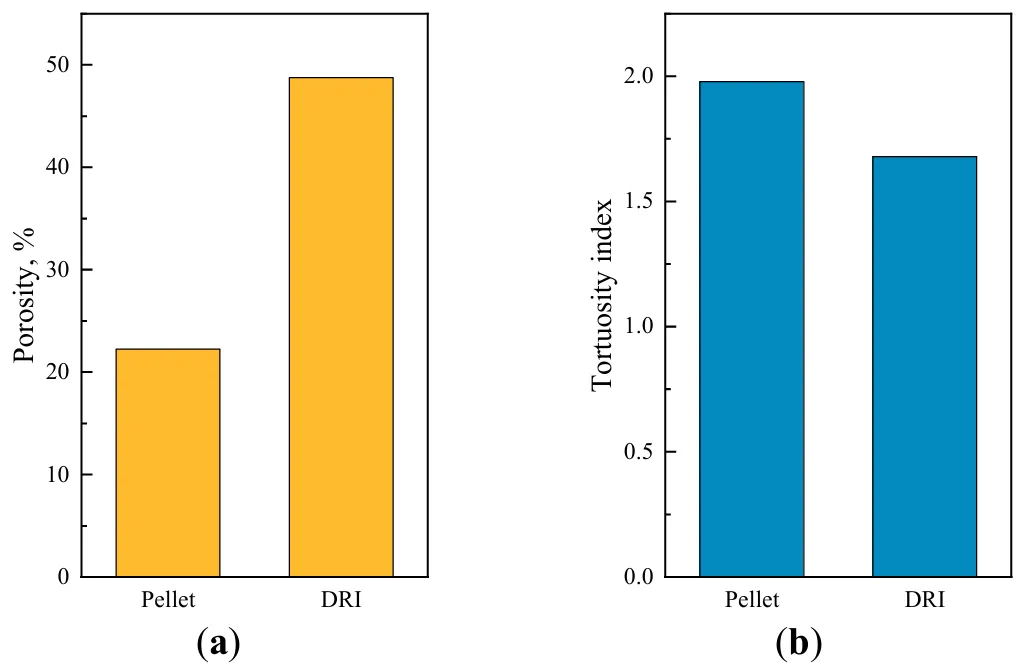
The porosity and tortuosity index (
τ) of pellets and DRI are shown in
, with the calculation method of the tortuosity index described by
Equation (8)–(10). A lower tortuosity index indicates a relatively smoother diffusion path and lower diffusion resistance. A lower tortuosity index allows H
2 to rapidly reach the center of the pellet, accelerating the H
2 reduction reaction process.
Where $$\xi$$ represents the tortuosity, $$\sigma$$ is the constriction factor, and $$\beta$$ is the area ratio.
As shown in
, pellets exhibit a compact structure with low porosity (only 22.3%), which is close to the results reported by Xu et al. (2020) [
23], while DRI has a highly developed porous structure with a much higher porosity of 48.8%, which is close to the results reported by Tavares et al. (2025) [
24]. It can also be observed that the tortuosity index of DRI is lower than that of pellets, indicating that gas diffuses more easily within DRI, which is related to its highly developed pores. Although the porous structure of DRI is beneficial for gas passage, the transformation from the compact structure of pellets to the porous structure of DRI leads to a decrease in strength, specifically manifested as the reduction of
αF and
αE in Section 3.1.
. (<b>a</b>) Comparison of porosity between pellets and DRI; (<b>b</b>) Comparison of tortuosity index between pellets and DRI.
The authors gratefully acknowledge the financial support provided by the National Natural Science Foundation of China (52374319), the Young Elite Scientists Sponsorship Program by CAST (NO. YESS20230029), the National Youth Talent Support Program (GJRC2023008), the National Natural Science Foundation of China (52204335), the National Natural Science Foundation of China (52174291).
Z.L.: Project administration, Funding acquisition, Conceptualization. S.L.: Writing—original draft, Methodology, Formal analysis. Y.W.: Writing—review & editing, Funding acquisition. J.Z.: Supervision, Investigation.
Not applicable.
Not applicable.
Data will be made available on request.
This research was funded by the National Natural Science Foundation of China (52374319), the Young Elite Scientists Sponsorship Program by CAST (NO. YESS20230029), the National Youth Talent Support Program (GJRC2023008), the National Natural Science Foundation of China (52204335), the National Natural Science Foundation of China (52174291).
The authors declare that they have no known competing financial interests or personal relationships that could have appeared to influence the work reported in this paper.