1. Introduction
Species’ conservation status is commonly assessed by the International Union for Conservation of Nature (IUCN), which delineates clear criteria, including factors such as population size, rate of decline, area of occupancy, and extent of occurrence [
1]. However, species populations can behave differently across their distribution range due to various anthropogenic and environmental pressures, which is also considered in the IUCN’s updated criteria [
1]. Natural environments are experiencing rapid changes, primarily due to the pressures of anthropogenic activities (
i.e., global change) [
2]. The list of threats that wild populations face is extensive (
i.e., climate crisis, landscape changes, ocean acidification, deoxygenation, pollution, local extinctions, overharvesting, invasive species, outbreaks of new pathogens,
etc.), urging natural resource stakeholders and managers to locally assess the conservation status of species populations to forecast their long-term survival.
Population genetics can significantly contribute to evaluating a species’ conservation status [
3,
4,
5,
6,
7,
8,
9,
10]. However, although the IUCN [
1] guidelines acknowledge the importance of considering genetic diversity as part of the broader assessment of a species’ viability and adaptability, there are no clear criteria for incorporating genetic factors into conservation status assessments for species populations. The Convention on Biological Diversity (CBD) [
11] has recognized the maintenance of genetic diversity as an important goal in the Global Biodiversity Framework [
12]. The document from the Conference of the Parties (COP15) to the Convention on Biological Diversity highlights the importance of genetic diversity for ecosystem functioning, species adaptation to environmental changes, and the provision of ecosystem services. Nonetheless, it also points out the need to establish frameworks and tools for assessing and monitoring genetic diversity, including the implementation of indicators measuring the genetic health of populations and their capacity to adapt to environmental changes. Indicators developed and adopted as part of the Global Biodiversity Framework (GBF, within CBD 2022) such as the proportion of populations large enough to maintain genetic diversity (
i.e., effective population size,
Ne > 500), and the proportion of populations maintained [
12] reflect different aspects of genetic diversity and can be inferred in the absence of comprehensive genetic data. Thus, these indicators allow large-scale assessments for prioritizing management strategies for species populations [
13]. Still, genetic diversity estimates of species populations can provide detailed information about demographic processes impacting different populations and their degree of genetic flow, which is highly valuable for forecasting their long-term survival [
4,
5,
6,
14]. Thus, the inclusion of genetic diversity estimates could be of high value in informing species extinction risk within conservation assessments at the IUCN. However, there is still controversial evidence regarding the ability of genetic diversity to predict IUCN Red List threat status, along with ongoing debate over which genetic diversity statistics may best inform population extinction risk [
14,
15]. Different species life-history traits, demographic trajectories, and evolutionary histories, combined with the use of different methodologies to obtain population genetic statistics, sampling methods, and the use of small sample sizes providing poor statistical power, can make comparative analyses difficult to interpret, obscuring the importance of considering genetic diversity estimates within conservation assessments.
The neutral theory of molecular evolution states that most genetic variation we can detect in a population across genomes is selectively neutral [
16]. This is because deleterious mutations that deteriorate individual fitness are eliminated from populations by purifying natural selection. In contrast, adaptive mutations will rapidly increase their frequency to reach the whole population through adaptive natural selection. Genetic variation arises from mutations, primarily resulting from DNA replication and repair errors. It is lost at a rate determined by population size through genetic drift (
i.e., random sampling of gametes). Consequently, neutral genetic diversity within a population is expected to exhibit a direct and positive correlation with population census over time [
16]. Thus, under the neutral model of molecular evolution, genetic diversity, known as θ, is directly proportional to the product of effective population size (
Ne) and the mutation rate (
µ) (
i.e., θ ≈ 4
Neµ, [
16]). The simplest statistic to estimate θ, can be defined as the average number of mutations observed in a sample of DNA sequences, known as the Watterson estimator of θ, θ
W [
17,
18], ([
19], equation$$\,$$(25)). However, demographic changes such as population declines can increase the rate of loss of genetic diversity due to genetic drift, which can be detected by examining the frequency of the mutations observed in a population [
20]. To obtain an early diagnosis of a species’ conservation status, Petit-Marty et al. 2021–2022 [
8,
9] suggested using estimates of genetic diversity based on frequency, such as the pairwise differences among all possible pairs of sequences in the sample, known as nucleotide diversity, π, or θ
π [
18], ([
19], equation$$\,$$(26)). Frequency-based estimates of genetic diversity are expected to be more affected by recent changes in population sizes than the average number of mutations, θ
W. This is because low-frequency mutations will be the first to be affected by population changes, decreasing in number when populations decline due to genetic drift or increasing when populations grow by gaining new mutations. Therefore, when populations undergo a bottleneck, the Site Frequency Spectrum (SFS) of the mutations in the population will first be skewed to the right, evidencing the loss of low-frequency variants. However, when the pressures causing the population declines are released (
i.e., overfishing pressures), the population will begin to grow towards reaching the previous state of population equilibrium. Nevertheless, depending on the magnitude of population decline and genetic diversity loss, genetic recovery can take longer than the recovery of abundance [
9]. Population growth will then add new individuals to the populations, increasing the number of observed mutations, producing a skew to the left in the SFS due to the excess of new mutations at low frequency [
20]. Hence, insight into the recent demographic history of the species populations can be obtained by contrasting the observed SFS in the populations with those expected under constant size or other demographic models [
20,
21]. However, when working with single molecular markers, such as the one used in Petit-Marty et al. 2021, 2022 [
8,
9] (
i.e., the Cytochrome Oxidase Subunit I mitochondrial gene, or COI), adaptive natural selection acting on them can also produce deviations in the SFS of the mutations [
22] which can be confounded with changes in population size.
The advent of high-throughput sequencing technologies allows us to study the patterns of genetic variation at the whole-genome level, which are expected to behave mostly neutrally and, therefore, be primarily affected by demography rather than by adaptive natural selection [
16]. These technologies enable the implementation of genomic estimates of genetic diversity within conservation assessments, e.g., [
10]. Nonetheless, data produced by these technologies must be processed and cleaned to eliminate spurious variation produced by sequencing errors. However, this cleaning could bias the estimates of the levels of genetic diversity, potentially obscuring the effects of recent demographic changes [
23,
24,
25]. The most commonly used pipelines to estimate genomic levels of genetic diversity are based on calling SNPs, followed by filtering the called SNPs using different quality scores. These filters usually include a Minor Allele Frequency (MAF) cut-off, frequently at 5% for marine fish species (see examples in [
26,
27,
28,
29,
30,
31,
32,
33,
34]). Consequently, low-frequency mutations, which are informative of recent demographic events, are excluded from genetic diversity analyses, thereby reducing the power of these statistics to inform on recent changes in population size. Additionally, when SNPs derived from reduced representation sequencing methods, such as Restriction-site-Associated DNA sequencing (RAD-seq), are analyzed, it is common practice to allow missing data to increase the power of SNP detection [
35,
36]. Nevertheless, to make genetic diversity estimates comparable among genomic regions and/or species populations, these need to be averaged by the total number of analyzed genomic sites (
i.e., θ by site, [
18]). Thus, accurate genetic diversity estimates require precise estimates of the number of invariant sites, which depend on the quality of alignments [
23,
24,
25,
35]. Thus, the number of invariant genomic positions analyzed should be adjusted when considering missing data, which is difficult after SNPs are called, leading to an overestimation of genetic diversity levels [
23,
24,
25]. Therefore, filtering SNPs by MAF and allowing missing data without adjusting the number of invariant genomic positions could produce biased and non-informative genome-wide estimates of genetic diversity. It could be especially relevant for abundant species like exploited fish, where low-frequency mutations could provide valuable information on recent demographic changes in population sizes. Alternatively, the use of a genotype-likelihood-based approach [
19,
35] allows for the estimation of the whole Site Frequency Spectrum (SFS), which includes all genomic positions with available information (
i.e., SNPs and invariant genomic positions) for any considered cut-off of missing values. This approach potentially yields more accurate estimates of genetic diversity and neutrality deviations. RAD-seq data are a valuable source of population genomic information for non-model species without reference genomes, and they are widely used for evaluating genetic differentiation and connectivity in fish stocks e.g., [
26,
27,
28,
29,
30,
31,
32,
33,
34]. Therefore, taking full advantage of this technique to estimate informative population genetics statistics of population conservation status seems essential. A full folded SFS can be computed using RAD-seq data by employing the assembled RAD-locus as a reference (
i.e., using Stacks v2 software [
36]) and then processing alignments using either SNP-calling or genotype-likelihood approaches to estimate genetic diversity and neutrality deviation statistics.
In this study, I re-analyse RAD-seq data from a population of an abundant species of high economic importance, the European hake (
Merluccius merluccius), obtained by [
26] to estimate θ
π, the SFS of mutations, and Tajima’s D statistic by using two different approaches: (1) the commonly used SNP-calling-based approach, and (2) the genotype likelihood-based approach. This species population belong to the Southern European hake fishery, which has documented declines in abundance due to fishing activities [
37]. Additionally, a 43-fold decrease in the effective population size (
Ne), along with a loss of allele richness, has been detected in the last decades of the 20th century for this fishery through the analysis of mitochondrial and microsatellite genetic markers from various historical samples collected between 1975 and 2014 [
37,
38]. Using coalescent simulations, Petit-Marty et al. [
8] demonstrate that declines of more than 70% in effective population size would significantly reduce the levels of nucleotide diversity in the populations (θ
π, 18). Thus, the enormous magnitude of the decline in
Ne found for this population should be detectable using traditional population genetics methods.
2. Methods
Data from Restriction-site-Associated DNA sequencing (RAD-seq) of a European hake population from the Southern Atlantic stock [
26] were downloaded from NCBI (N = 60; PRJNA556115 GAV and GAI individuals). Leone et al. [
26] analyzed samples collected in Galician waters during summer (GAV) and winter (GAI) to check for genetic differences between seasons. They did not find any genetic differentiation between the seasons; therefore, in this study, samples from summer and winter were grouped to increase the sample size. Briefly, RAD-seq data were produced by [
26] following [
39] digesting DNA from each sample using the SbfI restriction enzyme and then ligating it to Illumina adapters containing 5 bp sample-specific barcodes and library adapters. Genomic libraries were amplified, and pools were paired-end sequenced (100 bp) on an Illumina HiSeq2000. The European hake genome was downloaded from NCBI (Accession: GCA_964260605.1). Fastq files from the RAD-seq data were aligned to the genome using bwa-mem2 [
40] with default parameters. Genomic alignments were converted to BAM format, indexed, and sorted using samtools 1.2 [
41].
Two different approaches were used to obtain nucleotide diversity, and Tajima’s D neutrality index, and deviations from expected constant population sizes were tested by a third method using coalescent simulations:
1. Genotype likelihood-based approach: To estimate the folded Site Frequency Spectrum (SFS), BAM files were analyzed using ANGSD version 0.940 [
35] with the following commands: -doSaf 1 -minMapQ 30 -minQ 20 -GL 1, using identical ancestral (-anc) and reference genome (-ref) parameters, and -minInd X, where X was 60 (
i.e., no missing data) or 30 (
i.e., 50% missing data). The folded SFS was obtained using the realSFS script of ANGSD with the commands -fold 1 -maxIter 100. Genetic diversity, estimated as the average pairwise differences in the number of mutations within a population (θ
π, [
18,
19]) and Tajima’s D statistic [
20], were derived from the analysis of the SFS using the realSFS saf2theta and thetaStat do_stat scripts for genomic windows of 50 Kbp and a step of 10 Kbp (-win 50,000 -step 10,000). Nucleotide diversity estimates (θ
π) by site were calculated by dividing the number of pairwise differences in the number of mutations by the total number of analyzed genomic positions in the sample.
2. SNP-calling-based approach: SNP calling was performed with bcftools v.1.22 mpileup and bcftools call, and filtered for quality control using vcftools v0.1.17 [
41] with the following parameters: --minQ 20 --minDP 10 --remove-indels --max_missing X and --maf Y, where X was 1 (
i.e., no missing data) or 0.5 (
i.e., 50% missing data) and Y was 0.008 (
i.e., the minimum MAF of the sample) or 0.05. Nucleotide diversity estimates (θ
π) in sliding windows of 50 Kbp and a step of 10 Kbp were obtained using vcftools with the command --window-pi-step, and Tajima’s D was calculated in bins of 50 Kbp with the command --TajimaD. Folded SFS were generated using the command --freq in vcftools, then clustering Minor Allele Frequencies into frequency categories.
3. Neutral Expectations: To assess the accuracy of the methods for detecting changes in population size, 100 neutral site frequency spectra (SFS) from a population with a constant size over time were generated using the ms software (version 14/10/2007) [
21], which employs coalescent theory to simulate the genealogical history of a sample of alleles from a population, considering various demographic parameters such as population size and mutation rates. The parameters used in the simulations were based on the average number of mutations in 1000 bp (θ) found by analysing the RAD-seq data using the two methods and SNP filtering described in points 1 and 2, where θ is defined as (4
Neμ), with
μ representing the mutation rate and
Ne being the effective population size. The commands used were: ms 120 100 -t θ, with θ taking values of 37 for the genotype likelihood-based approach with no missing values and 49 with 50% missing values. For the SNP-calling-based approach without filtering by Minor Allele Frequency (
i.e., MAF1), θ was 31 when missing data were not allowed and 28 when 50% of missing data were permitted. Finally, for the results produced with the dataset filtered by MAF 0.05, θ was 15 and 13 for no missing values and 50% missing values, respectively. Output files from MS were processed with ANGSD software (version 0.940) in the same way as for analysing the real population data, yielding the SFSs, genetic diversity, and Tajima’s D estimates expected for a neutrally evolving population with a constant population size over time.
All statistical analyses were performed in R v4.4 [
42].
3. Results
Four statistics were compared among approaches and datasets: (1) the percentage of detected SNPs, (2) nucleotide diversity, θ
π [
18], (3) the Tajimas’ D neutrality index [
20], and (4) the percentage of SNPs with frequencies below 10% (
).
Compared to conventional SNP-calling methods, the genotype-likelihoods-based approach demonstrates a higher power to detect SNPs (
). Estimates of nucleotide diversity (θ
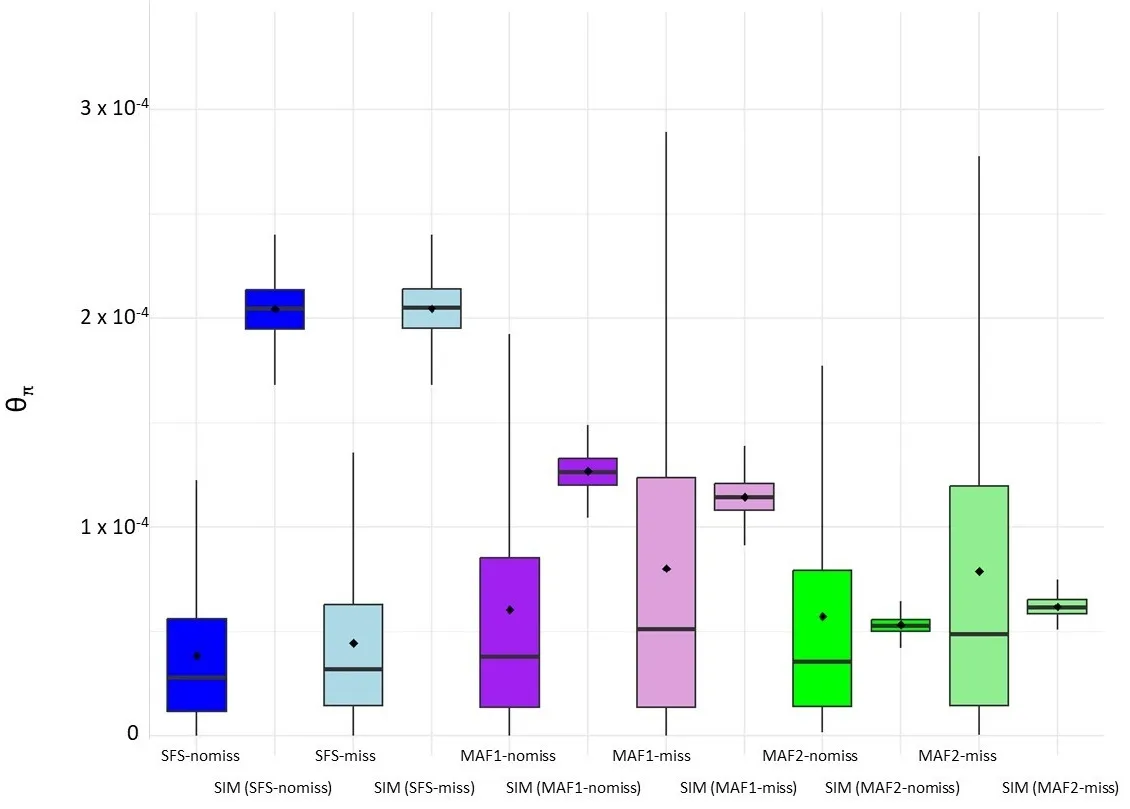
π) from the genotype-likelihoods-based approach show no significant differences among datasets regarding the allowance of missing data. In contrast, differences in θ
π estimates were found when comparing datasets that allowed or did not allow missing data when estimated by the SNP-calling-based approach (
). When using the SNP-calling-based approach, θ
π values are overestimated when considering missing values compared to the estimates when no missing data are allowed.
All θ
π estimates obtained from analysing the different datasets were significantly different from those expected under a constant population size (Asymptotic Wilcoxon-Mann-Whitney Test
p-value < 2.2 × 10
−16), except for the dataset with 50% missing values and a MAF > 5% (dataset MAF2_miss), where the results were not significantly different (
).
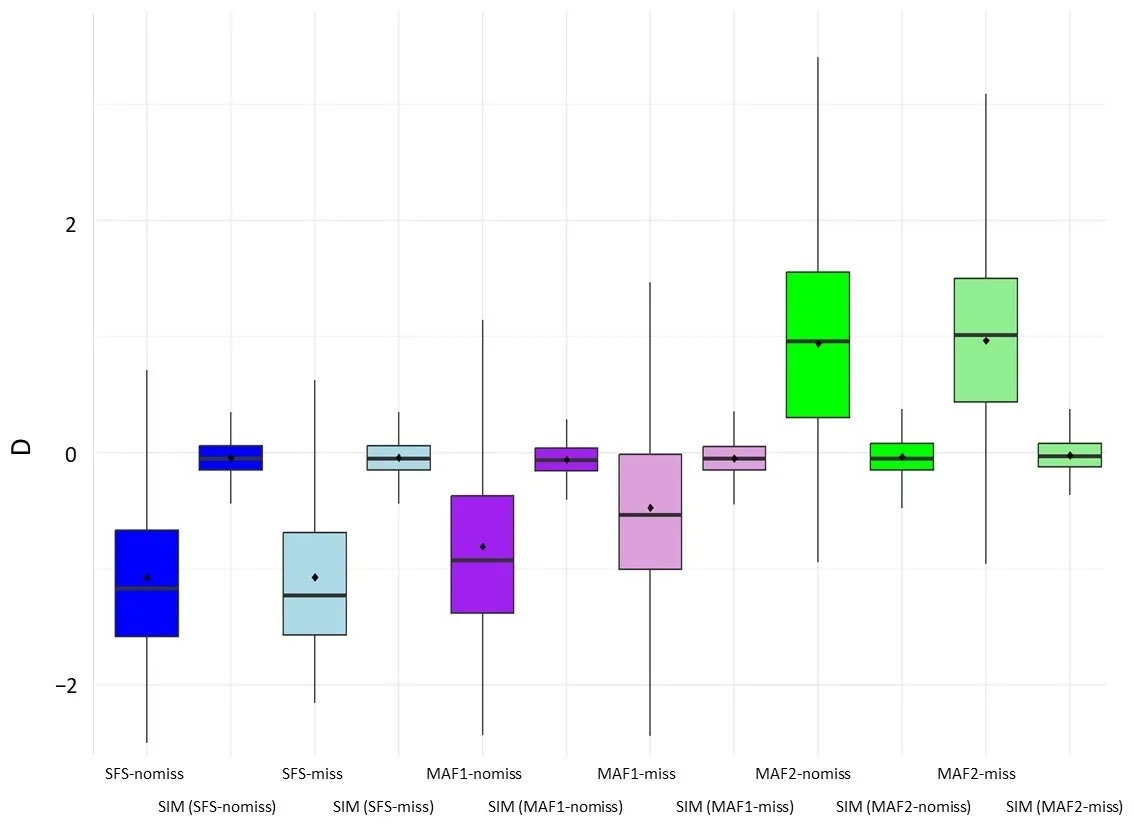
Tajima’s D statistic measures the differences between two estimators of genetic diversity, θ
W and θ
π [
20], which are expected to be not significantly different from 0 for constant population sizes. For the SNP-calling-based approach, neutral deviations measured by Tajima’s D were significantly different among MAF datasets (Asymptotic Wilcoxon-Mann-Whitney Test
p-value < 2.2 × 10
−16), with a strong deviation towards positive values in datasets filtered by MAF > 5% (
). Moreover, differences in estimated Tajima’s D were also found when comparing the dataset without MAF filtering, with or without missing data, showing increased D values in the dataset that included missing data. In contrast, for the genotype-likelihood-based approach, considering missing data does not significantly affect Tajima’s D statistic (
).
When θ
π and D estimates are contrasted with the expectations of a constant population size with identical current effective sizes (see methods) for each dataset (
and
), genotype-likelihood-based estimates of θ
π and Tajima’s D were significantly decreased according to the expectations based on historical abundance estimates (
i.e., the population experienced a bottleneck). Only the dataset produced by the SNP-calling approach without filtering by MAF and without missing data shows the same significant tendency (
i.e., MAF1_nomiss,
and
). Adding a MAF > 5% filter produces significantly higher Tajima’s D than expected for a constant size (
).
.
Basic statistics were obtained for each approach, as well as SNP filtering. Datasets: MAF1 indicates no MAF filtering, and MAF2 filtering by MAF > 5%; nomiss indicates that missing data was not included, and miss indicates that 50% of missing data was allowed in the SNP discovering.
| Approach |
Dataset |
Nº of Detected SNPs |
% SNPs 1 |
% SNPs MAF < 0.10
(Expected = 58% 2) |
θπ |
Tajima’s D (Expected 2) |
| SNP-Calling-based |
MAF1-nomiss |
201,938 |
3% |
72 |
6.7 × 10⁻⁵ |
−0.80 (−0.040) |
| MAF1-miss |
547,673 |
3% |
65 |
1.3 × 10⁻⁴ |
−0.47 (0.002) |
| MAF2-nomiss |
86,859 |
1% |
34 |
6.2 × 10⁻⁵ |
0.95 (−0.035) |
| MAF2-miss |
299,745 |
2% |
36 |
1.2 × 10⁻⁴ |
0.97 (−0.035) |
| genotype-likelihood-based |
SFS-nomiss |
248,100 |
4% |
74 |
4.8 × 10⁻⁵ |
−1.07 (−0.040) |
| SFS-miss |
1,008,442 |
5% |
73 |
3.9 × 10⁻⁵ |
−1.16 (−0.041) |
. Average pairwise nucleotide differences (θ<sub>π</sub>) estimated for each dataset in sliding windows analyses across the genome (window size 50 Kbp, step 10 Kbp). Datasets: SFS shows results obtained by the genotype-likelihood-based approach, MAF shows results obtained by the SNP-calling-based approach, and SIM means simulated datasets under constant population sizes (see methods). MAF1 indicate no MAF filtering, and MAF2 filtering by MAF > 5%; nomiss indicates that missing data was not included in the analyses, and miss indicates that 50% of missing data was allowed in the SNP discovering.
. Average Tajima’s D estimated for each dataset across the genome in windows of 50 Kbp. Datasets: SFS shows results obtained by the Genotype-likelihood-based approach, MAF shows results obtained by the SNP-calling-based approach, and SIM means simulated datasets under constant population sizes (see methods). MAF1 indicate no MAF filtering, and MAF2 filtering by MAF > 5%; nomiss indicates that missing data was not included in the analysis, and miss indicates that 50% of missing data was allowed in the SNP discovering. The composite parameter theta = <em>N<sub>e</sub>µ</em> in 1000 bp used in simulations was estimated to be 37 for the SFS-based approach when no missing values and 49 when 50% of missing genomic positions were allowed. For the SNP-calling-based approach without filtering by Minor Allele Frequency (<em>i.e.</em>, MAF1), theta was 31 when missing values were not allowed and 28 when 50% of missing data were allowed. Finally, for the results produced with the dataset filtered by MAF > 5%, theta was 15 and 13 for no missing and 50% of missing values, respectively.
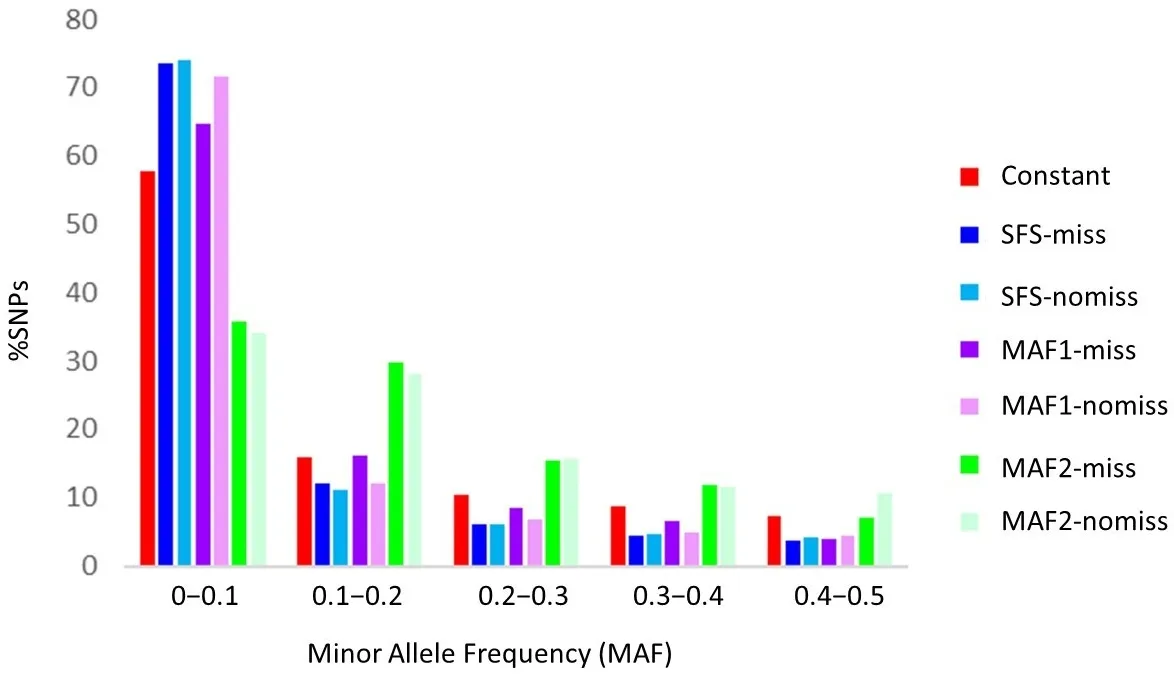
shows the differences in the Site Frequency Spectrum among methods and filtering, compared to the neutral expectations for constant effective population sizes. It can be observed that a significant excess of low-frequency SNPs can be detected by examining the SFS when no MAF filtering is performed. In contrast, filtering by MAF > 5% resulted in all but the first frequency category presenting overestimates of the proportion of SNPs, completely altering the SFS and the probable interpretation of the results. Differences in the number of SNPs expected at frequencies lower than 10% are significantly higher for the genotype-likelihood-based approach and the SNP-calling approach without MAF filtering. They are significantly lower for the SNP-calling approach with MAF filtering > 5% (2-sample test for equality of proportions with continuity correction,
p-value < 2.2 × 10
−16).
. Site Frequency Spectrum (SFS) of the mutations among the analyzed datasets. Red: expectations from a neutral model of constant population size. Blue, (SFS-miss): Genotype-likelihood-based methods with 50% missing data. Light blue (SFS-nomiss): Genotype-likelihood-based methods with no missing data. Purple (MAF1-miss): SNP-calling-based methods with no MAF filtering and 50% missing data. Light purple (MAF1-nomiss) SNP-calling-based methods have no MAF filtering and missing data. Green (MAF2-miss): SNP-calling-based methods with MAF > 5% and 50% of missing data. Light green (MAF2-nomiss): SNP-calling-based methods with MAF > 5% and no missing data.
4. Discussion
This study demonstrated that the choice of methods used to estimate genome-wide levels of genetic diversity can lead to disparate results, obscuring the importance of considering genetic diversity estimates and the power of population genetics statistics in informing conservation status assessments.
Here, an European hake population that experienced a recent strong decline of around 80% of its biomass, along with a loss of genetic diversity and at least a 40-fold reduction in its ancestral effective size, followed by population growth driven by the release of fishing pressures [
37,
38], was analyzed using two different pipelines and various SNP filtering strategies. Obtained estimates of nucleotide diversity, and deviations from neutrality expectations of constant population size, indicate that the recent population size change experienced by this population could not be revealed by using the most popular pipeline based on SNP-calling, followed by SNP filtering allowing for missing data and/or filtering at Minor Allele Frequency (MAF) > 5%. In contrast, genotype-likelihood-based estimates of genome-wide levels of nucleotide diversity were congruent with expectations from historical stock abundance estimates. Additionally, when employing the genotype-likelihood-based approach that allows for missing data to improve the power of SNP detection, there was no influence on the estimates of nucleotide diversity or Tajima’s D index of neutrality, which showed the expected pattern based on the known population demographic history.
Two main differences biasing nucleotide diversity estimates are detected between the two approaches used in this study (
i.e., SNP-calling versus genotype-likelihood-based). Firstly, the already known effect of inaccurate estimates of invariant genomics position in the SNP-calling-based methods, for which corrections have been proposed [
23,
24,
25]. When allowing for missing data at SNP positions, the number of detected SNPs increases, while the number of invariant genomic positions remains fixed in the SNP-calling-based approach. Differently, the number of invariant informative genomic positions changes jointly with the number of SNPs in the genotype-likelihood-based approach, producing more accurate estimates of nucleotide diversity. The results indicate that by allowing missing data in the SNP-calling-based approach, both estimates of genetic diversity, θ
W and θ
π, are likely to be overestimated, obscuring the differences between them and therefore producing non-significant deviations from the neutral expectations of constant population size over time. Secondly, filtering by Minor Allele Frequency (
i.e., MAF > 5%) in the SNP-calling approach eliminated around 50% of the genetic variation, decreasing θ
π and consequently producing disparate estimates of the Tajima’s D neutrality index [
20] in a manner contrary to what is expected based on the known census history of the population.
In this study, it is also demonstrated that working with a sample size of 60 individuals, and therefore a minimum MAF of 0.008, it was sufficient to effectively detect changes in the Site Frequency Spectrum using the genotype-likelihood-based approach, evidencing the recent population bottleneck. Hence, to gain insights into recent population size declines using RAD-seq data and population genetics statistics, it is of high importance to implement analytical approaches that consider the full Site Frequency Spectrum of the sample, including invariant genomic positions with the same alignments and base qualities, as implemented in the genotype-likelihood-based approach of ANGSD software (version 0.940) [
35]. This is especially relevant for abundant fish species under exploitation, where rapid census recovery after periods of over-exploitation can obscure the loss of genetic diversity produced during the depletion period. Moreover, in the absence of historical abundance data for such species, the average number of mutations (θ
W, [
17]) may not be sufficient to detect loss of genetic diversity. This is because the number of mutations in the population tends to recover in parallel with population abundance, whereas the recovery of their frequency is considerably slower. Other estimators of genome-wide genetic diversity that are not based on allele frequency—such as heterozygosity,
i.e., [
6,
43,
44,
45]—have also been shown to be sensitive to sample size, missing data, and SNP filtering thresholds [
46], which limits their reliability for detecting recent fluctuations in population size. Indeed, in the study by Leone et al. (2019) [
26], the observed and expected heterozygosity estimates for the same population data analyzed here showed slight, non-significant differences. Thus, it is highly recommended to use genetic diversity estimates that consider the frequency of the mutations in the population, such as nucleotide diversity by site (θ
π, [
18]), which will be more sensitive to recent population size declines [
8,
9,
20]. Given that genetic variation is the raw material for adaptive natural selection [
3,
45,
47,
48], declines in genetic diversity levels can reduce adaptive potential, threatening populations to extinction under the current scenario of environmental change.
5. Conclusions
This study demonstrates how genome-wide estimates of genetic diversity can be used to infer the current conservation status of species populations through genotype-likelihood-based estimates of the Site Frequency Spectrum. It also highlights that commonly used SNP-calling pipelines for estimating genetic diversity can introduce biases in neutrality tests, potentially limiting the effectiveness of population genetic analyses in informing biodiversity conservation and the sustainable management of marine resources.
Acknowledgments
NPM was supported by MSCA-PF 101066785 (FISHADAPT).
Ethics Statement
Not applicable.
Informed Consent Statement
Not applicable.
Data Availability Statement
This study re-use data from NCBI SRA Bioproject PRJNA556115.
Funding
Marie Skłodowska-Curie Actions (MSCA) Grant agreement ID: 101066785 (FISHADAPT).
Declaration of Competing Interest
The author declare that she has no known competing financial interests or personal relationships that could have appeared to influence the work reported in this paper.
References
-
1.
IUCN. IUCN Red List Categories and Criteria: Version 3.1, 2nd ed.; IUCN: Gland, Switzerland; Cambridge, UK, 2012; iv + 32p. Available online: https://portals.iucn.org/library/node/10315 (accessed on 1 March 2025).
-
2.
Ceballos G, Ehrlich PR, Dirzo R. Biological annihilation via the ongoing sixth mass extinction signaled by vertebrate population losses and declines.
Proc. Nati. Acad. Sci. USA 2017,
114, E6089–E6096. doi:10.1073/pnas.1704949114.
[Google Scholar]
-
3.
Spielman D, Brook BW, Frankham R. Most Species are Not Driven to Extinction Before Genetic Factors Impact Them.
Proc. Nati. Acad. Sci. USA 2004,
101, 15261–15264. doi:10.1073/pnas.0403809101.
[Google Scholar]
-
4.
Frankham R. Where are we in conservation genetics and where do we need to go?
Conserv. Genet. 2010,
11, 661–663. doi:10.1007/s10592-009-0010-2.
[Google Scholar]
-
5.
Allendorf FW, Hohenlohe PA, Luikart G. Genomics and the future of conservation genetics.
Nat. Rev. Genet. 2010,
11, 697–709. doi:10.1038/nrg2844.
[Google Scholar]
-
6.
DeWoody JA, Harder AM, Mathur S, Willoughby JR. The long‐standing significance of genetic diversity in conservation.
Mol. Ecol. 2021,
30, 4147–4154. doi:10.1111/mec.16051.
[Google Scholar]
-
7.
Díez-del-Molino D, Sánchez-Barreiro F, Barnes I, Gilbert MTP, Dalén L. Quantifying Temporal Genomic Erosion in Endangered Species.
Trends Ecol. Evol. 2018,
33, 176–185. doi:10.1016/j.tree.2017.12.002.
[Google Scholar]
-
8.
Petit‐Marty N, Liu M, Tan IZ, Chung A, Terrasa B, Guijarro B, et al. Declining Population Sizes and Loss of Genetic Diversity in Commercial Fishes: A Simple Method for a First Diagnostic.
Front. Mar. Sci. 2022,
9, 872537. doi:10.3389/fmars.2022.872537.
[Google Scholar]
-
9.
Petit‐Marty N, Vázquez‐Luis M, Hendriks IE. Use of the nucleotide diversity in COI mitochondrial gene as an early diagnostic of conservation status of animal species.
Conserv. Lett. 2021,
14, e12756. doi:10.1111/conl.12756.
[Google Scholar]
-
10.
Jeon JY, Black AN, Heenkenda EJ, Mularo AJ, Lamka GF, Janjua S, et al. Genomic Diversity as a Key Conservation Criterion: Proof-of-Concept From Mammalian Whole-Genome Resequencing Data.
Evol. Appl. 2024,
17, e70000. doi:10.1111/eva.70000.
[Google Scholar]
-
11.
United Nations. Outcomes of the 15th Meeting of the Conference of the Parties to the Convention on Biological Diversity (COP15). 2022. Available online: https://www.cbd.int/cop15/ (accessed on 15 June 2025 ).
-
12.
Hoban S, Bruford M, Jackson JDU, Lopes-Fernandes M, Heuertz M, Hohenlohe PA, et al. Genetic diversity targets and indicators in the CBD post-2020 Global Biodiversity Framework must be improved.
Biol. Conserv. 2020,
248, 108654. doi:10.1016/j.biocon.2020.108654.
[Google Scholar]
-
13.
Hoban S, Paz-Vinas I, Shaw RE, Castillo-Reina L, da Silva JM, DeWoody JA, et al. DNA-based studies and genetic diversity indicator assessments are complementary approaches to conserving evolutionary potential.
Conserv. Genet. 2024,
25, 1147–1153. doi:10.1007/s10592-024-01632-8.
[Google Scholar]
-
14.
McLaughlin CM, Hinshaw C, Sandoval-Arango S, Zavala-Paez M, Hamilton JA. Redlisting genetics: Towards inclusion of genetic data in IUCN Red List assessments.
Conserv. Genet. 2025,
26, 213–223. doi:10.1007/s10592-024-01671-1.
[Google Scholar]
-
15.
Cook CN, Sgrò CM. Poor understanding of evolutionary theory is a barrier to effective conservation management.
Conserv. Lett. 2019,
12, e12619. doi:10.1111/conl.12619.
[Google Scholar]
-
16.
Kimura M. The neutral theory of molecular evolution.
Sci. Am. 1979,
241, 98–129. doi:10.1038/scientificamerican1179-98.
[Google Scholar]
-
17.
Watterson GA. On the Number of Segregating Sites in Genetical Models without Recombination.
Theor. Popul. Biol. 1975,
7, 256–276. doi:10.1016/0040-5809(75)90020-9.
[Google Scholar]
-
18.
Nei M. Molecular Evolutionary Genetics; Columbia University Press: New York, NY, USA, 1987.
-
19.
Korneliussen TS, Moltke I, Albrechtsen A, Nielsen R. Calculation of Tajima’s D and other neutrality test statistics from low depth next-generation sequencing data.
BMC Bioinform. 2013,
14, 289. doi:10.1186/1471-2105-14-289.
[Google Scholar]
-
20.
Tajima F. Statistical Method for Testing the Neutral Mutation Hypothesis by DNA Polymorphism.
Genetics 1989,
123, 585–595. doi:10.1093/genetics/123.3.585.
[Google Scholar]
-
21.
Hudson RR. Generating samples under a Wright-Fisher neutral model.
Bioinformatics 2002,
18, 337–338. doi:10.1093/bioinformatics/18.2.337.
[Google Scholar]
-
22.
Bazin E, Glémin S, Galtier N. Population Size Does Not Influence Mitochondrial Genetic Diversity in Animals.
Science 2006,
312, 570–572. doi:10.1126/science.1122033.
[Google Scholar]
-
23.
Konopiński MK. Average weighted nucleotide diversity is more precise than pixy in estimating the true value of π from sequence sets containing missing data.
Mol. Ecol. Resour. 2023,
23, 348–354. doi:10.1111/1755-0998.13707.
[Google Scholar]
-
24.
Samuk K. Average nucleotide diversity should be weighted by per‐site sample size.
Mol. Ecol. Resour. 2023,
23, 355–358. doi:10.1111/1755-0998.13738.
[Google Scholar]
-
25.
Bailey N, Stevison L, Samuk K. Correcting for Bias in Estimates of θw and Tajima’s D From Missing Data in Next‐Generation Sequencing.
Mol. Ecol. Resour. 2025,
25, e14104. doi:10.1111/1755-0998.14104.
[Google Scholar]
-
26.
Leone A, Álvarez P, García D, Saborido-Rey F, Rodriguez-Ezpeleta N. Genome-wide SNP based population structure in European hake reveals the need for harmonizing biological and management units.
ICES J. Mar. Sci. 2019,
76, 2260–2266. doi:10.1093/icesjms/fsz161.
[Google Scholar]
-
27.
Díaz‐Arce N, Gagnaire PA, Richardson DE, Walter JF, III, Arnaud‐Haond S, Fromentin JM, et al. Unidirectional trans‐Atlantic gene flow and a mixed spawning area shape the genetic connectivity of Atlantic bluefin tuna.
Mol. Ecol. 2024,
33, e17188. doi:10.1111/mec.17188.
[Google Scholar]
-
28.
Fish JJ, Dudgeon C, Barnett A, Butcher PA, Holmes BJ, Huveneers C, et al. Evidence of Fine‐Scale Genetic Structure in Tiger Sharks (Galeocerdo cuvier) Highlights the Importance of Stratified Sampling Regimes.
Evol. Appl. 2025,
18, e70117. doi:10.1111/eva.70117.
[Google Scholar]
-
29.
Pinsky ML, Eikeset AM, Helmerson C, Bradbury IR, Bentzen P, Morris C, et al. Genomic stability through time despite decades of exploitation in cod on both sides of the Atlantic.
Proc. Natl. Acad. Sci. USA 2021,
118, e2025453118. doi:10.1073/pnas.2025453118.
[Google Scholar]
-
30.
Antoniou A, Manousaki T, Ramírez F, Cariani A, Cannas R, Kasapidis P, et al. Sardines at a junction: Seascape genomics reveals ecological and oceanographic drivers of variation in the NW Mediterranean Sea.
Mol. Ecol. 2023,
32, 1608–1628. doi:10.1111/mec.16840.
[Google Scholar]
-
31.
Blanco‐Fernandez C, Rodriguez‐Roche J, Mateo JL, Erzini K, Garcia‐Vazquez E, Machado‐Schiaffino G. Hybridization and Introgression in Black Hakes (Merluccius polli and M. senegalensis): Evolutionary Dynamics and Conservation Implications in the Contact Zone Exploited by Multi‐Species Fisheries.
Mol. Ecol. 2025,
34, e17654. doi:10.1111/mec.17654.
[Google Scholar]
-
32.
Puritz JB, Gold JR, Portnoy DS. Fine-scale partitioning of genomic variation among recruits in an exploited fishery: causes and consequences.
Sci. Rep. 2016,
6, 36095. doi:10.1038/srep36095.
[Google Scholar]
-
33.
Leone A, Arnaud‐Haond S, Babbucci M, Bargelloni L, Coscia I, Damalas D, et al. Population Genomics of the Blue Shark, Prionace glauca, Reveals Different Populations in the Mediterranean Sea and the Northeast Atlantic.
Evol. Appl. 2024,
17, e70005. doi:10.1111/eva.70005.
[Google Scholar]
-
34.
í Kongsstovu S, Mikalsen SO, í Homrum E, Jacobsen JA, Als TD, Gislason H, et al. Atlantic herring (Clupea harengus) population structure in the Northeast Atlantic Ocean.
Fish. Res. 2022,
249, 106231. doi:10.1016/j.fishres.2022.106231.
[Google Scholar]
-
35.
Korneliussen TS, Albrechtsen A, Nielsen R. ANGSD: analysis of next generation sequencing data.
BMC Bioinform. 2014,
15, 356. doi:10.1186/s12859-014-0356-4.
[Google Scholar]
-
36.
Rochette NC, Rivera‐Colón AG, Catchen JM. Stacks 2: Analytical methods for paired‐end sequencing improve RADseq‐based population genomics.
Mol. Ecol. 2019,
28, 4737–4754. doi:10.1111/mec.15253.
[Google Scholar]
-
37.
Pita A, Pérez M, Velasco F, Presa P. Trends of the genetic effective population size in the Southern stock of the European hake.
Fish. Res. 2017,
191, 108–119. doi:10.1016/j.fishres.2017.02.022.
[Google Scholar]
-
38.
Fernández-Míguez M, Pita A, Gomez A, Presa P. Temporal uncoupling between demographic and genetic metrics in fisheries assessment: the European hake case study.
Front. Mar. Sci. 2023,
10, 1214469. doi:10.3389/fmars.2023.1214469.
[Google Scholar]
-
39.
Etter PD, Bassham S, Hohenlohe PA, Johnson EA, Cresko WA. SNP discovery and genotyping for evolutionary genetics using RAD sequencing.
Methods Mol. Biol. 2011,
772, 157–178. doi:10.1007/978-1-61779-228-1_9.
[Google Scholar]
-
40.
Li H. Aligning sequence reads, clone sequences and assembly contigs with BWA-MEM.
arXiv 2013, arXiv:1303.3997v2.
[Google Scholar]
-
41.
Danecek P, Auton A, Abecasis G, Albers CA, Banks E, DePristo MA, et al. The variant call format and VCFtools.
Bioinformatics 2011,
27, 2156–2158. doi:10.1093/bioinformatics/btr330.
[Google Scholar]
-
42.
R Core Team. R: A Language and Environment for Statistical Computing; R Foundation for Statistical Computing: Vienna, Austria, 2024.
-
43.
Frankham R. Relationship of genetic variation to population size in wildlife.
Conserv. Biol. 1996,
10, 1500–1508. doi:10.1046/j.1523-1739.1996.10061500.x.
[Google Scholar]
-
44.
DeWoody YD, DeWoody JA. On the estimation of genome-wide heterozygosity using molecular markers.
J. Hered. 2005,
96, 85–88. doi:10.1093/jhered/esi017.
[Google Scholar]
-
45.
Pinsky ML, Palumbi SR. Meta-Analysis Reveals Lower Genetic Diversity in Overfished Populations.
Mol. Ecol. 2014,
23, 29–39. doi:10.1111/mec.12509.
[Google Scholar]
-
46.
Sopniewski J, Catullo RA. Estimates of heterozygosity from single nucleotide polymorphism markers are context‐dependent and often wrong.
Mol. Ecol. Resour. 2024,
24, e13947. doi:10.1111/1755-0998.13947.
[Google Scholar]
-
47.
Conover DO, Clarke LM, Munch SB, Wagner GN. Spatial and Temporal Scales of Adaptive Divergence in Marine Fishes and the Implications for Conservation.
J. Fish Biol. 2006,
69, 21–47. doi:10.1111/j.1095-8649.2006.01274.x.
[Google Scholar]
-
48.
Bernatchez L, Wellenreuther M, Araneda C, Ashton DT, Barth JM, Beacham TD, et al. Harnessing the Power of Genomics to Secure the Future of Seafood.
Trends Ecol. Evol. 2017,
32, 665–680. doi:10.1016/j.tree.2017.06.010.
[Google Scholar]