1. Introduction
High entropy alloys (HEAs) [
1,
2] consist of five or more elements in equal or near equal atomic percent. Contrary to conventional alloys, HEAs have outstanding comprehensive performance due to the effects of high entropy, sluggish diffusion, lattice distortion, and cocktails [
3,
4]. The Al
xCoCrFeNi HEAs have high strength [
5], excellent high-temperature properties [
6], and radiation resistance [
7], the reliable joining of HEAs and 304SS is essential during the development of high-temperature components [
8,
9].
Conventional gas tungsten arc welding (GTAW), due to its weld grain coarsening and element segregation, leads to the weakening of joint performance [
10,
11], and is used for a type that is not commonly applied to the connection of different metals. Laser beam welding, due to its large thermal cycles, the formation of complex phases, and element segregation, causes decreased sharp joint strength [
12,
13]. Brazing is considered to be an effective joining process of HEAs because it has little effect on substrate properties and strong structural adaptability [
14]. However, IMCs appear in brazing joints, leading to the brazed joint embrittlement [
15,
16]. Although diffusion bonding strength is high, the bonding process requires complex apparatus, the assembly process is complicated and requires high accuracy and longer holding time, which is restrictive to practical industrial productions [
17,
18]. It has been reported that the HEAs filler [
19,
20] can increase the mixing entropy of brazed joints so that the joint structure forms a solid solution structure rather than brittle IMCs [
21]. However, the HEAs filler has a higher melting point (
Tm), so the doping of the
Tm depressant elements into fillers was applied [
22], but the
Tm was still much higher than that of most current mainstream Ni-based fillers [
23], and it should be known that the
Tm of filler should be much lower than that of the base metal (BM), otherwise, it will hinder the industrialization of the HEAs filler.
Scholars sought aggressively new technological methods to reduce brazing temperature and holding time, while ensuring the best mechanical properties of the joint. HEAs joining through reactive bonding, particularly with Al/Ni reactive multilayers nano-foils (auxiliary heating layer), offers plentiful advantages [
24,
25,
26,
27]. The localized heat, rapid heating/cooling under sharp temperature gradients in adjacent areas, can form a small heat-affected zone [
28,
29]. Meanwhile, the buffer layer (that is, a NiCr/FeCo multilayer nano-films (HEAfs layer)) deposited on the BM can form a transient zone to promote interfacial reactive and form robust metallurgical bonding [
30,
31].
In this paper, a novel brazing process for joining HEAs joints at lower temperatures that judiciously stacks three functionally distinct multilayer nano-films with discrepancies in essence and functionality, specifically the auxiliary heating layer, HEAfs layer, and Al film (filler metal). The nano multilayer self-propagating exothermic reactive brazing has the features of low ignition temperature, fast reactive velocity, and little influence on BM to meet this demand. Therefore, more and more attention has been paid to the nano-multilayer self-propagating exothermic reactive brazing. However, it is difficult to observe the dynamic process and diffusion mechanism of the structural transformation of welded components by traditional experimental methods. The time scale and length scale of COMSOL finite element simulation are the same as those of the self-propagating reactive brazing experiment, which can accurately simulate the diffusion behavior and phase transition mechanism of the self-propagating reactive brazing process of nano multilayer films. So it plays a significant role in the research of self-propagating reactive brazing.
2. Simulation and Experimental Procedures
2.1. Finite Element Simulation Process
There are many ways to calculate the diffusion coefficient (diff-co), and the most common ones are Fick’s second Law (Fick-sec-L) and Boltzmann-Matano’s (B-M) method. The two methods have different application ranges. Fick-sec-L is unsteady diffusion, where the concentration changes at a point with time. B-M method is that the diff-co is correlated to the composition. The calculation process is as follows: When the diff-co is related to the composition, Boltzmann used the method of variable separation to find the explanation of Fick-sec-L equation. In 1993, Matano further projected a way to evaluate the diff-co by the graphic method according to Boltzmann’s solution, which became B-M method.
For a binary system, Fick-sec-L equation:
While for interdiffusion in a multi-principal component (
n) system (MPCS), Fick-sec-L is extended to (
n − 1) independent partial differential equations and appears (
n − 1)
2 interdiffusion coefficients (inter-diff-co) $$\tilde{D}_{ij}^n$$ [
32,
33]:
in which concentration
Ci is a function of time
t and location
x. To calculate the $$\tilde{D}_{ij}^n$$ from
Equation (2), Kirkaldy [
33] extended the B-M method from binary to multi-principal component form:
where
x0 is the position of Matano interface, can be explained by
Based on
Equation (3), the definition of all the inter-diff-co necessitates (
n − 1)
2 independent calculations produced from (
n − 1) independent diffusion pairs with a mutual constituent point along the diffusion pathways. The inter-diff-co can be obtained with this constituent only [
33]. In addition, it is a massive work to determine the interdiffusion coefficients of multi-principal components, and almost impossible to design diffusion pairs with multiple diffusion paths for systems with more than three elements [
34].
To simplify these difficulties, Darken-type couples [
35], which are theoretically similar to quasi-binary couples are utilized. For a quinary system, if the concentration gradients of elements 3, 4, and 5 at a designated situation
x0 are insignificantly minor, namely, $$\partial C_1/\partial x\cong\partial C_2/\partial x$$, then
Equation (3) can be simplified to
The
Equation (5) can be calculated easily, which is equally the equation for a binary system. By using the Sauer-Freise method,
Equation (5) can be modified to eradicate the deviation related to determining the location of the Matano plane [
36,
37]:
where is $$Y=\frac{C^{\prime}-C^-}{C^+-C^{\prime}}$$.
Therefore, the quasi-binary inter-diff-co can be calculated by
Equation (6). To study the diffusion law of each atom in the joint, the activation energies (kJ/mol) and pre-exponential factors (m
2/s) for each atom in the Al-Co-Cr-Fe-Ni, 304SS and FeCoNiCr system were listed as follows
. The diffusion coefficients of each atom at 1323 K in NiAl are listed as follows
.
.
Energy of activation (kJ/mol) and pre-exponential factors (m2/s) obtained for the tracer diffusion coefficient using Levenberg-Marquardt method for the Al-Co-Cr-Fe-Ni, 304SS, Al, and FeCoNiCr systems.
| Al-Co-Cr-Fe-Ni [38] |
304SS [39,40] |
FeCo/NiCr [41,42] |
Al [43,44,45] |
|
Ea |
D0 |
Ea |
D0 |
Ea |
D0 |
Ea |
D0 |
| Al |
- |
- |
67.86 |
9.03 × 10⁻⁸ |
- |
- |
215 |
8.02 × 10⁻¹ |
| Co |
228.6 |
8.93 × 10⁻⁷ |
259 |
0.31 × 10⁻⁴ |
306.9 |
9.26 × 10⁻⁴ |
325 |
4.2 × 10⁻³ |
| Cr |
283.1 |
1.94 × 10⁻⁴ |
309 |
8.3 × 10⁻⁴ |
292.9 |
5.59 × 10⁻⁴ |
366 |
1.1 × 10⁻¹ |
| Fe |
279.6 |
1.25 × 10⁻⁴ |
308 |
5.3 × 10⁻⁴ |
309.6 |
15.1 × 10⁻⁴ |
68.15 |
7.85 × 10⁻⁸ |
| Ni |
227.1 |
1.90 × 10⁻⁷ |
300 |
1.5 × 10⁻⁴ |
317.5 |
19.7 × 10⁻⁴ |
204 |
9.08 × 10⁻¹ |
.
The diffusion coefficients (m2/s) of each atom at 1323 K in NiAl.
|
Al |
Co |
Cr |
Fe |
Ni |
| NiAl [46,47] |
38.12 × 10⁻¹⁵ |
14.09 × 10⁻¹⁵ |
17.29 × 10⁻¹⁵ |
3.18 × 10⁻¹¹ |
1.27 × 10⁻¹⁴ |
| AlCoCrFeNi [38] |
8.314 × 10⁻⁷ |
- |
- |
- |
- |
| CoCrFeNi [42] |
8.314 × 10⁻⁷ |
- |
- |
- |
- |
Finite element analysis (FEA) was adopted on the basis of Darken-Manning (D-M) theory, combined with Levenberg-Marquardt or genetic algorithm optimization method, by the finite element equations in the Mass-Transfer in Fluids module of COMSOL Multiphysics, the key concept of the D-M theory [
48,
49] divided essentially the total flux $$\tilde{J}_i$$ into diffusive and convective portions:
where
Ji,
ci, and
v are the intrinsic flux of the
i-th element, concentration of the
i-th element, and the movement speed of all components, which is common, respectively. The Kirkendall- smigelskas experiment [
50] was originally explained by the method of detecting the movement of inert markers during the diffusion of 1058 K Cu-Zn to each other (
i.e., the Kirkendall effect). Manning further developed the D-M model [
51,
52], which introduced structural dependent factors correlated to atomic diffusion and vacancy. The intrinsic diffusion flux of this model is determined using:
where
D*i,
Ni,
ui, and
δij are the tracer diff-co of the
i-
th element, the mole fraction, the chemical potential, and the Kronecker delta, which equals 1 for
i =
j and 0 otherwise, respectively.
In Manning model,
M0 is a constant depending only on the crystalline structure, and the
M0 values of FCC and BCC systems are successively 7.15 and 5.33. Assuming that the partial molar volume of each element is the same and the molar volume of the material is constant, can obtain:
what does that mean for a closed system:
authorizing the calculation of the movement velocity:
In this study, the diff-co in 304SS, NiCr alloys, FeCo alloys, NiAl IMCs, pure Al, and Al
0.1CoCrFeNi HEAs are considered to be constant (independent of chemical constitution). Above hypothesis comprises two scenarios: ideal solutions, in which the Gibbs free energy is dominated by mixing entropy while the mixing enthalpy is negligible at high temperatures; or regular solutions with a very narrow range of concentration, considering that the average is 10% in the diffusion couples. To further simplify the model and for the sake of clarity, the system in this study is considered to be an ideal solution. For ideal solutions (in which activity coefficients of all elements are equivalent 7),
Equation (8) and
Equation (11) simplify to:
The calculation area of COMSOL numerical model is 50 μm × 40 μm, the free square grid is used, the FeCo/NiCr multilayers grid is 10 nm, and the rest grid is 500 nm, as shown in . The concentration of each atom is the same as the initial state of the test, the rest boundary is no flux, the setting time is 60 min, and the step length is 1 min. The FEA model was verified using EDS at cross-sections inside the brazed joints, in which the long-term microstructure evolution trend of measured data is consistent, and the concentration deviation from the predicted results is small.
. Diagram of (<b>a</b>)the whole Model, (<b>a-1</b>) Model of the FeCo/NiCr and (<b>b</b>) grid division, (<b>b-1</b>) grid division of the FeCo/NiCr.
Al
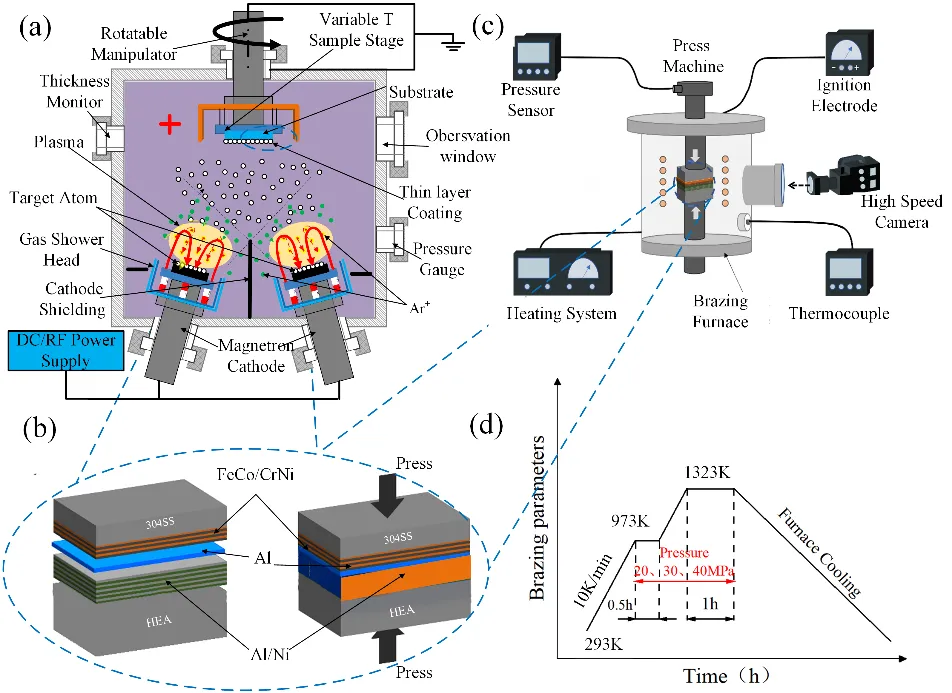
0.1CoCrFeNi HEAs were prepared from Al, Co, Cr, Fe, and Ni with purity ≥ 99.99% by arc-melting under the protection of an argon atmosphere. The ingot was remelted at least 4 times for uniformity. Before depositing, the HEAs and 304SS were cut into 10 mm × 10 mm × 4 mm and 15 mm × 15 mm × 4 mm, respectively. All depositing surfaces were ultrasonically cleaned and ground with up to 3000-grit SiC papers. The HEAfs layer and auxiliary heating layer were prepared using DC magnetron sputtering method, as shown in
a, respectively. The experimental condition of DC magnetron sputtering for the HEAfs layer and auxiliary heating layer with 100 W DC at a working pressure of 3.6 × 10
−3 mbar with 200 cm
3/min of argon flux, and the deposition time was 300 s. The Al films (10 μm) were applied as filler units.
The 304SS-HEAf and AlNi-HEAs were sandwiched with the Al foils as the interlayers, the schematic was shown in
b. Exothermic reactions are caused by thermal explosions by direct heating at 723 K. Then held at 923 K for half an hour and subsequently heated to brazing temperature, brazing specimens were heated temperatures ranging from 1223 to 1323 K with a heating frequency of 10 ℃/min and under a pressure of 40 MPa for holding 30, 60 and 90 min. Subsequently, the brazing specimens were gradually cooled down to room temperature within the furnace. A schematic diagram of the assembly structure and the heating process is shown in
c,d.
. (<b>a</b>) Sketch of for DC magnetron sputtering method, (<b>b</b>) diagrammatic drawing of the assembly for brazing, (<b>c</b>) schematic of the brazing process, (<b>d</b>) brazing process curve.
After brazing, the interfacial microstructures and element distributions in the brazed joints were analyzed by a field emission SEM (STM-6700F) equipped with an energy-dispersive spectrum (EDS). The electron backscatter diffraction (EBSD) analysis was applied using an Oxford Instruments Nordlys detector on an SEM (STM-6700F) with a scanning step of 0.5 μm. The phase structure of brazed joints was perceived by X-ray diffraction (XRD) with a scanning speed of 10°/min.
3. Results
3.1. FEA of Microstructure Evolution of Joints
3.1.1. Effect of Diffusion Time on Interfacial Diffusion Behavior
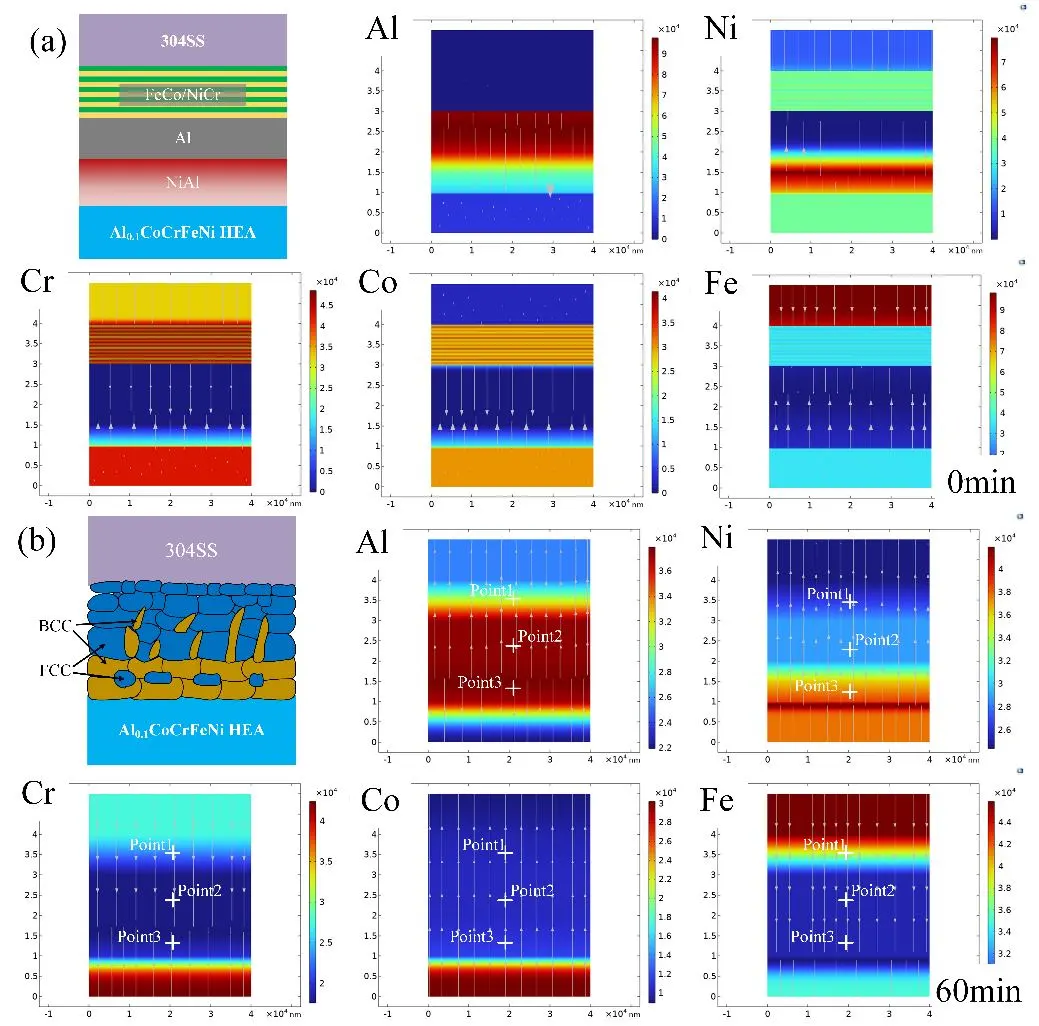
Diffusion time is an important factor affecting the interfacial diffusion behavior. Typical planar elements distribution at the 304SS/HEAFs/Al/NanoFoil/HEAs joints after 1323 K for 0 min and 60 min were shown in
. It can be seen from the figure that when the diffusion time is 0 min, the brazing interface between the HEAs layer, nano-multilayer foils, and the crystalline Al layer is visible, and the interface position at this time is taken as the starting position of the subsequent diffusion process. Diffusion had already occurred at the interface when the diffusion had proceeded for 30 min. During the initial stage of diffusion, there is a clear interface between each substance, but with the prolonging of holding time, the interface disappears obviously. This is because the existence of a concentration gradient promotes the interaction between elements and promotes their movements. The time-dependent finite element analysis of the microstructure evolution across the self-propagating brazing joints of the 304SS/HEAFs/Al/Al-Ni nano-multilayer foils/HEAs stacked structure (
a,b) indicates that atoms diffuse throughout the joint as the propagation brazing progresses. With the prolonging of holding time, the elements are diffused more fully, which makes the distribution of joint elements more uniform. Interface. It can be seen that when the diffusion has not started, the concentration changes of each atom are transient, and do not show gradients, which are close to the ideal state when they are not diffused. When the diffusion proceeds to 30 min, it can be seen that the concentration of each atom exhibits a gradient, indicating that Al atom diffusion into nano-multilayer foils causes the diffusion interface to move forward, which is consistent with the phenomenon observed in
. Afterwards, as the diffusion time was extended to 60 min and 90 min, more crystalline Al atoms diffused into the nano-multilayer foils, and the thickness of the diffusion layer increased, validating the previous observations. The diffusion results at different brazing temperatures and at different holding times displayed consistency, screening that most of the Fe and Al atoms diffused into the nano-multilayer foils. This process is controlled by concentration gradient, and each element of the joints is evenly distributed in the solid solution zone.
sketches out the chemical components and possible products of FEA in
.
.
Chemical components (At. %) and possible products in planar elements distribution in FEA.
|
Al |
Co |
Cr |
Fe |
Ni |
Possible Products |
| Point1 |
29.55 |
8.31 |
15.25 |
28.55 |
18.34 |
FCC + BCC |
| Point2 |
29.46 |
8.87 |
15.28 |
27.63 |
18.76 |
| Point3 |
31.01 |
8.72 |
15.43 |
25.45 |
19.39 |
. Planar elements distribution at the 304SS/HEAFs/Al/AlNi/HEAs joints after 1323 K for: (<b>a</b>) 0 min, and (<b>b</b>) 60 min.
3.1.2. Effect of Brazing Temperature on Interfacial Diffusion Behavior
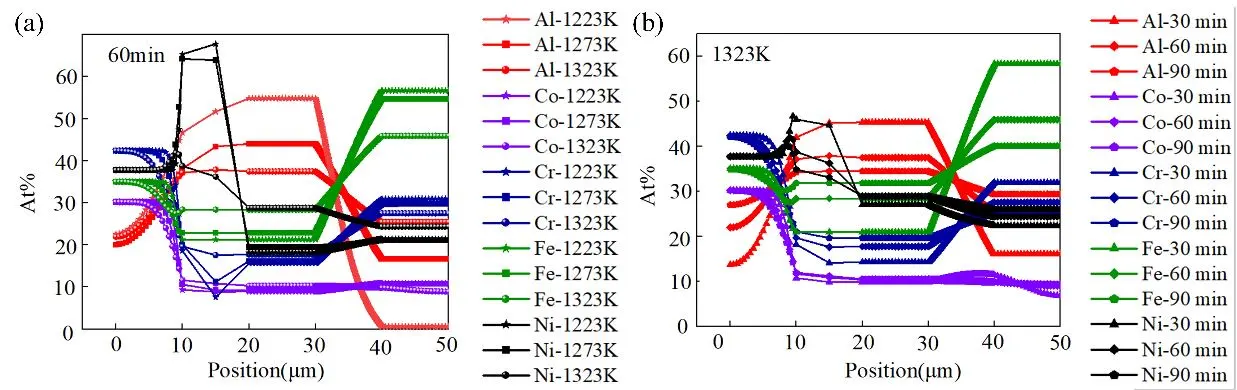
Mechanical and thermal properties of bonding products are significantly affected by temperature, due to the formation of microstructures with different crystallinity, porosity, and phase. To more accurately study the diffusion behavior of each element in the simulation process, the element line scanning was carried out on its diffusion plane, and the diffusion results of each element were obtained in
a,b. With the brazing temperature rising, the element distribution of all diffusion layers in the 304SS/HEAFs/Al/NanoFoil/HEAs interface changed obviously. It can be seen that the higher the temperature, the more atoms cross the initial interface. In the experimental temperature range, the diffusion distance of elements and the width of the diffusion region increase with the increase in temperature, which can be explicated using the Arrhenius formula [
53]:
where
D, D0, T, Q, and
R are the diffusion coefficient, the diffusion constant, the brazing temperature, the activation energy of diffusion, and the gas constant (8.314 J/(mol⋅K)), respectively. For the whole brazing process, the brazing temperature is an extremely important experimental parameter, so the influence of different temperatures on the diffusion behavior of elements and the microstructure evolution process during the simulation process was studied. The results show that the diffusion coefficient is correlated to the brazing temperature.
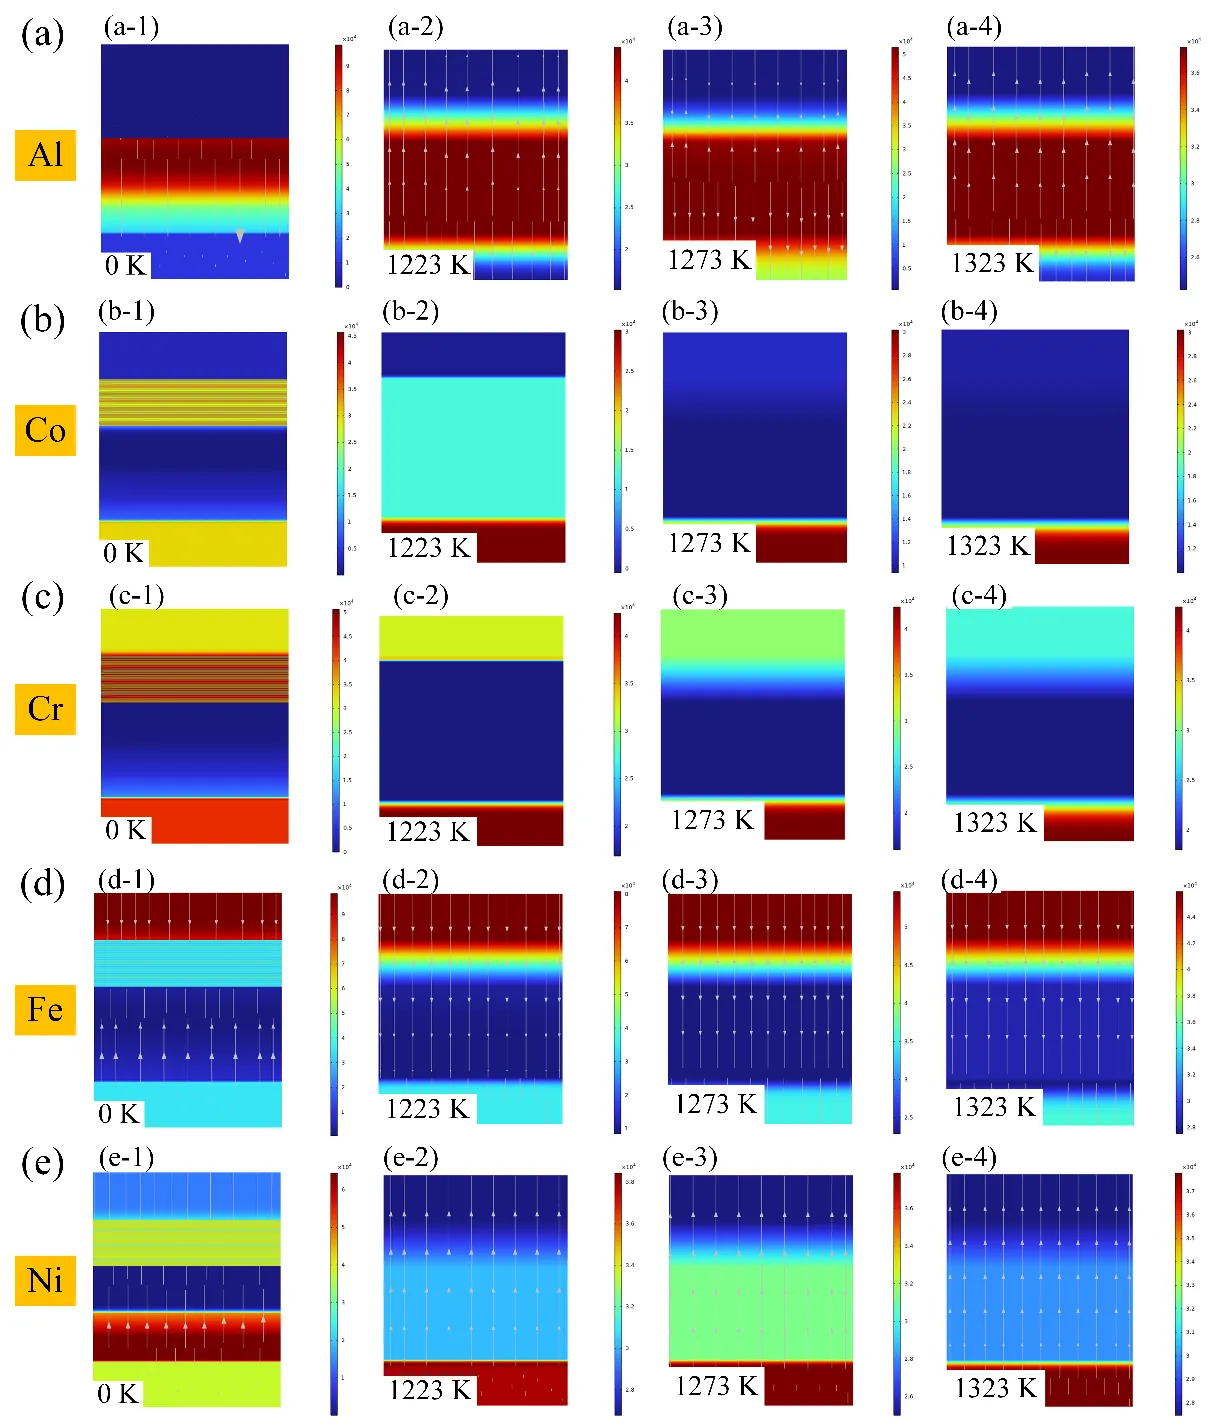
. Cross-sectional view of connection interface at different brazing temperatures:(a) 0 K, (b) 1223 K, (c) 1273 K, (d) 1323 K. With the increase of brazing temperature, the diffusion coefficient increases, which generated more sufficient atoms diffusion at the interface and increased the width of diffusion region. Sufficient diffusion makes the element distribution in the joint more uniform, reduces the formation of vacancies, and thus improves the mechanical properties of the joint. It can be seen that when the diffusion temperature is 1223 K, only slight diffusion occurs at the interface, which may be due to the lower temperature of diffusion, which cannot achieve the energy required for atomic transition. When the diffusion temperature is higher, more atoms deviate from the equilibrium to a non-equilibrium position. The diffusion results show that it is mainly the crystalline Al atoms that diffuse into the nano-multilayer foils, so the thickness of the diffusion layer is mainly determined by the diffusion depth of the crystalline Al atoms.
. Diffusion behavior profiles (Al is the red line, Co is the purple line, Cr is the dark blue line, Fe is the green line, and Ni is the black line) across brazing interfaces after: (<b>a</b>) different temperatures: the five-pointed star represents 1223 K, the square represents 1273 K, and the sphere represents 1323 K, and (<b>b</b>) different times: the triangles represent 30 min, parallelograms represent 60 min, and pentagons represent 90 min.
. Cross-sectional view of connection interface at different brazing temperatures: (<b>a</b>) Al, (<b>b</b>) Co, (<b>c</b>) Cr, (<b>d</b>) Fe, (<b>e</b>) Ni, (<b>a-1</b>)–(<b>e-1</b>) 0 K, (<b>a-2</b>)–(<b>e-2</b>) 1223 K, (<b>a-3</b>)–(<b>e-3</b>) 1273 K, (<b>a-4</b>)–(<b>e-4</b>) 1323 K.
To authenticate the correctness of the above COMSOL model, the phase formation and element distribution of the typical brazed joint were analyzed and compared with the simulation results. Since the simulation assumes that the interface is in close contact, in comparison with the simulation results more accurately, higher pressure is used in the experiment to ensure that the brazing interface is in close contact and the interface atoms are fully diffused.
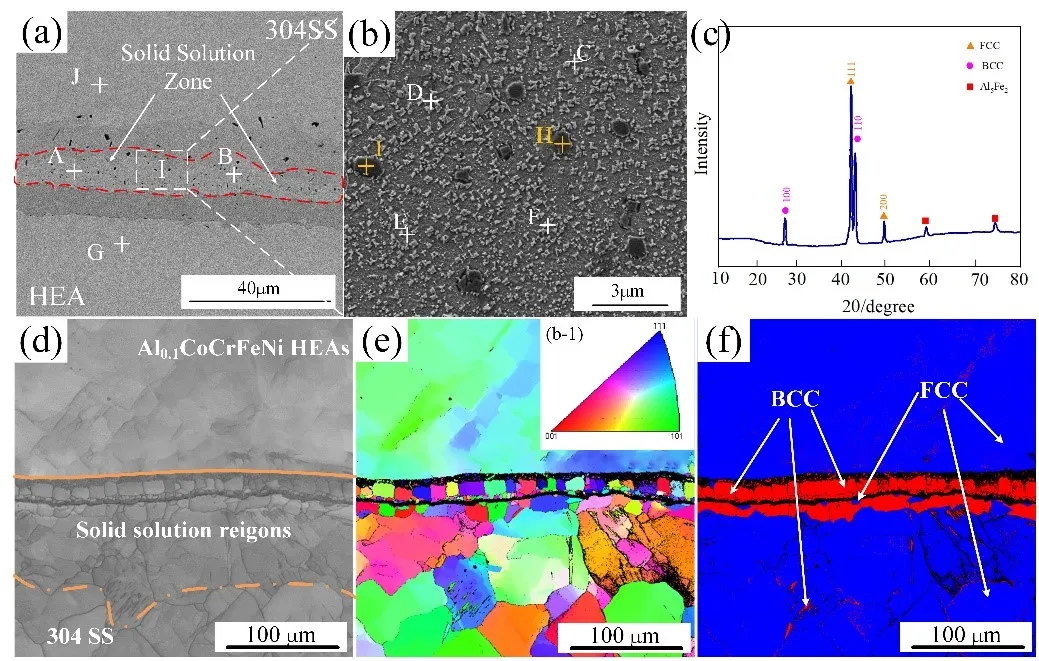
a shows the microstructure and elemental distribution diagram of a 304SS/HEAFs/Al/NanoFoil/Al0.1CoCrFeNi HEAs brazed joint at 1323 K for 60 min under the pressure of 40 MPa. A fine brazed joint free of cracks has been obtained, obviously in
a, representing the reliable metallurgical bonding between these two BM with three nano-multilayer foils. During the brazing process, a solid solution zone was formed in the weld, in which some needle-like reaction products (black phase) randomly distributed can be observed. The elemental distribution diagram specifies that the solid solution zone mainly consists of elements of Al, Co, Cr, Fe, and Ni.
sketches out the chemical components and possible products of the signed zones in
a. It can be seen that the possible phase composition and reaction products of regions A, B, C, D, E, F, G, H, I, and J were BCC + FCC dual-phase, FCC phase, Al
5Fe
2 IMCs, and γ-Fe phase, respectively. The XRD pattern of zone I, as shown in
c, authenticates the conjecture in
and
a. The conjecture will be proved by EBSD identification.
.
Chemical components (At. %) and possible products in signed zones in the brazed joint.
|
Al |
Co |
Cr |
Fe |
Ni |
Possible Products |
| A |
18.2 |
4.7 |
18.6 |
44.2 |
14.4 |
FCC + BCC |
| B |
22.6 |
5.0 |
17.2 |
41.2 |
14.0 |
| C |
16.9 |
4.9 |
19.5 |
45.7 |
13.1 |
| D |
31.9 |
5.1 |
7.9 |
20.4 |
34.0 |
| E |
32.0 |
5.1 |
8.6 |
19.3 |
34.9 |
| F |
7.3 |
22.6 |
22.2 |
27.1 |
20.8 |
| G |
2.6 |
25.9 |
23.7 |
24.8 |
23.0 |
FCC |
| H |
63.05 |
6.56 |
22.6 |
3.5 |
4.29 |
Al5Fe2 |
| I |
65.84 |
5.03 |
23.18 |
2.11 |
3.84 |
| J |
6.5 |
2.5 |
24.4 |
58.9 |
7.7 |
γ-Fe |
The phase composition and reaction products of the brazed joint were further analyzed by EBSD, as shown in
d–f. The solid solution zone consisted of equiaxial grains in the Al/Ni zone and coarse columnar grains in the HEAf zone, which were embedded in each other and distributed in an orderly way in the brazed joint, as shown in
d. Combined with the phase map as shown in
f, the phase structure in the joint was analyzed accurately. It can be seen that the brazed joints were chiefly comprised of hard BCC (Al-Ni) phase and ductile FCC (Co-Fe-Cr) phase, and a small amount of Al
5Fe
2 IMCs grains were dispersed in the dual-phase solid solution zone. The characterization results confirmed the conjecture in
and
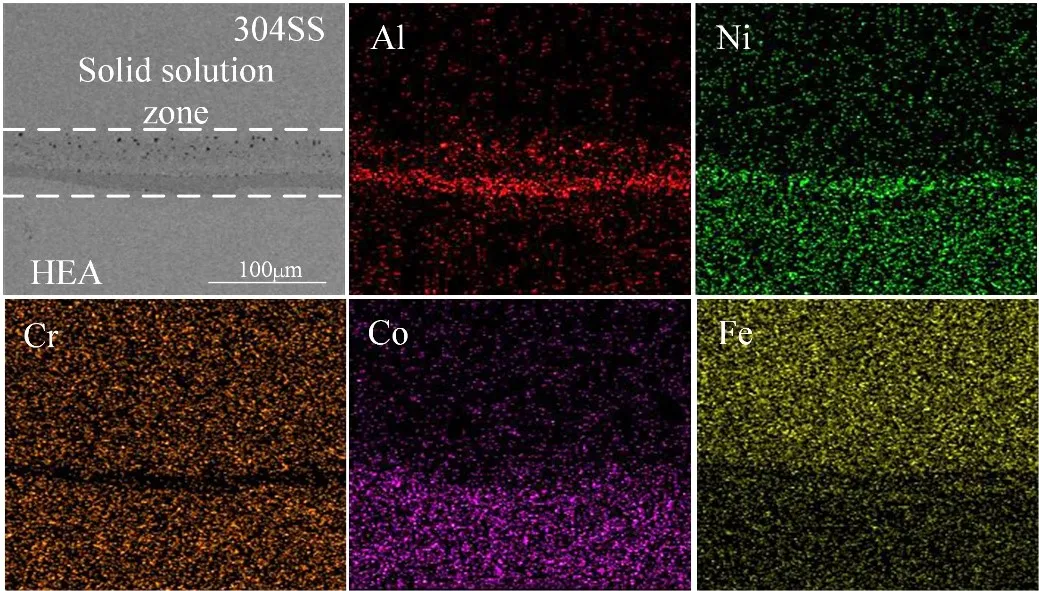
a. The surface scanning of the whole joint is shown in
. The results show that the distribution of elements in the joint is uniform, and the distribution of elements in the plane is consistent with the simulation results.
. Cross-sectional SEM micrographs and EBSD analysis of the joints brazed at 40 MPa: (<b>a</b>) elemental distribution profile from EDS scanning of the brazed joint; (<b>b</b>) morphology and elemental distribution of zone I after corrosion; (<b>c</b>) XRD pattern of zone I; (<b>d</b>) band contrast map; (<b>e</b>) the overall inverse pole figure (IPF); (<b>f</b>) phase map.
. Element distribution of fracture surface at 1323 K for 60 min under 40 MPa.
4. Discussion
4.1. Phase Formation Mechanisms of Joints
To reveal the phase formation mechanism of the brazed joint, the formation process of the solid solution phase in HEAs should be comprehensively studied from the perspective of thermodynamics. Based on previous research, the correlative terms mainly comprise composition-weighted terms for differences in atom radius difference (
δr), and for an average valence electron concentration (
VEC), thermodynamic considerations are reflected through mixing enthalpy (Δ
Hmix), and a ratio parameter (Ω) term that combines Δ
Hmix, entropy of mixing (Δ
Smix), and the average melting temperature (
Tm), which can be applied to predict the solid solution phase formation in a MPCS [
54,
55,
56,
57]. Equations for these parameters are:
where Δ
Hij,
ri,
(VEC)i, and
c are the enthalpy of mixing between the
i-th element and
j-th element at the equimolar concentration in regular binary solutions [
58], atomic radius, the valence electron concentration, and the atomic fractions, respectively. According to
Equation (18), higher Δ
Hmix can efficiently reduce the Gibbs free energy of the formation of HEAs and heighten the solid solution formation capacity.
To determine the formation of random solid solutions in HEAs, the criteria can be used as the range of 1% ≤
δr ≤ 6.6% and −15 kJ/mol ≤ Δ
Hmix ≤ 5 kJ/mol; (Δ
Hmix −
δr criterion) [
59,
60]. Moreover, Yang et al. considered that Ω > 1.1 and
δr < 6.6% (Ω −
δr criterion) were conducive to calculating the possibility of the formation of solid solution phase in MPEAs [
57]. Moreover, when the VEC is between 6.87 and 8.0, the FCC + BCC dual-phase is more stable [
55]. Hence, the formation mechanism of the brazed joint can be predicted more accurately by combining three criteria (including the VEC, Δ
Hmix −
δr criterion, and Ω −
δr criterion). To calculate the phase type of finite element analysis results and the solid solution zone of 1323 K bonding for 60 min at 40 MPa pressure, the relative percentages and corresponding positions of elements in different regions of the solid solution zone and finite element analysis results were measured, as shown in
. Additionally,
represents the required terms of each point.
.
ΔНmix, ΔSmix, δr, VEC, and Ω of each point in marked regions of the experimental and FEA in the brazed joint at 1050 ℃ under 40 MPa for 60 min.
|
δ |
VEC |
ΔSmix(J/(K*mol)) |
ΔHmix(kJ/mol) |
Ω |
Whether HEA |
Crystal Structure |
| A |
4.28% |
7.061 |
11.69 |
−9.66 |
2.07 |
Yes |
FCC + BCC |
| B |
4.58% |
6.856 |
11.88 |
−10.93 |
1.81 |
| C |
4.12% |
7.048 |
11.57 |
−9.09 |
2.19 |
| D |
5.01% |
6.976 |
11.81 |
−14.29 |
1.25 |
| E |
5.26% |
6.969 |
11.74 |
−14.44 |
1.24 |
| F |
4.69% |
7.83 |
12.82 |
−7.14 |
3.23 |
| G |
4.94% |
8.115 |
12.22 |
−5.02 |
4.49 |
FCC |
| Point1 |
5.12% |
6.96 |
12.69 |
−14.15 |
1.46 |
FCC + BCC |
| Point2 |
5.03% |
7.61 |
12.66 |
−13.41 |
1.48 |
| Point3 |
4.93% |
7.52 |
12.67 |
−14.53 |
1.45 |
represents the calculated results of
δr, Δ
Hmix, VEC, and Ω in the solid solution zone and FEA results (
and
a). The values of VEC ranged from 6.87 to 8.0, which required the formation of the FCC + BCC dual-phase solid solution structure, which was comparatively stable. Then, the rules of phase formation in the brazed joint were further determined by Δ
Hmix −
δr and Ω −
δr criteria.
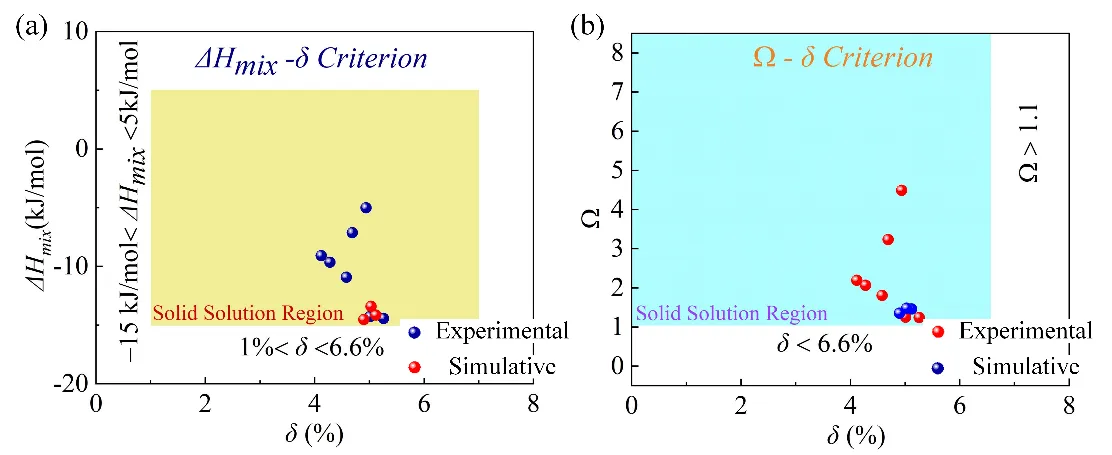
shows the relative parameter models of phase constitution of experimental and finite element analysis points of brazed joints at 40 MPa, 1323 K, and 60 min.
a shows the rule of solid solution formation under the Δ
Hmix −
δr criterion [
59,
60]. It can be observed that the
δr and Δ
Hmix values of the A–G phase in the solid solution region and the FEA results at points 1, 2, and 3 present in the range from 4.12% to 5.26% and from −14.44 to −5.02 kJ/mol, respectively, which overall locate in the solid solution region and conform to the corresponding threshold values. Under the Ω −
δr criterion, the experimental and simulation results are completely situated in the solid solution region, which is completely consistent with the law of solid solution formation, as shown in the Ω −
δr plot (
b). As stated by the calculations, comparing the Δ
Hmix −
δr criterion, the Ω −
δr criterion can predict the formation of stable solid solutions more accurately. The calculated parameter values for the experimental and finite element analysis points of the joint brazed at 1323 K for 60 min under 40 MPa were met completely for the rules of the solid solution formation, which manifests that the phase constitution in regions of the experimental and finite element analysis are dual-phase FCC + BCC solid solutions.
. Relevant parameter models concerning phase constitution of the experimental and FEA points of joint brazed at 1050 ℃ under 40 MPa for 60 min: (<b>a</b>) Δ<i>H<sub>mix</sub></i>-<i>δ<sub>r</sub></i> and (<b>b</b>) Ω-<i>δ<sub>r</sub></i>.
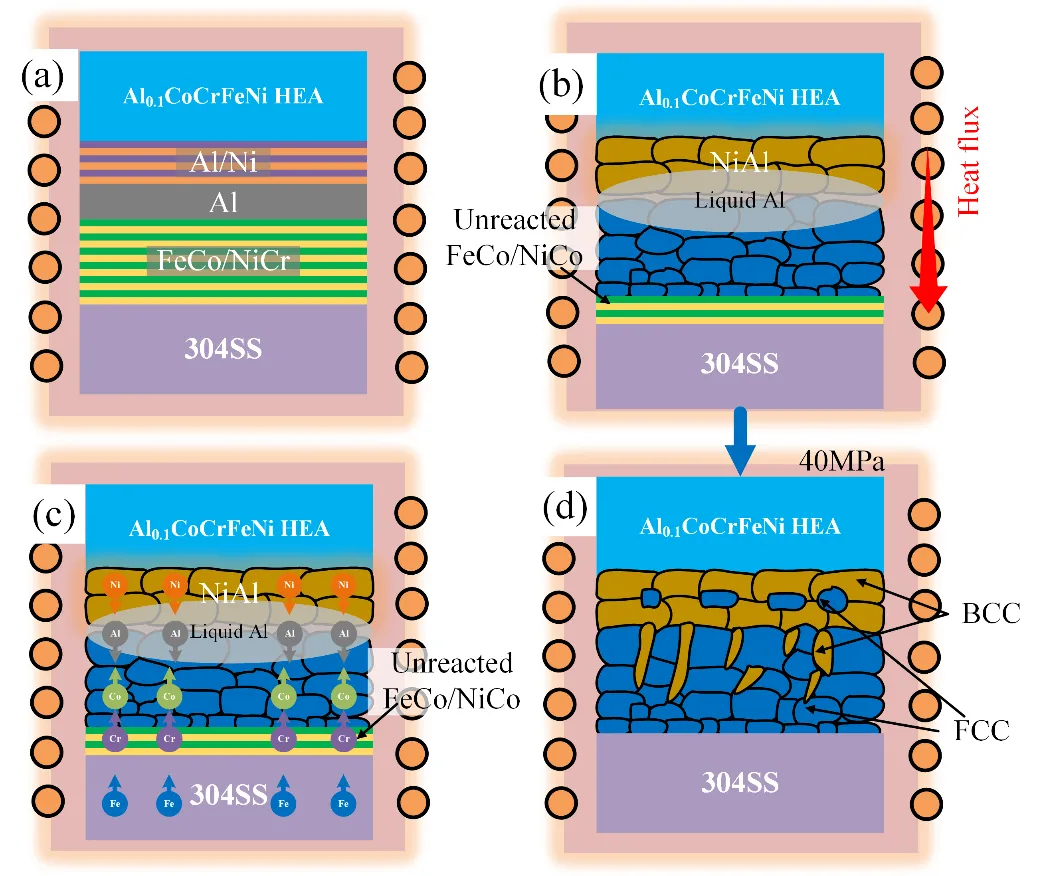
Based on the FEA simulation and phase composition analysis, the brazing and phase formation process of the 304SS/HEAFs/Al/NanoFoil/HEAs joints, as demonstrated in
, can be described as following four stages:
. Microstructural evolution process of the representative joint: (<b>a</b>) assembly at 298 K (<b>b</b>) SHS at 723 K for 25,000 K/s (<b>c</b>) diffusion behavior during brazing, and (<b>d</b>) formation of FCC + BCC dual-phases in the brazing process.
Firstly, the 304SS/HEAFs/Al/NanoFoil/HEAs joint through the filler metal compression molding and plastic deformation at certain temperatures produced good contact, as shown in
a. When the brazing process is performed at a higher temperature, atoms in the BM and high-entropy unit are activated and diffused through the interface into new equilibrium positions.
Secondly, when the brazing temperature exceeds the reaction ignition temperature of the Al/Ni reaction multilayer nano-foil, the surrounding Al filler partially melts. The temperature is further increased to reach the melting point of the Al filler metal, and it's completely melted. Then, the liquid Al began to rapidly wet and spread across the interface between the high-entropy unit and the Ni/Al IMCs, resulting in a small amount of dissolution of the BM, as shown in
b. Meanwhile, Al/Ni reaction multilayer nanofoils released numerous heats, which is conducive to the formation of a disordered solid solution.
Thirdly, the higher brazing temperature and close contact of the interface promoted vigorous reactions during the brazing process. The element interdiffusion between Al/Ni layer, the molten Al foils, NiCr/FeCo layer, and BM happened across the interface. The interfacial diffusion behavior of the atoms was accelerated, and the distribution of elements was more uniform in whole brazed joints, mainly due to the concentration gradient of the interface, as shown in
c.
Finally, the microstructure phase constitution of the brazed joint at 1323 K for 60 min was 304SS + Al-Ni-rich BCC + Co-Cr-Fe-rich FCC dual-phase + minor Al
5Fe
2 IMCs + Al
0.1CoCrFeNi HEAs BM, as shown in
d.
5. Mechanical Properties of the Joint
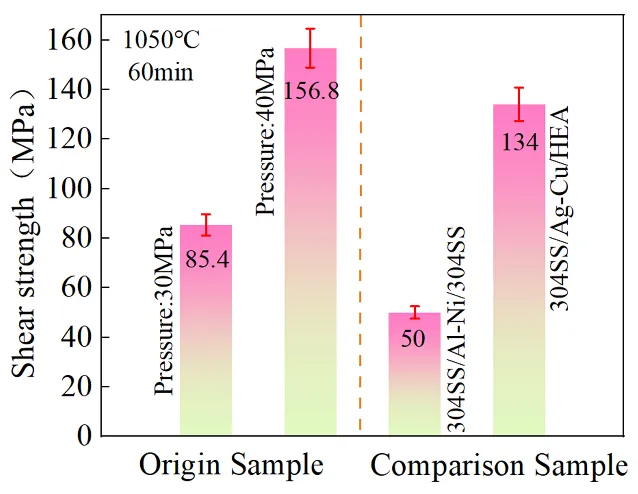
shows the variation in the shear strength of the joints with the brazing pressure. With an increase in brazing pressure, the shear strength of the joints also increased. The maximum shear strength of 156.8 MPa was obtained at a pressure of 40 MPa. The shear strength of this joint is three times that of the brazed Al/Ni nano-reactive 304SS joints (~50 MPa) [
25].
. The shear strength of self-propagating brazed joints.
6. Conclusions
In conclusion, we have successfully developed an environmental brazing process for forming 304SS/HEAs interconnects through Al/Ni self-propagating exothermic reactions. To optimize the design of brazing structure and technological parameters, the formation and subsequent homogenization of 304SS/HEAs joints have been studied to comprehend the mechanism of interfacial evolution and phase formation during brazing.
- (1)
-
The microstructure evolution of brazed joints was first obtained by the COMSOL finite element simulation method, which was consistent with the diffusion dynamics and verified by experiments.
- (2)
-
Both SEM/EBSD analysis and COMSOL FEA simulations validated that the dual-phase solid solution zones were received through a high-entropy design, namely, the buffer layer (that is, a NiCr/FeCo multilayer nano-films (HEAfs layer), and filler layer (that is, Al films) could be employed as a high entropy filler component to join between Al0.1CoCrFeNi HEAs and 304 SS by Ni/Al reaction self-propagating brazing.
- (3)
-
The high-entropy effect could be produced in the brazed joints via the high-entropy design, which could meaningfully restrain the formation of IMCs, and facilitate the formation of a solid solution phase without element segregation. The microstructure phase constitution of the brazed joint was Al-Ni-rich BCC + Co-Cr-Fe-rich FCC dual-phase, which was required for the solid solution formation criterion. The functionality of using reactive multilayer nano-foils as local heating sources and the high shear strengths that appeared here prove the feasibility of novel brazing of HEA in air.
Author Contributions
B.W.: Validation, Visualization, Writing—Original Draft, and Writing—Review & Editing; C.S.: Supervision, Project Administration, and Writing—Review & Editing; W.Y.: Funding Acquisition, Project Administration and Writing—Review & Editing; M.W.: Validation, and Visualization; F.L.: Validation, and Writing—Review & Editing.
Ethics Statement
Not applicable.
Informed Consent Statement
Not applicable.
Data Availability Statement
All data included in this study are available upon request by contact with the corresponding author.
Funding
This work was financially supported by the National Natural Science Foundation of China (Grant No. 5226010024).
Declaration of Interest Statement
The authors declare that they have no known competing financial interests or personal relationships that could have appeared to influence the work reported in this paper.
References
-
1.
Yeh JW, Chen SK, Lin SJ, Gan JY, Chin TS, Shun TT, et al. Nanostructured High-Entropy Alloys with Multiple Principal Elements: Novel Alloy Design Concepts and Outcomes.
Adv. Eng. Mater. 2004,
6, 299–303. doi:10.1002/adem.200300567.
[Google Scholar]
-
2.
Cantor B, Chang ITH, Knight P. Microstructural development in equiatomic multicomponent alloys.
Mater. Sci. Eng. A. 2004,
375–377, 213–218. doi:10.1016/j.msea.2003.10.257.
[Google Scholar]
-
3.
Chen J, Zhou XY, Wang WL, Liu B, Lv Y, Xu D, et al. A review on fundamental of high entropy alloys with promising high-temperature properties.
J. Alloys Compd. 2018,
760, 15–30. doi:10.1016/j.jallcom.2018.05.067.
[Google Scholar]
-
4.
Qin L, Chen W, Jing Z, Zhang L, Chen Q, Liu ZK, et al. On Sluggish Diffusion in Fcc Al–Co–Cr–Fe–Ni High-Entropy Alloys: An Experimental and Numerical Study.
Metals 2017,
8, 16. doi:10.3390/met8010016.
[Google Scholar]
-
5.
Li DY, Zhang Y. The ultrahigh charpy impact toughness of forged AlxCoCrFeNi high entropy alloys at room and cryogenic temperatures.
Intermetallics 2016,
70, 24–28. doi:10.1016/j.intermet.2015.11.002.
[Google Scholar]
-
6.
Yang T, Xia S, Liu S, Wang C, Wang Y. Effects of Al addition on microstructure and mechanical properties of AlxCoCrFeNi High-entropy alloy.
Mater. Sci. Eng. A. 2015,
648, 15–22. doi:10.1016/j.msea.2015.09.034.
[Google Scholar]
-
7.
Shi YZ, Yang B, Xie X, Brechtl J, Dahmen KA, Liaw PK. Corrosion of Al xCoCrFeNi high-entropy alloys: Al-content and potential scan-rate dependent pitting behavior.
Corr. Sci. 2017,
119, 33–45. doi:10.1016/j.corsci.2017.02.019.
[Google Scholar]
-
8.
Li J, Meng X, Wan L, Huang Y. Welding of high entropy alloys: Progresses, challenges and perspectives.
J. Manuf. Process. 2021,
68, 293–331. doi:10.1016/j.jmapro.2021.05.042.
[Google Scholar]
-
9.
Wu Z, David SA, Feng Z, Wu Z, Bei H. Weldability of a high entropy CrMnFeCoNi alloy.
Scr. Mater. 2016,
124, 81–85. doi:10.1016/j.scriptamat.2016.06.046.
[Google Scholar]
-
10.
Lopes JG, Candeias A, Agrawal P, Shen J, Schell N, Mishra RS, et al. Role of TiB2 inoculation particles during welding of a AlCoCrFeNi high entropy alloy.
J. Alloy. Comp. 2024,
995, 174694. doi:10.1016/j.jallcom.2024.174694.
[Google Scholar]
-
11.
Shen JJ, Kim RE, He JJ, Lopes JG, Yang J, Zeng Z, et al. Gas tungsten arc welding of CoCrFeMnNi high entropy alloy to 316 stainless steel.
Mater. Sci. Eng. A. 2025,
922, 147664. doi:10.1016/j.msea.2024.147664.
[Google Scholar]
-
12.
Kashaev N, Ventzke V, Petrov N, Horstmann M, Zherebtsov S, Shaysultanov D, et al. Fatigue behaviour of a laser beam welded CoCrFeNiMn-type high entropy alloy.
Mater. Sci. Eng. A. 2019,
766, 138358. doi:10.1016/j.msea.2019.138358.
[Google Scholar]
-
13.
Sokkalingam R, Sivaprasad K, Duraiselvam M, Muthupandi M, Prashanth KG. Novel welding of Al0.5CoCrFeNi high-entropy alloy: Corrosion behavior.
J. Alloys Compds. 2020,
817, 153163. doi:10.1016/j.jallcom.2019.153163.
[Google Scholar]
-
14.
Lin C, Shiue RK, Wu SK, Huang HL. Infrared Brazing of CoCrFeMnNi Equiatomic High Entropy Alloy Using Nickel-Based Braze Alloys.
Entropy 2019,
21, 283. doi:10.3390/e21030283.
[Google Scholar]
-
15.
Wang G, Sheng GM, Sun JC, Wei Y, Yuan X. Mechanical properties and microstructure evolution of CrMnFeCoNi HEA/304 SS dissimilar brazing joints.
J. Alloys. Compd. 2020,
829, 154520. doi:10.1016/j.jallcom.2020.154520.
[Google Scholar]
-
16.
Wang G, Sheng GM, Yu QL, Sun J, Jiao Y, Zhang Y. Investigation of intergranular penetration behavior in CrMnFeCoNi HEA/304 SS dissimilar brazing joints.
Intermetallics 2020,
126, 106940. doi:10.1016/j.intermet.2020.106940.
[Google Scholar]
-
17.
Li P, Sun HT, Wang S, Xia Y, Zhang H. Diffusion bonding of AlCoCrFeNi
2.1 eutectic high entropy alloy to GH4169 superalloy.
Mater. Sci. Eng. A. 2020,
793, 139843. doi:10.1016/j.msea.2020.139843.
[Google Scholar]
-
18.
Lei Y, Hu SP, Yang TL, Song XG, Luo Y, Wang GD. Vacuum diffusion bonding of high-entropy Al0.85CoCrFeNi alloy to TiAl intermetallic.
J. Mater. Process. Tech. 2020,
278, 116455. doi:10.1016/j.jmatprotec.2019.116455.
[Google Scholar]
-
19.
Bridges D, Zhang SH, Lang S, Gao M, Hu A. Laser brazing of a nickel-based superalloy using a Ni-Mn-Fe-Co-Cu high entropy alloy filler metal.
Mater. Lett. 2018,
215, 11–14. doi:10.1016/j.matlet.2017.12.003.
[Google Scholar]
-
20.
Hu SP, Lei Y, Sun J, Wei FU, Lin D, Song X, et al. Application progress of high-entropy alloys in brazing field: A short review.
J. Adv. Manuf. Sci. Tech. 2022,
2, 2022008. doi:10.51393/j.jamst.2022008.
[Google Scholar]
-
21.
Zhang LX, Shi JM, Li HW, Tian XY, Feng JC. Interfacial microstructure and mechanical properties of ZrB2single bondSiCsingle bondC ceramic and GH99 superalloy joints brazed with a Ti-modified FeCoNiCrCu high-entropy alloy.
Mater. Des. 2016,
97, 230–238. doi:10.1016/j.matdes.2016.02.05.
[Google Scholar]
-
22.
Tillmann W, Ulitzka T, Wojarski L, Manka M, Ulitzka H, Wagstyl D. Development of high entropy alloys for brazing applications.
Weld. World. 2020,
64, 201–208. doi:10.1007/s40194-019-00824-y.
[Google Scholar]
-
23.
Li HX, Shen WJ, Chen WJ, Wang W, Liu G, Lu C, et al. Microstructural evolution and mechanical properties of AlCoCrFeNi high-entropy alloy joints brazed using a novel Ni-based filler.
J. Alloys. Compd. 2021,
860, 157926. doi:10.1016/j.jallcom.2020.157926.
[Google Scholar]
-
24.
Kremer MP, Roshanghias A, Tortschanoff A. Self-propagating reactive Al/Ni nanocomposites for bonding applications
. Micro. Nano. Lett. 2017,
5, 1–5. doi:10.1186/s40486-017-0046-x.
[Google Scholar]
-
25.
Wang J, Besnoin E, Duckham A, Spey SJ, Reiss ME, Knio OM, et al. Joining of stainless-steel specimens with nanostructured Al/Ni foils
. J. Appl. Phys. 2004,
95, 248–256. doi:10.1063/1.1629390.
[Google Scholar]
-
26.
Fiedler T, Belova IV, Broxtermann S, Murch GE. A thermal analysis on self-propagating high temperature synthesis in joining technology.
Comput. Mater. Sci. 2012,
53, 251–257. doi:10.1016/j.commatsci.2011.08.015.
[Google Scholar]
-
27.
Motiei L, Yao Y, Choudhury J, Yan H, Marks TJ, Boom ME, et al. Self-propagating molecular assemblies as interlayers for efficient inverted bulk-heterojunction solar cells.
J. Am. Chem. Soc. 2010,
132, 12528–12530. doi:10.1021/ja104695p.
[Google Scholar]
-
28.
Wang Y, Liu ZK, Chen LQ. Thermodynamic properties of Al, Ni, NiAl, and Ni3Al from first-principles calculations.
Acta. Mater. 2004,
52, 2665–2671. doi:10.1016/j.actamat.2004.02.014.
[Google Scholar]
-
29.
Wang J, Besnoin E, Knio OM, Weihs TP. Effects of physical properties of components on reactive nanolayer joining.
J. Appl. Phys. 2005,
97, 1262. doi:10.1063/1.1915540.
[Google Scholar]
-
30.
Wang A, Ramirez MO, Caplovicova M, Vretenar V, Boettcher J, Hopfeld M, et al. Formation of CuCrCoFeNiO high entropy alloy thin films by rapid thermal processing of Cu/CrNiO/FeCo multilayers.
Surf. Coat. Technol. 2021,
405, 126563. doi:10.1016/j.surfcoat.2020.126563.
[Google Scholar]
-
31.
Wang A, Gallino I, Riegler SS, Lin YT, Isaac NA, Camposano YHS, et al. Ultrafast formation of single phase B2 AlCoCrFeNi high entropy alloy films by reactive Ni/Al multilayers as heat source.
Mater. Des. 2021,
206, 109790. doi:10.1016/j.matdes.2021.109790.
[Google Scholar]
-
32.
Fujita H, Gosting LJ. An exact solution of the equations for free diffusion in three-component systems with interacting flows, and its use in evaluation of the diffusion coefficients.
J. Am. Chem. Soc. 1956,
78, 1099–1106. doi:10.1021/ja01587a006.
[Google Scholar]
-
33.
Kirkaldy JS. Diffusion in multicomponent metallic systems: I. Phenomenological theory for substitutional solid solution alloys.
Can. J. Phys. 1958,
36, 899–906. doi:10.1139/p58-096.
[Google Scholar]
-
34.
Aayananda DM. Diffusion in multicomponent alloys: challenges and problems Defect and Diffusion Forum.
Trans. Tech. 1992,
83, 73–86. doi:10.4028/www.scientific.net/DDF.83.73.
[Google Scholar]
-
35.
Darken LS. Diffusion of carbon in austenite with a discontinuity in composition.
Trans. AIME. 1949,
180, 430–438.
[Google Scholar]
-
36.
Sauer F, Freise Z. Diffusion in Binary Mixtures Showing a Volume Change.
Z. Elektrochem 1962,
66, 353–363. doi:10.1002/bbpc.19620660412.
[Google Scholar]
-
37.
Den Broeder FJA. A general simplification and improvement of the matano-boltzmann method in the determination of the interdiffusion coefficients in binary systems.
Scri. Metal. 1969,
3, 321–325. doi:10.1016/0036-9748(69)90296-8.
[Google Scholar]
-
38.
Dąbrowa J, Kucza W, Cieślak G, Kulik T, Danielewski M, Yeh JW, et al. Interdiffusion in the FCC-structured Al-Co-Cr-Fe-Ni high entropy alloys: experimental studies and numerical simulations.
J. Alloys Compd. 2016,
674, 455–462. doi:10.1016/j.jallcom.2016.03.046.
[Google Scholar]
-
39.
Rothman SJ, Nowicki LJ, Murch GE. Self-diffusion in austenitic Fe-Cr-Ni alloys.
J. Phys. F Met. Phys. 1980,
10, 383. doi:10.1088/0305-4608/10/3/009.
[Google Scholar]
-
40.
Muthukumar K, Durairaj RB, Mageshwaran G, Jayajeevahan J, Naidu V. Optimization of Transient State Temperature Distribution Analysis on Diffusion-Bonded Joints of Ti-6Al-4V With SS304L Stainless Steel Alloy.
Adv. Manuf. 2019,
1211, 473–483. doi:10.1007/978-981-13-6374-0_53.
[Google Scholar]
-
41.
Tsai KY, Tsai MH, Yeh JW. Sluggish diffusion in Co-Cr-Fe-Mn-Ni high-entropy alloys
. Acta. Mater. 2013,
61, 4887–4897. doi:10.1016/j.actamat.2013.04.058.
[Google Scholar]
-
42.
Iijima Y, Lee CG. Self-diffusion in BCC and ordered phases of an equiatomic iron-cobalt alloy.
Acta. Metal. 1995,
43, 1183–1188. doi:10.1016/0956-7151(94)00331-B.
[Google Scholar]
-
43.
Wu K, Chang YA, Wang Y. Simulating interdiffusion microstructures in Ni-Al-Cr diffusion couples: A phase field approach coupled with CALPHAD database.
Scr. Mater. 2004,
50, 1145–1150. doi:10.1016/j.scriptamat.2004.01.025.
[Google Scholar]
-
44.
Mendelev MI, Rodin AO, Bokstein BS. Computer Simulation of Fe Diffusion in Liquid Al and along Al Grain Boundaries.
Trans. Tech. Public. 2011,
309, 223–230. doi:10.4028/www.scientific.net/DDF.309-310.223.
[Google Scholar]
-
45.
Song YQ, Li SC, Yang ZL. Diffusion dissolution layer at Al/Co phase interface.
Trans. China Weld. 2008,
29, 5.
[Google Scholar]
-
46.
Wei H, Jin T, Sun XF. Characterization of chemical mutual diffusion coefficients of NiAl phases
. Trans. China Corros. Prot. 2012,
32, 173–182.
[Google Scholar]
-
47.
Minamino Y, Jung SB, Yamane T, Hirao K. Diffusion of cobalt, chromium, and titanium in Ni3Al.
Metal. Trans. A 1992,
23, 2783–2790. doi:10.1007/BF02651757.
[Google Scholar]
-
48.
Darken LS. Diffusion, Mobility and Their Interrelation through Free Energy in Binary Metallic Systems.
T. Metall. Soc. AIME 1948,
174, 184.
[Google Scholar]
-
49.
Holly K, Danielewski M. Interdiffusion and free-boundary problem for r-component (r ≥ 2) one-dimensional mixtures showing constant concentration.
Phys. Rev. B 1994,
50, 13336. doi:10.1103/PhysRevB.50.13336.
[Google Scholar]
-
50.
Smigelskas AD. Zinc diffusion in alpha brass
. Trans. Aime 1947,
171, 130–142.
[Google Scholar]
-
51.
Manning JR. Cross terms in the thermodynamic diffusion equations for multicomponent alloys.
Metal. Mater. Trans. B 1970,
1, 499–505. doi:10.1007/BF02811561.
[Google Scholar]
-
52.
Manning JR. Correlation factors for diffusion in nondilute alloys.
Phys. Rev. B 1971,
4, 1111. doi:10.1103/PhysRevB.4.1111.
[Google Scholar]
-
53.
Wang J, Li Y, Huang W. Interface microstructure and diffusion kinetics in diffusion bonded Mg/Al joint.
React. Kinet. Catal. Lett. 2008,
95, 71–79. doi:10.1007/s11144-008-5259-9.
[Google Scholar]
-
54.
Fang S, Xiao X, Xia L, Li W, Dong Y. Relationship between the widths of supercooled liquid regions and bond parameters of Mg-based bulk metallic glasses.
J. Non-Cryst. Solids. 2003,
321, 120–125. doi:10.1016/S0022-3093(03)00155-8.
[Google Scholar]
-
55.
Guo S, Ng C, Lu J, Liu C. Effect of valence electron concentration on stability of fcc or bcc phase in high entropy alloys.
J. Appl. Phys. 2011,
109, 103505. doi:10.1063/1.3587228.
[Google Scholar]
-
56.
Massalski TB. Comments concerning some features of phase diagrams and phase transformations.
Mater. Trans. 2010,
51, 583–596. doi:10.2320/matertrans.M2010012.
[Google Scholar]
-
57.
Yang X, Zhang Y. Prediction of high-entropy stabilized solid solution in multi-component alloys.
Mater. Chem. Phys. 2012,
132, 233–238. doi:10.1016/j.matchemphys.2011.11.021.
[Google Scholar]
-
58.
Takeuchi A, Inoue A. Classification of bulk metallic glasses by atomic size difference, heat of mixing and period of constituent elements and its application to characterization of the main alloying element.
Mater. Trans. 2005,
46, 2817–2829. doi:10.2320/matertrans.46.2817.
[Google Scholar]
-
59.
Egami T, Waseda Y. Atomic size effect on the formability of metallic glasses.
J. Non-Cryst. Solids. 1984,
64, 113–134. doi:10.1016/0022-3093(84)90210-2.
[Google Scholar]
-
60.
Zhang Y, Zhou Y, Lin J, Chen GL, Liaw PK. Solid-solution phase formation rules for multi-component alloys.
Adv. Eng. Mater. 2008,
10, 534–538. doi:10.1002/adem.200700240.
[Google Scholar]